Modelling the drivers of the spread of Plasmodium falciparum hrp2 gene deletions in sub-Saharan Africa
- Imperial College London, United Kingdom
- University of North Carolina, United States
- Université de Kinshasa, Democratic Republic of the Congo
Figures
Figure 1 with 5 supplements
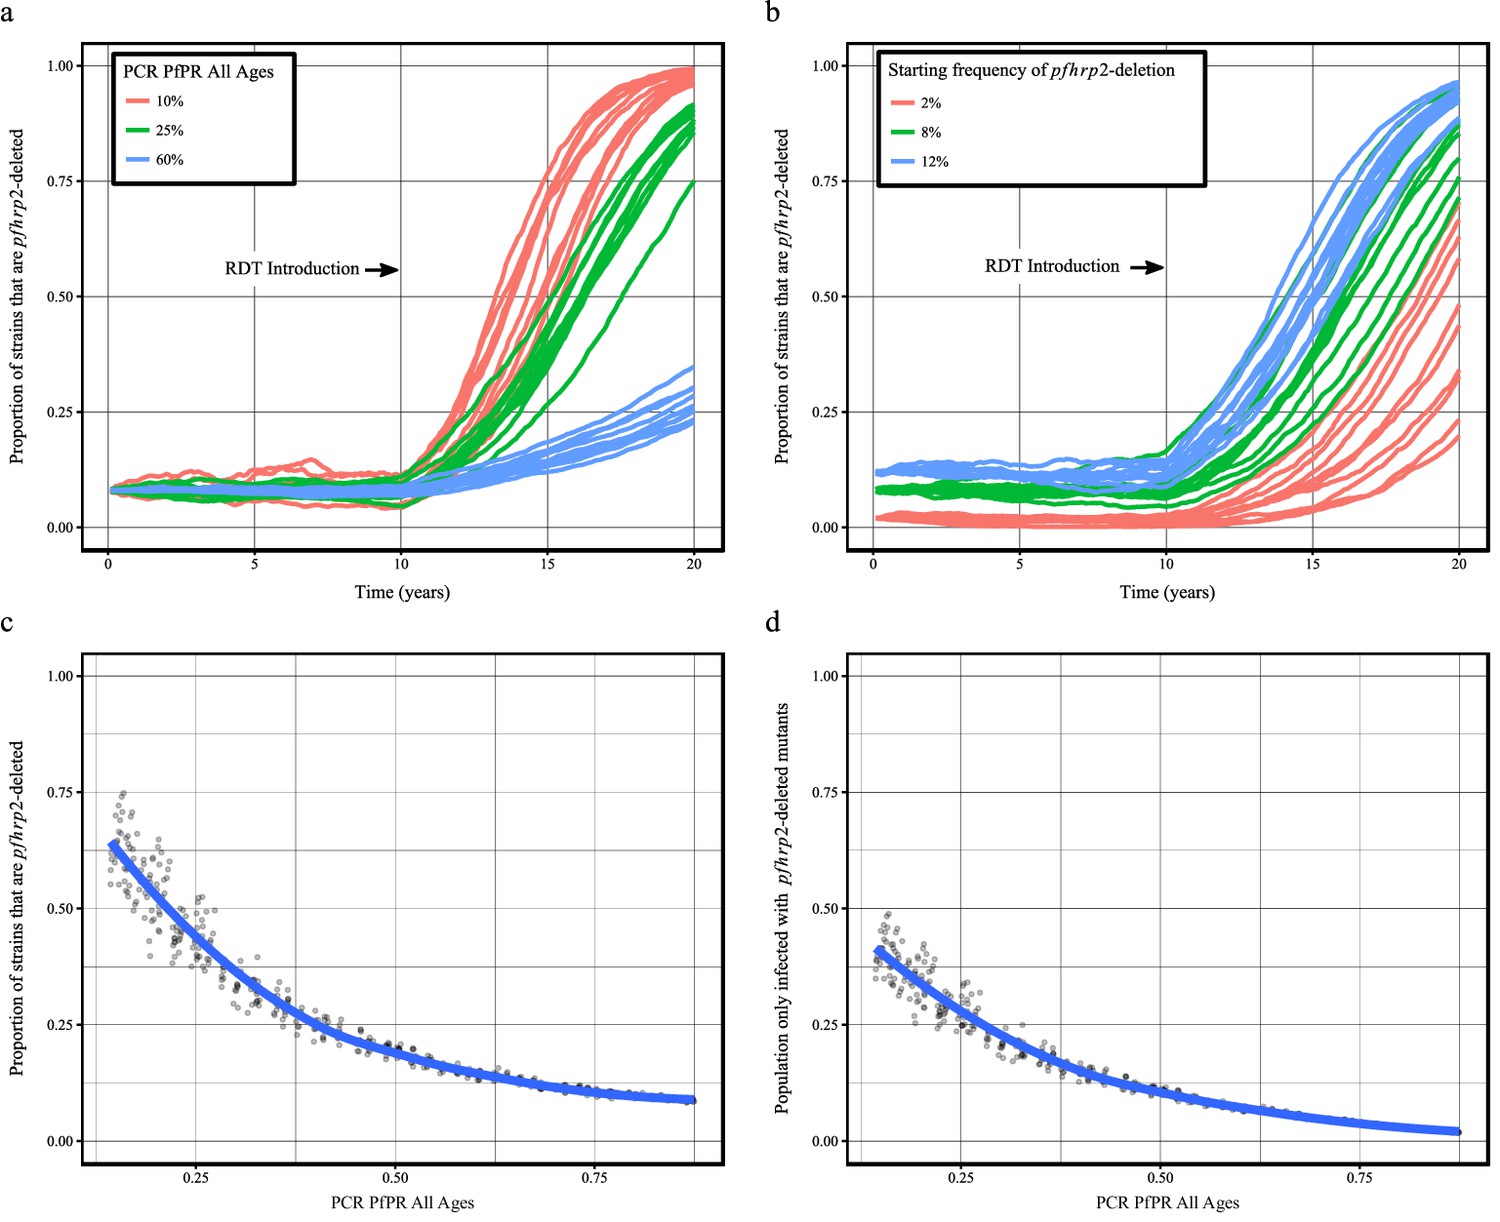
Predicted increase in pfhrp2-deletion upon RDT introduction after 10 years.
Graphs show the time course of pfhrp2-deletion emergence under (a) different transmission intensities (10%, 25% and 60% PfPR) and 8% starting frequency of pfhrp2-deletion prior to RDT introduction and under (b) different assumed starting frequencies of pfhrp2-deletion prior to RDT introduction (2%, 8% and 12% starting frequency) and 25% PfPR. Five years after RDT introduction, the proportion of strains that are pfhrp2-deleted (c), and the proportion of the population that are infected with only pfhrp2-deleted mutants (d) is recorded. The dark grey dots denote individual simulation runs with a LOESS regression fit shown in blue. Source data for Figure 1 is provided within Figure 1—source data 1.
-
Figure 1—source data 1
Effect of transmission intensity and pfhrp2-deletion starting upon pfhrp2-deletion emergence.
- https://doi.org/10.7554/eLife.25008.010
Figure 1—figure supplement 1
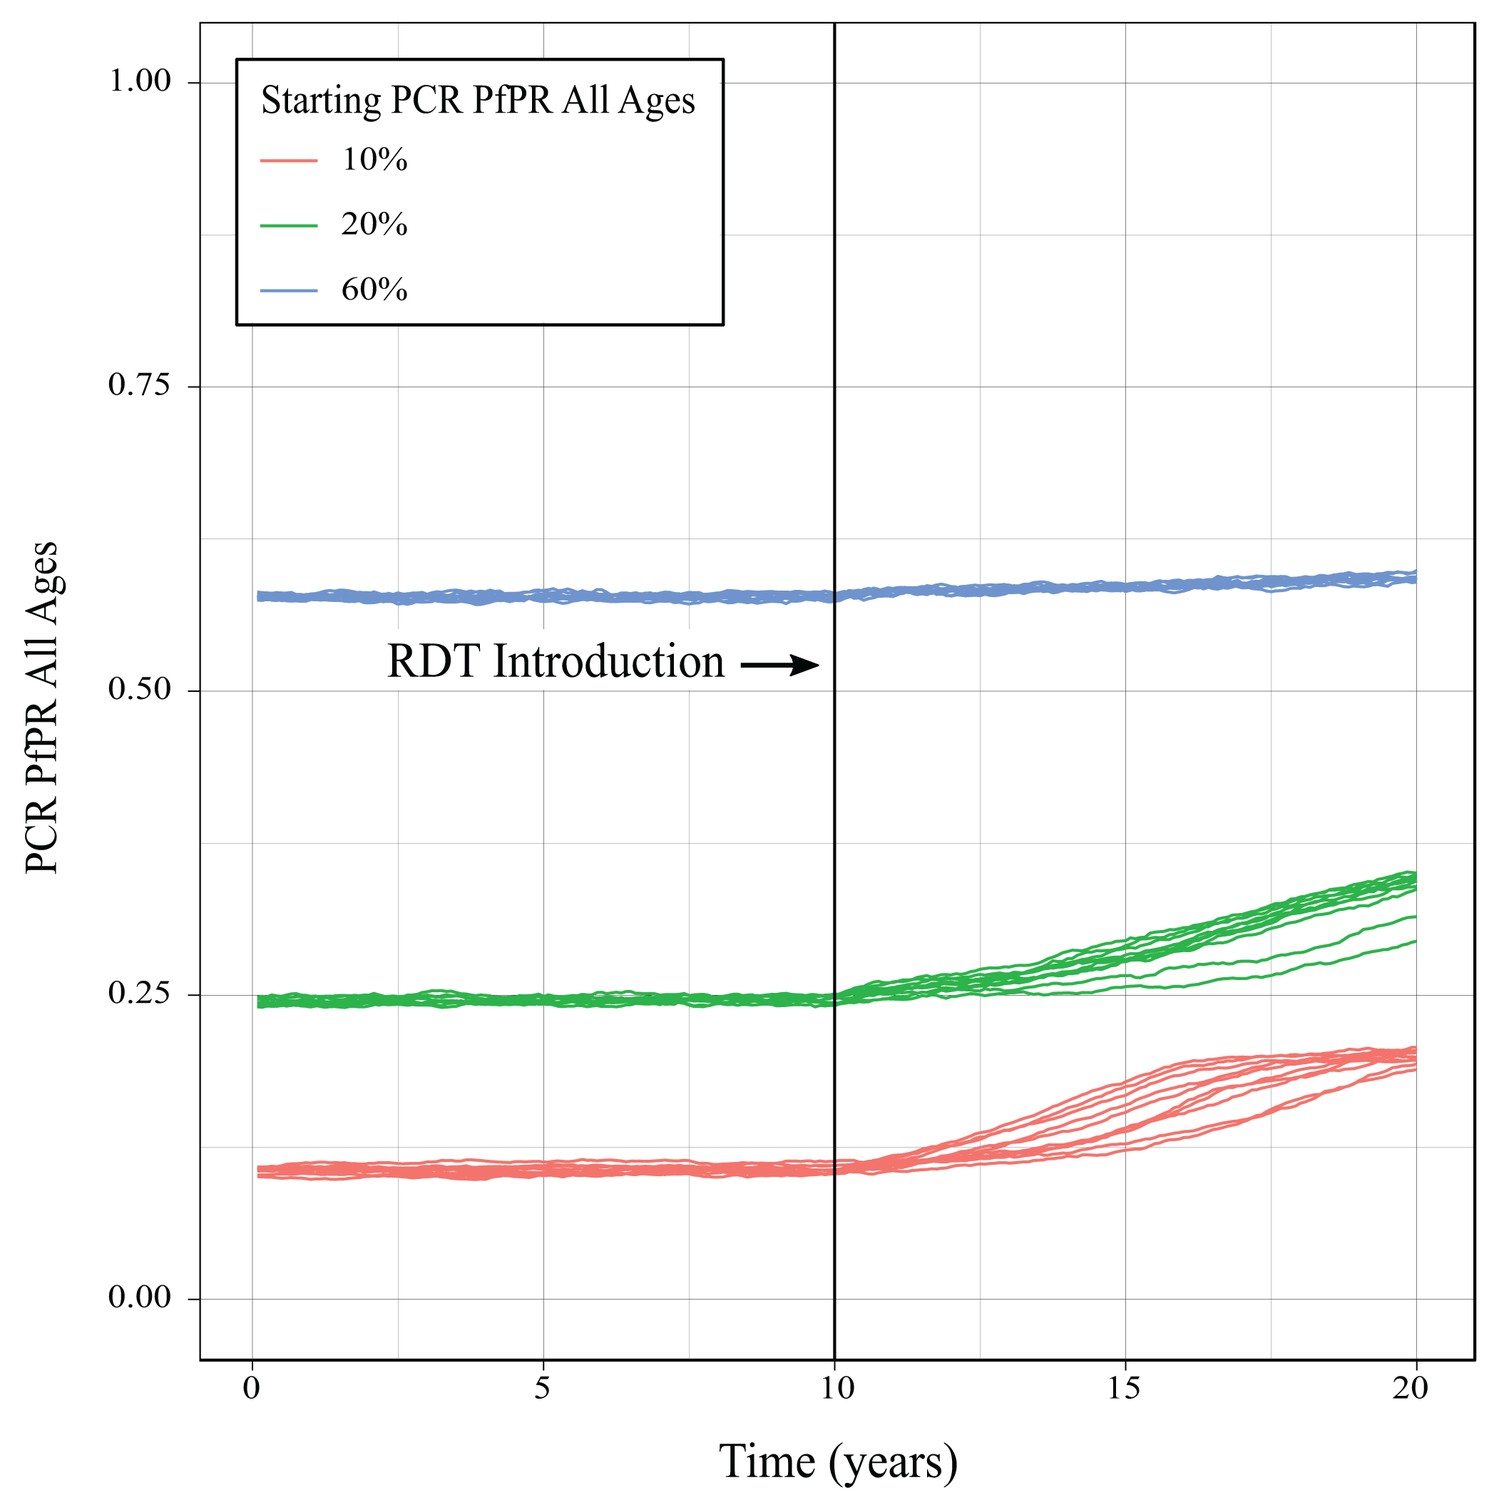
Impact of increase pfhrp2-deletion upon malaria prevalence.
Graphs show the increase in malaria prevalence over time as a result of increasing pfhrp2-deletion upon using only HRP2-based RDTs to guide treatment decisions, with the greatest increase in prevalence observed at the lowest starting prevalence.
Figure 1—figure supplement 2
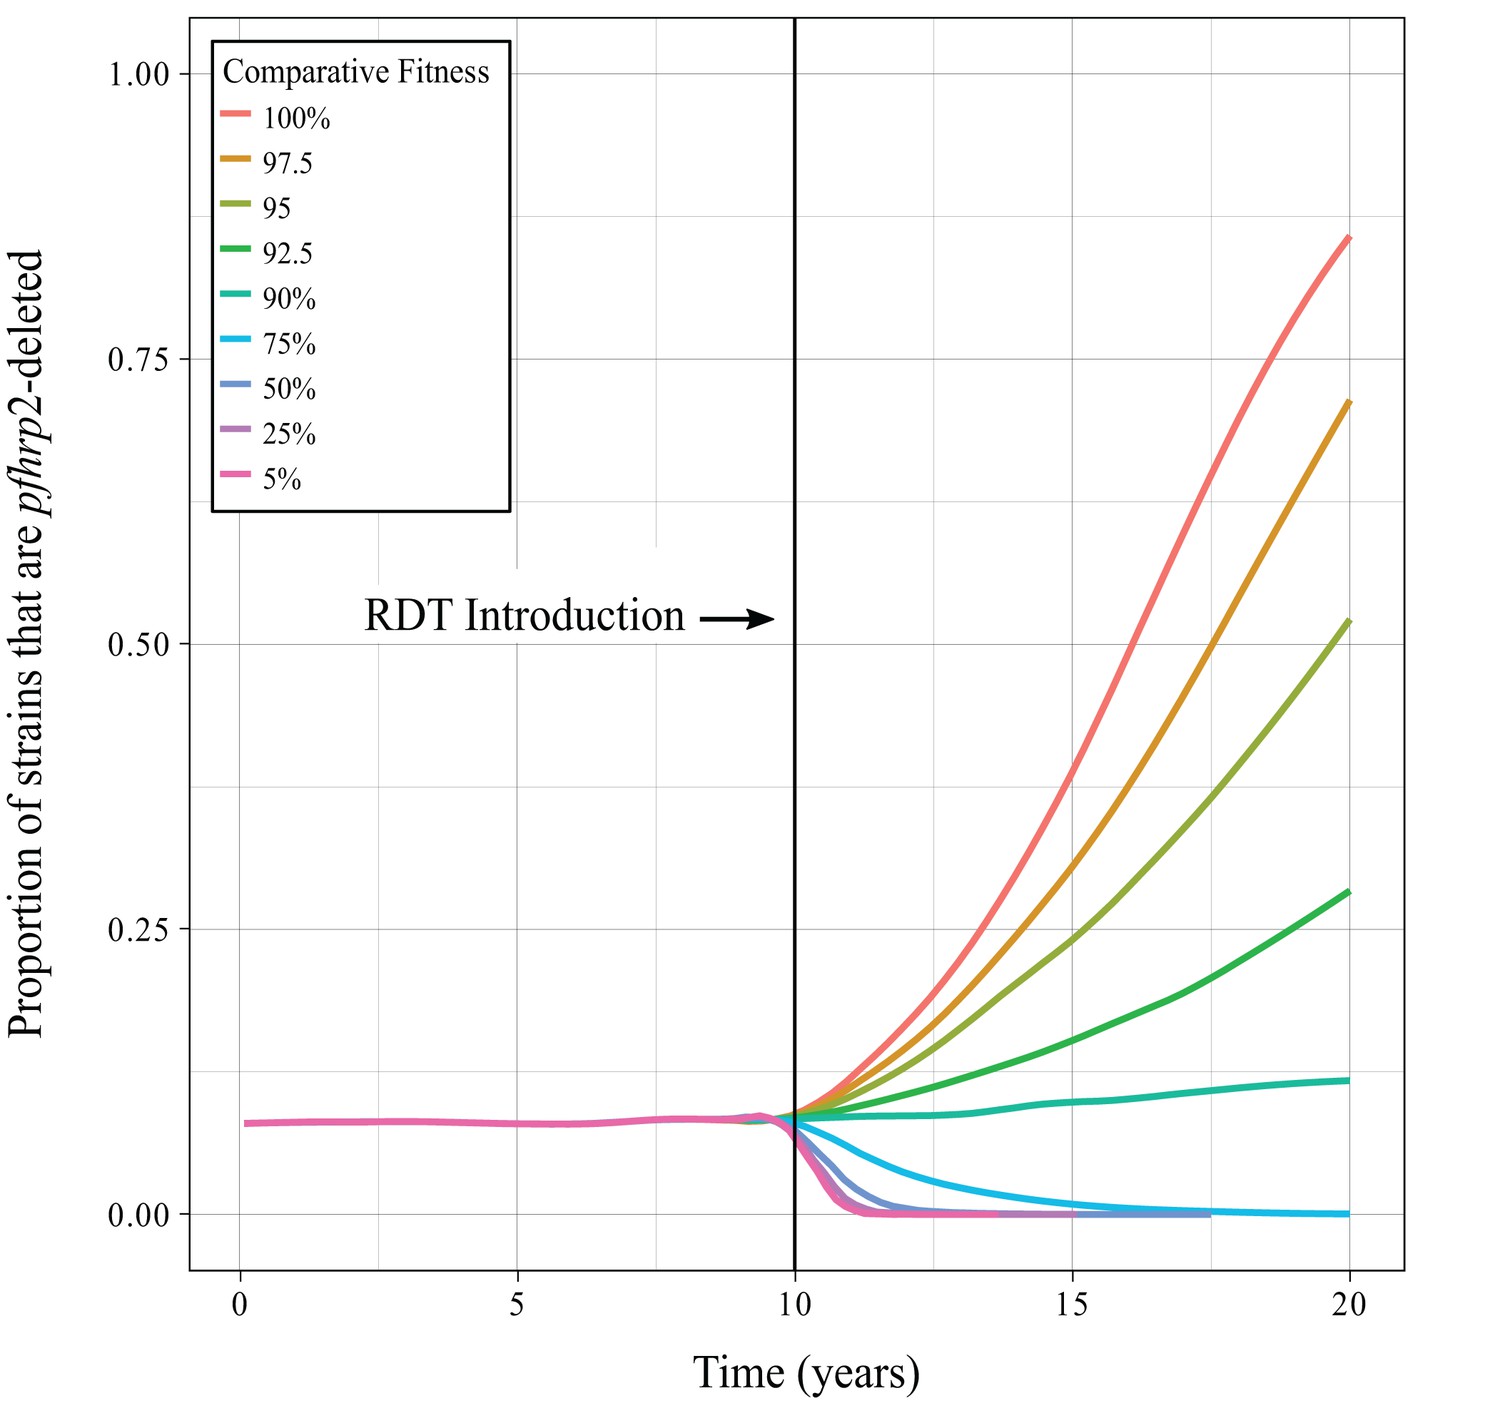
Impact of pfhrp2-deletion fitness cost.
Graphs show the mean time course of pfhrp2-deletion emergence under different assumptions concerning the negative impact of pfhrp2-deletion. The fitness cost is incorporated by comparatively reducing the contribution to the human infectious reservoir made by the deletion strains in order to represent an assumed decrease in parasitaemia. The fitness cost is only implemented at the time of RDT introduction to illustrate the sum effect of the opposing selection pressures.
Figure 1—figure supplement 3
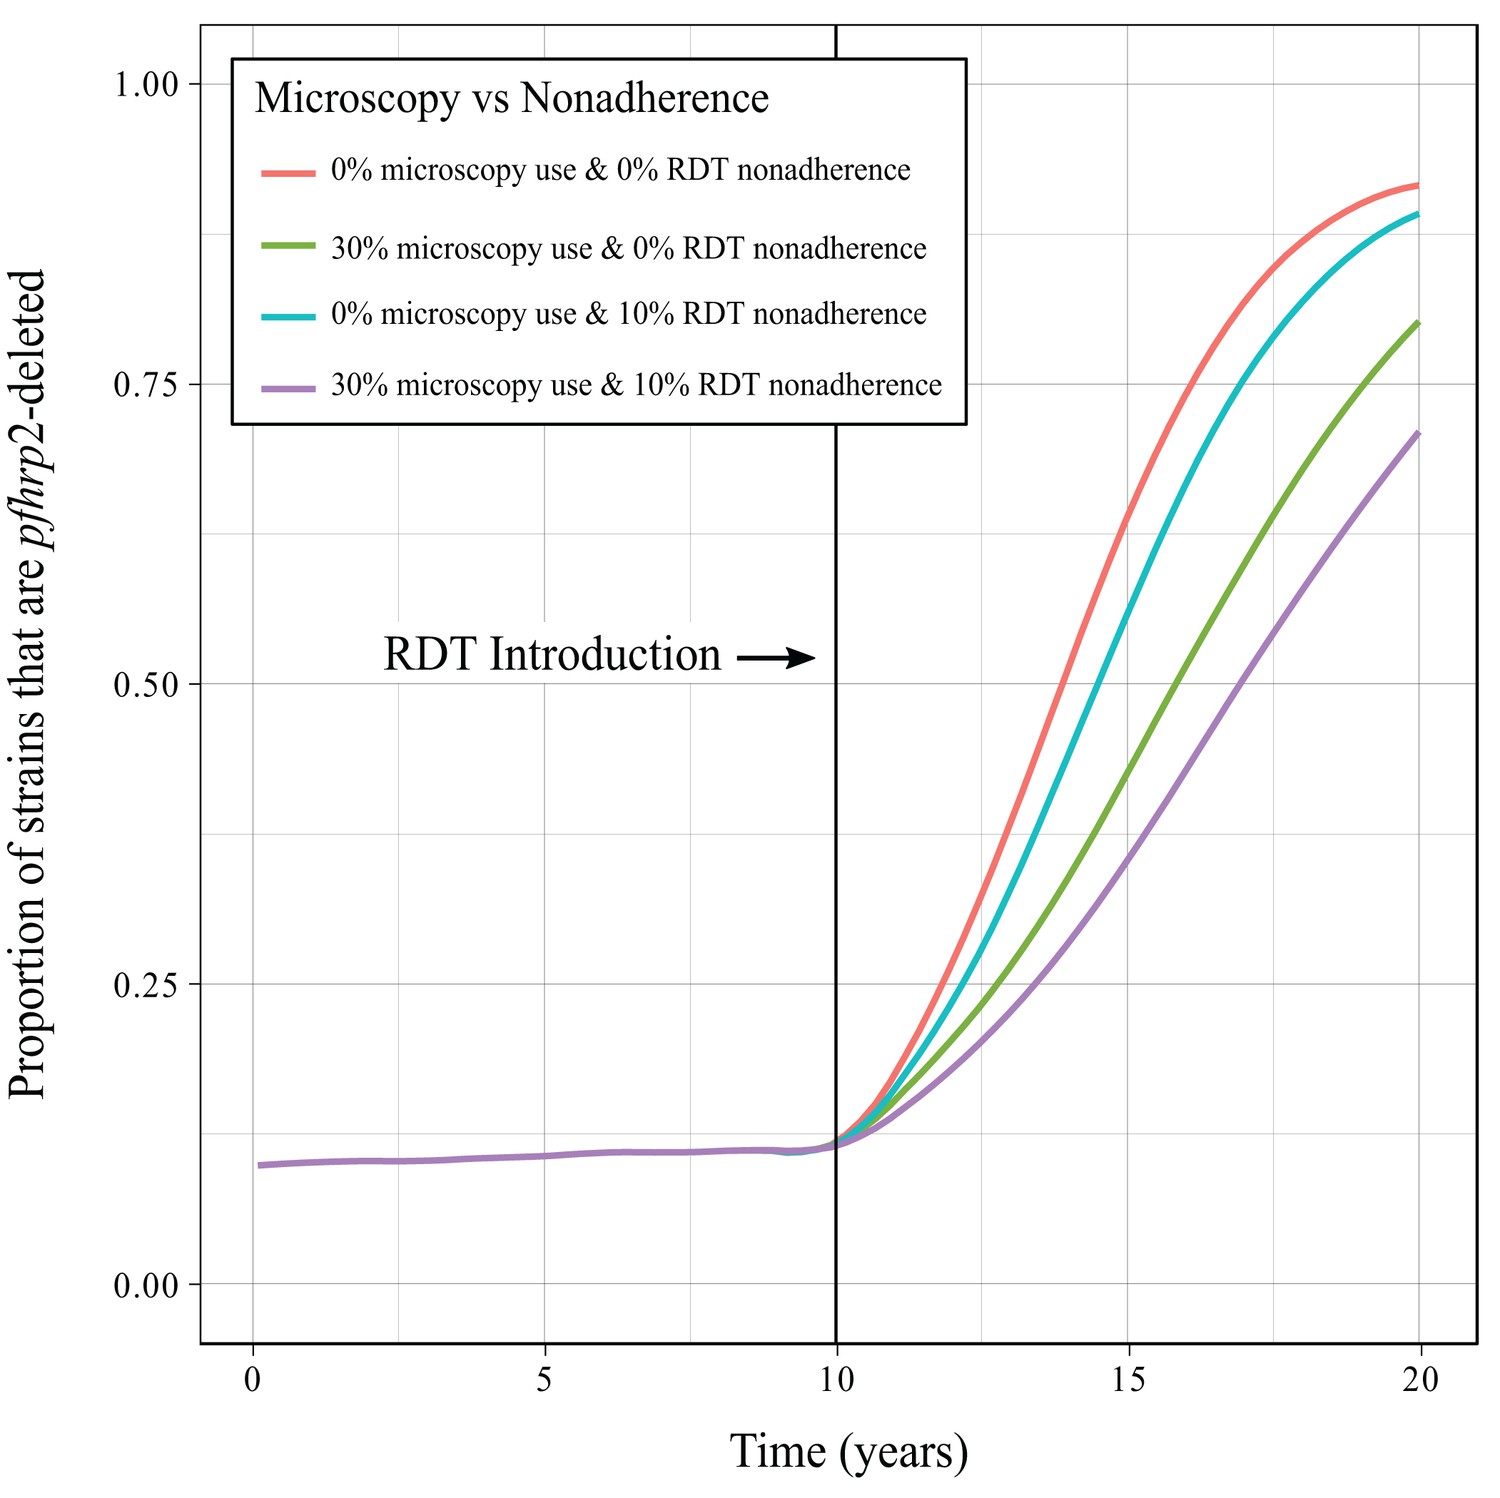
Impact of microscopy use and non-adherence to RDT results.
Graphs show the mean time course of pfhrp2-deletion emergence under different assumptions concerning the use of microscopy as an additional diagnostic and the impact of non-adherence to RDT test results, that is an individual receiving treatment despite yielding a negative RDT result. Microscopy use and nonadherence to RDT results are only implemented at the time of RDT introduction to illustrate the sum effect of the opposing selection pressures.
Figure 1—figure supplement 4
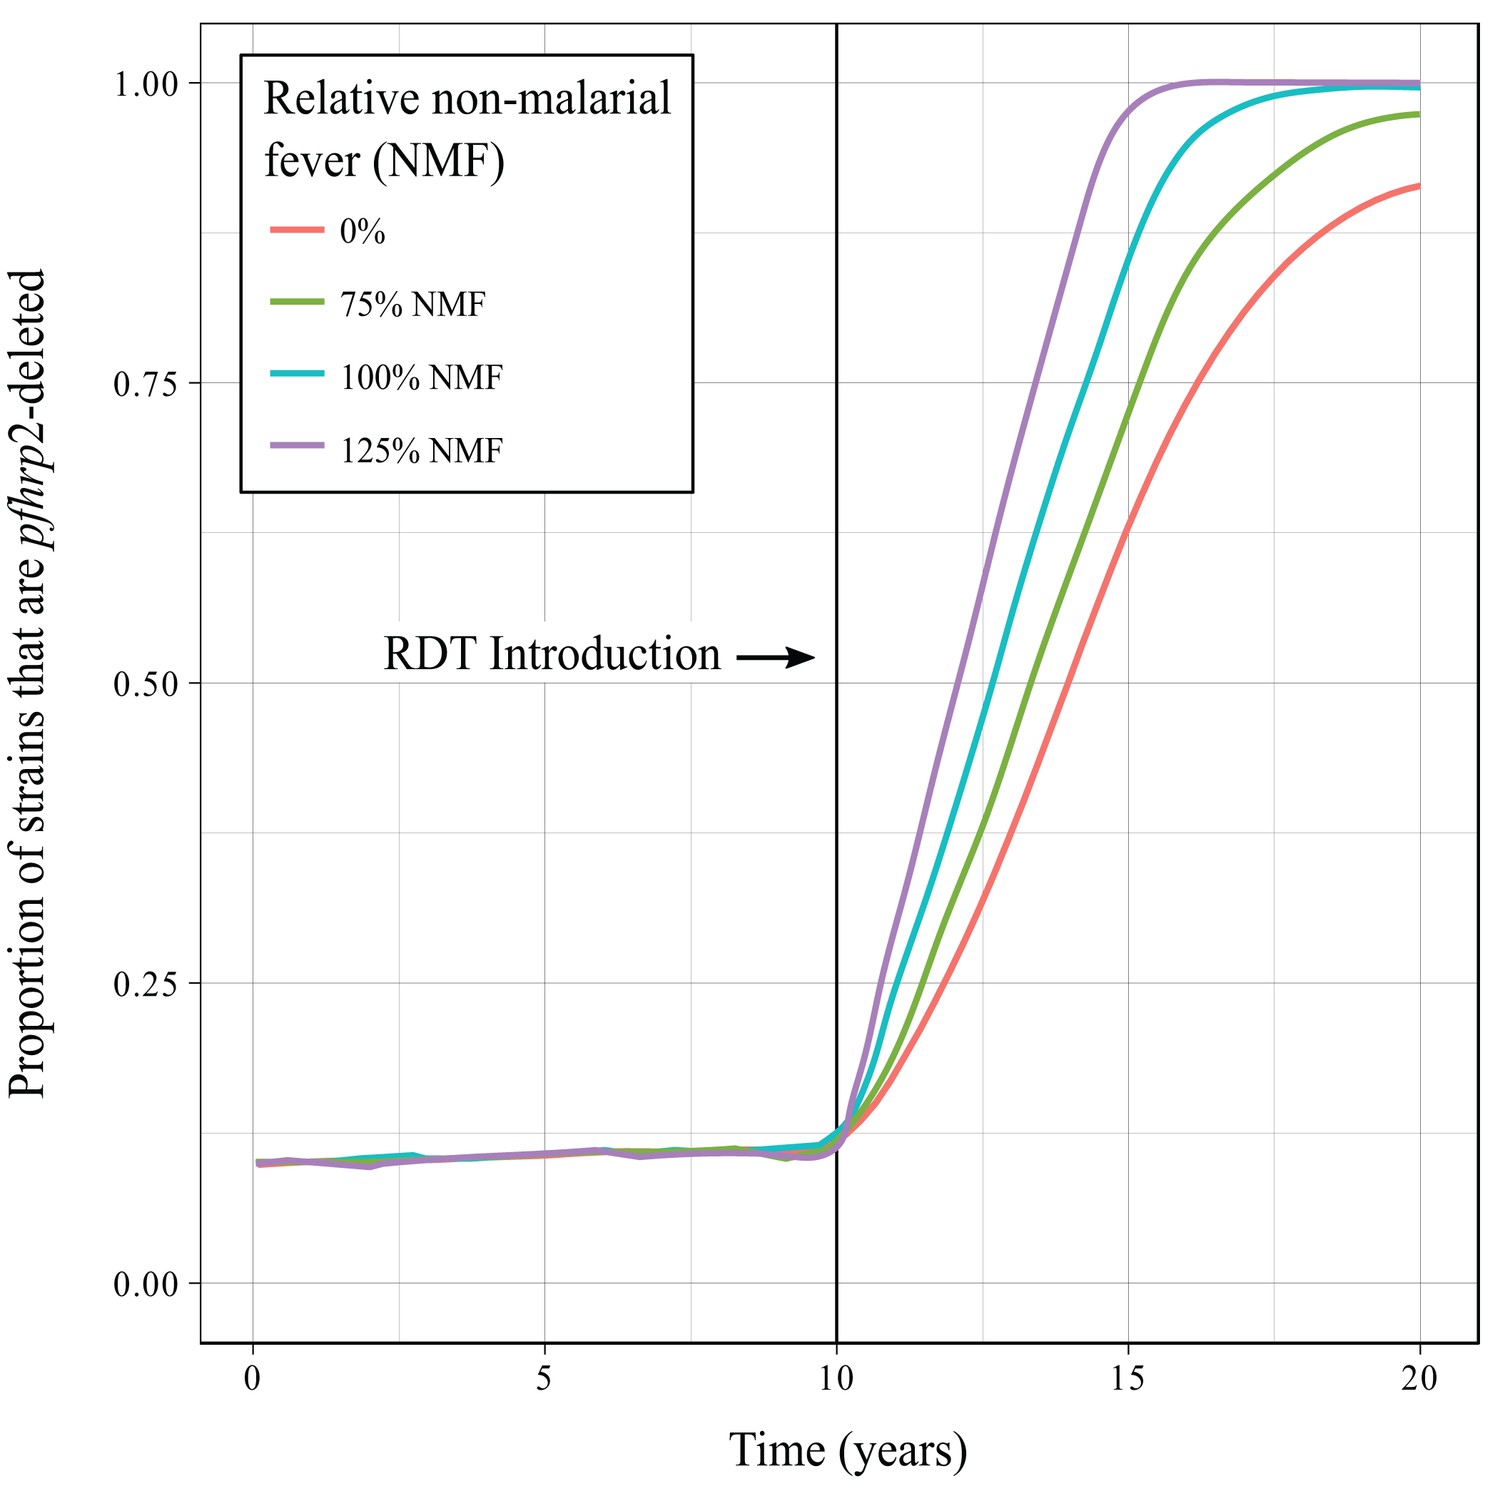
Impact of non-malarial fever.
Graphs show the mean time course of pfhrp2-deletion emergence under different assumptions concerning the rate of non-malarial fever (NMF). The introduction of non-malarial fevers increases the selection pressure in favour of pfhrp2-deletion, with 125% the observed rate of non-malarial fever yielding the quickest emergence of pfhrp2-deletion. Non-malarial fever is only implemented at the time of RDT introduction to illustrate the sum effect of the opposing selection pressures.
Figure 1—figure supplement 5
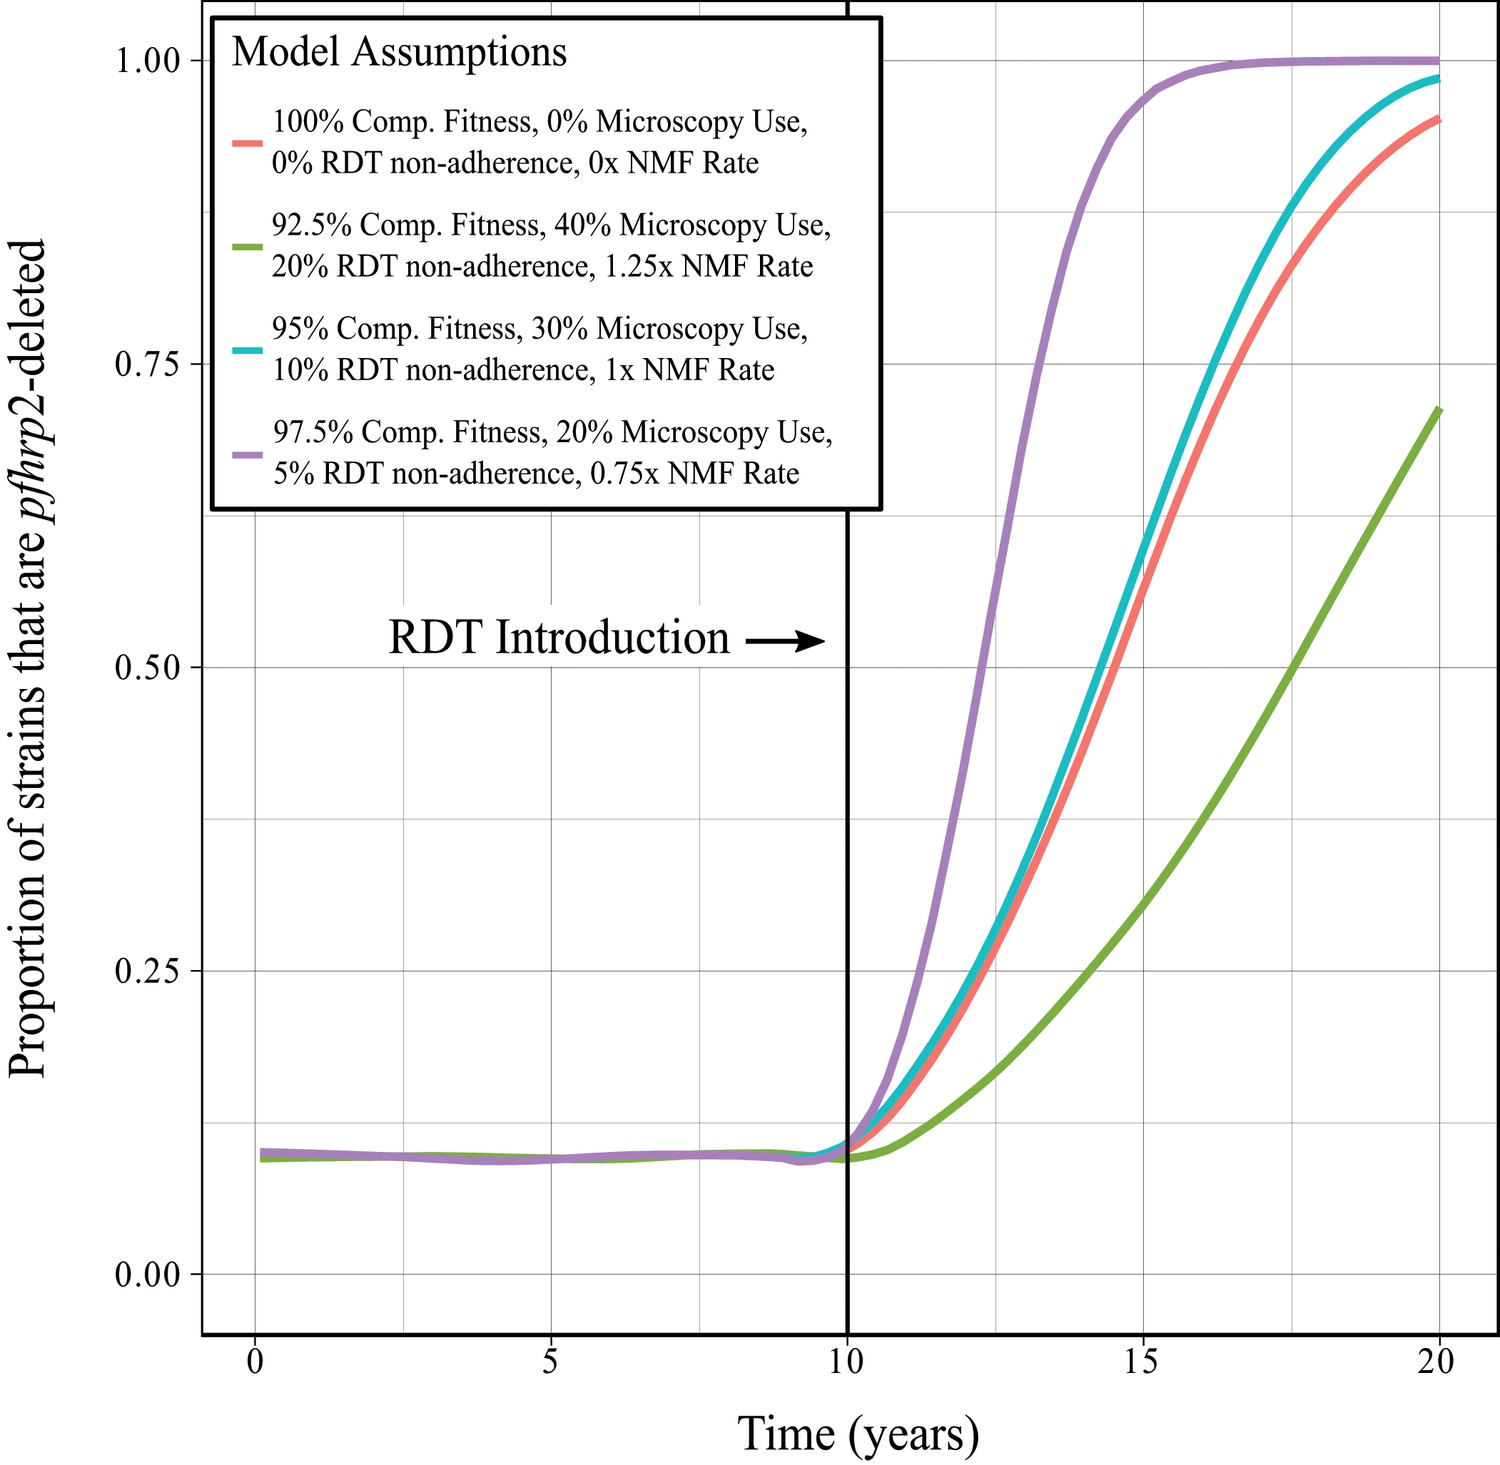
Combined impact of model assumptions.
Graphs show the mean time course of pfhrp2-deletion emergence under different assumptions concerning any negative fitness cost associated with pfhrp2-deletion, use of microscopy-based diagnosis, non-adherence to RDT results and non-malarial fever (NMF). These factors were explored at three different relative rates and compared to the method used within the main investigation (red line). An increase in pfhrp2-deletion is observed in all cases, with the method used within the main investigation exhibiting an increase in pfhrp2-deletion slightly slower than exhibited by the intermediate level of model assumptions (blue line).
Figure 2 with 1 supplement
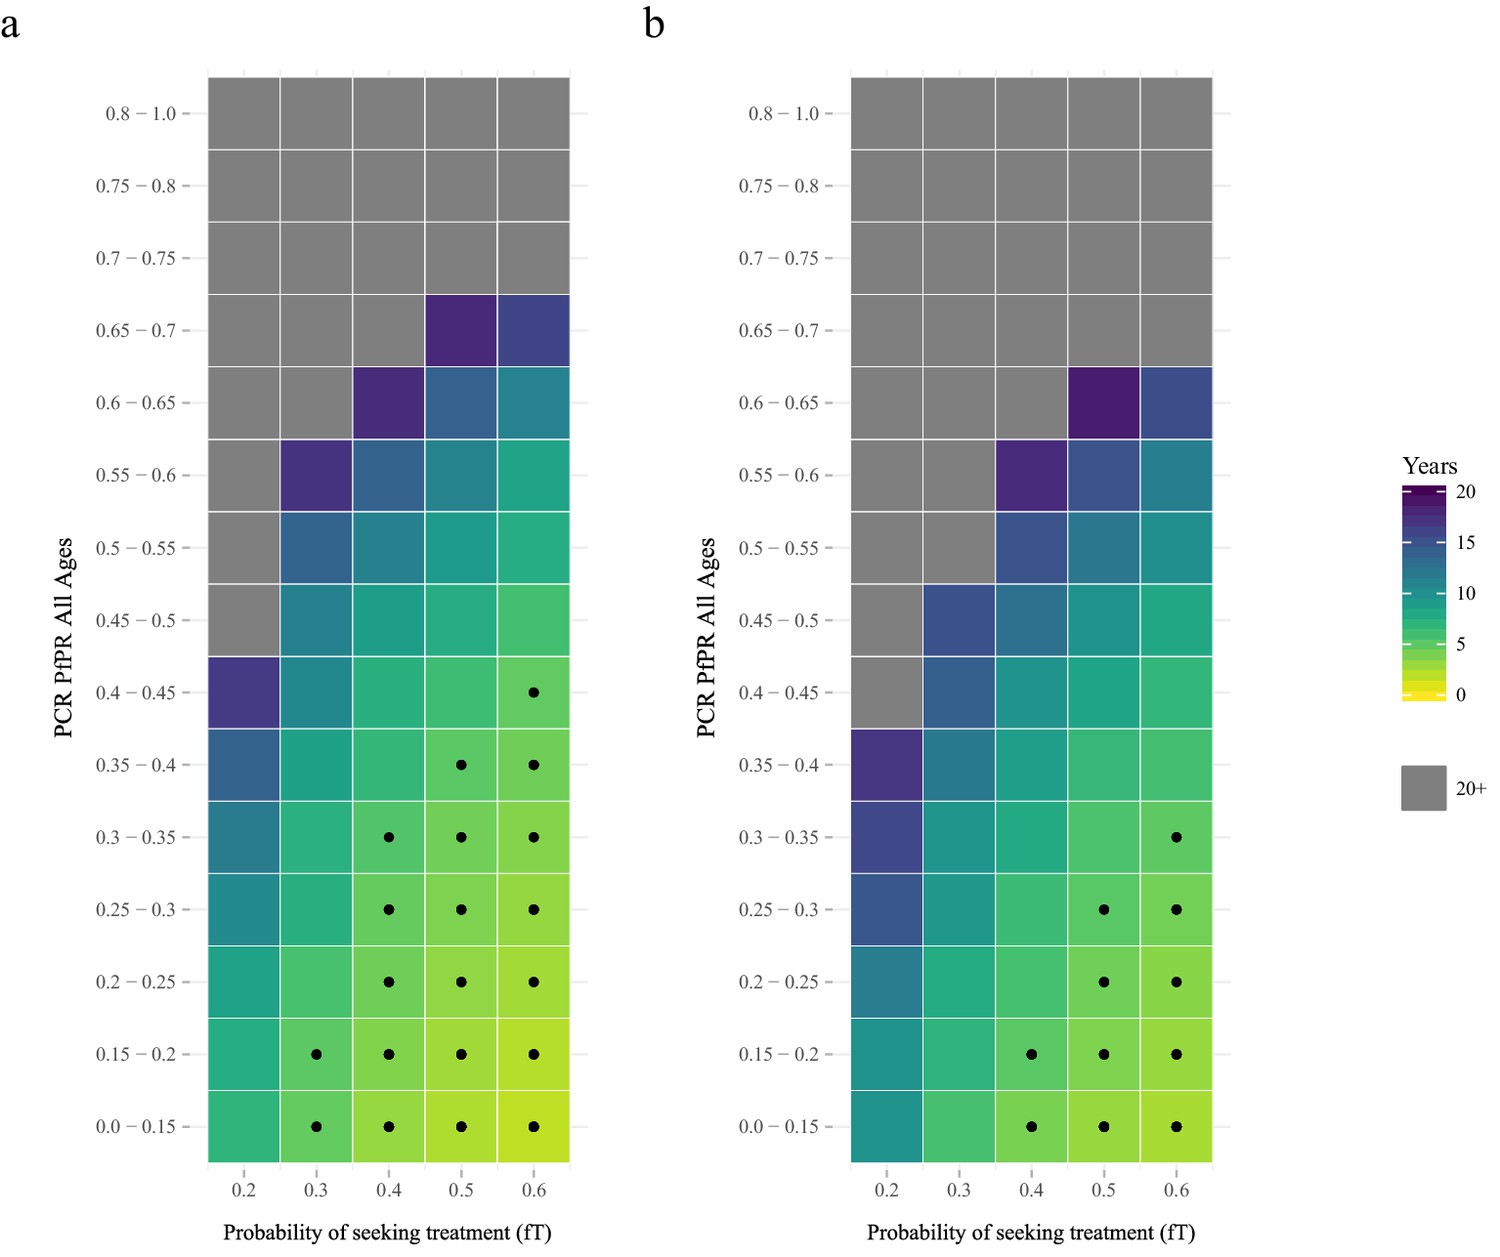
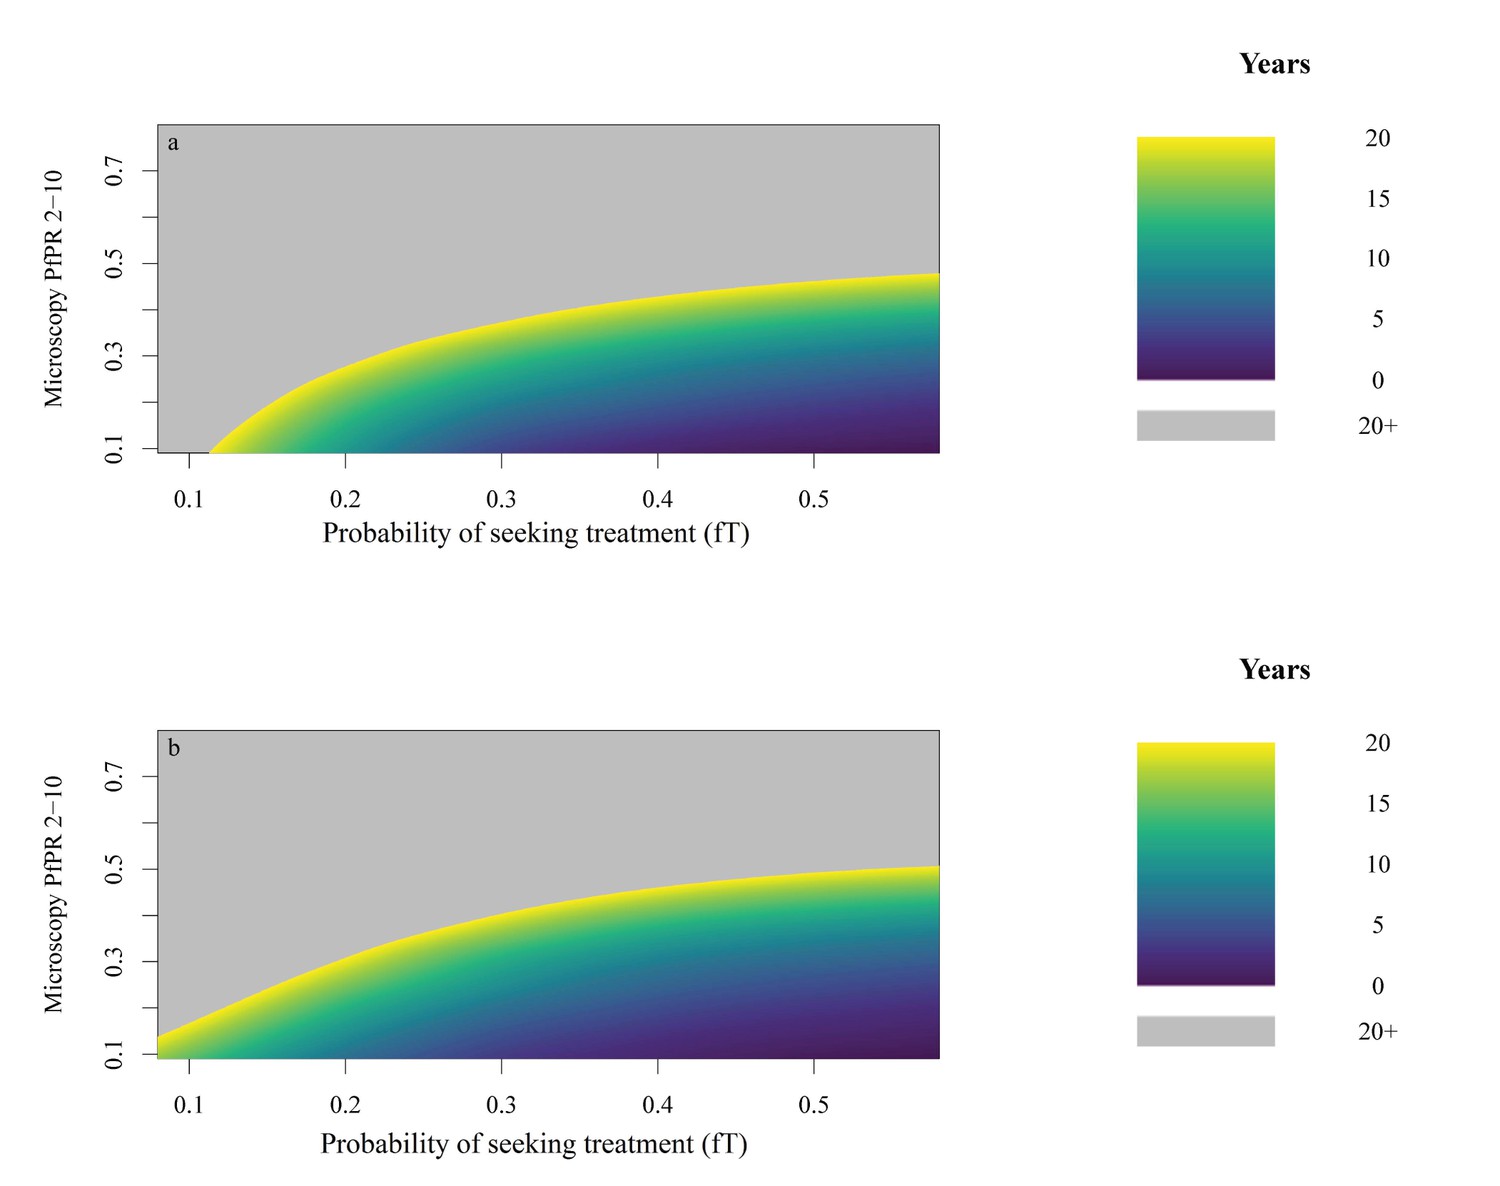
The predicted rate at which the population is only infected with pfhrp2-deleted mutants.
The graphs show the time in years after RDT introduction at which 20% of the population are only infected with pfhrp2-deleted mutants up to a maximum follow-up time of 20 years post RDT introduction. PfHRP3 epitopes were assumed to cause a positive RDT result in (a) 0% or (b) 25% of individuals only infected with pfhrp2-deleted mutants. The plotted years represent the mean time grouped in each prevalence and treatment setting, with black dots representing where 20% was reached in less than five years. Each simulation had a starting pfhrp2-deletion frequency of 8% before RDT introduction. Source data for Figure 2 is provided within Figure 2—source data 1.
-
Figure 2—source data 1
Years after RDT introduction at which 20% of the population are only infected with pfhrp2-deleted parasites, with an assumed PfHRP3 epitope effect equal to 0% and 0.25%.
- https://doi.org/10.7554/eLife.25008.013
Figure 2—figure supplement 1
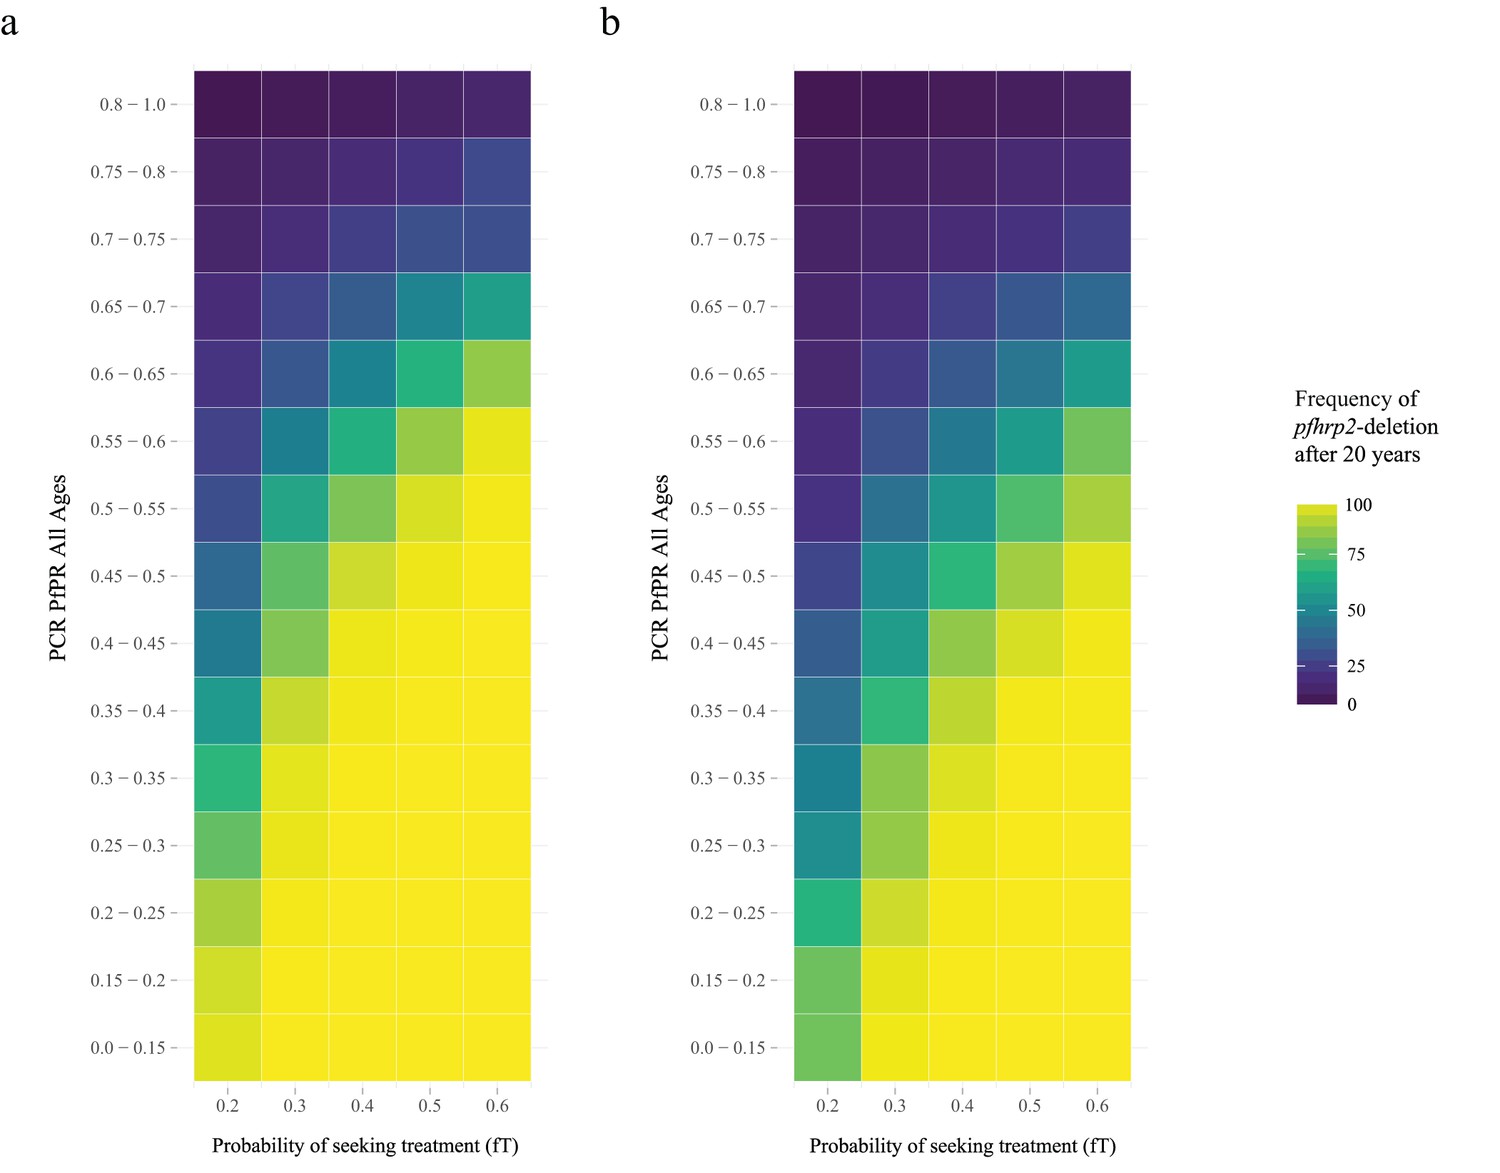
Frequency of pfhrp2-deletion after 20 years.
The graphs show the frequency of pfhrp2-deletion within the population 20 years after RDT introduction. PfHRP3 epitopes were assumed to cause a positive RDT result in (a) 0% or (b) 25% of individuals only infected with pfhrp2-deleted mutants. Each simulation had a starting pfhrp2 deletion frequency of 8% before RDT introduction.
Figure 3 with 1 supplement
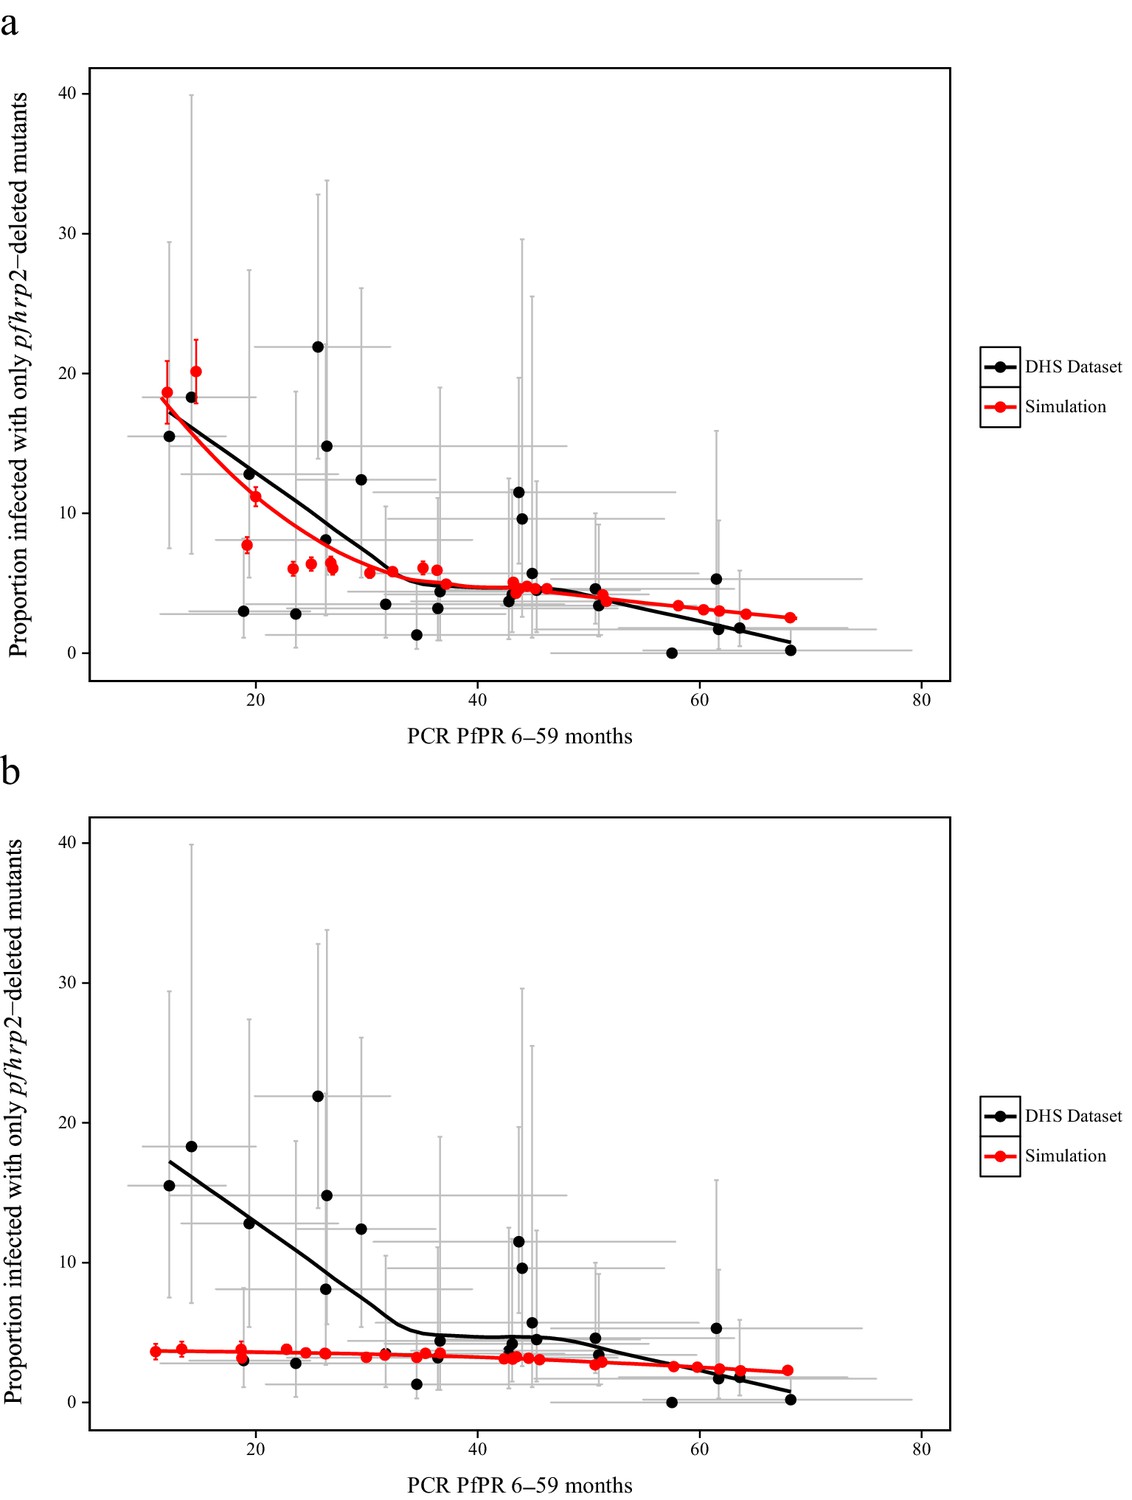
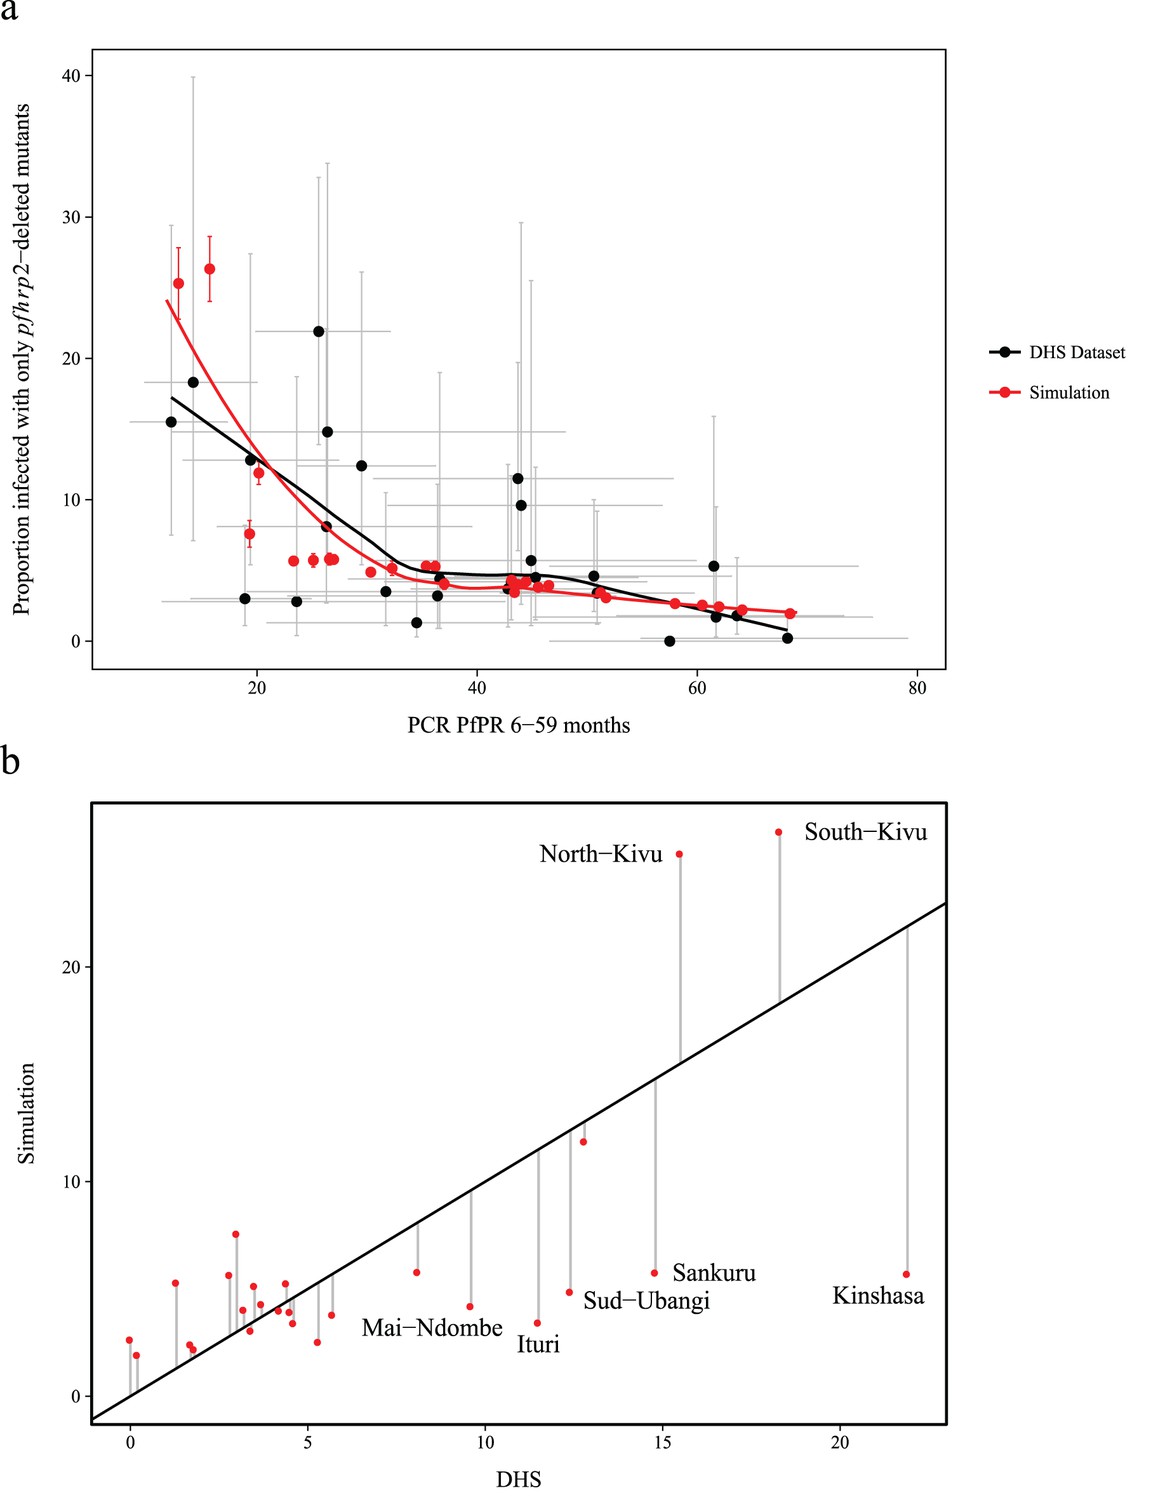
Simulated province level burden of pfhrp2-deleted mutants within the DRC, with an assumed probability of a clinical case seeking treatment, who is only infected with pfhrp2-deleted mutants, producing a positive RDT result (ε) equal to 0.25.
In (a) the mean simulated proportion of children aged 6–59 months who are infected with only pfhrp2-deleted mutants is shown in red. Each region had an assumed starting frequency of 6% pfhrp2-deletion prior to RDT introduction in 2010 (2007 in North- and South-Kivu). The results in grey represent the recorded burden from the DHS survey (Figure 3—source data 1), with both datasets fitted with a LOESS regression. Error bars show the 95% confidence interval. In (b) the same simulation conditions were used as in (a) however it is assumed that no selection pressure is exerted by the introduction RDTs, i.e. ε = 1. Source data for Figure 3 is provided within Figure 3—source data 1.
-
Figure 3—source data 1
Estimates of the proportion of pfhrp2-deleted mutants from a national study in DRC.
Sourced from Parr JB, Verity R, Doctor SM, Janko M, Carey-Ewend K, Turman BJ, Keeler C, Slater HC, Whitesell AN, Mwandagalirwa K, Ghani AC, Likwela JL, Tshefu AK, Emch M, Juliano JJ, Meshnick SR. 2016. Pfhrp2-deleted Plasmodium falciparum parasites in the Democratic Republic of Congo: A national cross-sectional survey. J Infect Dis: 1–34. doi: 10.1093/infdis/jiw538. Data is provided additionally in an importable format for plotting (Figure 3.csv).
- https://doi.org/10.7554/eLife.25008.016
-
Figure 3—source data 2
Simulated proportion of children aged 6–59 months who are only infected with pfhrp2-deleted parasites within the Democratic Republic of Congo, with an assumed PfHRP3 epitope effect equal to 0.25% and 1%, that is under no selection pressure.
- https://doi.org/10.7554/eLife.25008.017
Figure 3—figure supplement 1
Simulated province level burden of pfhrp2-deleted mutants within DRC, with an assumed probability of a clinical case seeking treatment, who is only infected with pfhrp2-deleted mutants, producing a positive RDT result (ε) equal to 0.
In (a) the mean simulated proportion of children aged 6–59 months who are infected with only pfhrp2-deleted mutants is shown in red. Each region had an assumed starting frequency of 4.5% pfhrp2-deletion prior to RDT introduction in 2010 (2007 in North- and South-Kivu). The results in grey represent the recorded burden from the DHS survey, with both datasets fitted with a LOESS regression. Error bars show the 95% confidence interval. In (b) the graph shows the plot of the residuals when comparing the simulation predicted proportion of children aged 6–59 months only infected with pfhrp2-deleted mutants to the recorded DHS data.
Figure 4 with 5 supplements
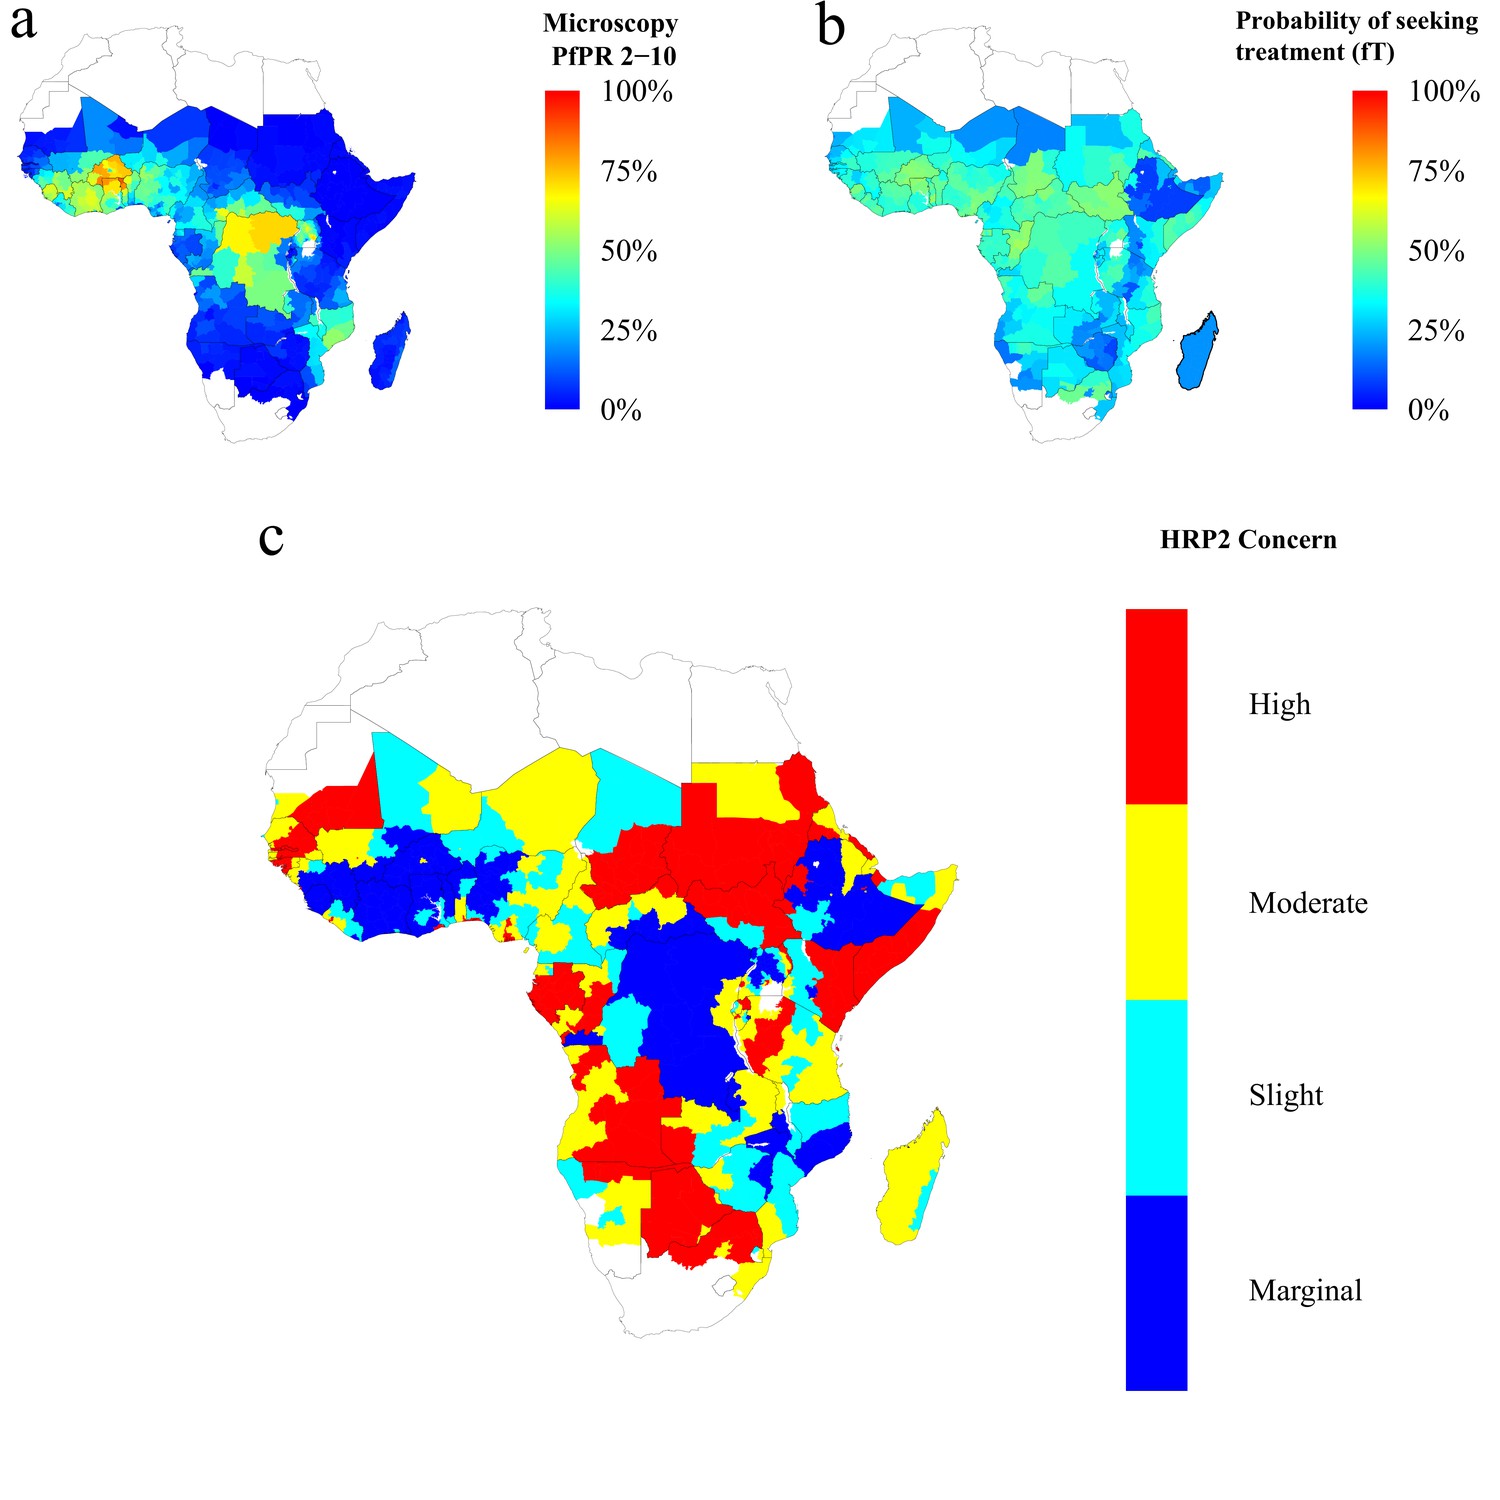
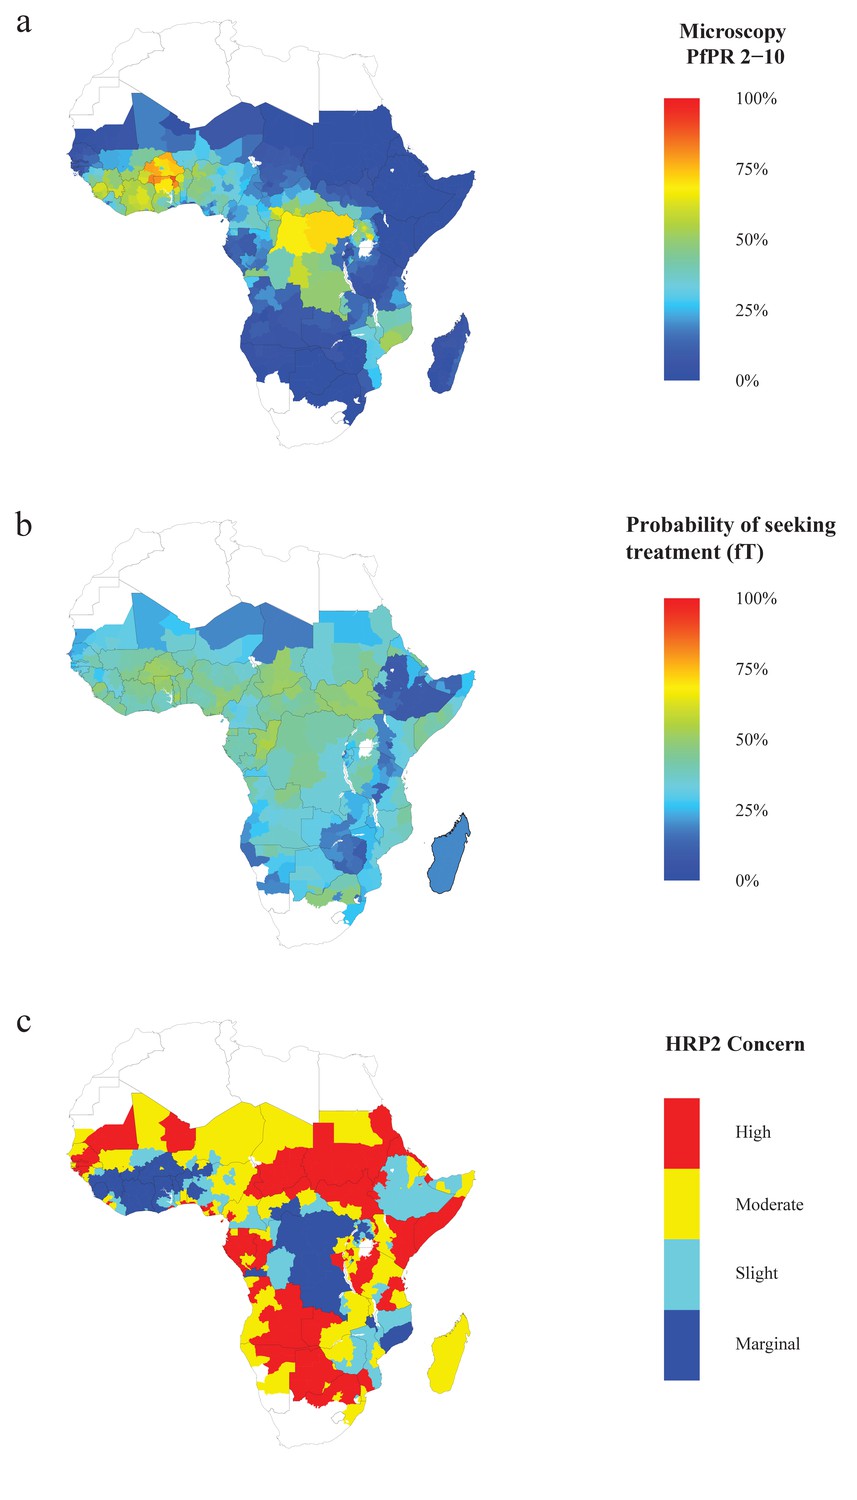
Predicted areas of HRP2 concern in comparison to recorded prevalence and treatment seeking rate, with an assumed probability of a clinical case seeking treatment, who is only infected with pfhrp2-deleted mutants, producing a positive RDT result (ε) equal to 0.25.
The graphs show (a) the recorded malaria prevalence in children aged 2–10 by microscopy in 2010, (b) the frequency of people seeking treatment in 2010 and (c) the predicted concern for the impact of pfhrp2-deleted mutants. In (c), high, moderate and slight risk represent >20% infection due to only pfhrp2-deleted mutants by 2016, 2022 and 2030 respectively, and marginal risk represents <20% by 2030. In 2010, each region was assumed to have a starting frequency of 6% pfhrp2-deletion. Source data for Figure 4 is provided within Figure 4—source data 1.
-
Figure 4—source data 1
Recorded malaria prevalence in children aged 2–10 by microscopy in 2010 (sourced from the Malaria Atlas mapping project [see Metadata - Datasets]), the frequency of people seeking treatment in 2010 (sourced from Cohen et al., 2012 [see Metadata – Datasets]) and the simulated predicted concern for the impact of pfhrp2-deleted mutants, with an assumed PfHRP3 epitope effect equal to 0.25%.
High, moderate and slight risk represent >20% infection due to only pfhrp2-deleted mutants by 2016, 2022 and 2030 respectively, and marginal risk represents <20% by 2030.
- https://doi.org/10.7554/eLife.25008.024
Figure 4—figure supplement 1
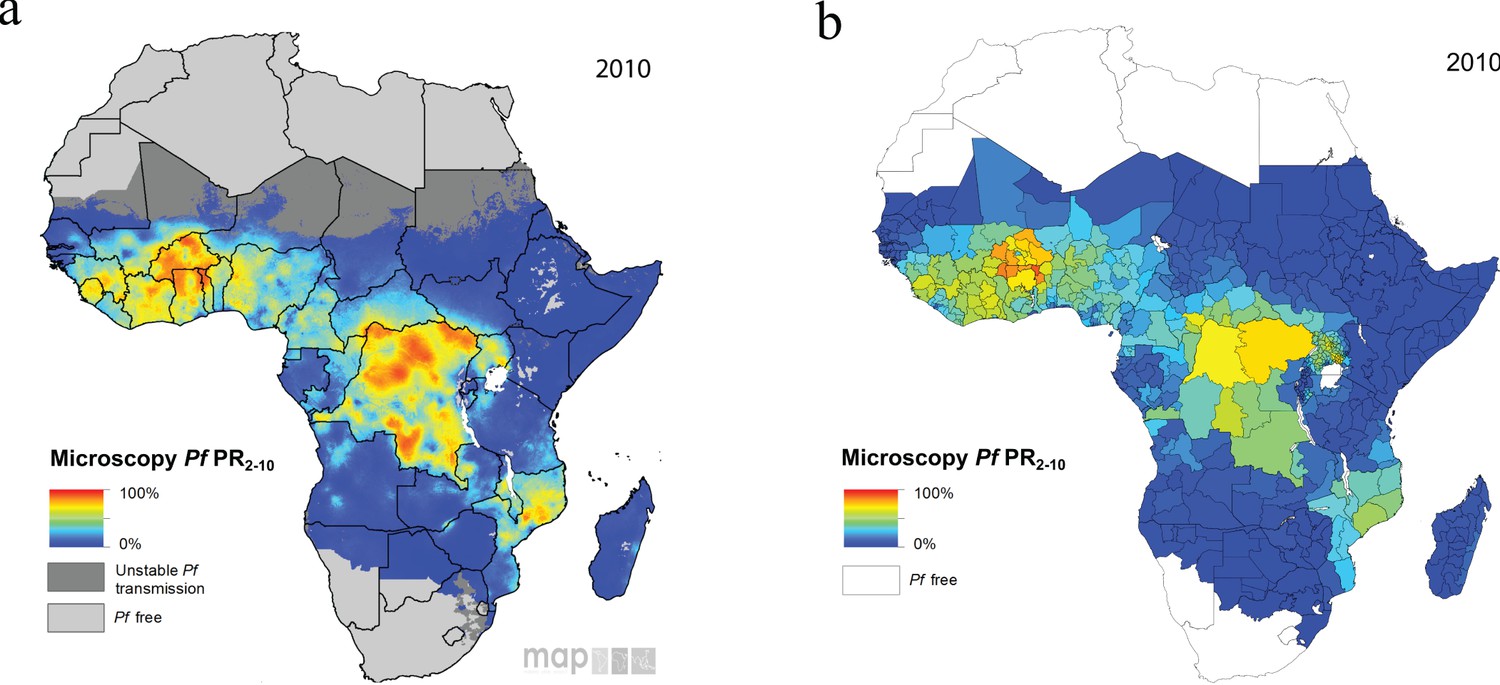
Model malaria prevalence output against Malaria Atlas Project prevalence 2010 (Bhatt et al., 2015).
The maps show the reported microscopy prevalence in children aged 2–10 from (a) the Malaria Atlas Project and (b) the presented model outputs at the first-administrative unit.
Figure 4—figure supplement 2
HRP2 Concern heat maps.
The graphs show the time after RDT introduction at which 20% of the population are only infected with pfhrp2-deleted mutants with an assumed probability of a clinical case seeking treatment, who is only infected with pfhrp2-deleted mutants, producing a positive RDT result (ε) equal to (a) 0.25 and (b) 0. Areas in grey represent simulation space in which, after 20 years, the proportion of 2–10 year olds only infected with pfhrp2-deleted mutants was less than 20%.
Figure 4—figure supplement 3
Predicted areas of HRP2 concern in comparison to recorded prevalence and treatment coverage with an assumed probability of a clinical case seeking treatment, who is only infected with pfhrp2-deleted mutants, producing a positive RDT result (ε) equal to 0.
The graphs show (a) the recorded malaria prevalence in children aged 2–10 in 2010, (b) the frequency of people seeking treatment in 2010 and (c) the predicted concern for the impact of pfhrp2-deleted mutants. In (c), high, moderate and slight risk represent >20% infection due to only pfhrp2-deleted mutants by 2016, 2022 and 2030 respectively, and marginal risk represents <20% by 2030. In 2010 each region was assumed to have a starting frequency of 4.5% pfhrp2-deletion.
Figure 4—figure supplement 4
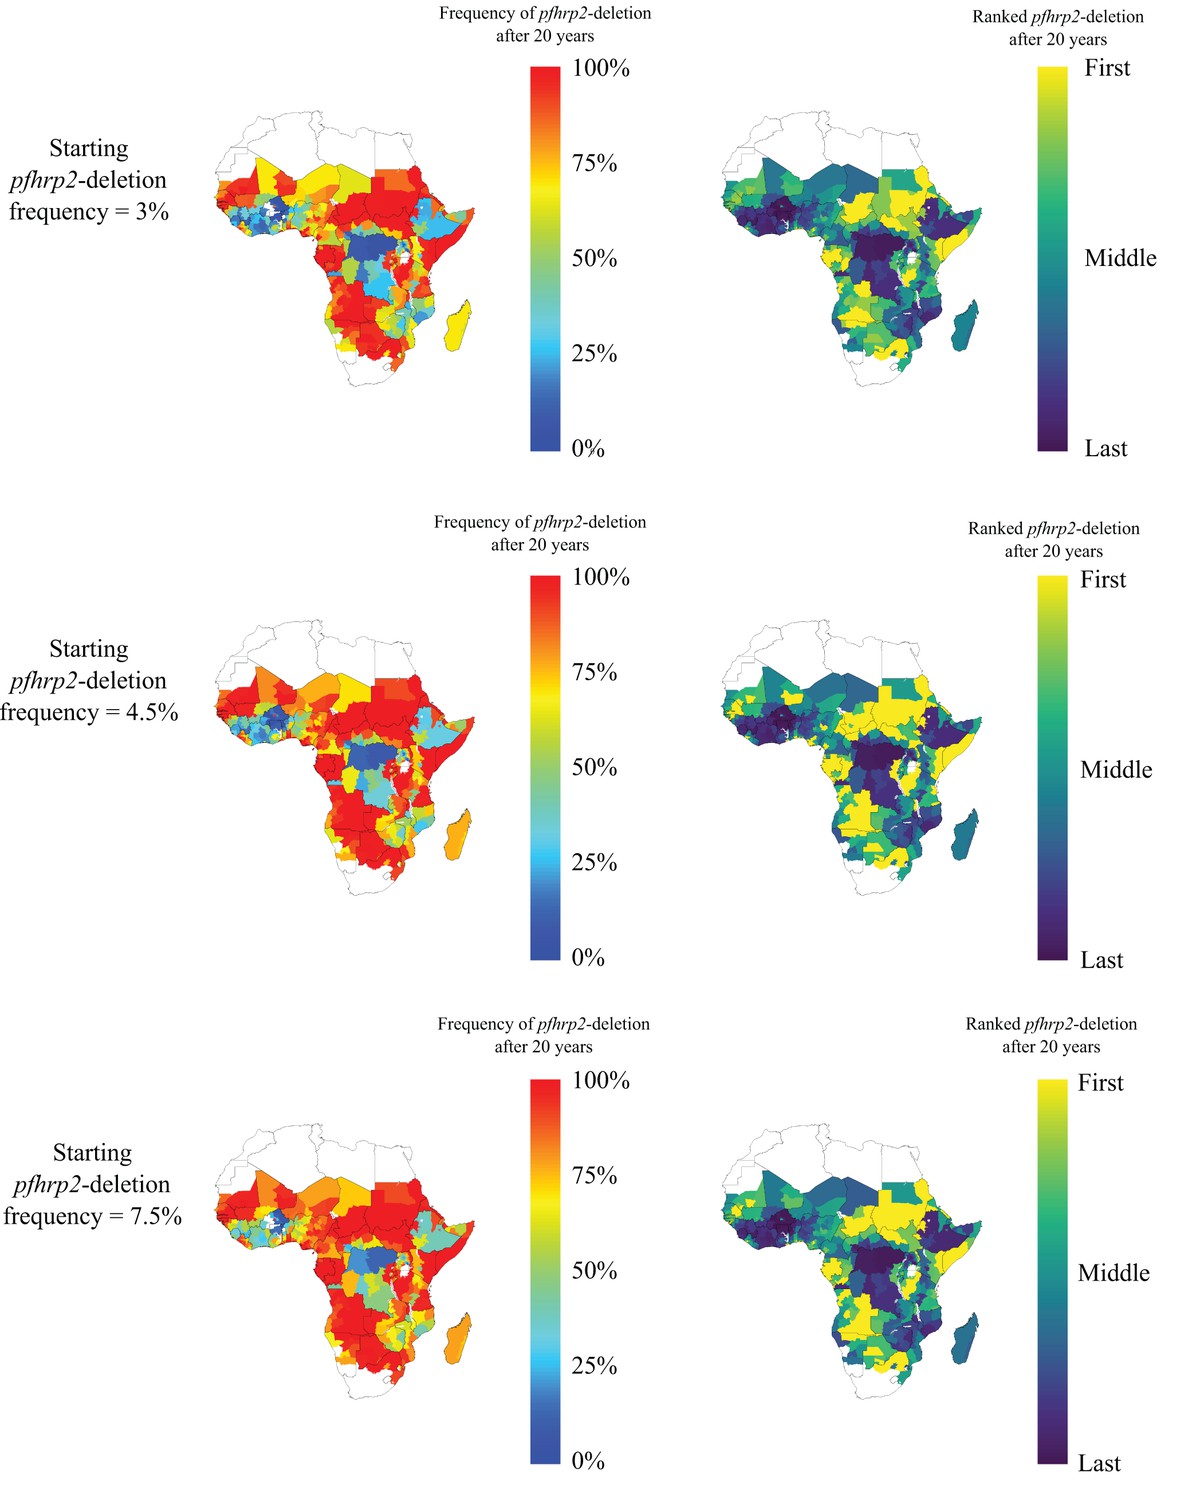
Impact of different assumptions about starting frequency of pfhrp2-deletion upon the geographical pattern of selection-driven increase in pfhp2-deletion.
Three different starting frequencies of pfhrp2-deletion were explored, with an assumed probability of a clinical case seeking treatment, who is only infected with pfhrp2-deleted mutants, producing a positive RDT result (ε) equal to 0.25. The frequency of pfhrp2-deletion after 20 years was recorded and admin regions ranked accordingly, with the first rank representing the highest frequency of pfhrp2-deletion, and tied ranks being represented with the same colour.
Figure 4—figure supplement 5
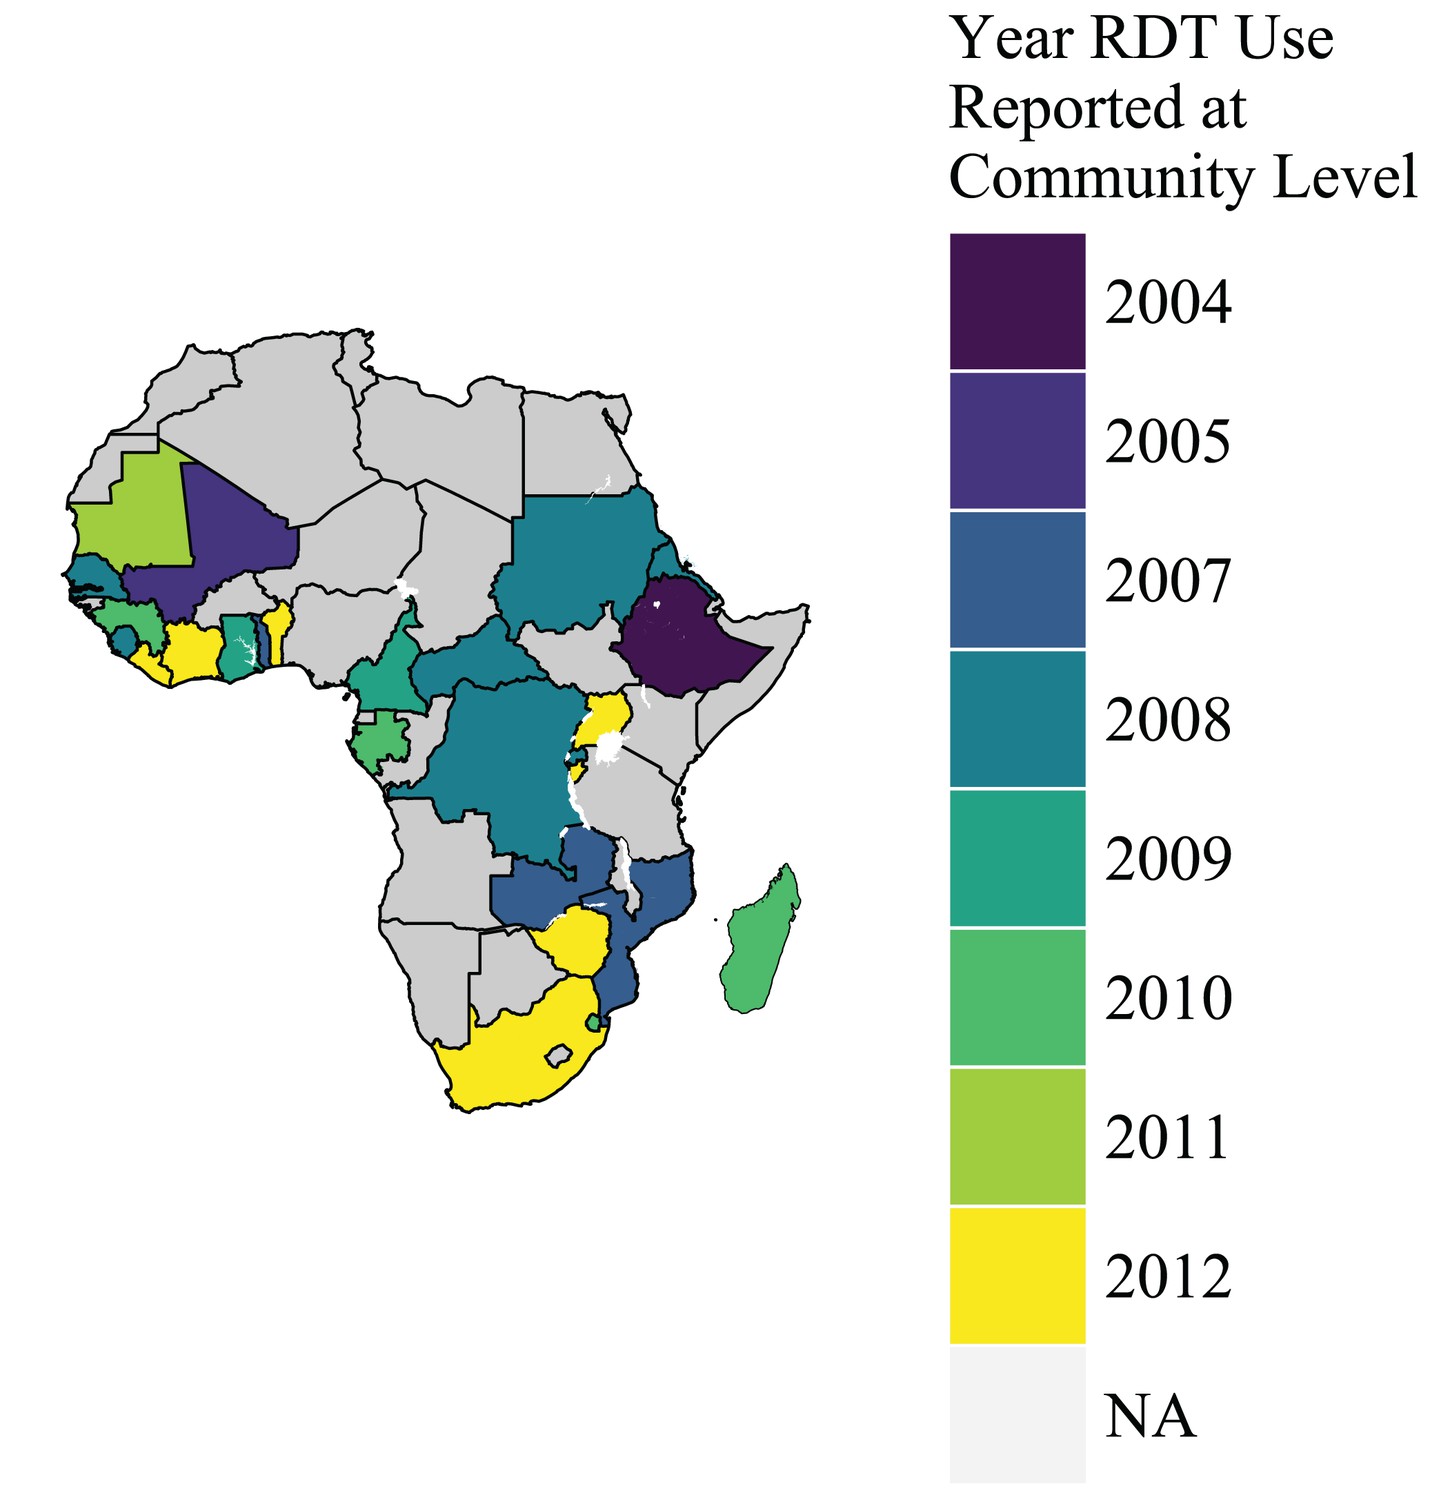
Years in which RDTs were used at community level in Sub-Saharan Africa.
The map shows the year that RDTs were reported to be available at the community level within WHO malaria country profiles in 2012 (World Health Organization, 2012b). Countries in grey were not reported to use RDTs at the community level, or there was insufficient data.
Figure 5
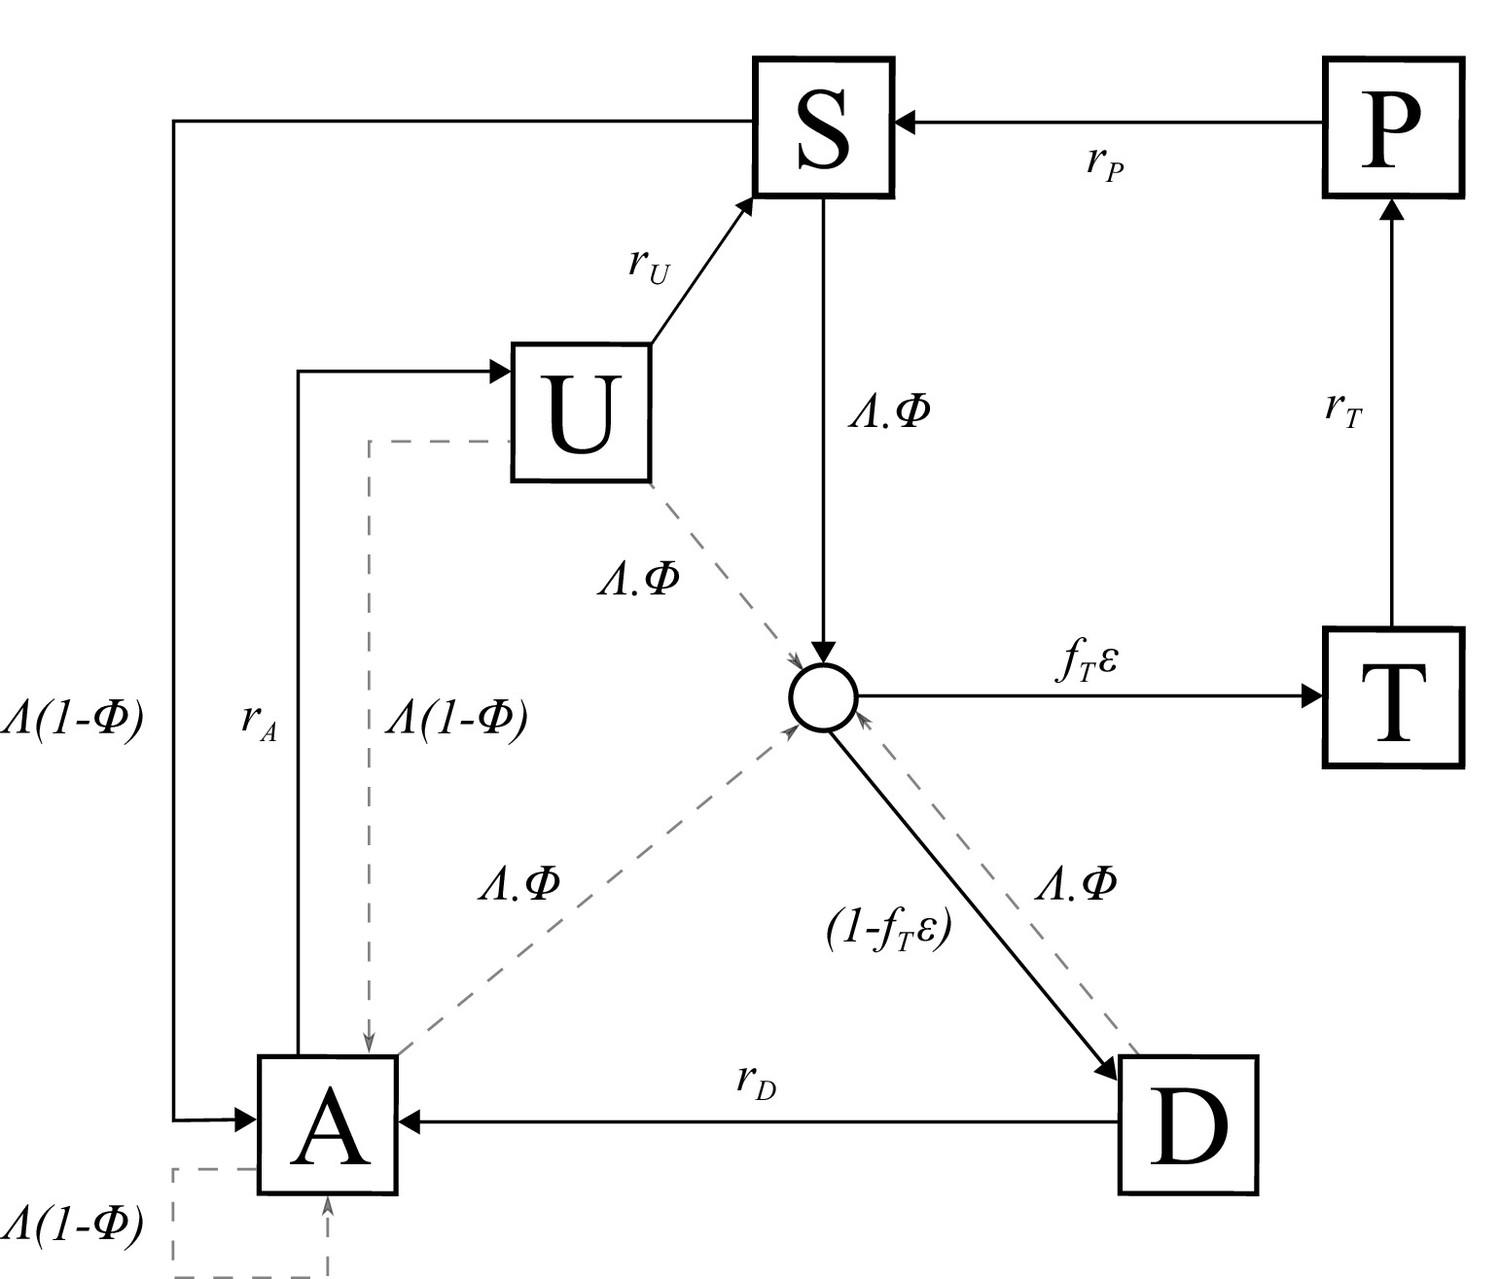
Transmission Model.
Flow diagram for the human component of the transmission model, with dashed arrows indicating superinfection. S, susceptible; T, treated clinical disease; D, untreated clinical disease; P, prophylaxis; A, asymptomatic patent infection; U, asymptomatic sub-patent infection. All parameters are described within Table 2.
Videos
Video 1
The projected increase in individuals who are only infected with pfhrp2-deleted parasites, from 2010 to 2030, with an assumed starting frequency of 6% pfhrp2-deletion, and an assumed PfHRP3 epitope effect equal to 0.25%.
The video relates directly to Figure 4.
Tables
Table 1
Published studies reporting P. falciparum in Africa with deletions or no deletions of the pfhrp2 gene (Cheng et al., 2014).
| Origin | Source of samples* | Initial evidence | Gene deletion analysis by PCR | Antigen analysis | Ref | Prevalence (no. of samples, year of collection) | ||||||
|---|---|---|---|---|---|---|---|---|---|---|---|---|
| Country | Area | Microscopy | Quality RDT | Species PCR | pfhrp2 (exon 1 and 2) | No. single copy genes | Flanking genes | HRP ELISA | 2nd quality RDT | |||
| Mali | Bamako | A/S | D | ND | D | D | 1 | ND | ND | ND | (Koita et al., 2012) | 2% (480, 1996) |
| DRC,Gambia, Kenya, Mozambique, Rwanda, Tanzania, Uganda | S | D | ND | D | Exon 2 only | ND | ND | D | ND | (Ramutton et al., 2012) | 0% (77, 2–19 per country, 2005–2010) | |
| Senegal | Dakar | S | D | ND | D | D | 1 | ND | ND | ND | (Wurtz et al., 2013) | 2.4% (136, 2009–2012) |
| Ghana | Accra and Cape Coast | A | D | D | D | Exon 2 only | 2 | ND | ND | ND | (Amoah et al., 2016) | 29.5% (315, 2015) |
| Zambia | Choma, South Zambia | A/S | D | D | D | D | 1 | ND | ND | ND | (Laban et al., 2015) | 20% (61, 2009–2012)† |
| DRC | Country-wide | A | D | D | D | D | 3 | D | ND | ND | (Parr et al., 2016) | 6.4% (783, 2013–2014) |
| Rwanda | Busogo, Musanze, Kayonza | S | D | D | D | Exon 2 only | 1 | ND | ND | D | (Kozycki et al., 2017) | 23% (140, 2014–2015) |
| Eritrea | Anseba, Debub, Gash-Barka, Northern Red-Sea | S | D | D | D | ND | 1 | ND | ND | D | (Berhane et al., 2017) | 80% (51, 2015) |
-
*Source of samples: S = Symptomatic case, A = Asymptomatic case, U = not specified, D = done; ND = not done.
† Authors suggested that failure to detect pfhrp gene in some samples was more likely to be the result of low parasite density rather than deletion
-
Note: Quality RDT indicates RDTs that meet the WHO RDT recommended procurement criteria based on WHO Malaria RDT Product Testing.
Table 2
Parameters used within the human transmission and mosquito population models.
https://doi.org/10.7554/eLife.25008.028| Parameter | Symbol | Estimate |
|---|---|---|
| Human infection duration (days) | ||
| Latent period | 12 | |
| Patent infection | 200 | |
| Clinical disease (treated) | 5 | |
| Clinical disease (untreated) | 5 | |
| Sub-patent infection | 110 | |
| Prophylaxis following treatment | 25 | |
| Treatment Parameters | ||
| Probability of seeking treatment if clinically diseased | Variable | |
| Probability of a clinical case seeking treatment, who is only infected with pfhrp2-deleted mutants, producing a positive RDT result. | ε | 0 or 0.25 |
| Infectiousness to mosquitoes | ||
| Lag from parasites to infectious gametocytes | 12 days | |
| Untreated disease | 0.0680 day−1 | |
| Treated disease | 0.0219 day−1 | |
| Sub-patent infection | 0.000620 day−1 | |
| Parameter for infectiousness of state A | 1.824 | |
| Age and heterogeneity | ||
| Age-dependent biting parameter | 0.85 | |
| Age-dependent biting parameter | 8 years | |
| Daily mortality rate of humans | 0.000130 | |
| Variance of the log heterogeneity in biting rates | 1.67 | |
| Immunity reducing probability of infection | ||
| Maximum probability due to no immunity | 0.590 | |
| Maximum relative reduction due to immunity | 0.5 | |
| Inverse of decay rate | 10 years | |
| Scale parameter | 43.879 | |
| Shape parameter | 2.155 | |
| Duration in which immunity is not boosted | 7.199 | |
| Immunity reducing probability of clinical disease | ||
| Maximum probability due to no immunity | ϕ0 | 0.791 |
| Maximum relative reduction due to immunity | ϕ1 | 0.000737 |
| Inverse of decay rate | 30 years | |
| Scale parameter | 18.0237 | |
| Shape parameter | 2.370 | |
| Duration in which immunity is not boosted | 6.0635 | |
| New-born immunity relative to mother’s | 0.774 | |
| Inverse of decay rate of maternal immunity | 67.695 | |
| Immunity reducing probability of detection | ||
| Minimum probability due to maximum immunity | 0.161 | |
| Inverse of decay rate | 10 years | |
| Scale parameter | 1.578 | |
| Shape parameter | 0.477 | |
| Duration in which immunity is not boosted | 9.445 | |
| Scale parameter relating age to immunity | 21.9 years | |
| Time-scale at which immunity changes with age | 0.00706 | |
| Shape parameter relating age to immunity | 4.818 | |
| PCR detection probability parameters state A | 0.757 | |
| PCR detection probability parameters state U | 0.186 | |
| Mosquito Population Model | ||
| Daily mortality of adults | 0.132 | |
| Daily biting rate | 0.307 | |
| Extrinsic incubation period | 10 days | |
Table 3
HRP2 classifiers used in sub-Saharan Africa mapping assuming RDT introduction in 2010.
https://doi.org/10.7554/eLife.25008.030| Proportion of population only infected with pfhrp2-deleted mutants | Concern classifier |
|---|---|
| >20% by 2016 | High |
| >20% by 2022 | Moderate |
| >20% by 2030 | Slight |
| <20% by 2030 | Marginal |
Additional files
-
Supplementary file 1
Simulation model pseudocode.
Mathematical style pseudocode description of the simulation model.
- https://doi.org/10.7554/eLife.25008.029
-
Transparent reporting form
- https://doi.org/10.7554/eLife.25008.031
Download links
A two-part list of links to download the article, or parts of the article, in various formats.
Downloads (link to download the article as PDF)
Open citations (links to open the citations from this article in various online reference manager services)
Cite this article (links to download the citations from this article in formats compatible with various reference manager tools)
Modelling the drivers of the spread of Plasmodium falciparum hrp2 gene deletions in sub-Saharan Africa
eLife 6:e25008.
https://doi.org/10.7554/eLife.25008


