Genetic identification of a common collagen disease in Puerto Ricans via identity-by-descent mapping in a health system
- Gillian Morven Belbin

- Jacqueline Odgis
- Elena P Sorokin
- Muh-Ching Yee
- Sumita Kohli
- Benjamin S Glicksberg
- Christopher R Gignoux
- Genevieve L Wojcik
- Tielman Van Vleck
- Janina M Jeff
- Claudia Schurmann
- Xiaoqiang Cai
- Amanda Merkelson
- Anne E Justice
- Kristin L Young
- Misa Graff
- Kari E North
- Ulrike Peters
- Regina James
- Lucia Hindorff
- Ruth Kornreich
- Lisa Edelmann
- Omri Gottesman
- Eli EA Stahl
- Judy H Cho
- Erwin P Bottinger
- Girish N Nadkarni
- Noura S Abul-Husn
- Eimear E Kenny
- Icahn School of Medicine at Mount Sinai, United States
- Stanford University School of Medicine, United States
- Carnegie Institution for Science, United States
- Icahn School of Medicine at Mt Sinai, United States
- Broad Institute, United States
- University of North Carolina at Chapel Hill, United States
- Fred Hutchinson Cancer Research Center, United States
- University of Washington School of Public Health, United States
- National Institute on Minority Health and Health Disparities, National Institutes of Health, United States
- National Human Genome Research Institute, National Institutes of Health, United States
Figures
Figure 1 with 4 supplements
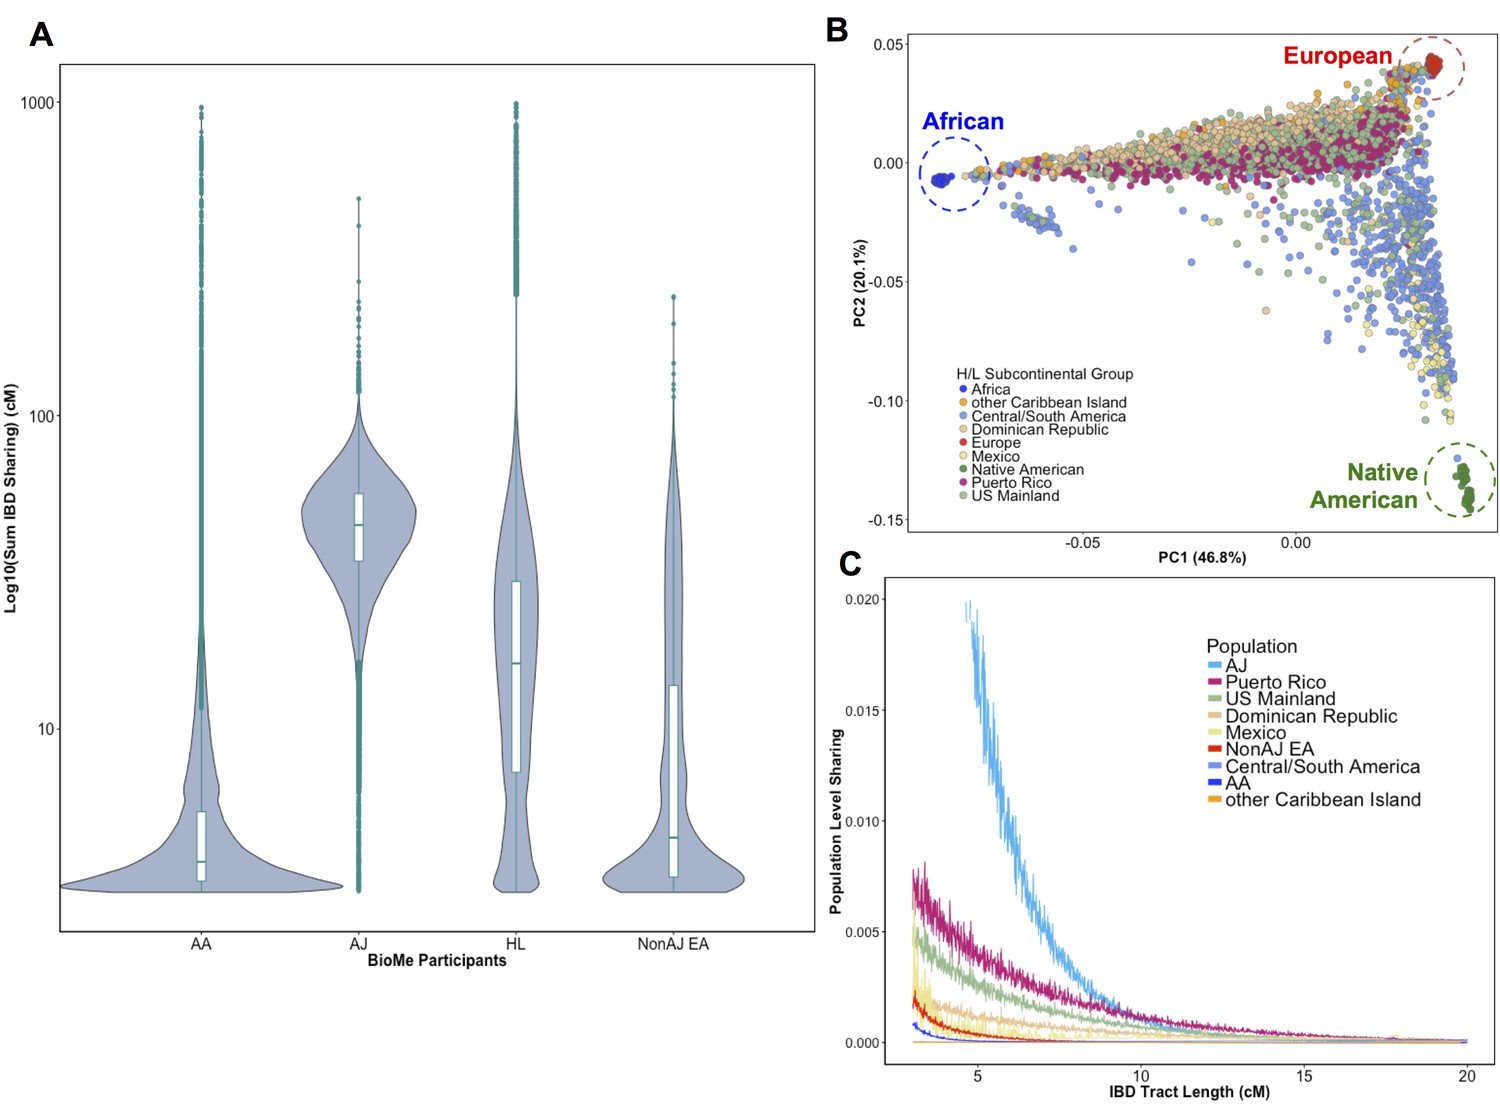
Distribution of Identity-by-Descent sharing among BioMe populations.
(A) Distribution of the pairwise sum of Identity-by-Descent (IBD) sharing (cM) between four broadly defined BioMe populations, namely; African American (AA), Ashkenazi Jewish (AJ), Hispanic/Latino/a (H/L) and Non-Jewish European American (Non-AJ EA). (B) Sub-continental diversity in self-reported H/L participants in BioMe. Afro-Caribbean participants fall between European (red) and African (blue) continental reference panels, Mexican and Central/South American H/L participants fall between European and Native American (green) reference panels, mainland US-born participants reside on either cline. (C) The tract length distribution of IBD sharing among BioMe populations, normalized by population size. The y-axis represents the proportion population-level sharing (x / (N*(N-1)/2)), where x is the sum of the number of pairwise shared IBD tracts and N is the number of individuals per population. The AJ population exhibits the highest level of population level sharing, followed by Puerto Rican born H/L.
Figure 1—figure supplement 1
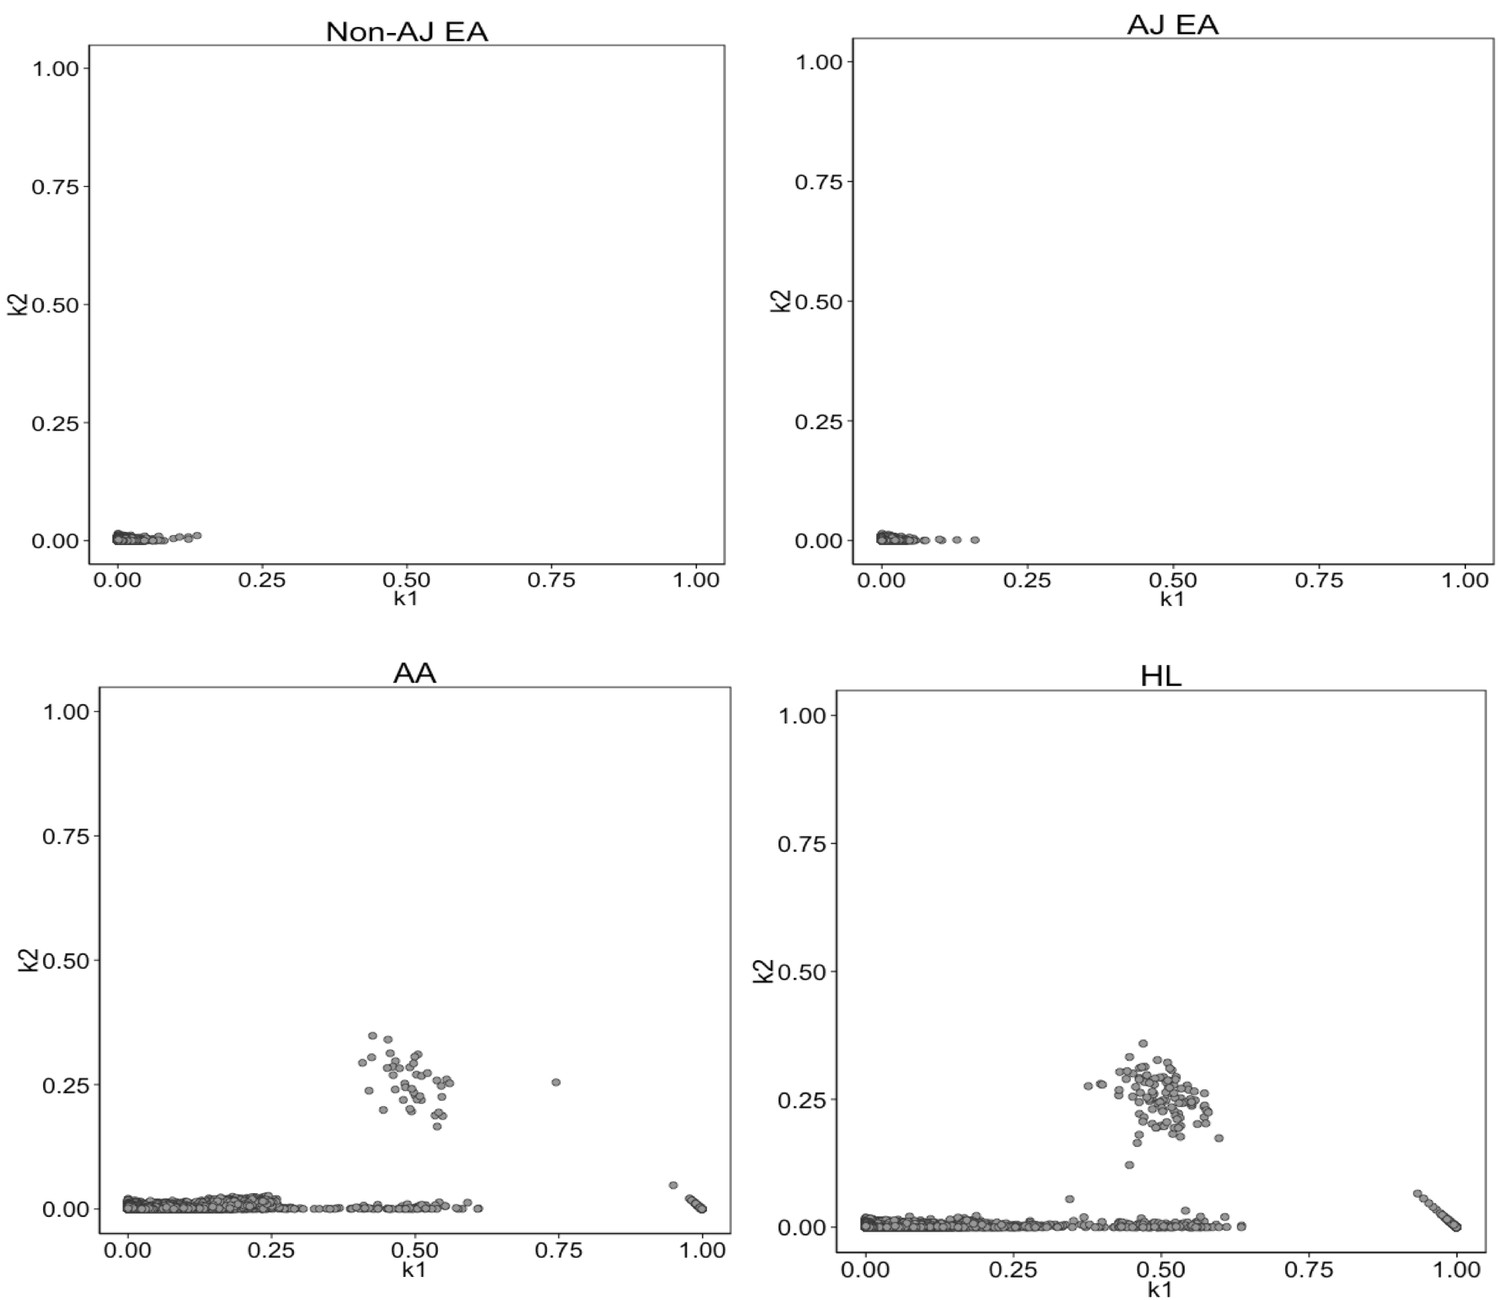
Identity-by-State analysis to test for presence of relatedness in four BioMe populations.
The four panels here represent the output of the RelateAdmix software for four BioMe populations: Non-Ashkenazi Jewish European (Non-AJ EA), Ashkenazi Jewish European (AJ EA), African American (AA) and Hispanic/Latino/a (HL). The x and y axis each represent relatedness coefficients (k), which describe the fraction of the genome that a given pair of individuals share Identically-by-State (IBS). The x-axis represents k1 which is the fraction of the genome where two individuals share 1 allele IBS at a given SNP. The y-axis represents k2, which is the fraction of the genome where a pair of individuals share 2 alleles IBS. Each grey dot represents a pairwise relationship between two BioMe participants. Directly related pairs of individuals can be identified based on observed levels of IBS sharing (which is expected to be high for directly related individuals). Directly related individuals were detected in both the AA and HL populations. No directly related individuals are detected in either the AJ or Non-AJ EA BioMe populations.
Figure 1—figure supplement 2
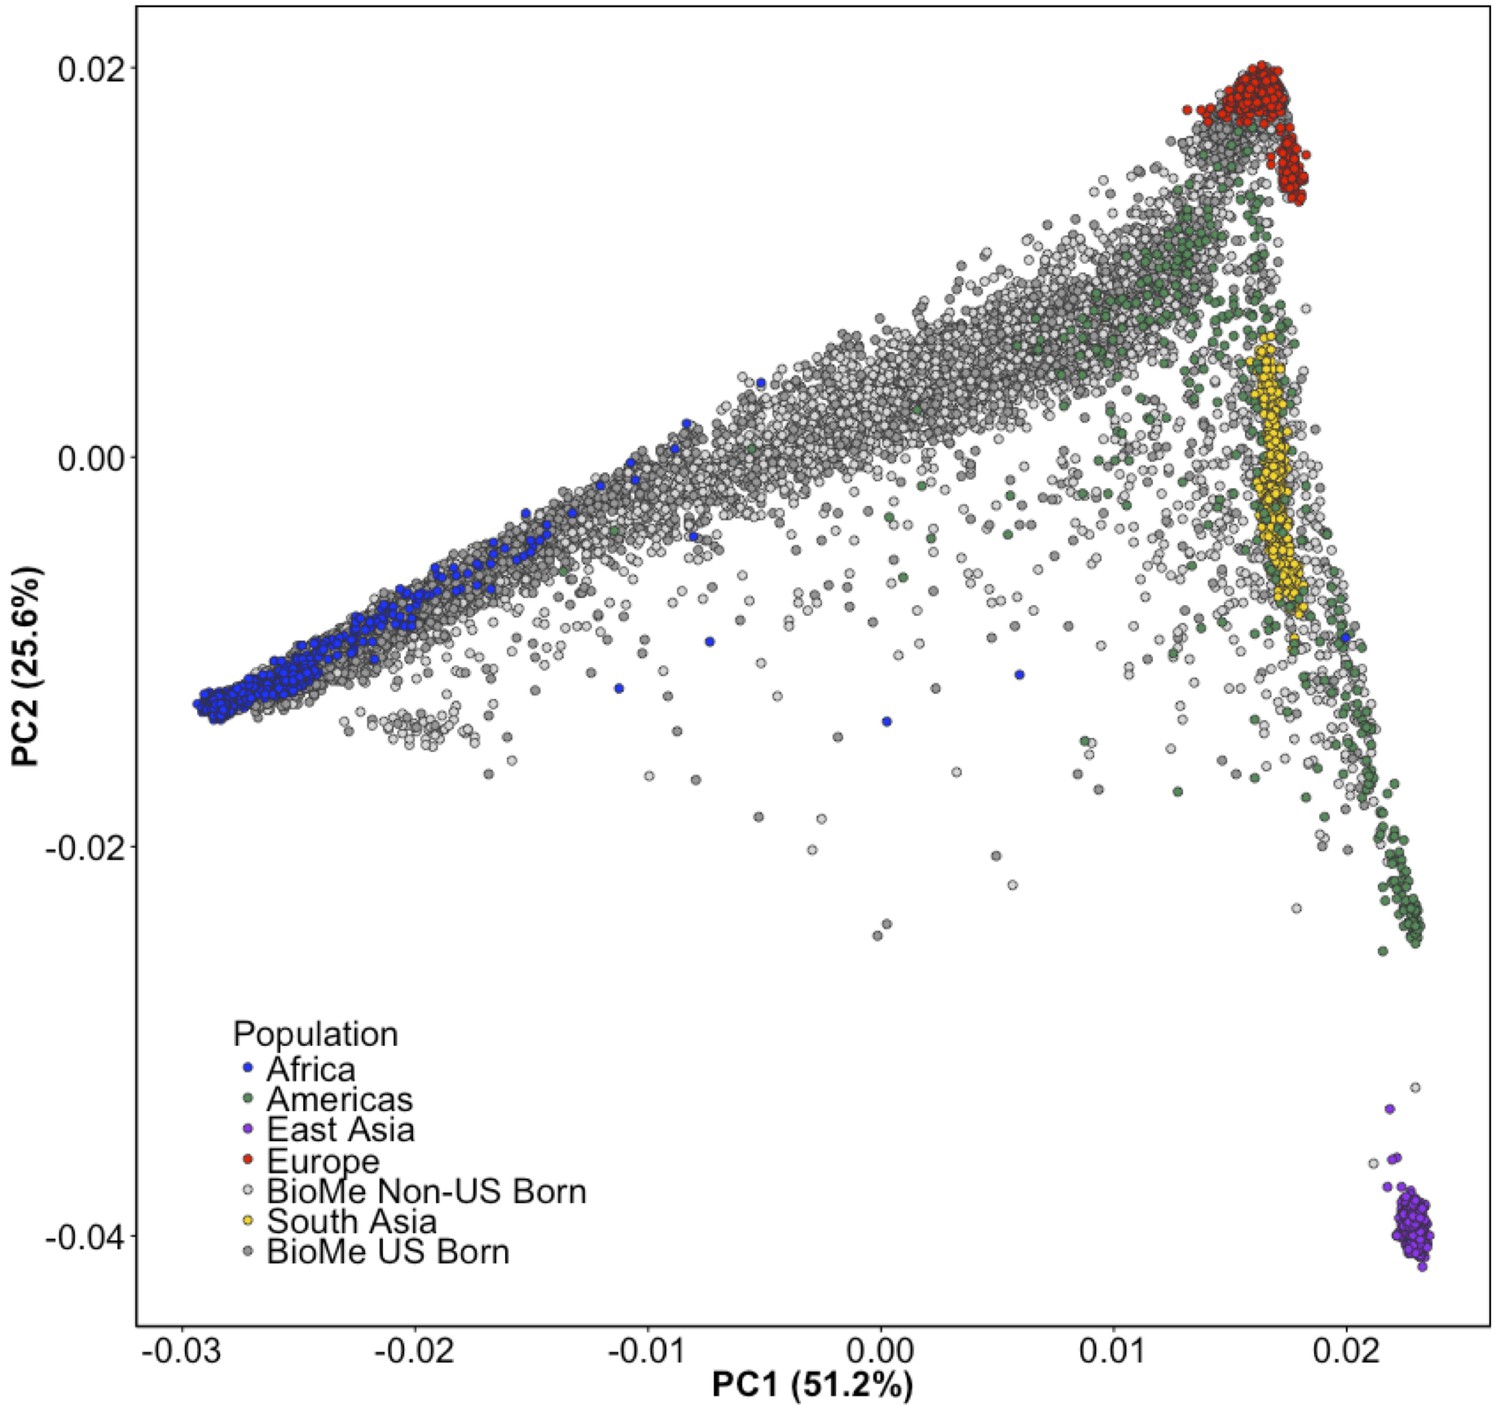
Principal Component Analysis of all BioMe participants show extensive global genetic diversity.
Participants from BioMe are represented in shades of grey, with dark grey representing US-Born BioMe participants, and light grey representing Non-US born participants. Global reference panels from the 1KGP are also represented, here colored based on their continental region, with African samples in blue, European samples in red, East Asian samples in purple, South Asian samples in yellow, and samples from the Americas in green. BioMe participants fall across the spectrum of global diversity.
Figure 1—figure supplement 3
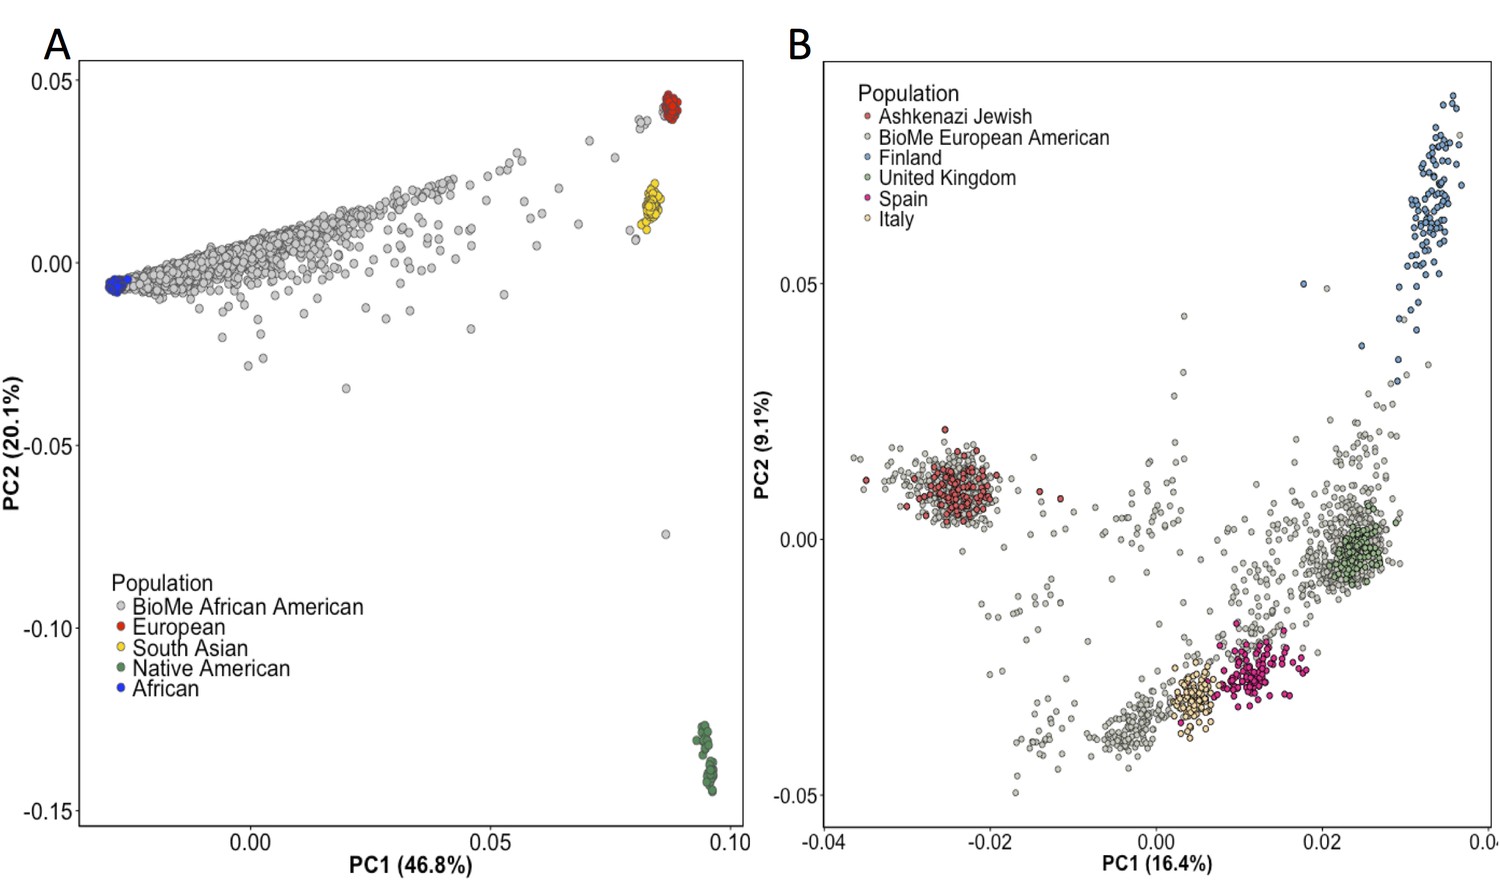
Principal Component Analysis in BioMe AA and EA reveals sub-continental structure.
(A) Principal component analysis (PCA) of BioMe AA individuals (grey) reveal that the majority of individuals fall on a cline between the European (red) and African (blue) reference panels, suggesting that they have varying proportions of African and European admixture. A small number of AA individuals cluster near the South Asian reference panel (yellow), investigation of questionnaire information for these individuals revealed them to mostly have been born in Trinidad and Tobago. (B) PCA analysis of BioMe EA reveals 39% of participants cluster with the Ashkenazi Jewish reference panel. Non-Ashkenazi Jewish EA individuals cluster with other European samples from the 1KGP reference populations, namely; the Finnish in Finland (FIN; blue), the British in England and Scotland (GBR; green), the Iberian population in Spain (IBS; pink) and the Toscani in Italia (yellow: TSI). Some BioMe individuals fall on a cline on PC1 between the Ashkenazi Jewish and non Ashkenazi Jewish reference panels. We suspect that this may be the result of recent admixture between Ashkenazi and Non-Ashkenazi Jewish Europeans.
Figure 1—figure supplement 4
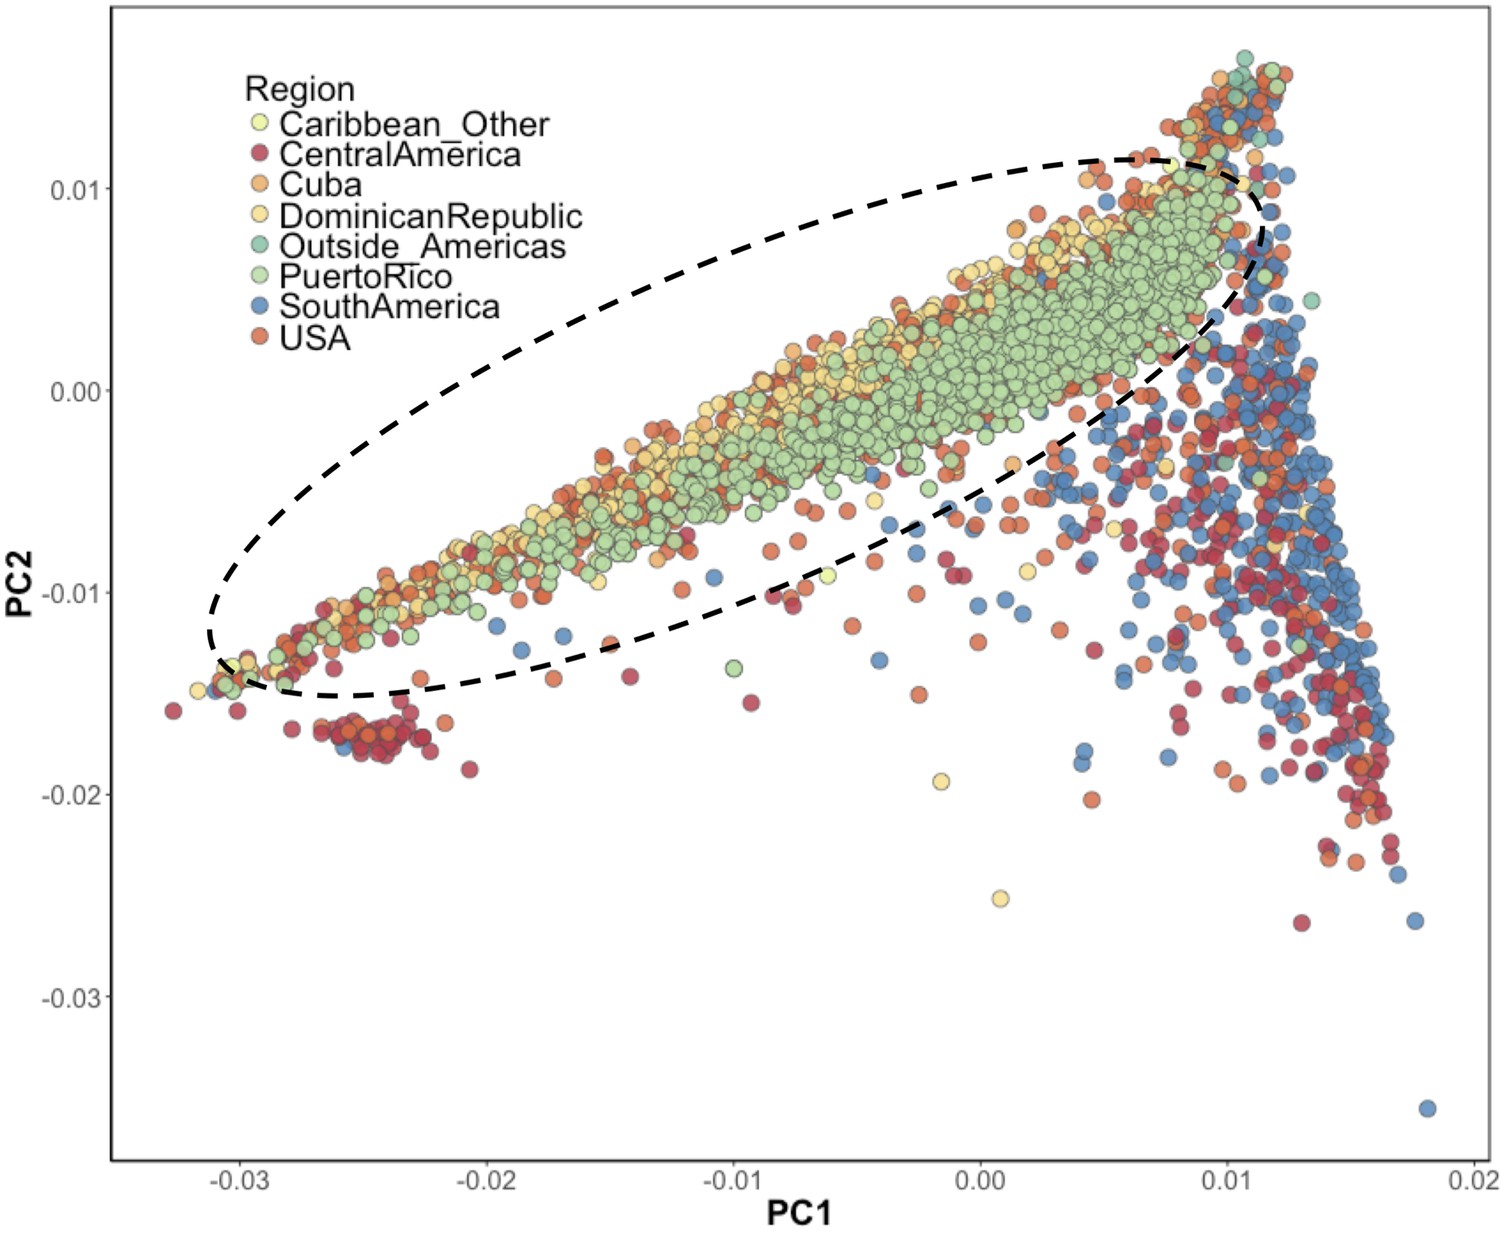
Inference of suspected Puerto Rican ancestry individuals via principal component analysis.
PCA of BioMe H/L reveals that Afro-Caribbean ancestry individuals (Puerto Rican (green), Dominican (yellow), Cuban (light orange), ‘Other Caribbean’ (pale yellow)) are distinguishable from H/L individuals from other continental regions of the Americas. To restrict analysis to individuals likely to be of Puerto Rican ancestry we included individuals who reported recent Puerto Rican ancestry (i.e. being born in Puerto Rico, or having two parents or at least three grandparents who were born in Puerto Rico, N = 1245). We additionally included BioMe H/L individuals who were born in the USA, did not self-report other recent Afro-Caribbean ancestry, and who fall on the same cline as Puerto Ricans in PCA space (delineated here by the black meloid) (N = 1571).
Figure 2 with 7 supplements

Identity-by-Descent mapping reveals locus associated with short stature.
(A) Identity-By-Descent (IBD) mapping for height in BioMe Puerto Ricans using a recessive model. Analysis was restricted to IBD-cliques where at least three individuals were homozygous. Only one IBD-clique achieved Bonferroni significance (at 9q32). (B) Distribution of height among Puerto Rican individuals who carry either 0,1 or 2 copies of the IBD-haplotype reveals a large recessive effect. Homozygous individuals (those carrying 2 copies of the IBD-haplotype) are on average 6–10’ shorter than the population mean for Puerto Rican ancestry individuals. (C) The minimum shared boundary of the significant IBD-haplotype between the three homozygous individuals (represented by the dashed blue line). The top panel depicts known genes at the 9q32 locus. The minimum shared boundary of the IBD overlaps the gene COL27A1..
Figure 2—figure supplement 1
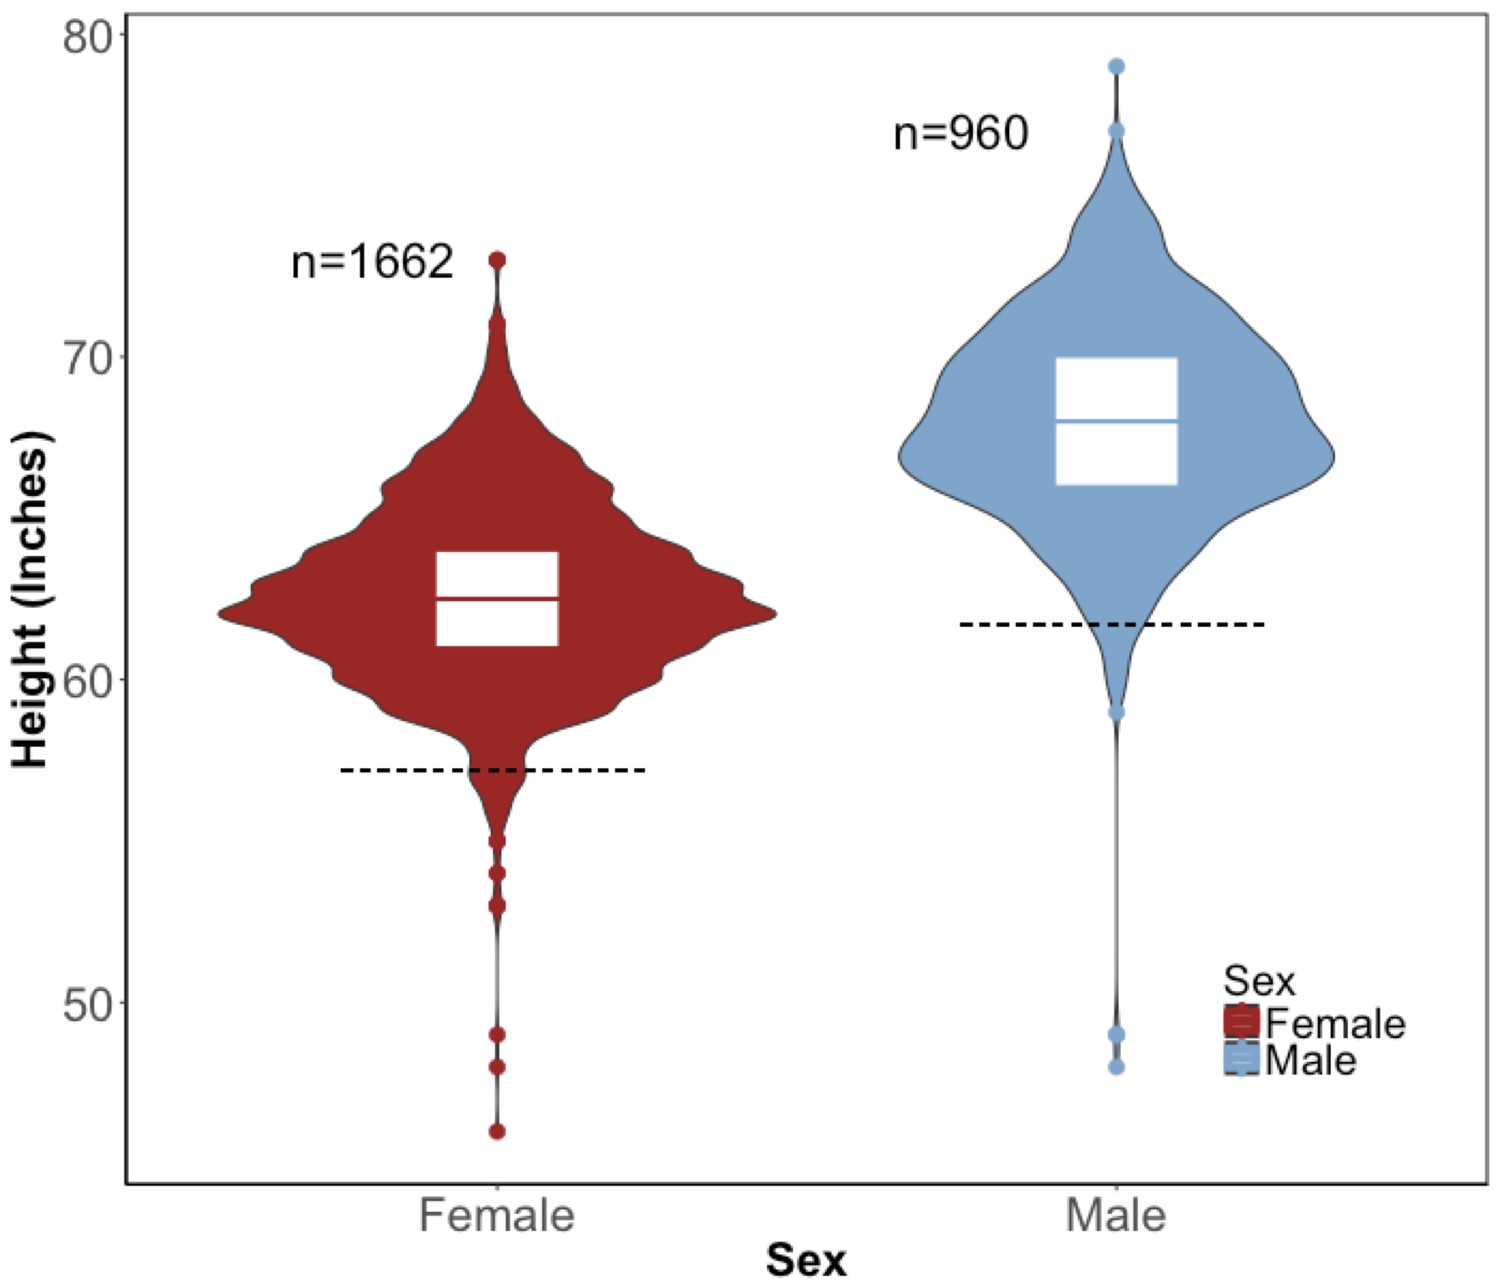
Distribution of height in the BioMe Puerto Ricans stratified by sex.
Violin plots representing the distribution of height in inches in Puerto Rican ancestry individuals (N = 2622) for both women (red) and men (blue). The black dashed line represents 2 s.d. below the sex-specific mean for height. Individuals who fall below this threshold meet the clinical criteria for short stature.
Figure 2—figure supplement 2
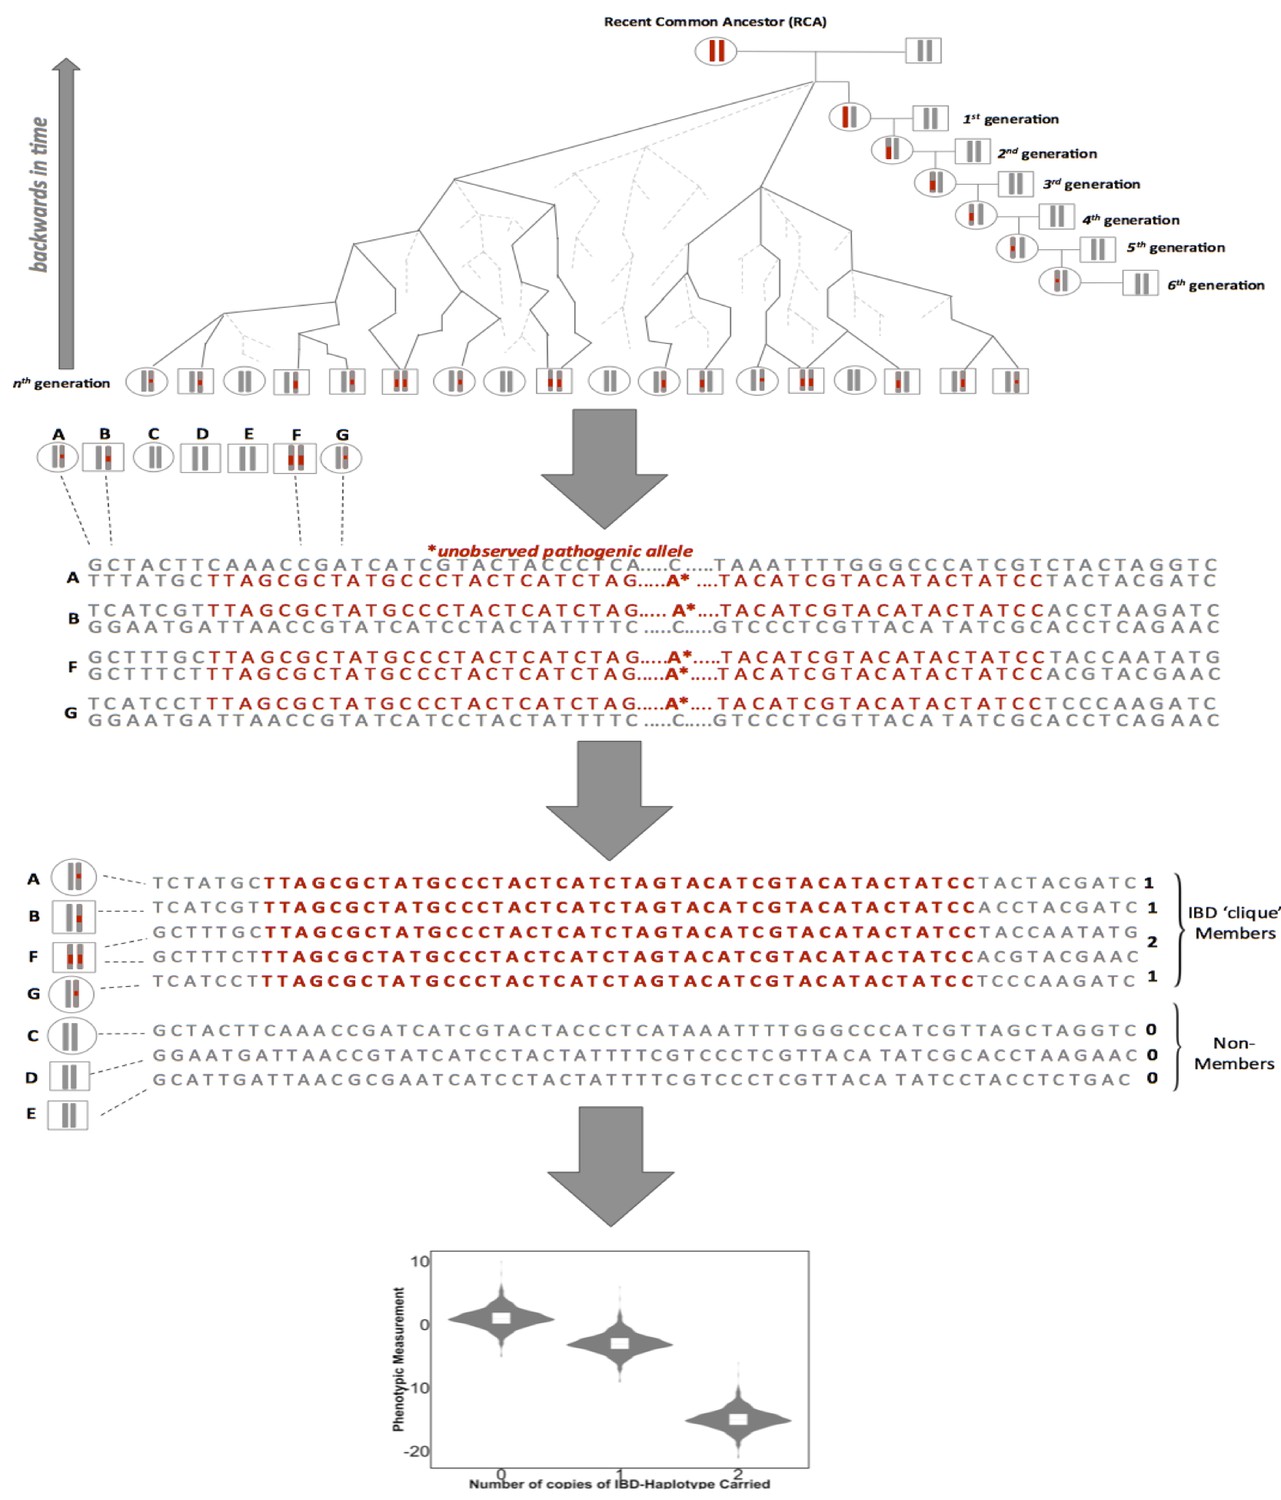
A framework for biomedical discovery via Identity-by-Descent (IBD) mapping.
Individuals with recent, shared ancestry can co-inherit long tracts of the genome identical-by-descent (IBD) from a recent common ancestor (RCA). Haplotypes shared IBD here are indicated in red. Because IBD segments are broken up by meiosis, the probability of IBD sharing between any two individuals decreases with increasing genealogical distance. However, while the probability of IBD sharing decreases rapidly, long segments of IBD can persist between individuals even after they have been separated by many generations of meiosis. This means that segments of IBD can be present and detectable in putatively unrelated groups. The presence of pairwise IBD-sharing between individuals at a given region of the genome can be inferred from genome-wide array data. For example this can be achieved via matching of exact shared haplotypes at a given locus using the GERMLINE algorithm. Inferred IBD-haplotypes have the potential to harbor disease associated alleles that are not directly observed via genome-wide genotype data. This allows for IBD to be leveraged for disease association and can be especially advantageous for research in founder populations, where levels of IBD-sharing can be high (due to an increased chance of individuals in the contemporary population sharing an RCA), and pathogenic variants can drift to appreciable frequencies. After inference of pairwise IBD-sharing, homologous haplotypes shared by multiple individuals at a given locus can be identified and clustered into IBD cliques via the DASH algorithm). Sharing of either zero, one or two copies of an IBD haplotype in a given clique can then be used as a predictor for regression to detect association between a given phenotypic trait and unobserved alleles segregating on the background of the IBD.
Figure 2—figure supplement 3
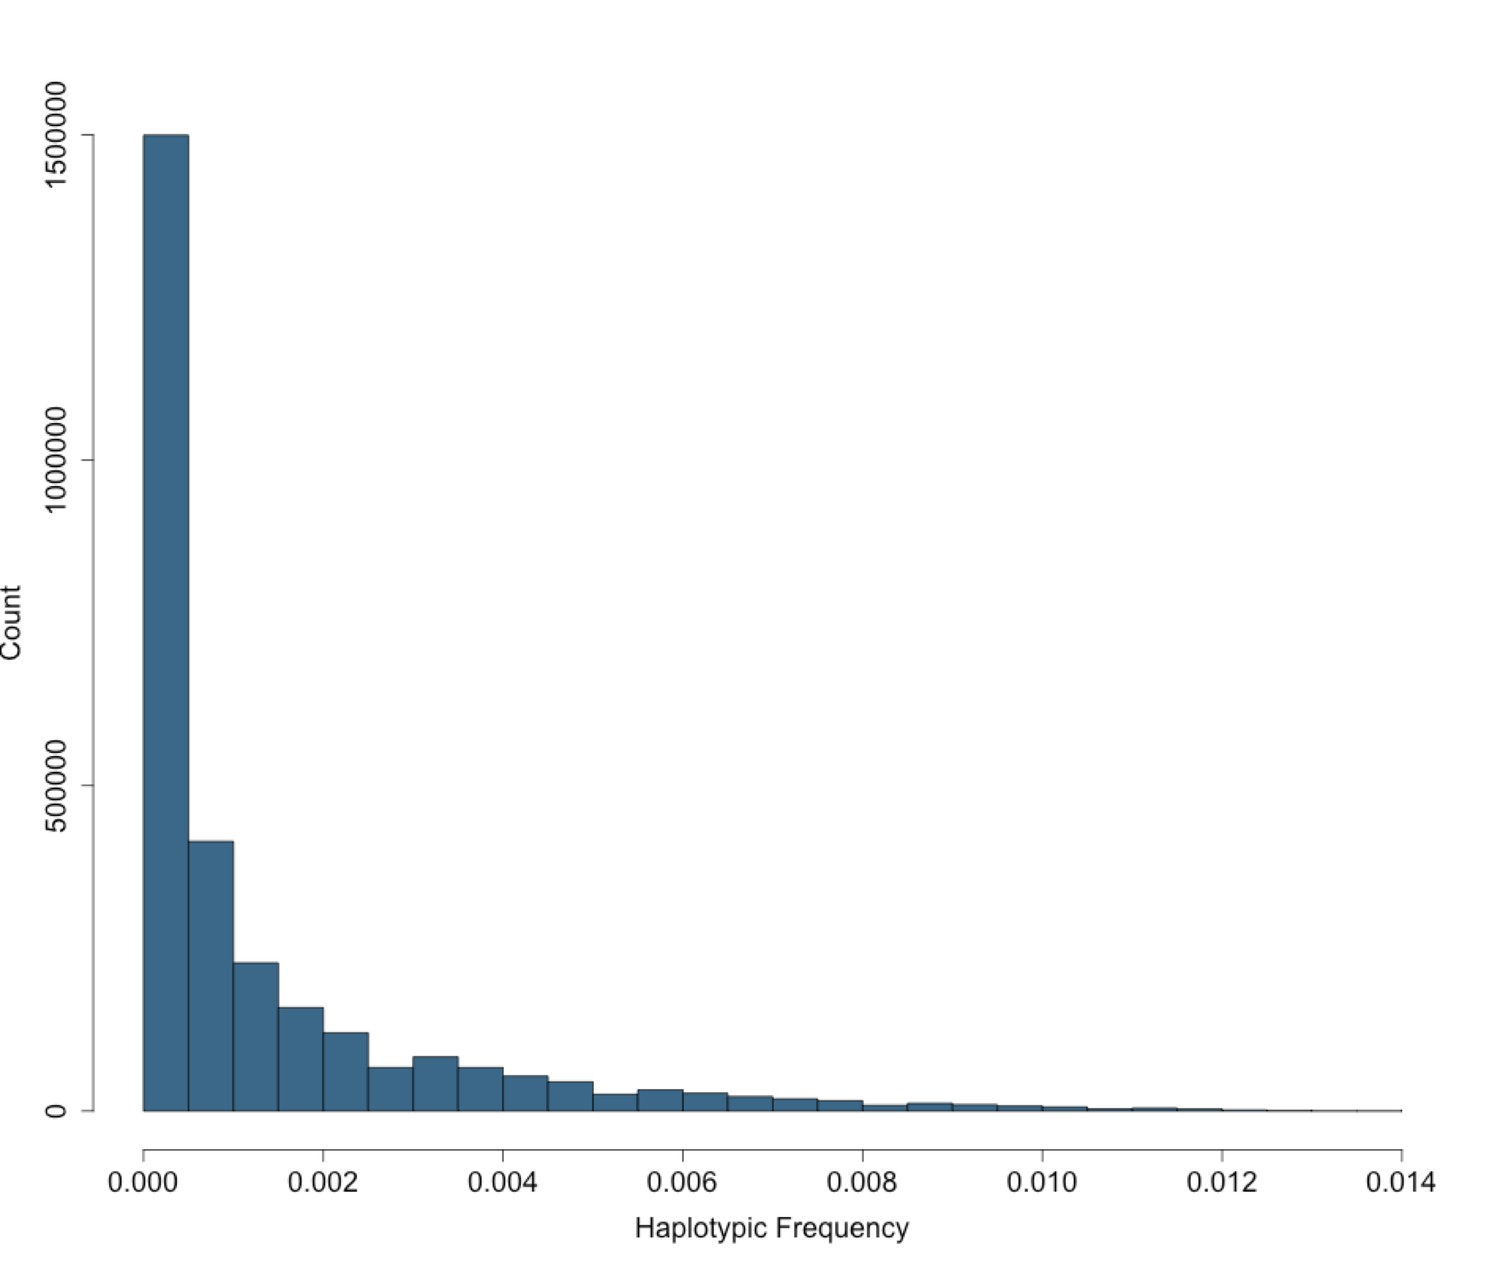
Site Frequency Spectrum of IBD-cliques in BioMe Puerto Ricans follows an exponential distribution.
The site frequency spectrum (SFS) for IBD-cliques inferred using the DASH algorithm in Puerto Rican individuals (N = 2816). A total of 1434421 IBD-cliques were identified, with a minimum of 3 haplotype per clique, and a maximum of 77. This corresponds to a IBD-haplotypic frequency range of 0.0005–0.0137, meaning that our inferred IBD-haplotypes are generally rare within the BioMe Puerto Rican population.
Figure 2—figure supplement 4
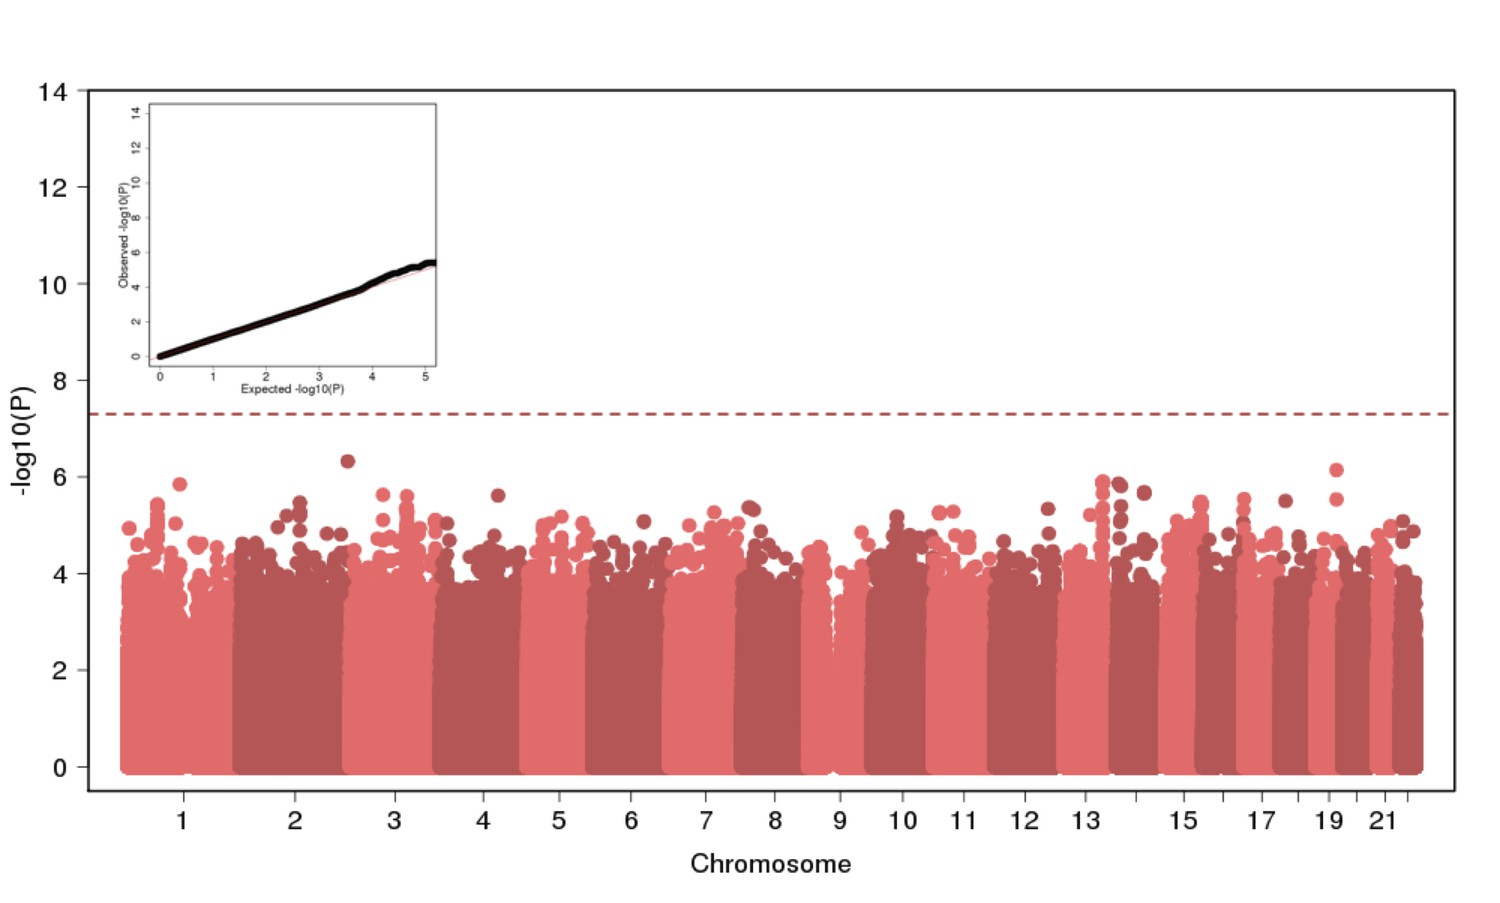
Genome Wide Association of Height in N = 2622 Puerto Ricans under a recessive model appears to be well-calibrated but reveals no genome-wide significant signal.
https://doi.org/10.7554/eLife.25060.012
Figure 2—figure supplement 5
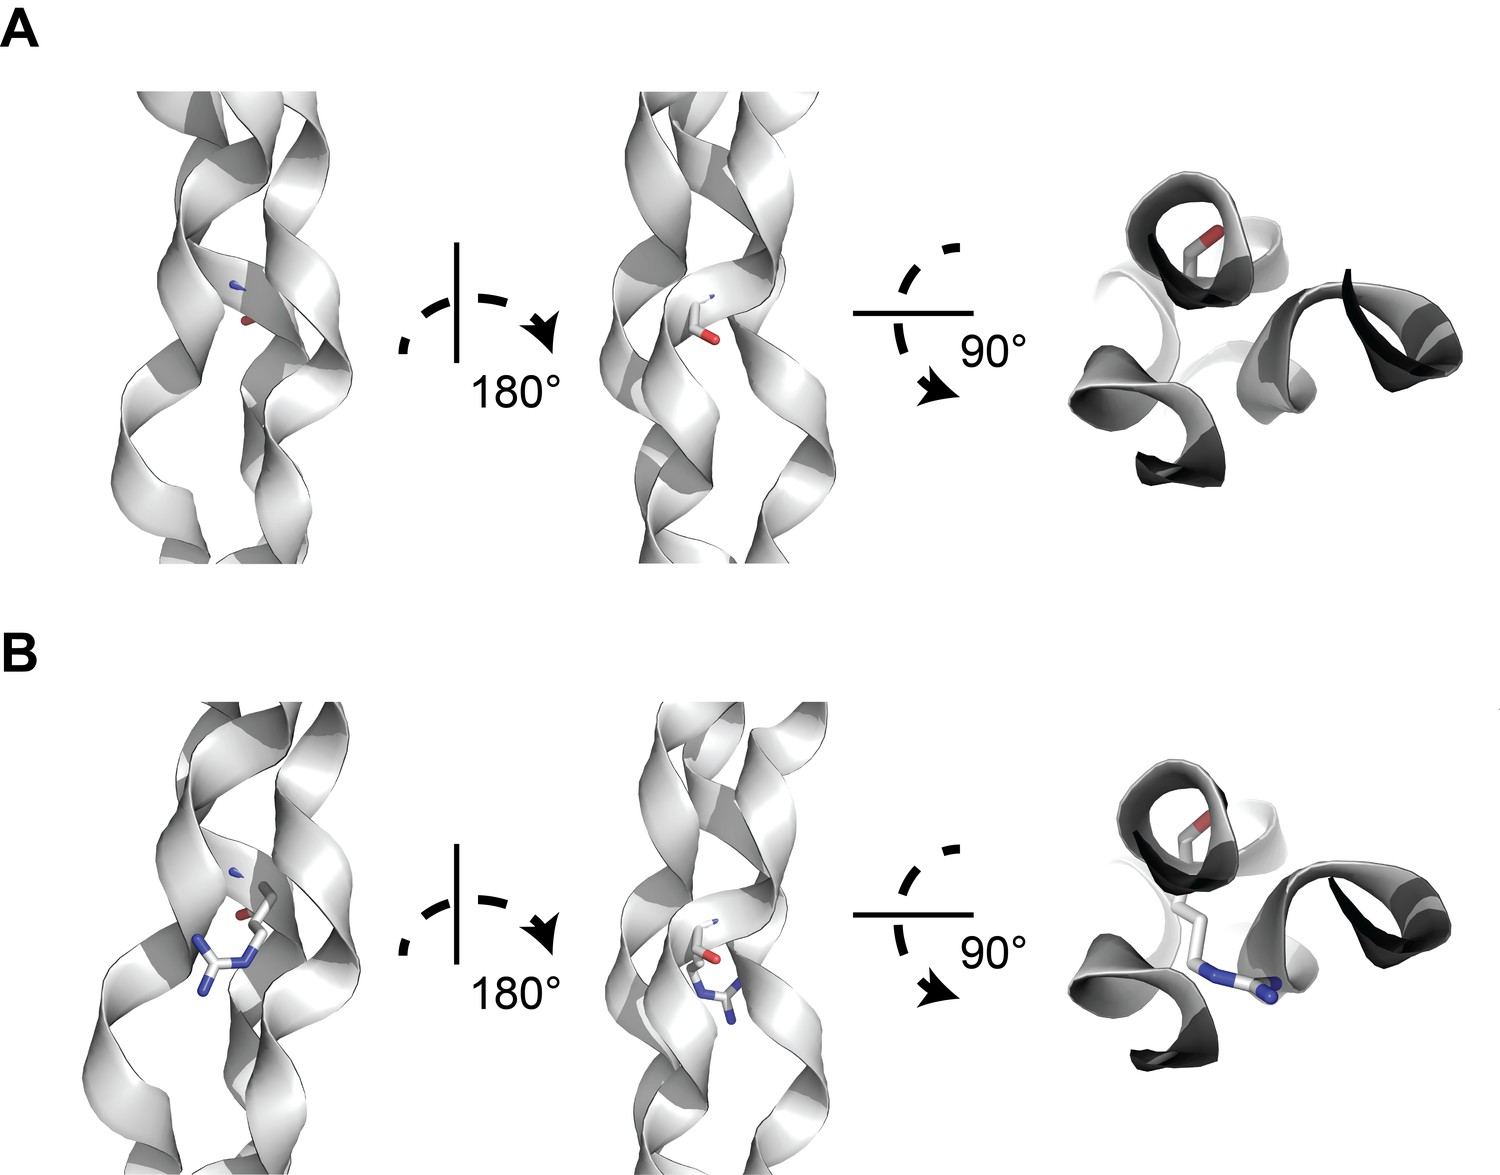
A structural model of glycine-to-arginine substitution within a collagen triple helix.
(A) Structure of a prototypical triple collagen fiber, adapted from Bella et al. Within the triple helix motif of alpha-1 collagen proteins, repeating triples of glycine-X-Y, where X is typically a hydroxylated proline and Y is proline, is thought to account for triple helix stability, with glycine occupying the crowded center of the three-stranded helix. (B) Substituting arginine for glycine destabilizes the triple helix by causing steric hindrance between the arginine side chain and the nearby amino acid side chains within the other two strands. Many types of substitutions within the triple helix motif from glycine can disrupt the stability of the triple helix through steric hindrance.
Figure 2—figure supplement 6
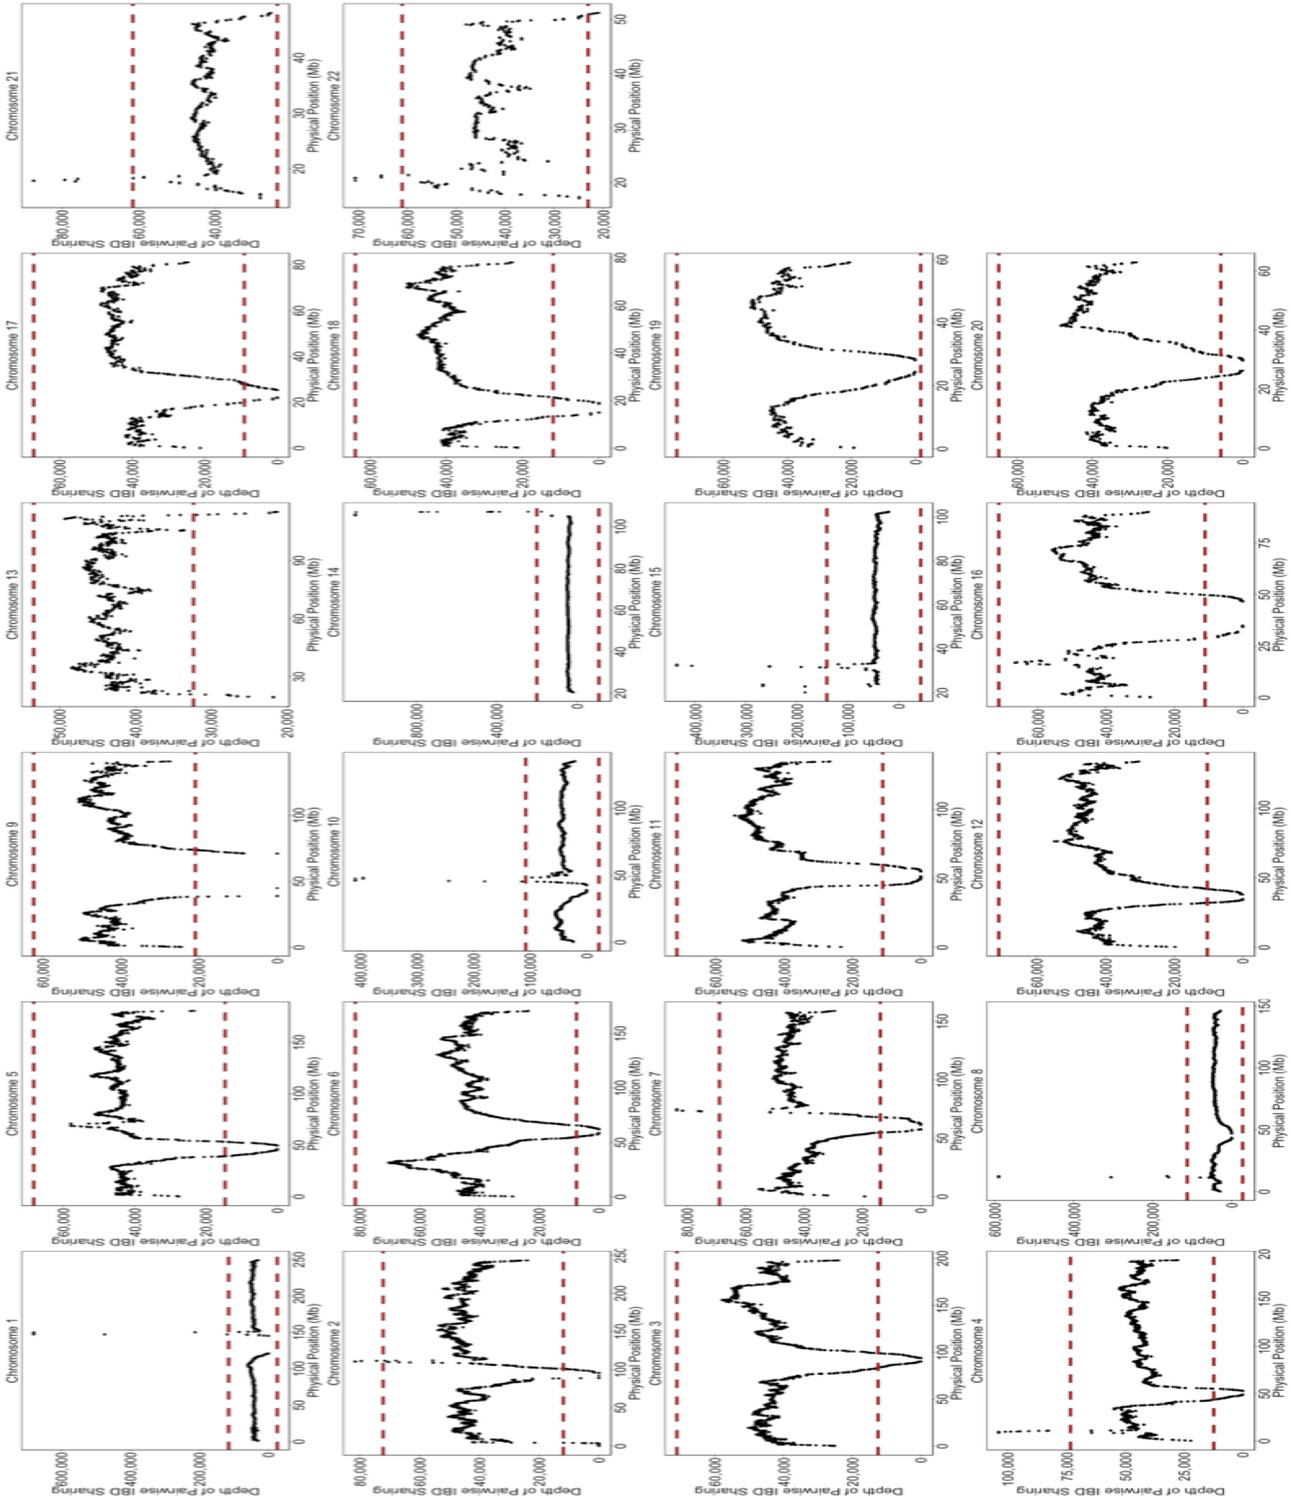
Depth of IBD-sharing across the genome in BioMe.
The ‘depth’ of IBD sharing, defined as the number of pairwise IBD haplotypes that cover a given locus in the genome, was calculated along each chromosome. Each plot here represents IBD sharing along a given chromosome, with the x-axis representing the physical position, and the y-axis representing the depth of pairwise IBD sharing. As a quality control measure, if a region of the genome exhibited excessive levels of IBD sharing. A region of excessive sharing was defined as a genomic region where the depth of IBD-sharing exceeded 4 standard deviations from the genome-wide mean (4 standard deviations is represented here by the red-dashed line). We excluded any IBD-haplotypes that fell within these regions of excessive sharing, as this feature indicative of a region with high levels of false positives.
Figure 2—figure supplement 7
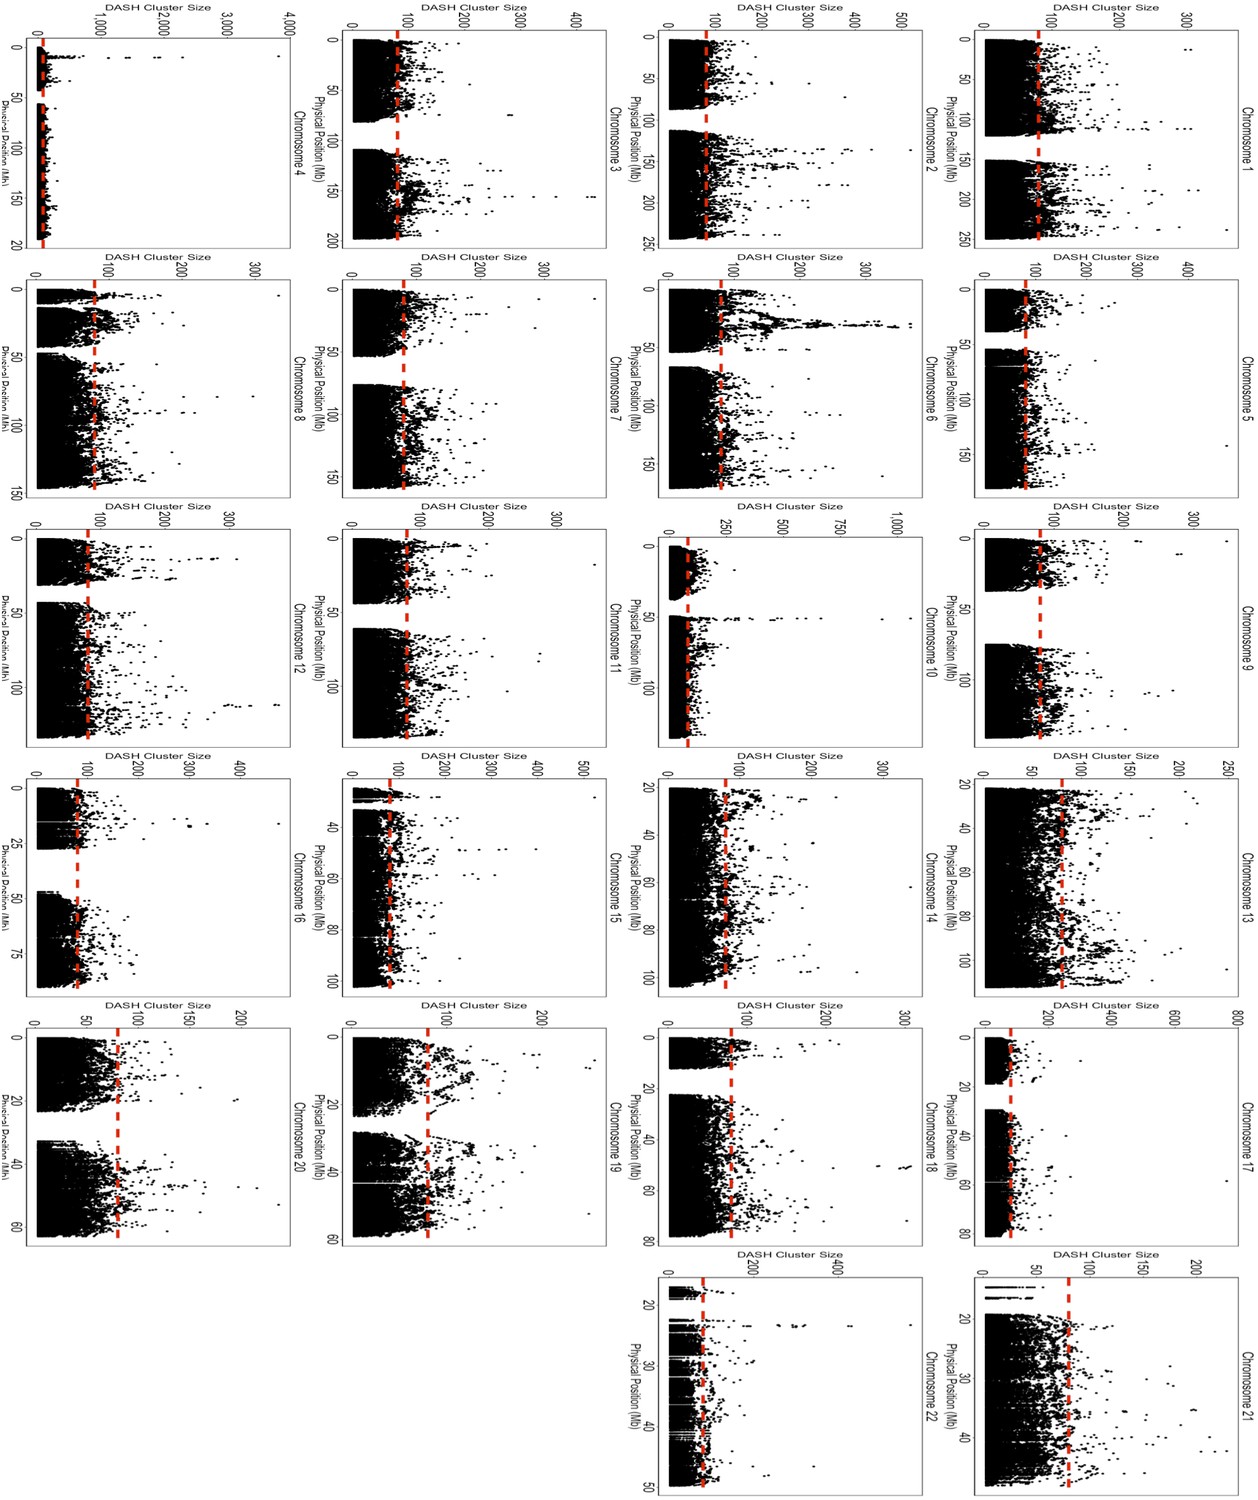
Size of Homologous IBD-Clique Membership Across the Genome in BioMe.
We plotted the membership size of IBD-cliques along the genome for each chromosome. Similar to the depth of pairwise IBD sharing, excessive numbers of individuals belonging to the same IBD-clique is indicative that the clique may be a false positive. As a quality control measure, we removed any IBD-cliques that fell within regions of the genome where the number of individual members exceeded 4 standard deviations of the genome-wide mean clique size.
Figure 3 with 1 supplement
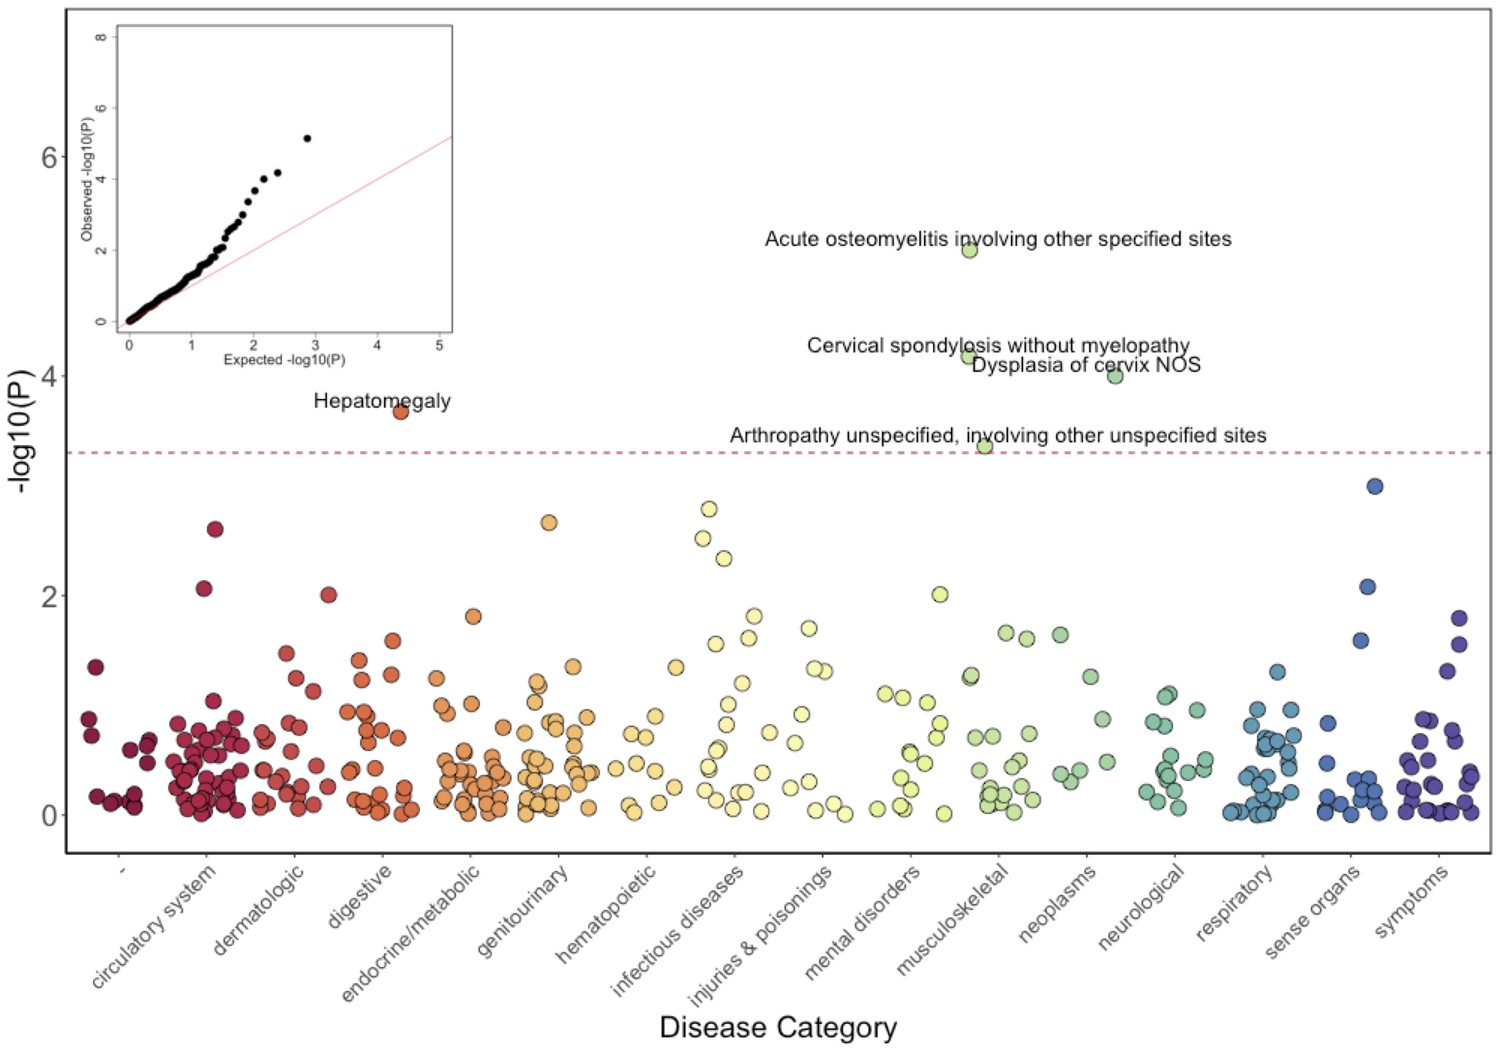
Phenome-Wide Association Study (PheWAS) of COL27A1.pG697R carriers vs ICD9 billing codes derived from the Electronic Health Records (EHR) under a general linear model (GLM).
Five billing codes achieve significance (FDR adjusted p<0.05). Three of the five significant ICD9 codes are in category of musculoskeletal disorders.
Figure 3—figure supplement 1
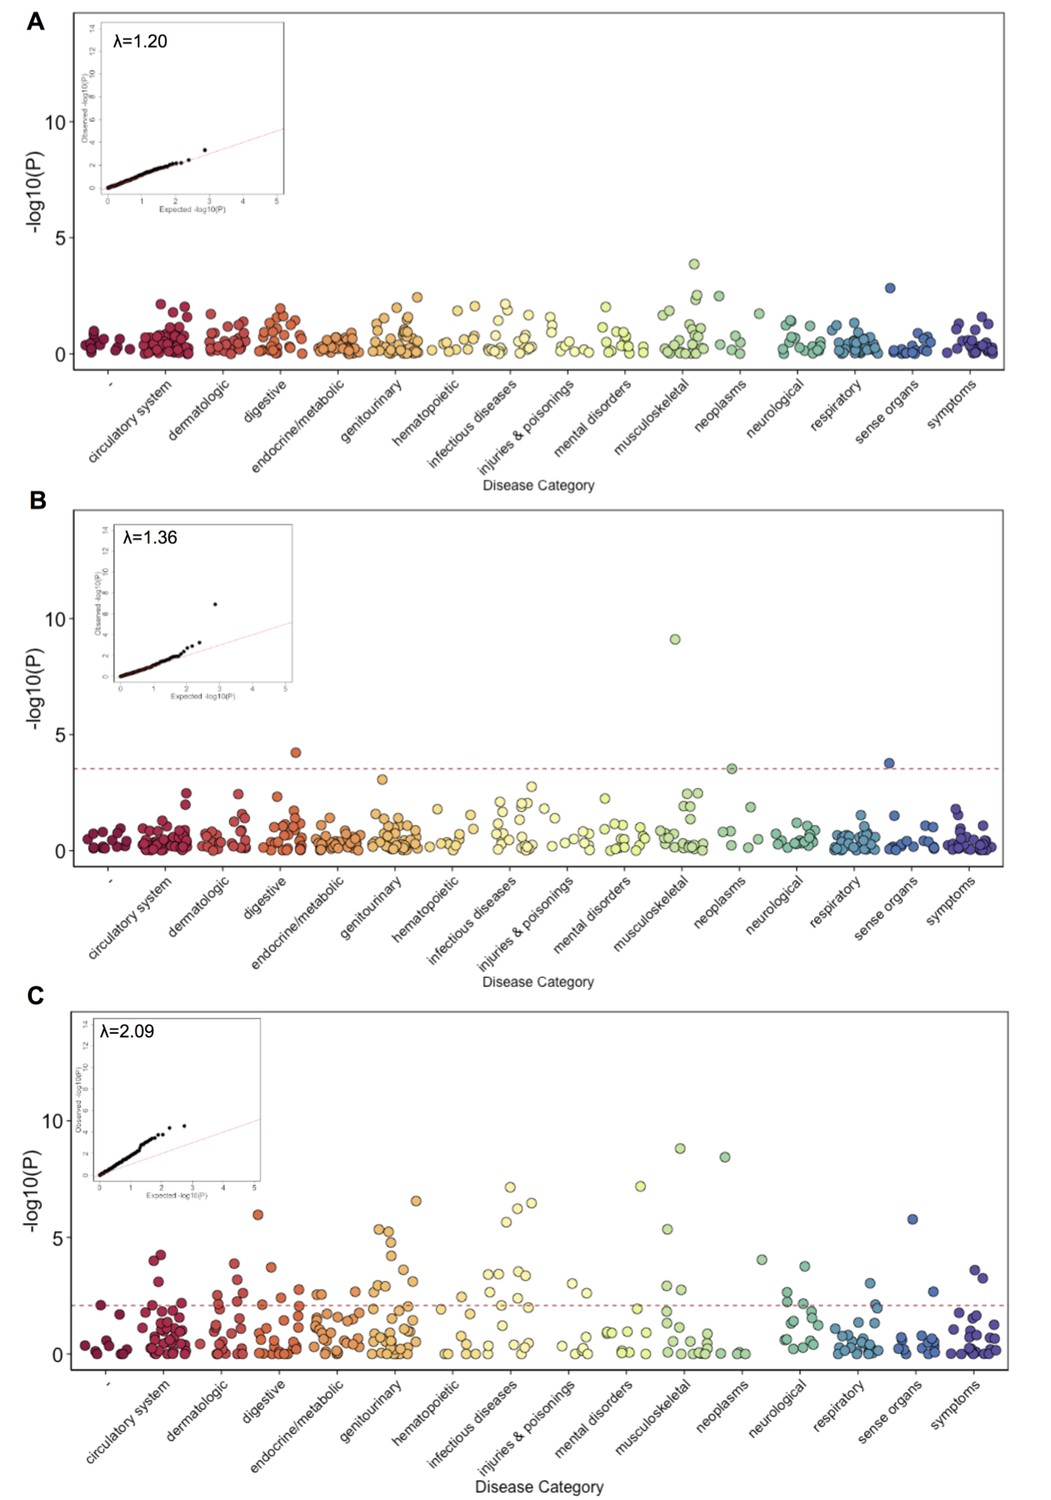
Phenome Wide Association (PheWAS) under three alternative models.
(A) The results of running PheWAS using SPAtest. (B) The results of running PheWAS using GCTA. (C) The results of running PheWAS using the Firth test.
Figure 4 with 2 supplements
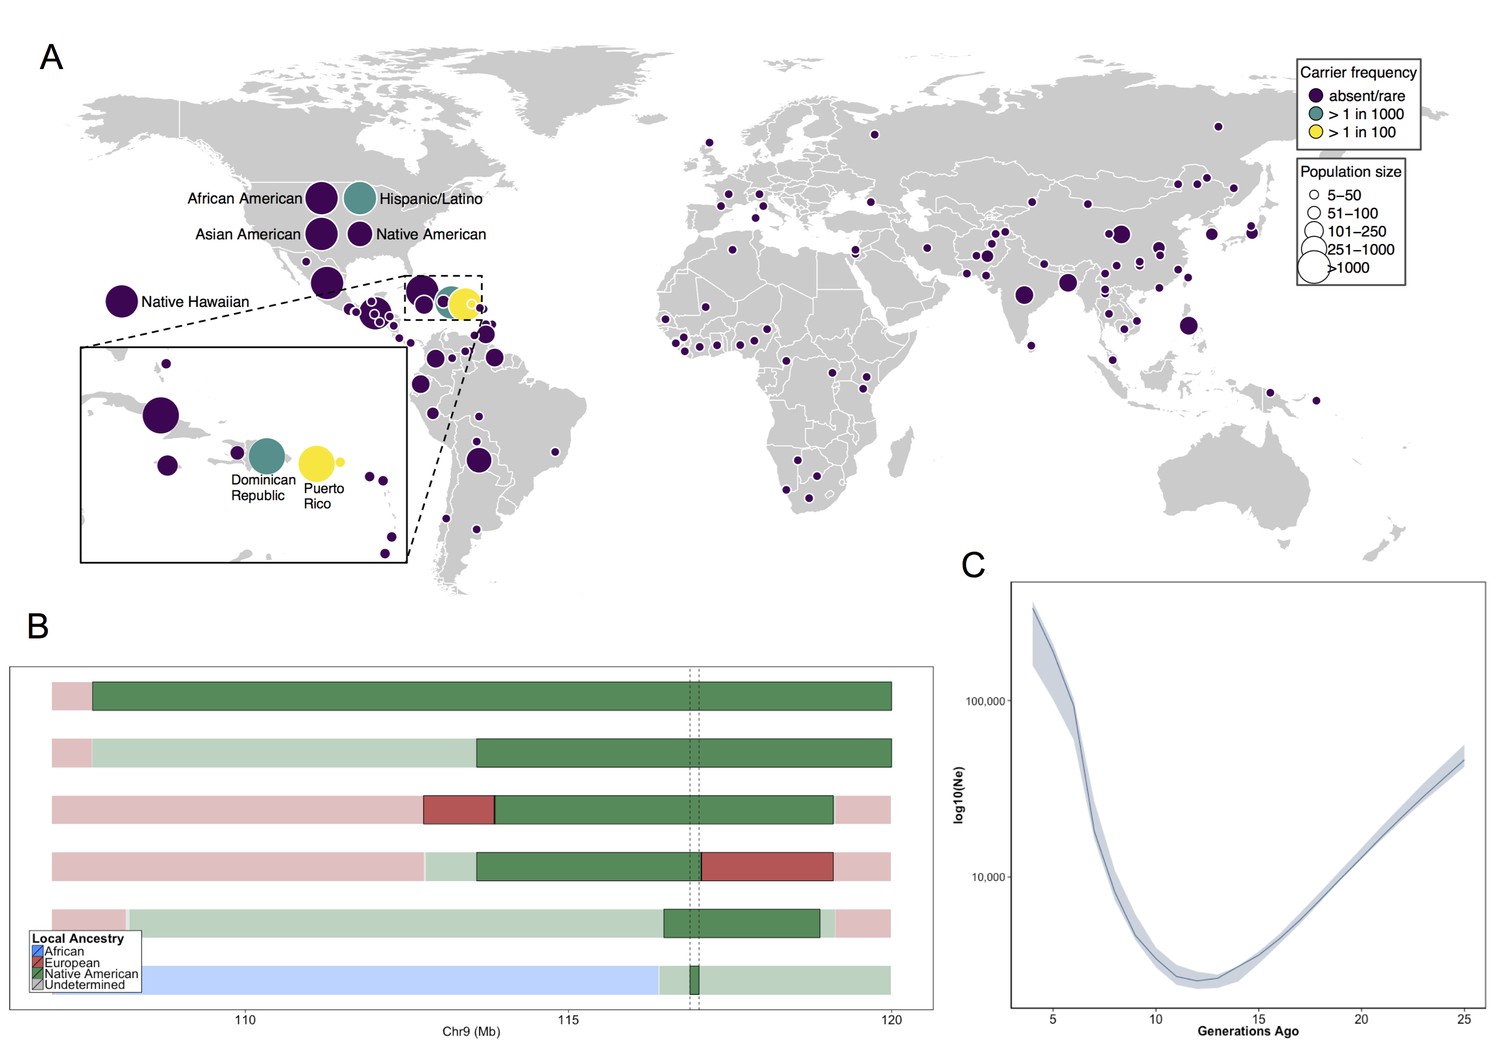
Allele frequency distribution and demographic history of COL27A1.pG697R.
(A) Global carrier frequency of COL27A1.pG697R in a multi-ethnic database of over 57,000 individuals representing 112 populations. The variant is absent or very rare in most populations (purple), at 1:746 and 1:346 carrier frequency amongst individuals from the Dominican Republic and Hispanic/Latino/as in the United States (green), and at 1:51 and 1:9 carrier frequency amongst individuals from Puerto Rico and St. Thomas (yellow). (B) Joint analysis of identity-by-descent and local ancestry haplotypes in three individuals homozygous for the COL27A1.pG697R variant. A large 15 cM interval on chromosome 9 is shown with local ancestry inferred as African (blue), European (red) and Native American (green), with shading to indicating the boundaries of the IBD haplotypes. The location of COL27A1 is indicated by the dashed line (C) Effective population size of the Puerto Rican discovery population (N = 2816) over the past 4–25 generations inferred from the tract length distribution of IBD haplotypes suggests that the ancestral population underwent a bottleneck approximately 9–14 generations ago. 95% confidence intervals are represented by blue ribbon.
Figure 4—figure supplement 1
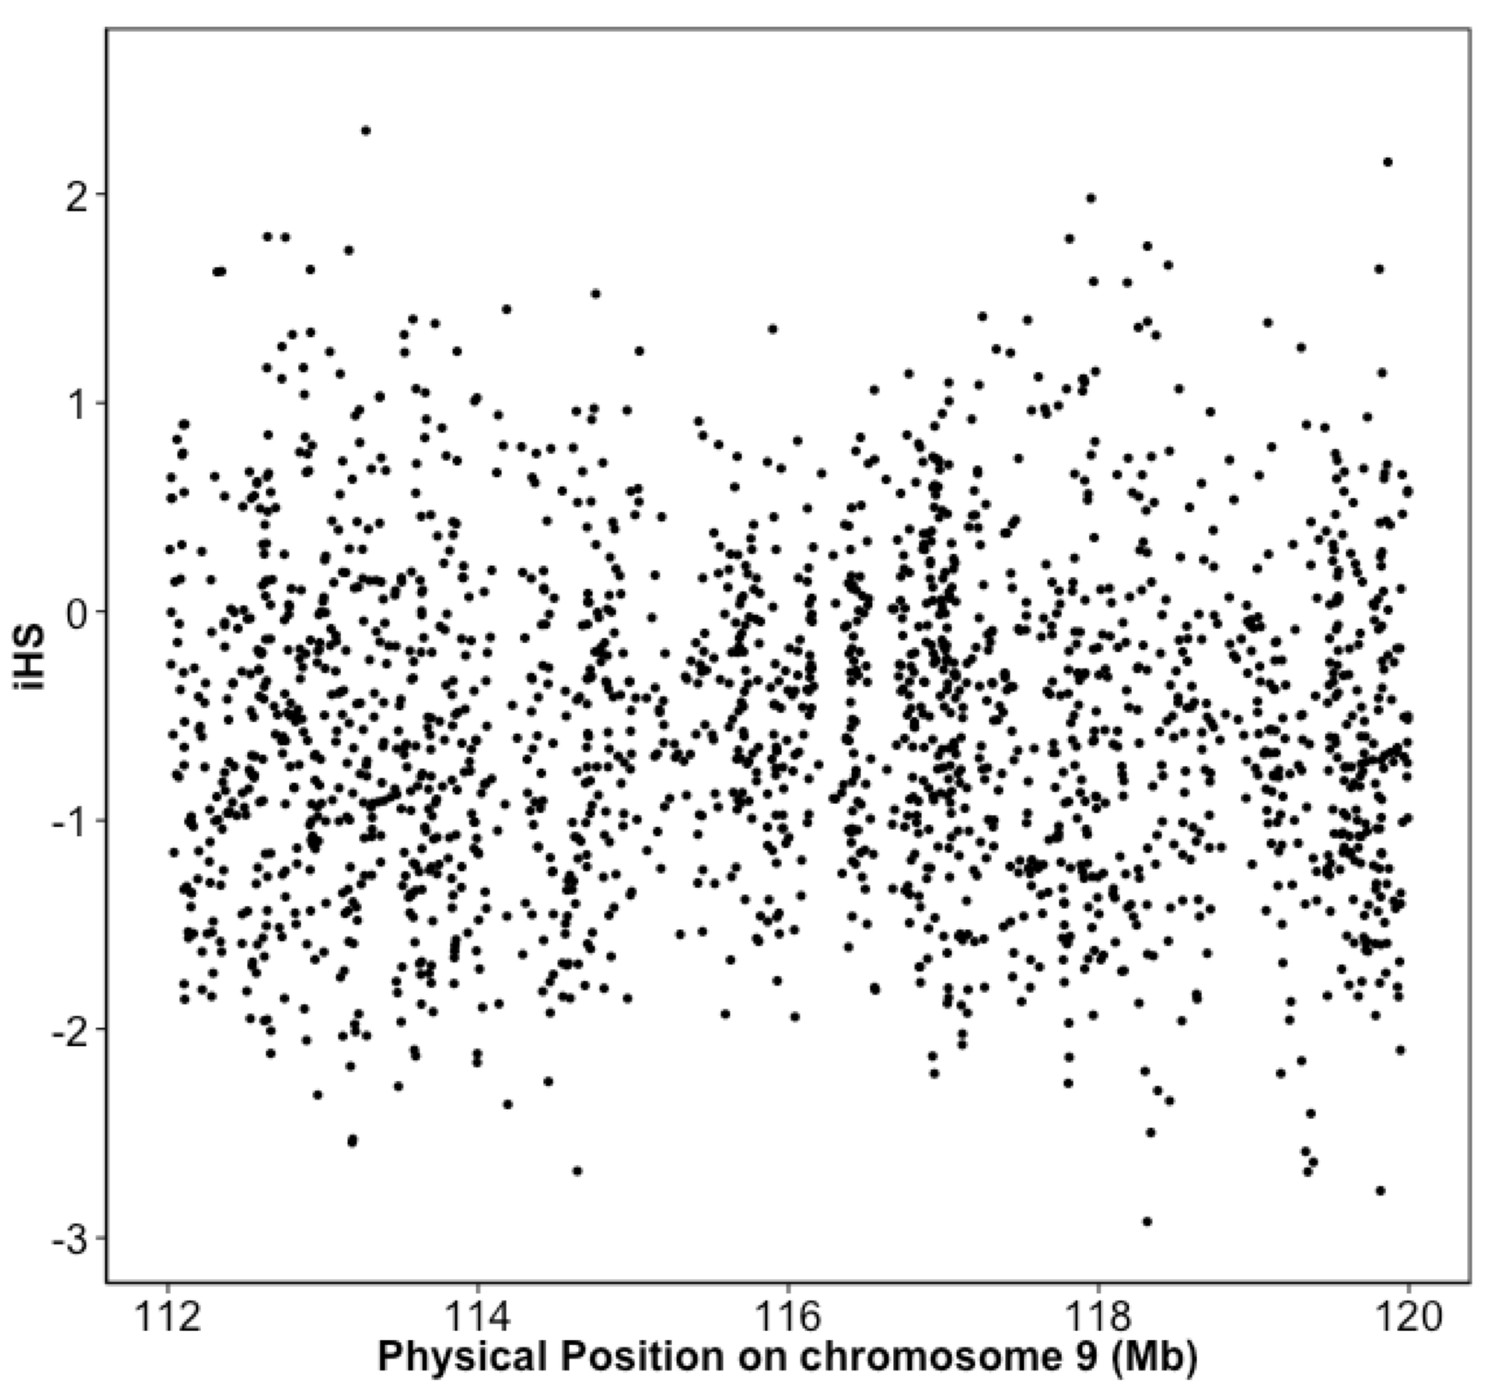
Integrated haplotype score (iHS) in Puerto Rican ancestry individuals at the 9q32 Locus reveals no evidence of selection.
iHS scores were calculated along chromosome 9 for BioMe individuals inferred to be of Puerto Rican ancestry. No inflation of the iHS score was observed at the 9q32 locus.
Figure 4—figure supplement 2
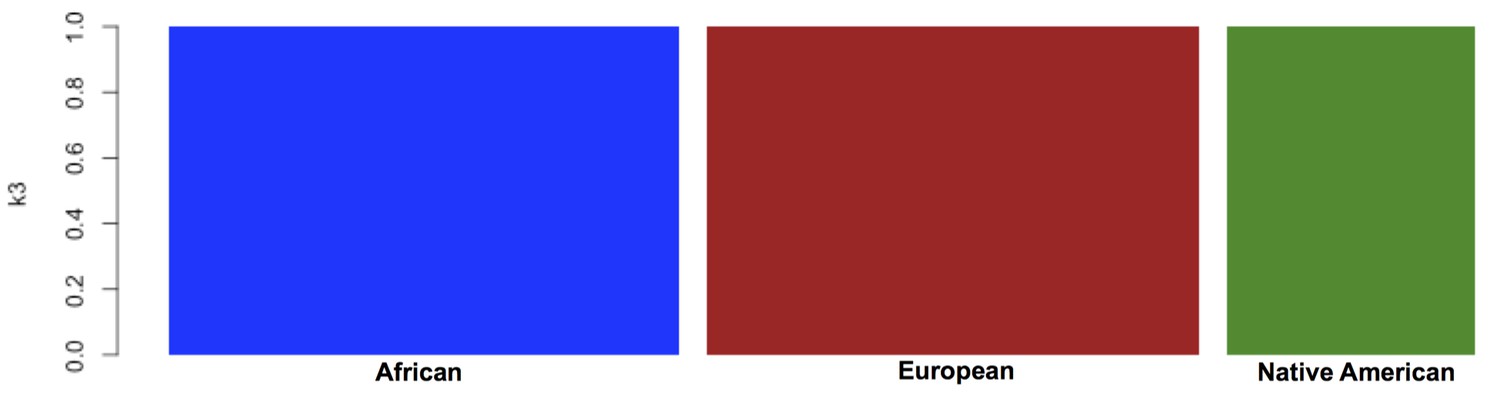
Global ancestry proportions for the individuals used as reference samples for RelateAdmix in the BioMe H/L.
Global ancestry was calculated using the software ADMIXTURE at k = 3. Each bar on the x-axis represents a reference population. Individuals have been grouped based on the ancestral populations that they are intended to represent: The YRI from the 1KGP were selected to represent African ancestral populations, the CEU from the 1KGP to represent European ancestral populations, and a separate Native American reference panel to represent Native American ancestry. The y-axis represents the proportion of each ancestral component ‘k’ that has been inferred by ADMIXTURE to compose each individual’s genome (each summing to 1). Here, the components inferred by ADMIXTURE broadly correspond to African ancestry (blue), European ancestry (red) and Native American ancestry (green). The selected reference samples do not exhibit any continental admixture.
Tables
Table 1
Clinical characteristics of five BioMe participants homozygote, thirty-four carriers and thirty-one non-carriers of the COL27A1.pG697R variant using evidence documented in Electronic Health Records (including billing and procedural codes, laboratory, radiologic, and progress notes) compared to features previously reported in Flynn et al. (2010), and Steel et al., 1993 for 27 children and 7 adults with Steel syndrome.
https://doi.org/10.7554/eLife.25060.016| Characteristics | EHR-Documented evidence | LiteratureHomozygous children | LiteratureHomozygous Adults | BioMeHomozygousAdults | BioMeHeterozygousAdults <55yoa | BioMeControlsAdults <55yoa |
|---|---|---|---|---|---|---|
| Sample size (Gender) | N (N of females) | 27 (9) | 7(6) | 5 (3) | 34(20) | 31(23) |
| Age | Mean age (years) | 12.8 | 35.4 | 51.6 | 41.8 | 40.6 |
| Described Characteristics | EHR-Documented Medical History | N(%) | N(%) | N(%) | N(%) | N(%) |
| Short Stature | Height >= 2 s.d. from pop mean | 27 (100) | 7 (100) | 5 (100) | 0 (0) | 0 (0) |
| Bilateral hip dislocation | Congenital hip dislocation | 4 | 0 | 0 | ||
| Leg length discrepancy | 1 | 0 | 0 | |||
| Total | 27(100) | 7(100) | 5 (100) | 0 (0) | 0 (0) | |
| Radial head dislocation | Elbow contractures | 24 (89) | 7 (100) | 1 (20) | 0 (0) | 0 (0) |
| Carpal coalition | Wrist deformity | 1 | 2 | 1 | ||
| Lunotriquetial fusion | 1 | 0 | 0 | |||
| Carpel tunnel | 0 | 3 | 3 | |||
| Total | 24 (89) | 6 (86) | 2 (40) | 5(15) | 4(13) | |
| Scoliosis | Scoliosis | 12 (44) | 6 (86) | 2 (40) | 8 (24) | 4 (13) |
| Pes cavus | Pes cavus | 12 (44) | 0 (0) | 0 (0) | 0 (0) | 0 (0) |
| Cervical spine anomalies | Cervical stenosis | 3 | 5 | 0 | ||
| Cervical discitis | 1 | 0 | 0 | |||
| Cervical spondylosis | 2 | 7 | 3 | |||
| Cervical cord compression | 3 | 3 | 1 | |||
| Total | 3 (9) | 0 (0) | 4 (80) | 7 (21) | 3 (10) | |
| Other Characteristics | EHR-Documented Medical History | N(%) | N(%) | N(%) | ||
| Other spine anomalies | Lumbar spine | - | - | 1 (20) | 10 (29) | 5 (16) |
| Thoracic spine | - | - | 1 (20) | 5(15) | 4(13) | |
| Other skeletal disease | Osteoporosis or osteopenia | - | - | 3 (60) | 3(9) | 1 (3) |
| Arthritis or degenerative changes | - | - | 3 (60) | 13(38) | 6 (19) | |
| Relevant surgical Interventions | Hip replacement | - | - | 3 (60) | 0 (0) | 0 (0) |
| Knee replacement | - | - | 2 (40) | 0 (0) | 0 (0) | |
| Cervical spine | - | - | 3 (60) | 2 (6) | 1 (3) | |
| Lumbar spine | - | - | 1 (20) | 1 (3) | 0 (0) | |
| Thoracic spine | - | - | 2 (40) | 1 (3) | 1 (3) |
Table 2
Top five significantly PheWAS associated ICD9 codes in COL27A1.pG697R carriers (N = 106) compared to non-carriers (N = 4480).
https://doi.org/10.7554/eLife.25060.019| Disease category | ICD9 code | Short description | Number of diagnoses among carriers N (%) | Number of diagnoses among non-carriers N (%) | Odds ratio (5% confidence intervals) | P-value |
|---|---|---|---|---|---|---|
| Neoplasms | 622.10 | Dysplasia of cervix, not otherwise specified | 6 (5.7) | 62 (1.4) | 5.4 (2.3–12.6) | 1.0 × 10⁻⁴ |
| Musculoskeletal | 716.98 | Arthropathy unspecified, involving other unspecified sites | 4 (3.8) | 48 (1.1) | 5.8 (2.2–15.3) | 4.4 × 10⁻⁴ |
| Musculoskeletal | 721.00 | Cervical spondylosis without myelopathy | 5 (4.5) | 74 (1.6) | 5.4 (2.4–12.3) | 6.6 × 10⁻⁵ |
| Musculoskeletal | 730.08 | Acute osteomyelitis involving other specified sites | 3 (2.8) | 6 (0.1) | 34.5 (7.4–162) | 7.1 × 10⁻⁶ |
| Digestive | 789.10 | Hepatomegaly | 3 (2.8) | 17 (0.4) | 11.6 (3.2–42.2) | 2.1 × 10⁻⁴ |
Additional files
-
Supplementary file 1
Summary statistics for 4-18X whole genome sequencing in 4 homozygotes
- https://doi.org/10.7554/eLife.25060.023
-
Supplementary file 2
Summary of variants on chromosome 9 at the identity-by-descent mapping interval 112–120 cM.
- https://doi.org/10.7554/eLife.25060.024
-
Supplementary file 3
Concordance of true COL27A1.pG697R genotype status with IBD-clique membership and imputed variant.
- https://doi.org/10.7554/eLife.25060.025
-
Supplementary file 4
Summary of COL27A1.p697R in a Multi-ethnic Population in over 50,000 Individuals from 112 global populations.
Populations indicated in italics are from the Human Genomes Diversity Panel, all others were genotyped as part of the Population Architecture using Genomics and Epidemiology Study.
- https://doi.org/10.7554/eLife.25060.026
-
Transparent reporting form
- https://doi.org/10.7554/eLife.25060.027
Download links
A two-part list of links to download the article, or parts of the article, in various formats.
Downloads (link to download the article as PDF)
Open citations (links to open the citations from this article in various online reference manager services)
Cite this article (links to download the citations from this article in formats compatible with various reference manager tools)
Genetic identification of a common collagen disease in Puerto Ricans via identity-by-descent mapping in a health system
eLife 6:e25060.
https://doi.org/10.7554/eLife.25060


