High-intensity training enhances executive function in children in a randomized, placebo-controlled trial
- The University of Auckland, New Zealand
Figures
Figure 1
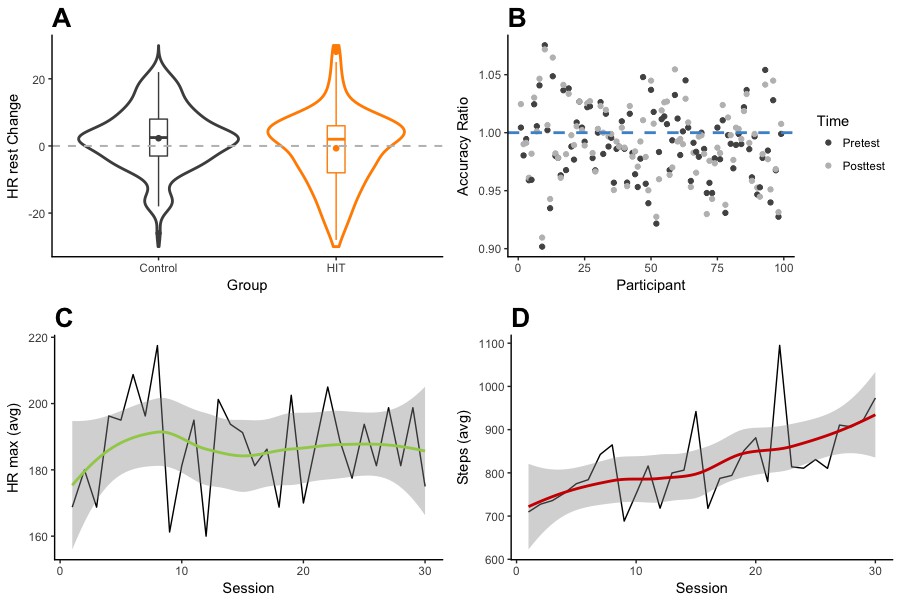
Physiological and effort-dependent measures.
(A) Violin and box plots showing change in resting heart rate (in BPM) between pretest and posttest sessions, for HIT and control groups. The dashed line shows the point of perfect equivalence between pretest and posttest measurements; values below the line indicate heart rate decreases. (B) Targeted range accuracy, defined as the ratio of maximum measured heart rate per participant (in BPM) to targeted heart rate (expected), averaged across sessions. Dark dots show accuracy based on pretest resting heart rate, whereas light dots show accuracy based on posttest resting heart rate. The blue dashed line represents the point of perfect agreement between individual targeted heart rate and maximum measured heart rate. Values above the line represent higher measured heart rate than expected from baseline. (C) Time series of the maximum heart rate (in BPM) measured for a single workout, averaged over participants, plotted across sessions. Smoothing is modeled via a non-parametric locally weighted regression using a nearest neighbor approach (i.e. local polynomial regression fitting). (D) Time series of the total number of steps for a single workout, averaged over participants, shown across sessions. Smoothing is modeled via a non-parametric locally weighted regression using a nearest neighbor approach (i.e. local polynomial regression fitting).
Figure 2

Cognitive improvements.
Violin and box plots showing gains in Cognitive Control (A) and Working Memory (B) between pretest and posttest sessions, for HIT and control groups.
Figure 3

Effect of BDNF allele on cognitive improvements.
μ and σ2 parameter estimates from the posterior distribution for the difference between BDNF met carriers and non-carriers (met66 – val66 homozygotes) in cognitive gains. Estimates were generated from 10,000 iterations, in one chain, with thinning interval of one (no data point discarded). (A) Trace of μ for Cognitive Control. (B) σ2 estimate for Cognitive Control. (C) Trace of μ for Working Memory. (D) σ2 estimate for Working Memory.
Figure 4
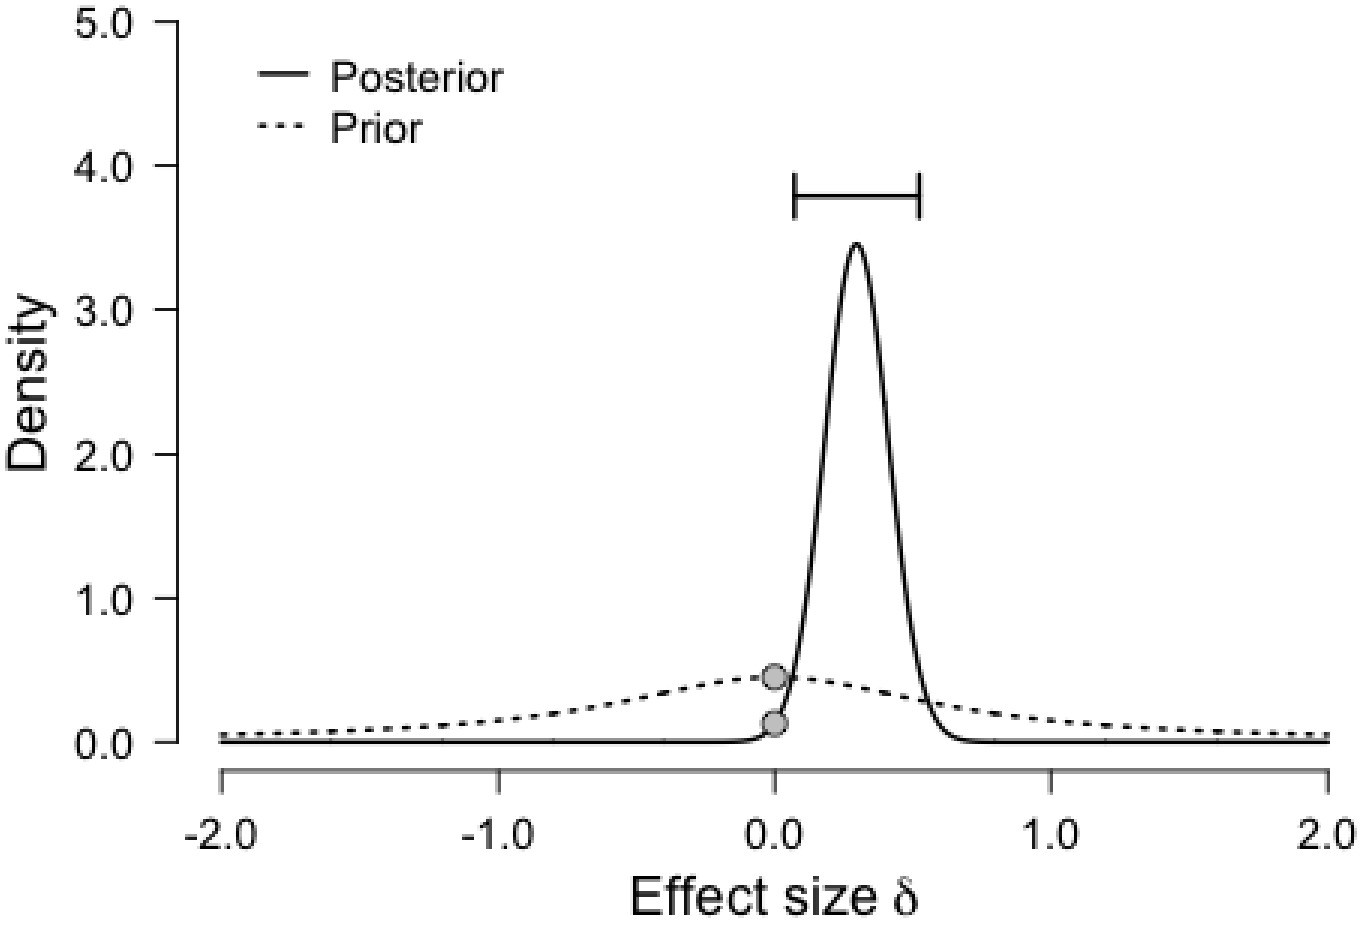
Prior and posterior distributions for the comparison between Conditions (HIT vs. Control) for Cognitive Control.
The graph shows the density of each distribution as a function of effect size, with the prior centered on the null effect.
Figure 5
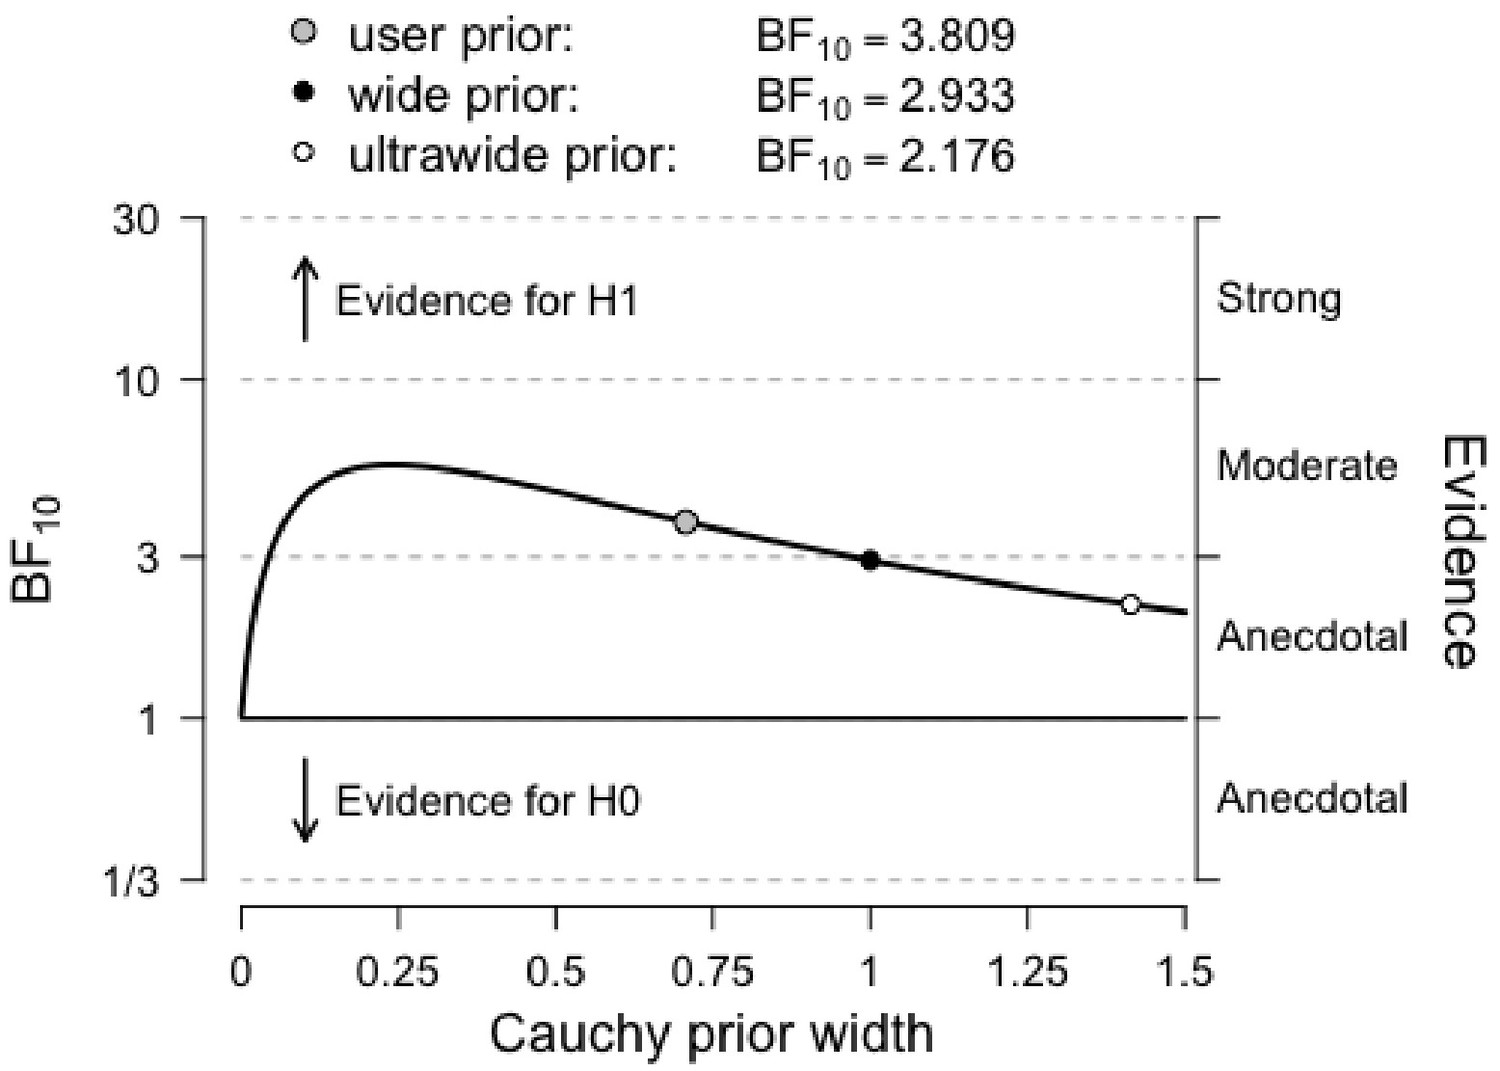
Bayes factor robustness check for the comparison between Conditions (HIT vs. Control) for Cognitive Control.
The figure shows our default prior, as well as wide and ultrawide priors. Importantly, the curve shows stronger evidence for our hypothesis with narrower priors, indicating that our conclusions are not based on a restricted range of priors.
Figure 6
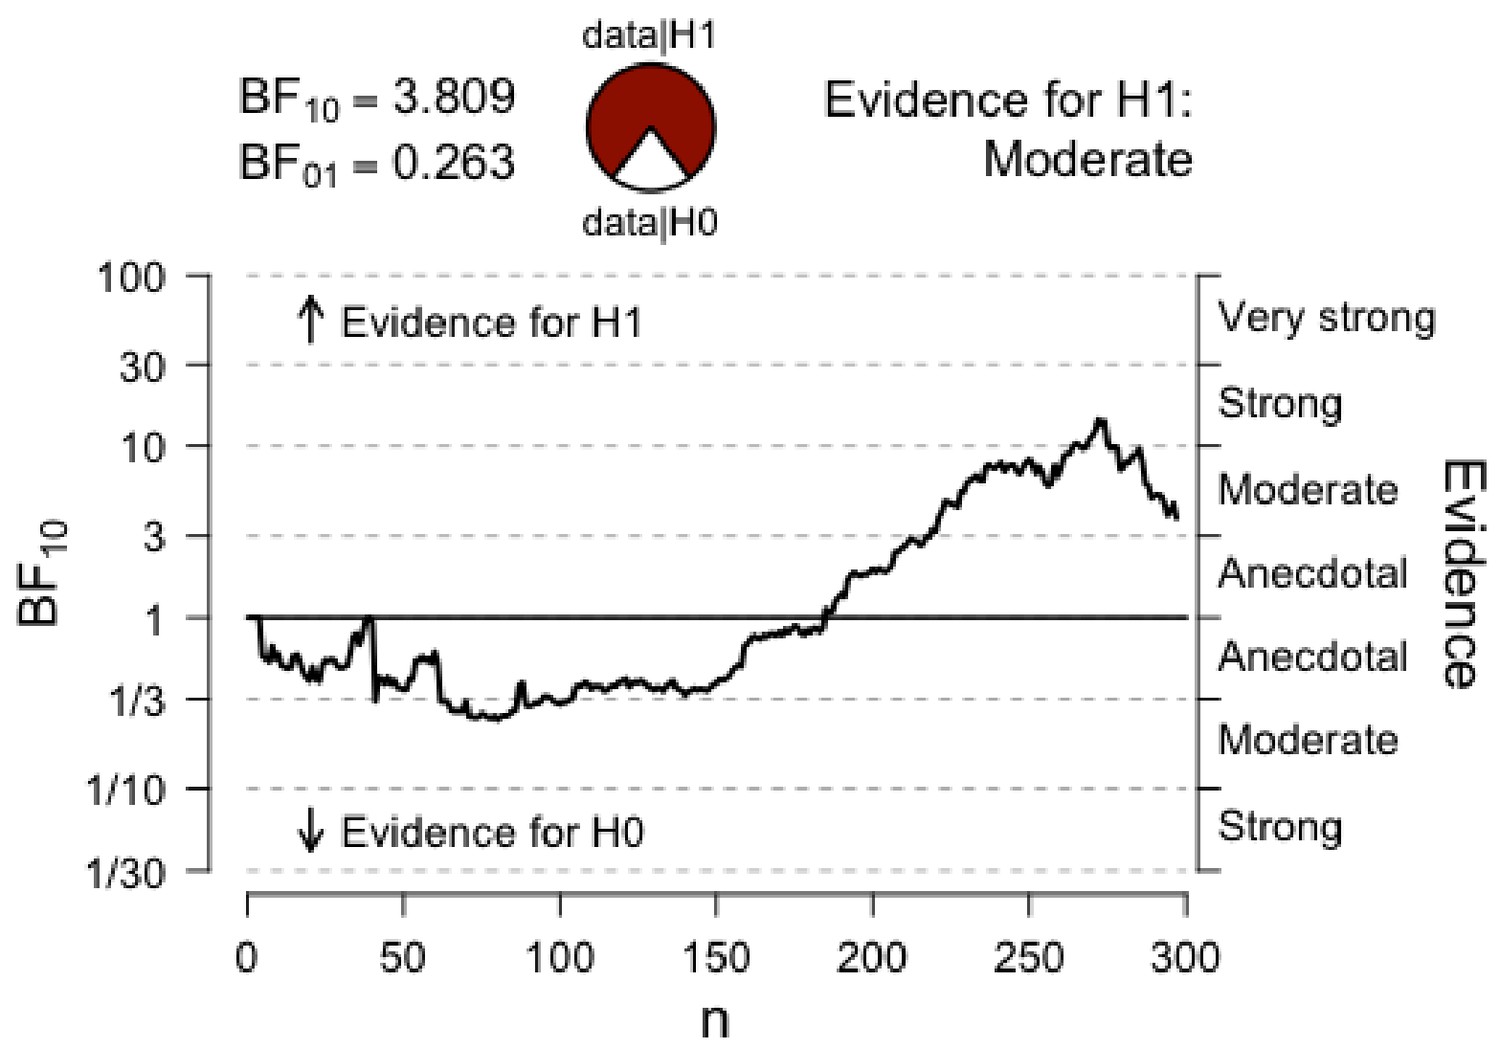
Sequential analysis.
The graph shows the strength of evidence (as expressed by BF10) as N increases.
Tables
Table 1
Exploratory factor analysis for cognitive measurements at baseline. F1 (Cognitive Control) and F2 (Working Memory) refer to the factor loadings of each measure from an exploratory factor analysis with promax rotation (N = 287). Uniqueness represents the variance of each item not accounted for by the two factors.
| Measure | CC | WM | Uniqueness |
|---|---|---|---|
| Flanker | 0.89 | 0.21 | |
| Go/no-go | 0.71 | 0.48 | |
| Stroop | 0.55 | 0.71 | |
| Backward digit span | 0.70 | 0.51 | |
| Backward Corsi blocks | 0.27 | 0.91 | |
| Visual 2-back | 0.33 | 0.90 |
-
Note: Only factor loadings greater than. 25 are included in the table.
-
Table 1—source data 1
Scree plot for the exploratory factor analysis on all cognitive measures.
The plot shows the eigenvalues associated with each factor plotted against each factor, and supports the decision to retain two factors.
- https://doi.org/10.7554/eLife.25062.005
-
Table 1—source data 2
Path diagram for the exploratory factor analysis on all cognitive measures.
F1 (Cognitive Control) and F2 (Working Memory) refer to the factors extracted from an exploratory factor analysis on all six cognitive measures, with promax rotation (N = 287).
- https://doi.org/10.7554/eLife.25062.006
Table 2
Model comparisons for the Cognitive Control construct (CC) with condition as a fixed factor. The table shows the probability of each model given the data P(M | Data), the corresponding Bayes Factor, BF10 and the percentage of error. The unconditional probability for each model is 0.2.
| Models | P(M | Data) | BFM | BF10 | Error (%) |
|---|---|---|---|---|
| Null | 1.01e −5 | 4.05e −5 | 1 | - |
| Session | 0.43 | 3.06 | 43120.06 | 0.98 |
| Condition | 2.32e −6 | 9.28e −6 | 0.23 | 3.93 |
| Main effects | 0.11 | 0.49 | 11143.87 | 4.52 |
| Interaction | 0.46 | 3.38 | 43792.87 | 5.52 |
Table 3
Model comparisons for the Working Memory construct (WM) with condition as a fixed factor. The table shows the probability of each model given the data P(M | Data), the corresponding Bayes Factor, BF10 and the percentage of error. The unconditional probability for each model is 0.2.
| Models | P(M | Data) | BFM | BF10 | Error (%) |
|---|---|---|---|---|
| Null | 2.92e −13 | 1.17e −12 | 1 | - |
| Session | 4.49e −4 | 0 | 1.54e + 9 | 1.23 |
| Condition | 1.84e −13 | 17349e −13 | 0.63 | 0.69 |
| Main effects | 3.15e −4 | 0 | 1.08e + 9 | 3.13 |
| Interaction | 1 | 5232.68 | 3.42e + 12 | 2.91 |
Table 4
Model comparisons for the Cognitive Control construct (CC) with BDNF polymorphism as a fixed factor. The table shows the probability of each model given the data P(M | Data), the corresponding Bayes Factor, BF10 and the percentage of error. The unconditional probability for each model is 0.2.
| Models | P(M | Data) | BFM | BF10 | Error (%) |
|---|---|---|---|---|
| Null | 0.01 | 0.06 | 1 | - |
| Session | 0.03 | 0.12 | 1.94 | 1.45 |
| Condition | 0.02 | 0.10 | 1.65 | 2.60 |
| Main effects | 0.04 | 0.19 | 3.05 | 1.71 |
| Interaction | 0.89 | 31.17 | 59.49 | 24.61 |
Table 5
Model comparisons for the Working Memory construct (WM) with BDNF polymorphism as a fixed factor. The table shows the probability of each model given the data P(M | Data), the corresponding Bayes Factor, BF10 and the percentage of error. The unconditional probability for each model is 0.2.
| Models | P(M | Data) | BFM | BF10 | Error (%) |
|---|---|---|---|---|
| Null | 2.47e −5 | 9.90e −5 | 1 | - |
| Session | 0 | 0.01 | 79.86 | 0.77 |
| Condition | 3.52e −5 | 1.41e −4 | 1.42 | 0.69 |
| Main effects | 0 | 0.01 | 155.37 | 5.84 |
| Interaction | 0.99 | 675.92 | 40159.39 | 3.51 |
Table 6
Mean cognitive scores (SDs) for the two conditions at pretest and posttest. Scores are scaled and centered for each task (z-transformed by row).
| HIT | Control | |||
|---|---|---|---|---|
| Pretest | Posttest | Pretest | Posttest | |
| Flanker | −0.14 (1.20) | 0.16 (0.66) | −0.06 (1.18) | 0.04 (0.85) |
| Go/no-go | −0.09 (1.11) | 0.08 (0.96) | 0.01 (1.04) | 0.01 (0.88) |
| Stroop | −0.11 (1.19) | 0.16 (0.38) | −0.09 (1.31) | 0.04 (0.83) |
| Backward digit span | −0.14 (1.07) | 0.25 (0.55) | −0.13 (1.34) | 0.02 (0.82) |
| Backward Corsi blocks | −0.13 (1.55) | 0.31 (0.35) | −0.17 (0.92) | 0.00 (0.73) |
| Visual 2-back | −0.24 (1.62) | 0.33 (0.51) | −0.06 (0.74) | −0.03 (0.69) |
Table 7
Demographics and sample characteristics at baseline.
| HIT | Controls | Total | |
|---|---|---|---|
| Sample (N) Gender | 152 90 f./62 m. | 153 97 f./56 m. | 305 187 f./118 m. |
| Age | 9.87 (1.81) | 9.96 (1.68) | 9.91 (1.74) |
| Handedness (LH/Ambid.) | 18/3 | 14/3 | 32/6 |
| BMI | 18.1 (3.92) | 18.51 (7.89) | 18.31 (6.25) |
| LD diagnosis | 13 | 16 | 29 |
| Previous remediation | 8 | 14 | 22 |
| Videogaming | 2.32 (0.95) | 2.43 (0.96) | 2.38 (0.97) |
| Physical exercise | 3.06 (0.8) | 2.95 (0.78) | 3.03 (0.81) |
| Happiness | 4.53 (1.25) | 4.61 (1.22) | 4.55 (1.27) |
| Sleep quality | 4.07 (1.36) | 4.11 (1.39) | 4.11 (1.41) |
| General health | 4.88 (1.05) | 4.84 (1.01) | 4.82 (1.06) |
Additional files
-
Reporting standard 1
CONSORT flow diagram.
- https://doi.org/10.7554/eLife.25062.018
-
Reporting standard 2
CONSORT check list.
- https://doi.org/10.7554/eLife.25062.019
Download links
A two-part list of links to download the article, or parts of the article, in various formats.
Downloads (link to download the article as PDF)
Open citations (links to open the citations from this article in various online reference manager services)
Cite this article (links to download the citations from this article in formats compatible with various reference manager tools)
High-intensity training enhances executive function in children in a randomized, placebo-controlled trial
eLife 6:e25062.
https://doi.org/10.7554/eLife.25062


