Na+ influx via Orai1 inhibits intracellular ATP-induced mTORC2 signaling to disrupt CD4 T cell gene expression and differentiation
- Washington University School of Medicine, United States
Figures
Figure 1 with 1 supplement
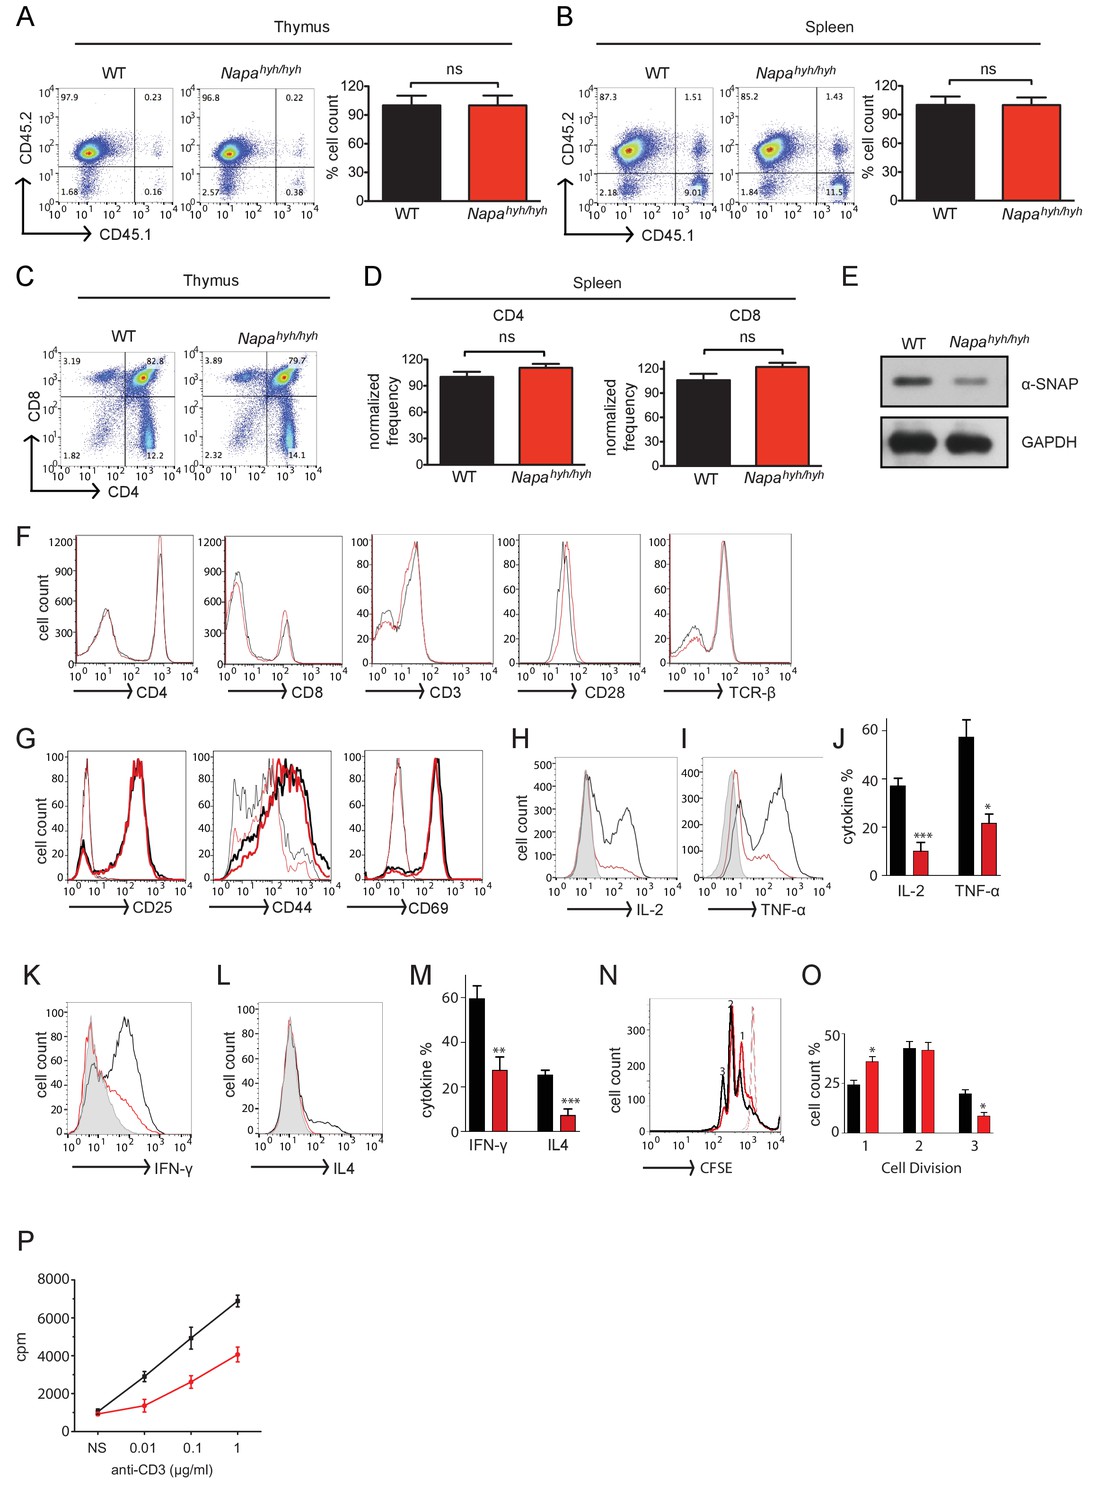
Napahyh/hyh mice harbor severe defects in the production of CD4 T cell effector cytokines.
(A and B) Representative FACS profile showing the reconstitution efficiency and average cell yields from the thymus (A) and spleen (B) of WT (black) and Napahyh/hyh (red) fetal liver chimeric mice. (n = 25). (C and D) Representative FACS profile showing the percentage of CD4+, CD8+ single and double positive thymocytes in CD45.2+ gated cells from WT and Napahyh/hyh chimera thymus (C) and spleen (D). (n = 10). (E) Representative Western blot for α-SNAP in whole cell lysates prepared from WT and Napahyh/hyh lymph node cells. (n > 5). (F) FACS profiles showing surface staining of WT (black) and Napahyh/hyh (red) spleen cells with anti-CD4, anti-CD8, anti-CD3, anti-CD28 and anti-TCRβ antibodies respectively. (n = 5). (G) FACS profiles of resting (thin lines) and receptor stimulated (thick lines); WT (black) and Napahyh/hyh (red) CD4 T cells stained for various activation markers. (n = 3). (H–J) FACS profiles showing intracellular staining for IL-2 (H,J) and TNF-α (I,J) in WT (black) and Napahyh/hyh (red) CD4 T cells 6 hr post-stimulation. Grey peak shows unstimulated control. (n = 5 repeats from five chimeras each). (K–M) FACS profiles showing intracellular cytokine staining for Th1 (K,M) and Th2 (L,M) signature cytokines in polarized WT (black) and Napahyh/hyh (red) CD4 T lymphocytes. Grey peak shows undifferentiated control. (n = 3). (N,O) CFSE dilution profiles (N) and their quantifications (O), showing proliferation of WT (black) and Napahyh/hyh (red) CD4 T cells in response to plate bound anti-CD3 and anti-CD28 antibodies. Light traces show unstimulated control. (n = 3). (P) Representative plot showing proliferation of WT (black) and Napahyh/hyh (red) splenocytes in response to soluble anti-CD3 and anti-CD28, estimated using 3H thymidine incorporation. (n = 3). (See also Figure 1—figure supplement 1).
Figure 1—figure supplement 1
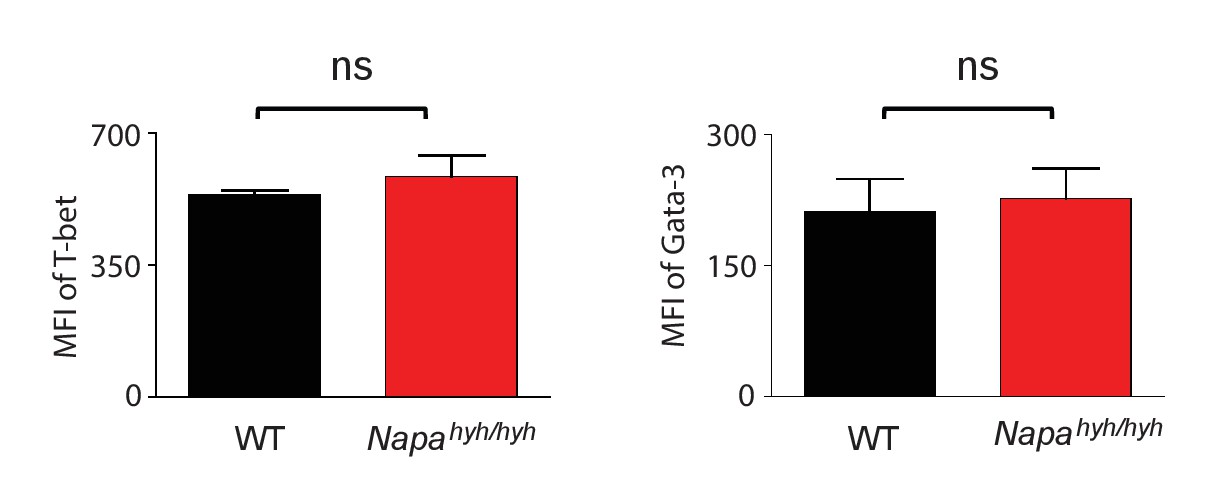
Bar plots showing the average MFIs of the intracellular staining for T-bet and GATA-3 in Th1 and Th2 differentiated WT (black) and Napahyh/hyh (red) CD4 T cells, respectively. (n = 3).
https://doi.org/10.7554/eLife.25155.003
Figure 2
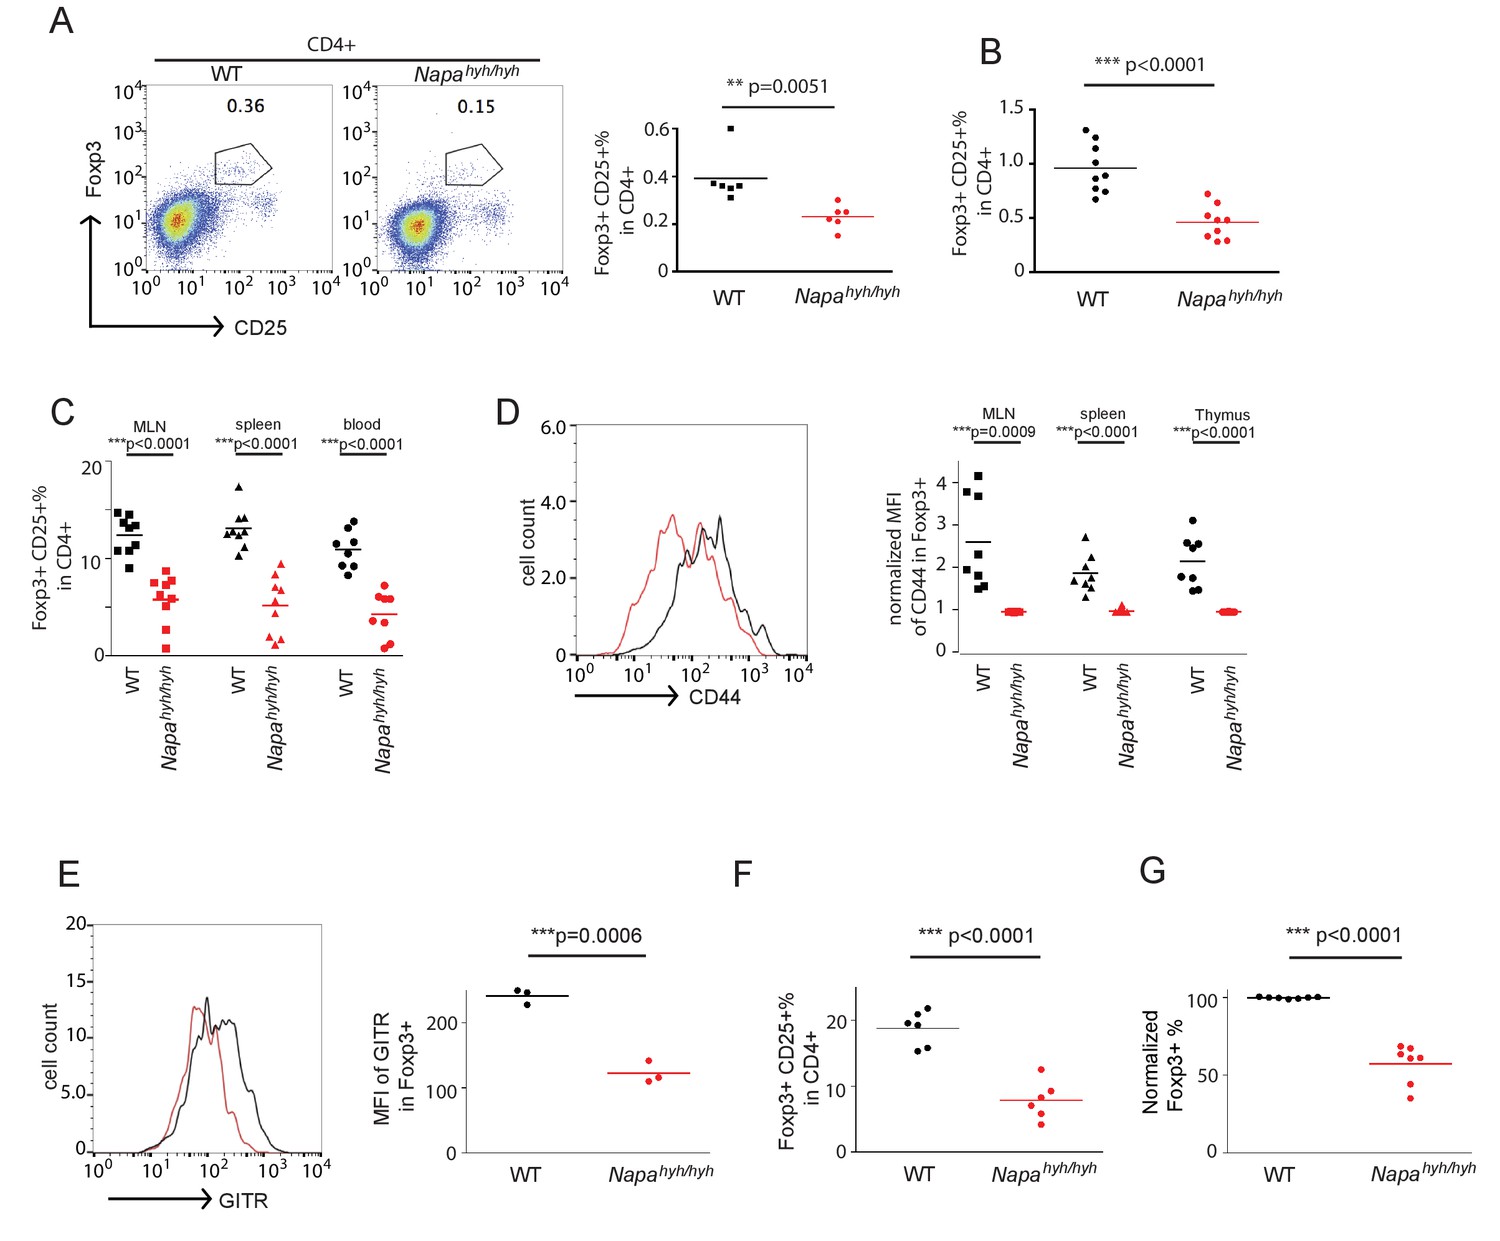
Napahyh/hyh mice harbor significant defects in the differentiation of Foxp3 regulatory T cells in vivo and in vitro.
(A) Representative FACS profiles and dot plot showing the percentage of Foxp3+CD25+ cells in the CD4+CD45.2+ population from WT and Napahyh/hyh chimera thymii. (n = 3 with 2 chimeras/experiment). (B) Dot plot showing the percentage of WT and Napahyh/hyh Foxp3+ cells in mixed chimera thymii. (n = 4 with 2–3 chimeras/experiment). p value from paired student’s t-test. (C) Dot plots showing the percentage of WT and Napahyh/hyh Foxp3+ cells in blood, spleen and mesenteric lymph nodes (MLN). (n = 4 with 2–3 chimeras/experiment). (D) Representative FACS profile and dot plots showing mean fluorescence intensity (MFI) of surface expression of CD44 on WT (black) and Napahyh/hyh (red) Foxp3+ cells from various lymphoid tissues of mixed chimeras. (n = 4 with 2 chimeras/experiment). (E) FACS profile and dot plot showing mean fluorescence intensity (MFI) of the surface expression of GITR on WT (black) and Napahyh/hyh (red) Foxp3+ cells from spleen. (n = 3). (F) Dot plot showing the percentage of WT and Napahyh/hyh Foxp3+ cells in the lamina propria CD4 T cells isolated from mixed chimeras. (n = 3 with 2 chimeras/experiment). (G) Dot plot showing the normalized percentage of WT (black) and Napahyh/hyh (red) Foxp3+ cells in in vitro-differentiated CD4 T cells. (n = 7). p value from paired student’s t test. (See also Figure 2—source data 1 and 2).
-
Figure 2—source data 1
Thymic Foxp3 Tregs in WT and Napahyh/hyh chimeras.
Single cell suspensions were prepared from WT and Napahyh/hyh fetal liver chimerathymii, counted and then stained for Foxp3, CD25, CD4, and CD45.2 as described in Figure 2A. The absolute numbers and percentages of Foxp3+CD25+ cells were then calculated in CD4 and CD45.2 double positive cells.
- https://doi.org/10.7554/eLife.25155.005
-
Figure 2—source data 2
Foxp3 iTregs in WT and Napahyh/hyh CD4 T cell cultures.
WT and Napahyh/hyh CD4 T cells were purified from the spleen and lymph nodes of chimeras and differentiated into Foxp3+ cells in vitro. Shown here are the absolute numbers and percentages of Foxp3 cells obtained from Figure 2G.
- https://doi.org/10.7554/eLife.25155.006
Figure 3
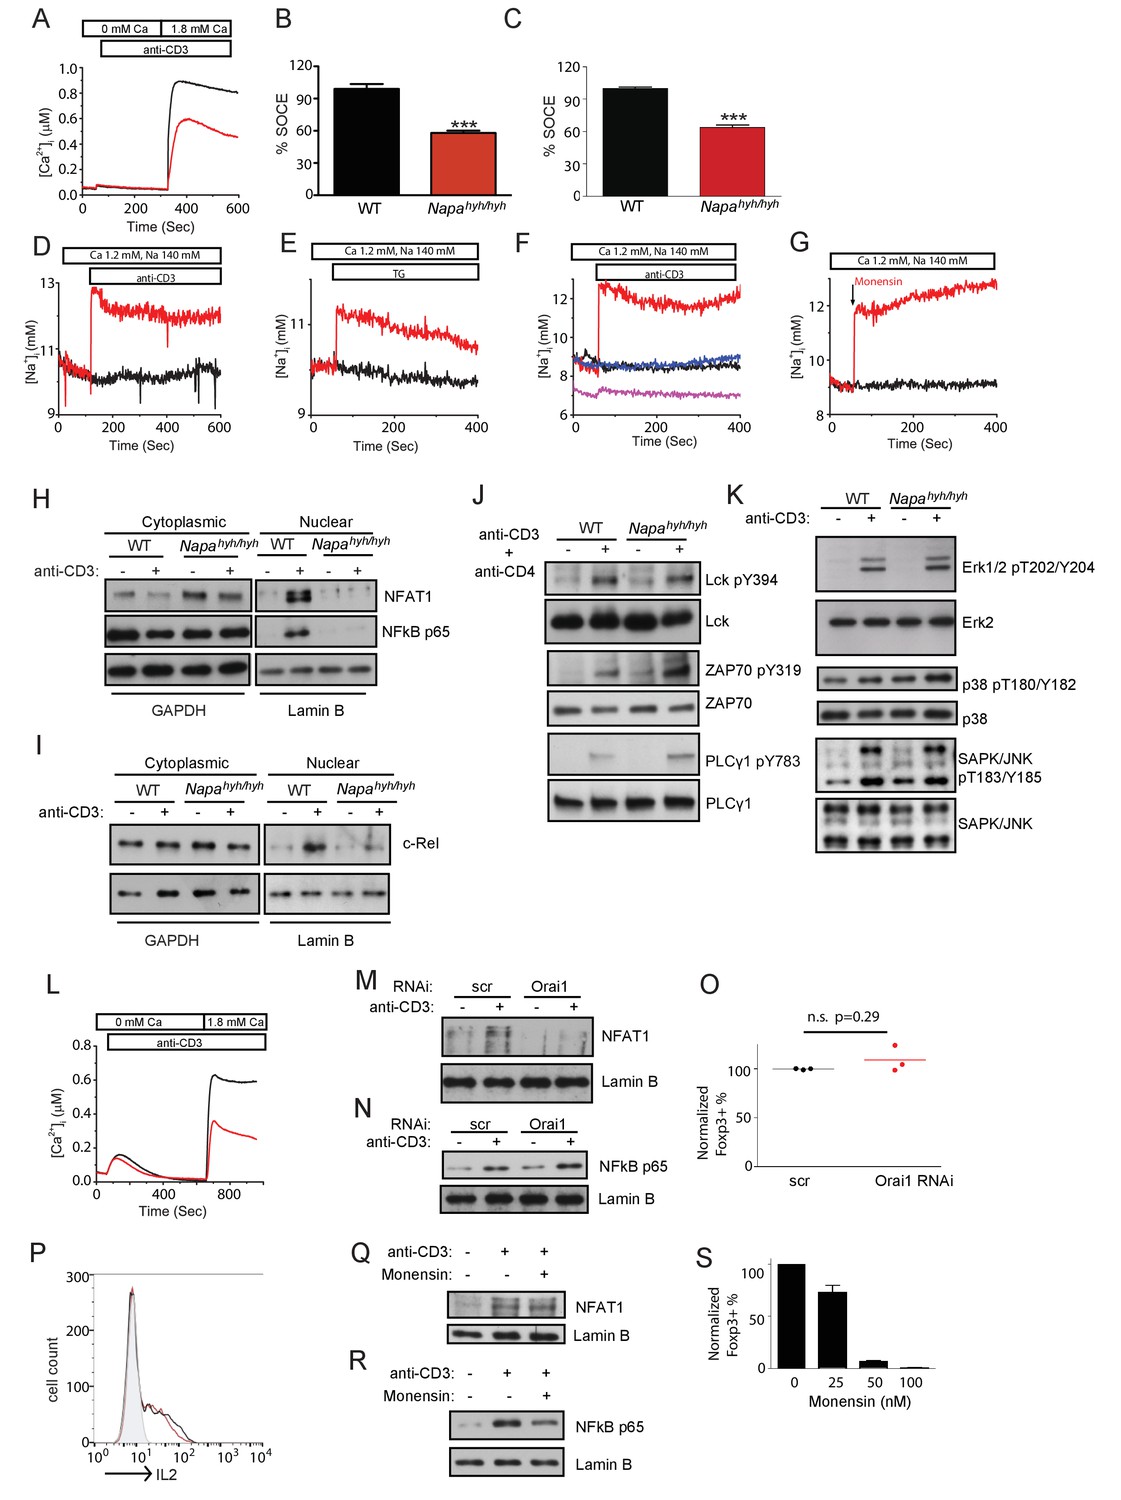
Orai1-mediated sodium influx inhibits Foxp3 iTreg differentiation by disrupting NFκB activation in Napahyh/hyh CD4 T cells.
(A–C) Representative Fura-2 profiles showing real-time change in average cytosolic calcium levels in WT (black) or Napahyh/hyh (red) CD4 T cells stimulated with anti-CD3 antibody (A and B) (n = 5 with~50 to 100 cells per experiment) or thapsigargin (TG) (C) (n = 3 with~50 to 100 cells per experiment). Percent SOCE was calculated by normalizing average WT response to 100 and then calculating the % response of Napahyh/hyh CD4 T cells. (D and E) Average SBFI profiles showing real-time change in [Na]i of WT (black) and Napahyh/hyh (red) CD4 T cells stimulated with anti-CD3 antibody (D) (n = 5 with~50 to 100 cells per experiment) or TG (E) (n = 1 with~50 to 100 cells per experiment). (F) Average SBFI profiles of anti-CD3-stimulated WT (black) and Napahyh/hyh CD4 T cells treated with scramble (scr) RNAi (red) or Orai1 RNAi (blue); (magenta) anti-CD3-stimulated Napahyh/hyh T cells where [Na]e was replaced with NMDG. (n = 1 with~50 to 100 cells per experiment). (G) SBFI profiles of WT CD4 T cells, treated with Monensin (red) or untreated (black). (n = 1 with~50 to 100 cells per experiment). (H,I) Western blot for cytosolic and nuclear NFAT1 and NFκB p65 (H) or c-Rel (I) in receptor-stimulated WT and Napahyh/hyh CD4 T cells. (n = 4). (J,K) Western blot for total and phospho-Lck, ZAP-70 and PLC- γ (J) and total and phospho-Erk1/2, p38 and Jnk (K) in receptor-stimulated WT and Napahyh/hyh CD4 T cell WCLs. (n = 3). (L) Representative Fura-2 profiles showing real-time change in average cytosolic calcium levels in scr (black) or Orai1 RNAi treated (red) CD4 T cells stimulated with anti-CD3 antibody. (n = 2 with~50 to 100 cells per experiment). (M,N) Western blot for cytosolic and nuclear NFAT (M) and NFκB p65 (N) in receptor-stimulated scr or Orai1 RNAi (Orai1) treated WT CD4 T cells. (O) Representative dot plot showing the normalized percentage of Foxp3+ cells in scr (black) and Orai1 RNAi treated (red) CD4 T cells differentiated in vitro. (n = 3), p value from paired student’s t-test. (P) FACS profiles showing intracellular IL-2 expression in WT CD4 T cells, receptor-stimulated in the presence (red) or absence (black) of monensin. (n = 2). (Q,R) Western blot for nuclear NFAT1 (Q) and NFκB p65 (R) in receptor stimulated WT CD4 T cells with or without monensin. (n = 2). (S) Bar plot showing % Foxp3+ cells differentiated in vitro, in the absence or presence of different doses of monensin. (n = 3).
Figure 4
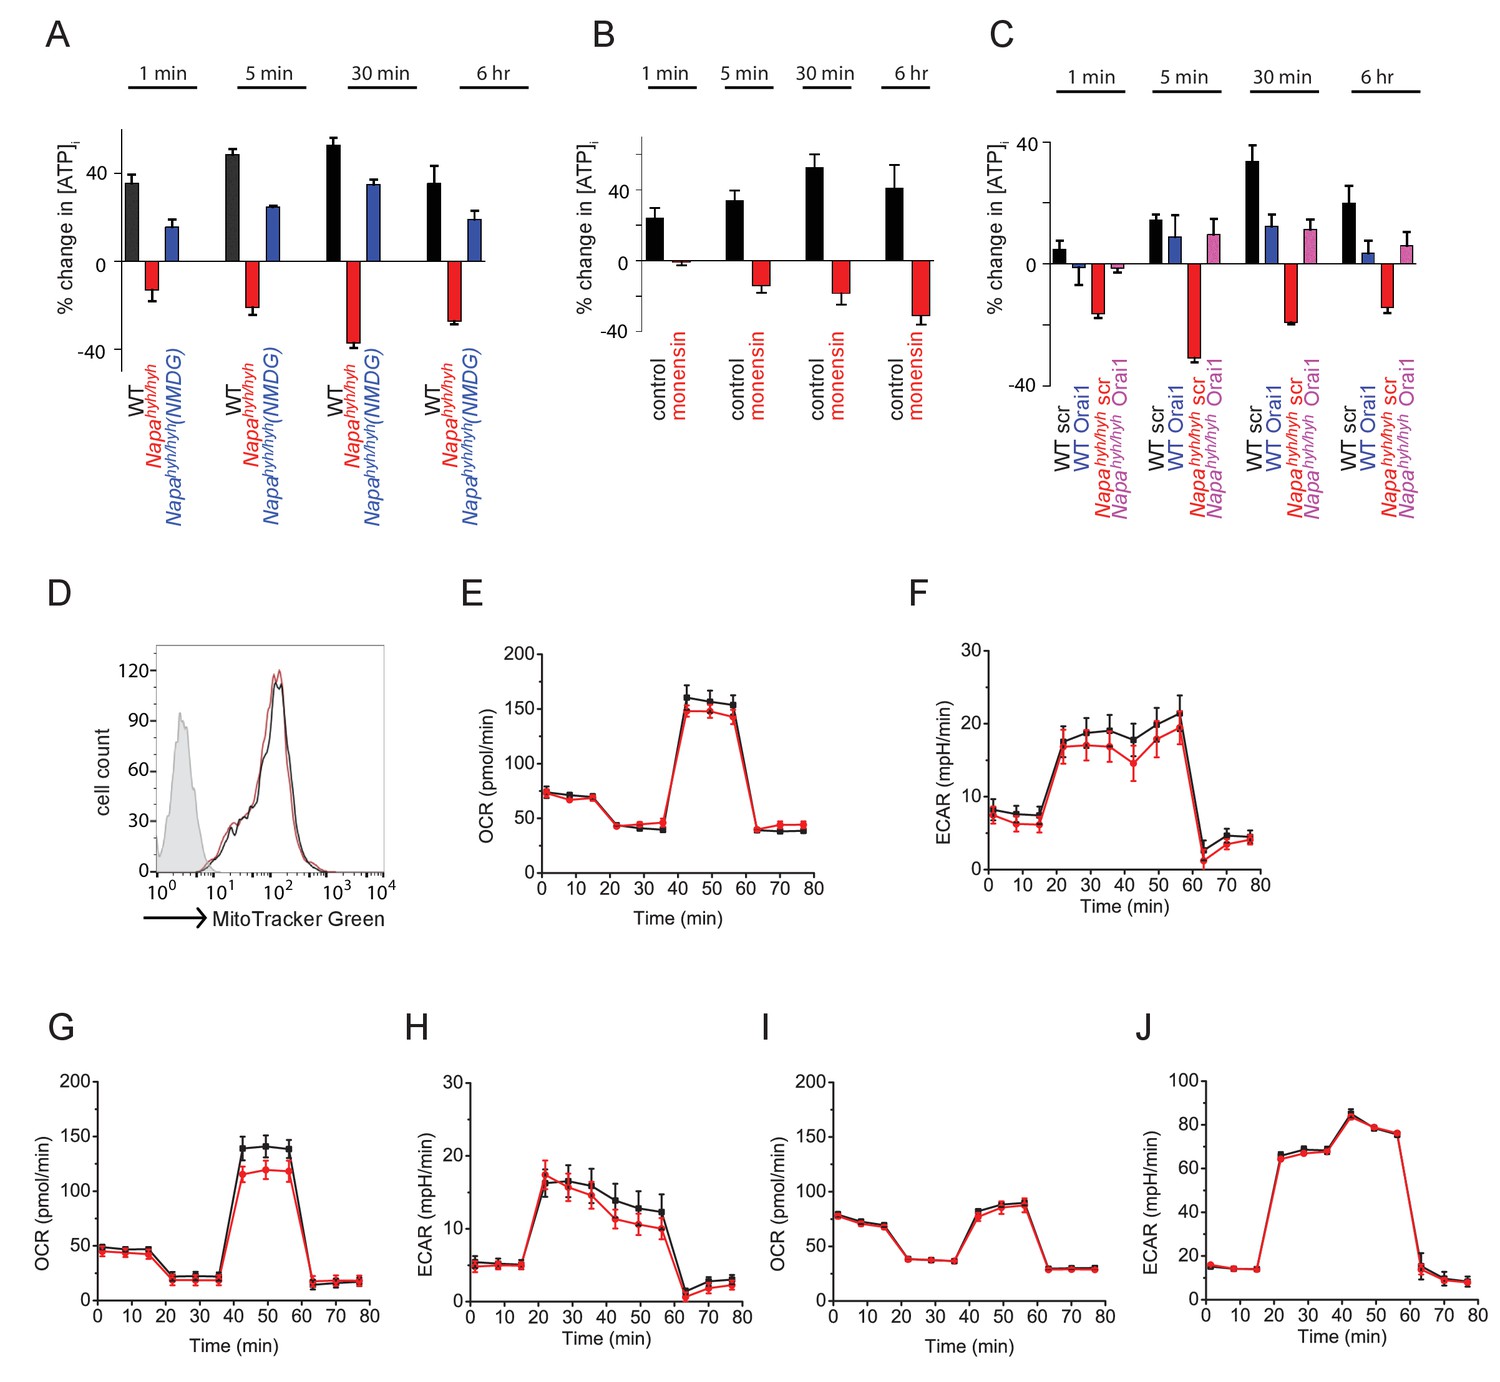
TCR-induced non-specific sodium influx depletes [ATP]i in Napahyh/hyh CD4 T cells.
(A) Percent change in intracellular ATP levels [ATP]i in anti-CD3-stimulated WT and Napahyh/hyh CD4 T cells, measured at different times post-stimulation. (n = 6). (B) Percent change in [ATP]i in WT CD4 T cells, stimulated with anti-CD3 in the presence or absence of Monensin. (n = 2). (C) Percent change in [ATP]i in anti-CD3-stimulated WT and Napahyh/hyh CD4 T cells, treated with scramble (scr) or Orai1 RNAi (Orai1). (n = 2). (D) FACS profiles of WT (black) and Napahyh/hyh (red) CD4 T cells stained with Mitotracker green. (n = 2). (E–J) OCR and ECAR profiles of naive (E,F), TCR receptor stimulated for 6 hr (G,H), or TH0 (I,J) WT (black) and Napahyh/hyh (red) CD4 T cells. (n = 2 each).
Figure 5
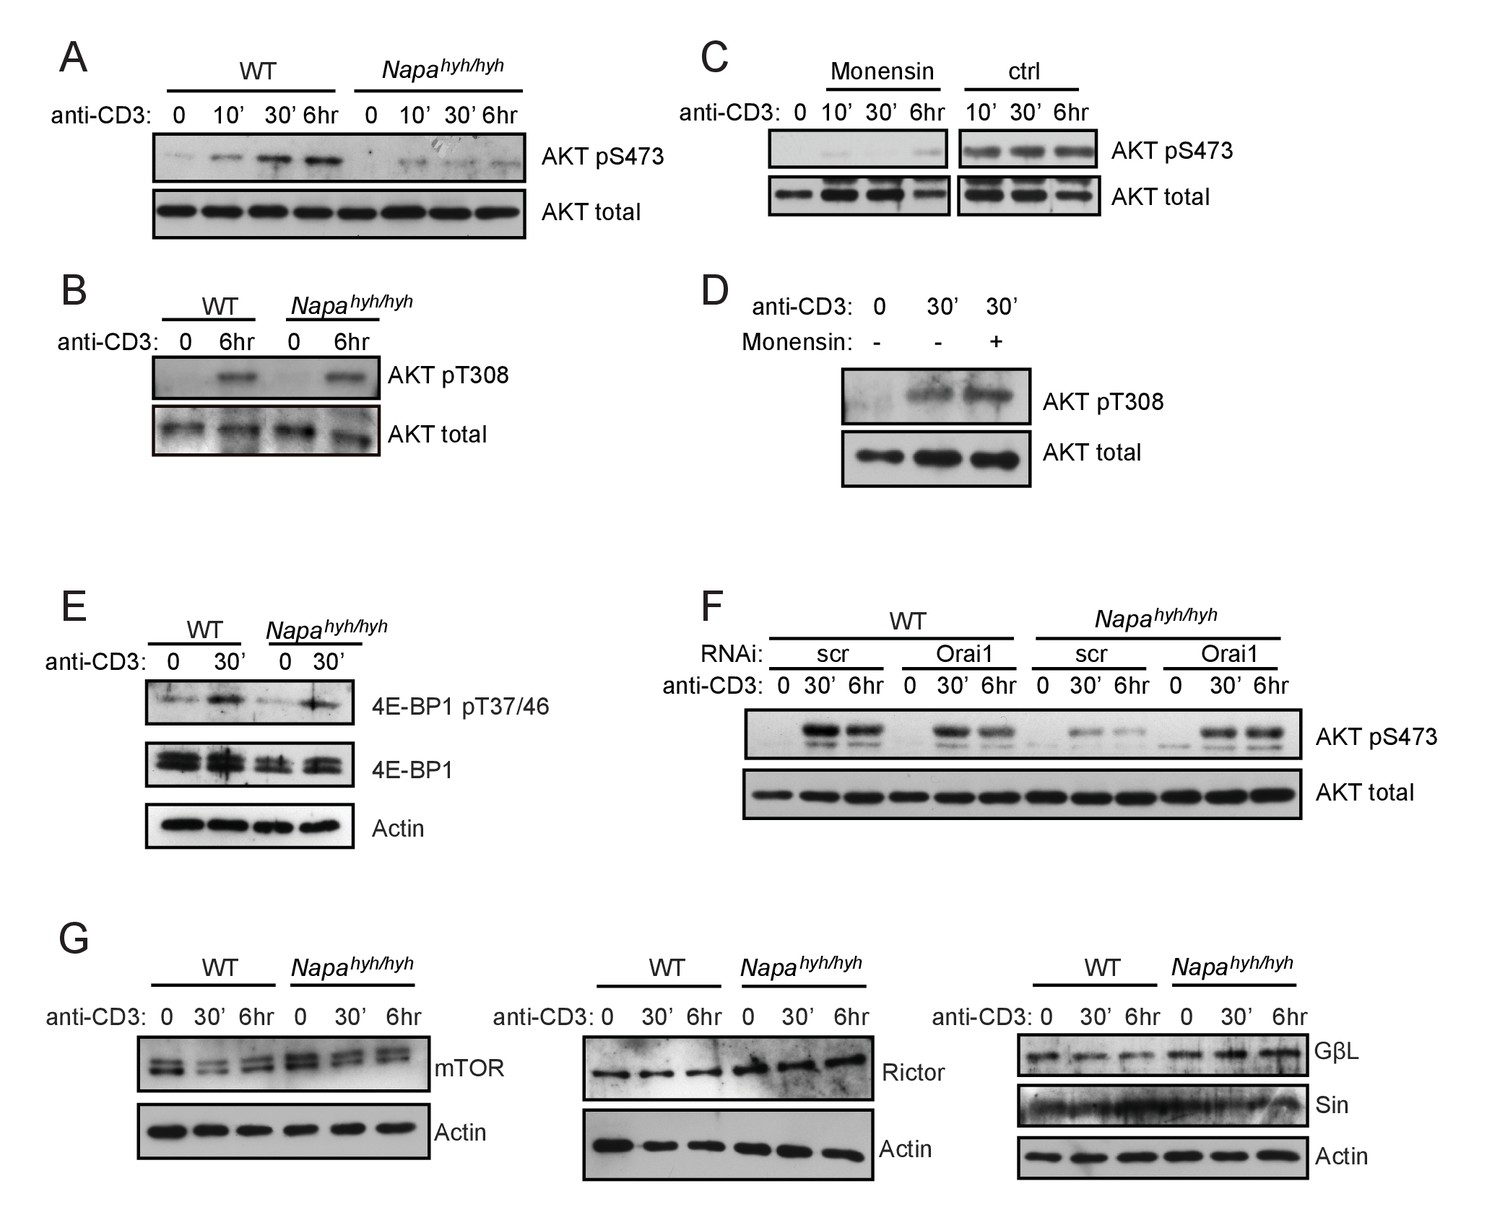
Depletion of [ATP]i inhibits mTORC2 activation in Napahyh/hyh CD4 T cells.
(A,B) Western blot for total and pS473 (A) or pT308 (B) phospho-AKT in receptor-stimulated WT and Napahyh/hyh CD4 T cell WCLs at different times post-activation. (n = 3). (C,D) Western blot for total and pS473 phospho-AKT (C) or pT308 phospho-AKT (D) in WT CD4 T cell receptor stimulated in the presence or absence of monensin. (n = 2). (E) Western blot for total and phospho- pT37/46 4E-BP1 in receptor-stimulated WT and Napahyh/hyh CD4 T cell WCLs. (F) Western blot for total and pS473 phospho-AKT in WCLs of receptor-stimulated WT and Napahyh/hyh CD4 T cells, treated with scramble (scr) or Orai1 RNAi (Orai1). (n = 2). (G) Western blot for mTORC2 complex proteins in the WCLs of receptor-stimulated WT and Napahyh/hyh CD4 T cells. (n = 2).
Figure 6
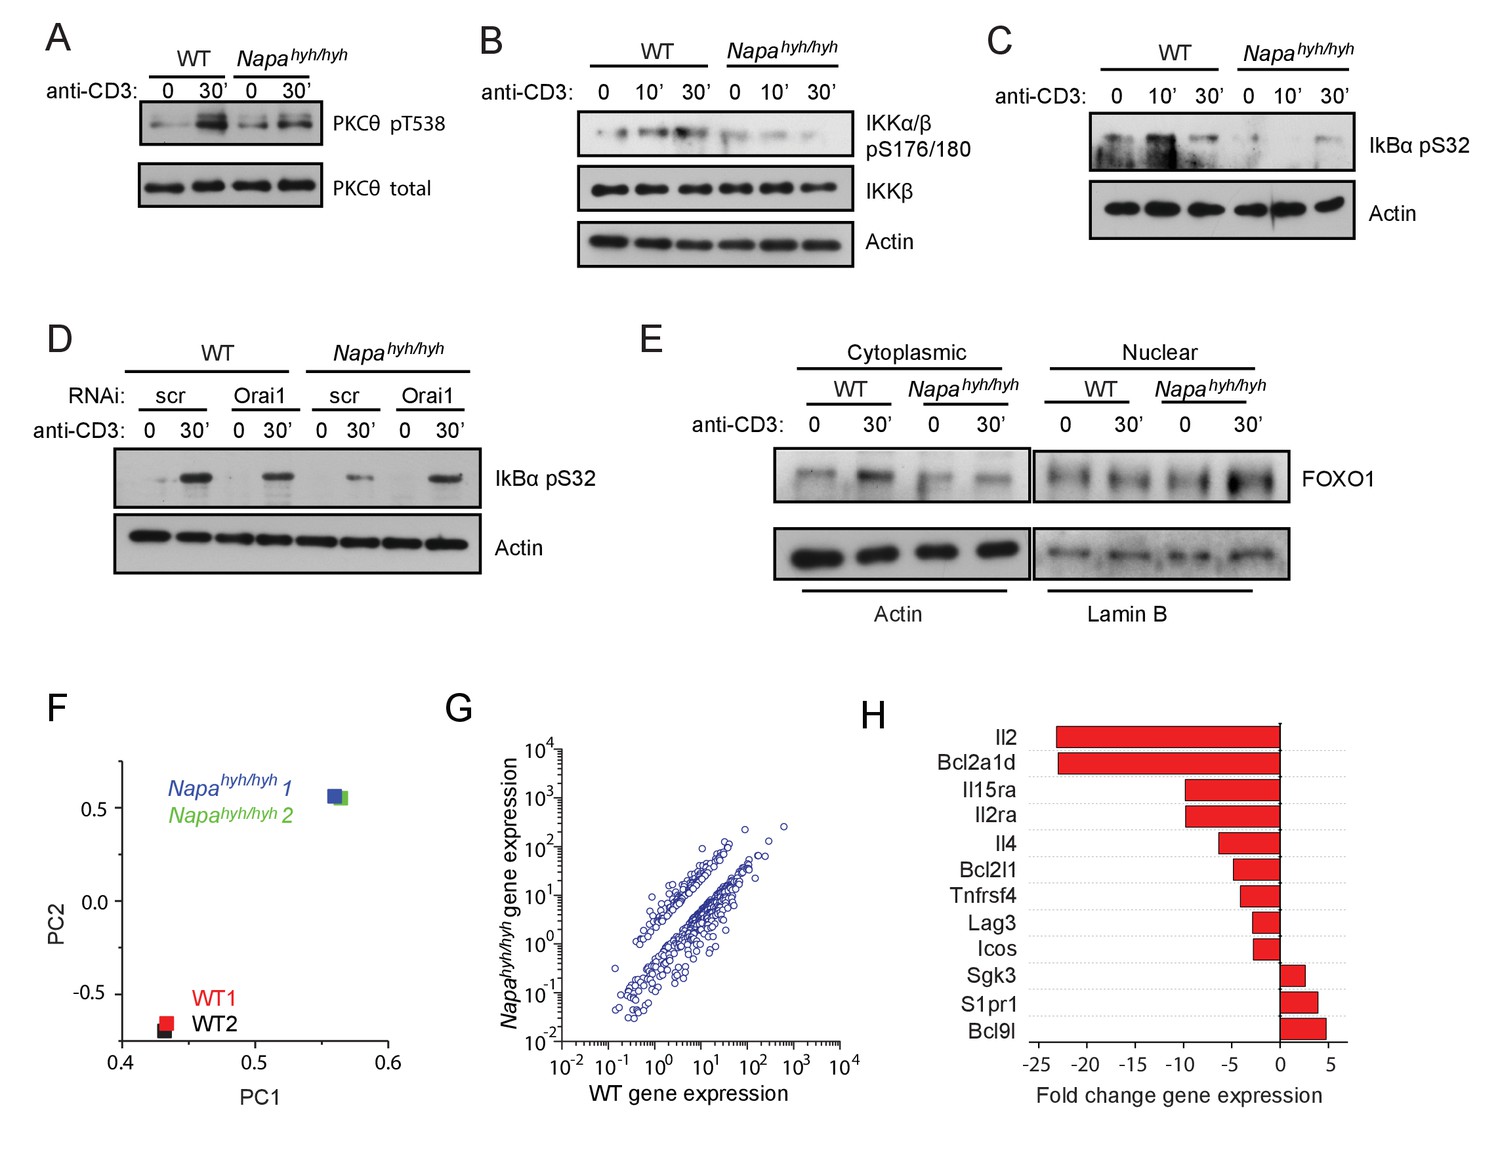
mTORC2 regulates NFκB activation via multiple signaling intermediates in Napahyh/hyh CD4 T cells.
(A–C) Western blots for total and pT538 phospho-PKC-θ (A), phospho-IKKβ (B) and phospho-IκB-α (C) in WCLs of receptor-stimulated WT and Napahyh/hyh CD4 T cells. (n = 2). (D) Western blot for total and phospho-IκB-α in WCLs of receptor-stimulated WT and Napahyh/hyh CD4 T cells, treated with scr or Orai1 RNAi. (E) Western blot for cytosolic and nuclear FOXO-1 in receptor-stimulated WT and Napahyh/hyh CD4 T cells. (n = 3). (F) Principal component analysis (PCA) on gene expression data from TCR-stimulated WT and Napahyh/hyh CD4 T cell RNA. (n = 2 from 2 independent chimeras each). (G) Scatter plot showing the normalized means of gene expression values (RPKM) in Napahyh/hyh and WT CD4 T cells after filtering for genes as described in Materials and methods. (H) Bar plot showing fold change in the expression of a few representative genes between WT and Napahyh/hyh samples from (F,G) (See also Figure 6—source data 1).
-
Figure 6—source data 1
Pathways defective in receptor stimulated Napahyh/hyh CD4 T cells.
Gene expression data from Figure 6G were subjected to pathway analysis and top 50 pathways that met the criteria described in Materials and methods are shown.
- https://doi.org/10.7554/eLife.25155.011
Figure 7
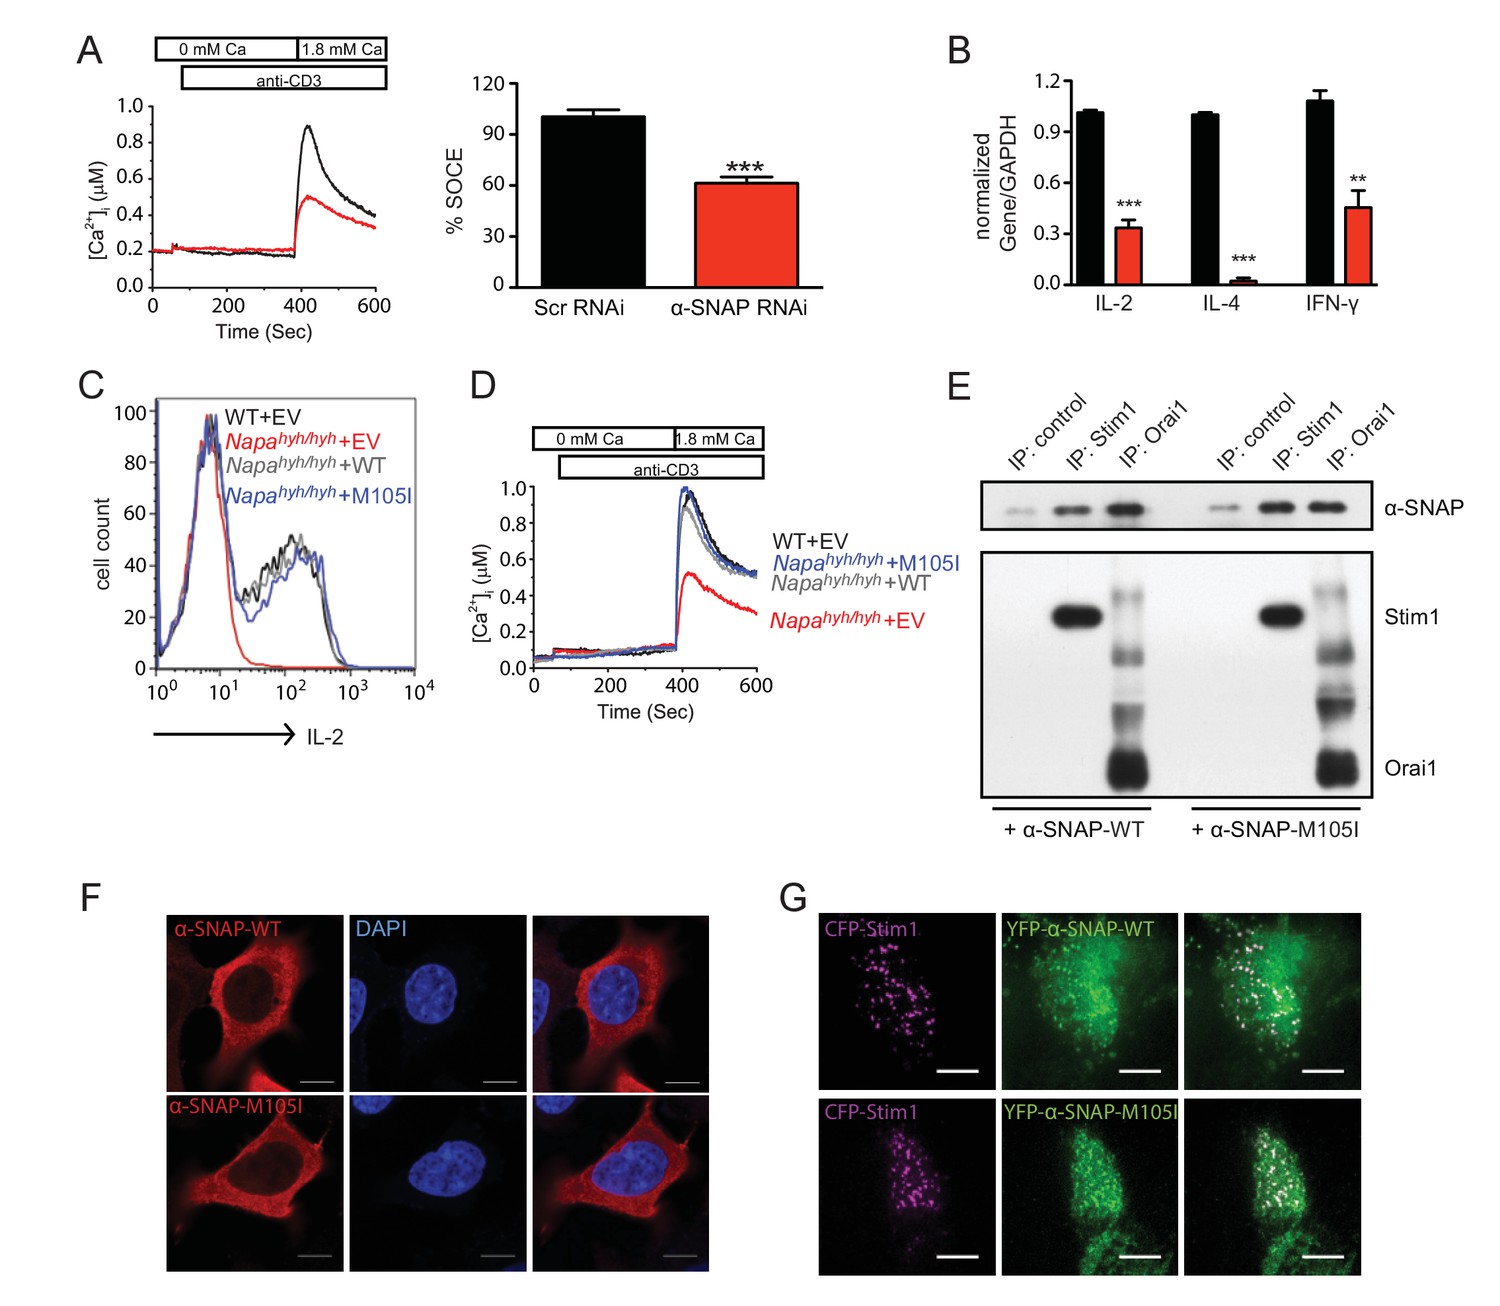
Ectopic expression of α-SNAP can restore defects in Napahyh/hyh CD4 T cells.
(A) Average cytosolic calcium levels, measured using FURA 2AM, in scr (black) and α-SNAP RNAi (red)-treated cells stimulated with anti-CD3 antibody to measure SOCE. (n = 3 with ~50 to 100 cells per experiment). (B) Quantitative PCR to estimate the expression of key effector cytokines in scr (black) and α-SNAP RNAi (red)-treated Th0 cells. (n = 2 repeats; samples from 3 repeats of RNAi). (C) Representative FACS profiles showing intracellular IL-2 staining in WT and Napahyh/hyh CD4 T cells reconstituted with EV, WT or M105I α-SNAP. (n = 3). (D) Average cytosolic calcium levels, measured using FURA 2AM, in anti-CD3- stimulated WT and Napahyh/hyh CD4 T cells expressing empty vector (EV), WT or M105I α-SNAP. (n = 2 with ~50 to 200 cells each). (E) Western blot showing in vitro binding of WT and M105I α-SNAP to Stim1 and Orai1. (n = 2). (F) Confocal images of HEK293 cells expressing WT or M105I α-SNAP and stained with anti-α-SNAP antibody and DAPI (Scale bar 10 μm). (n = 2; 5 to 6 cells/ per group/ experiment). (G) TIRF images of store-depleted HEK 293 cells co-expressing CFP-Stim1 and YFP-tagged WT or M105I α-SNAP. (Scale bar 10 μm). (n = 2 with 5 to 6 cells/ per group/ experiment).
Figure 8
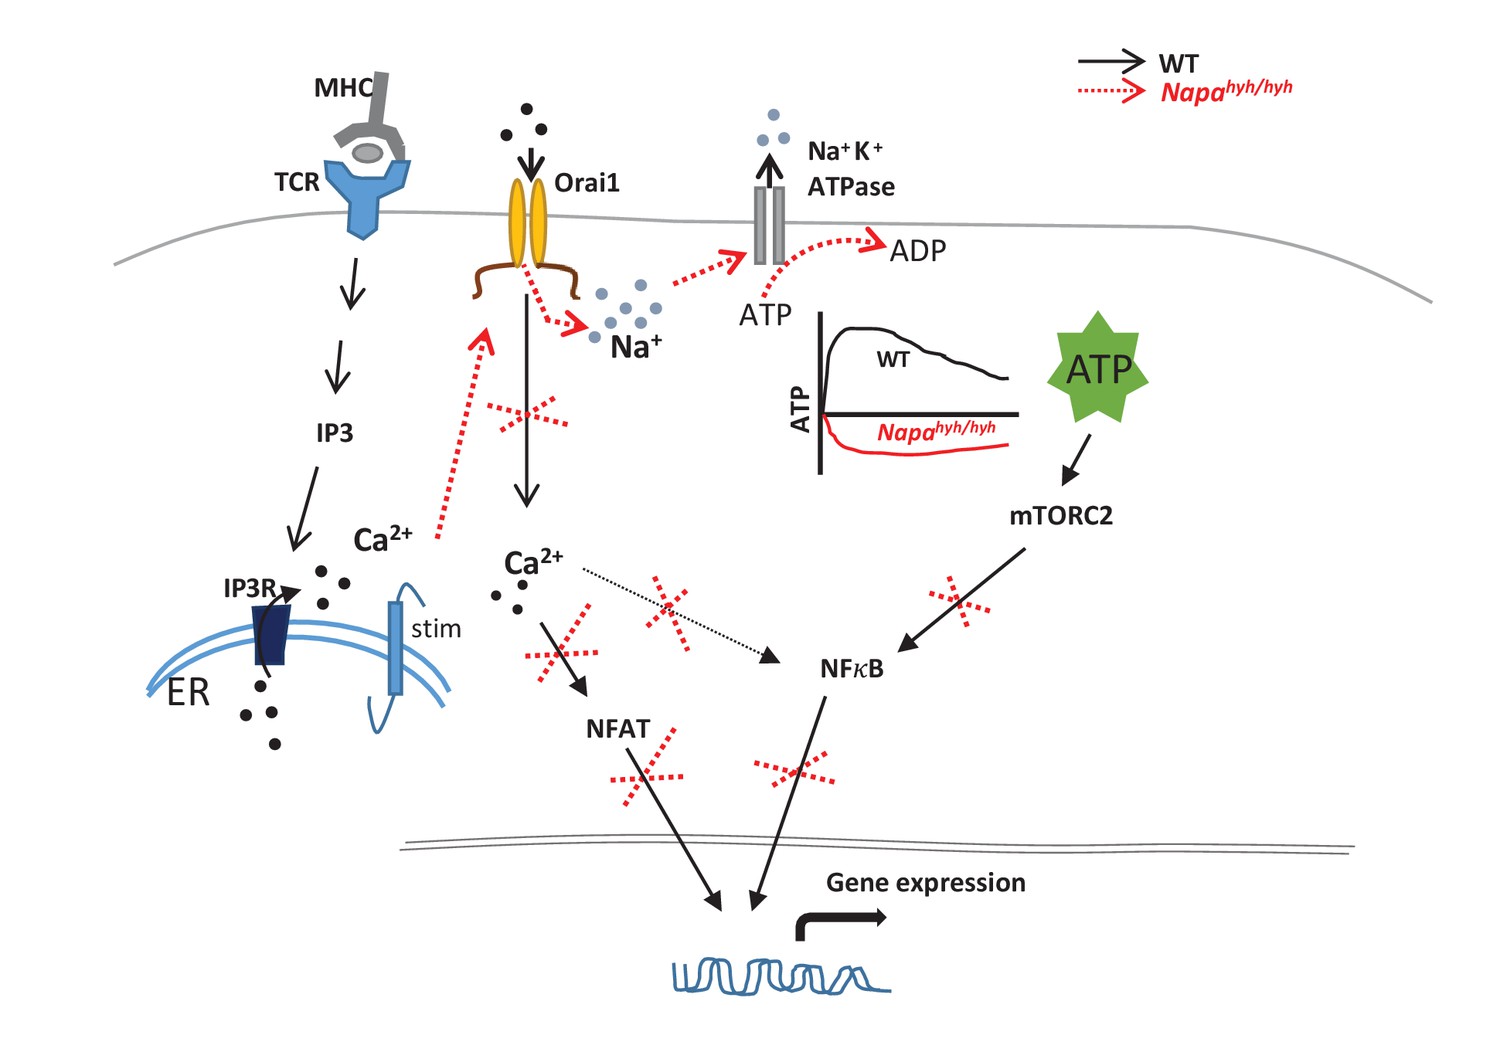
Summary of signaling nodes affected by TCR induced non-specific sodium influx.
https://doi.org/10.7554/eLife.25155.013Additional files
-
Source data 1
Antibodies used in this paper.
- https://doi.org/10.7554/eLife.25155.014
Download links
A two-part list of links to download the article, or parts of the article, in various formats.
Downloads (link to download the article as PDF)
Open citations (links to open the citations from this article in various online reference manager services)
Cite this article (links to download the citations from this article in formats compatible with various reference manager tools)
Na+ influx via Orai1 inhibits intracellular ATP-induced mTORC2 signaling to disrupt CD4 T cell gene expression and differentiation
eLife 6:e25155.
https://doi.org/10.7554/eLife.25155


