SIRT6 regulates Ras-related protein R-Ras2 by lysine defatty-acylation
- Cornell University, United States
- Howard Hughes Medical Institute, Cornell University, United States
Figures
Figure 1 with 1 supplement
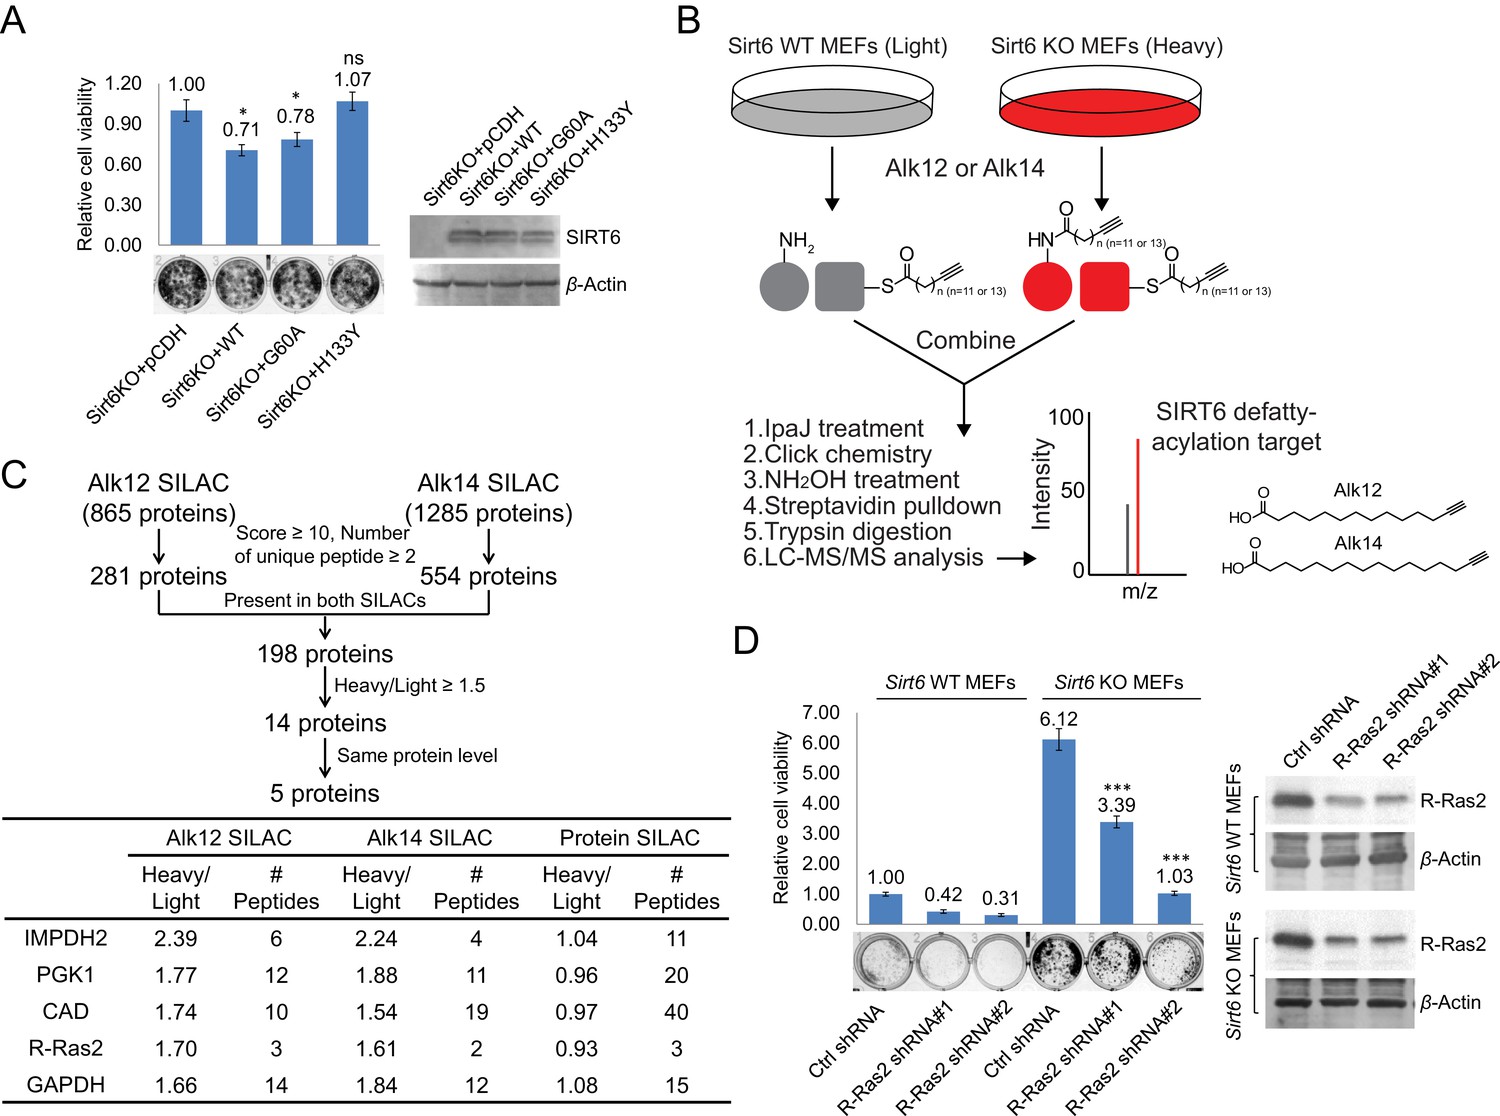
Identification of defatty-acylation targets of SIRT6 that contribute to its function in cell proliferation.
(A) Cell proliferation of Sirt6 KO MEFs stably expressing pCDH empty vector, SIRT6 WT, G60A, or H133Y. Cell proliferation was assayed and quantified using crystal violet staining. Values with error bars indicate mean ± s.d. of three biological replicates. * indicates p<0.05 and ‘ns’ indicates no statistical significance when comparing to Sirt6 KO MEFs with pCDH. (B) Schematic overview of the SILAC experiment to identify SIRT6 lysine defatty-acylation targets. (C) Data analysis and filter of SILAC results. (D) Effects of R-Ras2 knockdown on the proliferation of Sirt6 WT and KO MEFs. Values with error bars indicate mean ± s.d. of three biological replicates. *** indicates p<0.005 for comparing to Sirt6 KO MEFs with ctrl shRNA.
Figure 1—figure supplement 1
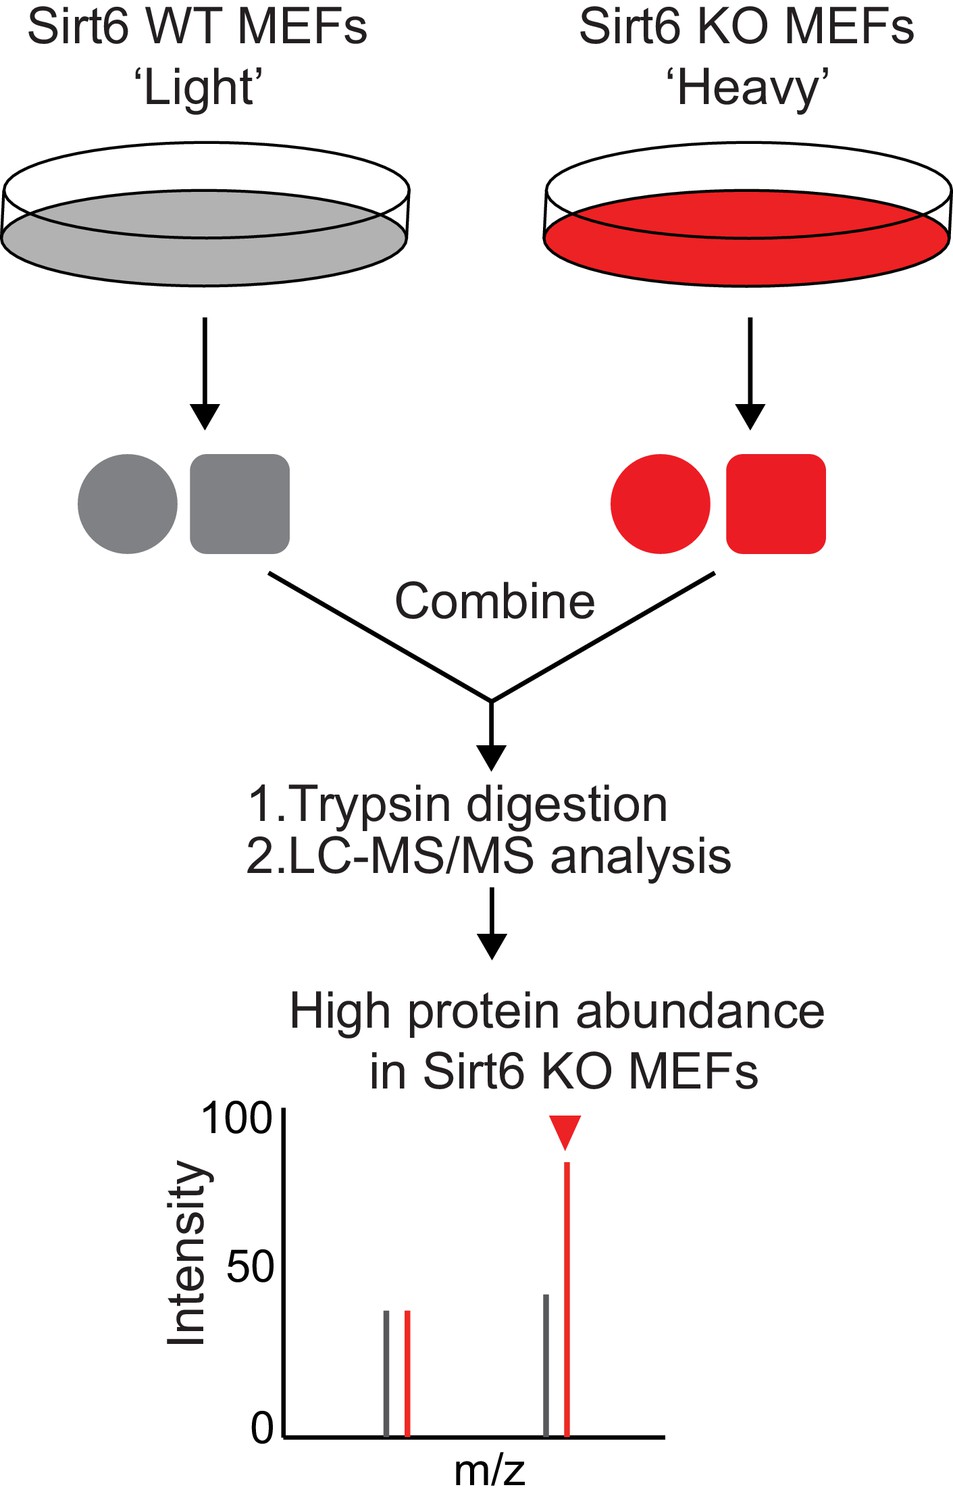
Schematic overview of the SILAC experiment to compare the protein abundance in Sirt6 WT and KO MEFs.
https://doi.org/10.7554/eLife.25158.004
Figure 2 with 4 supplements
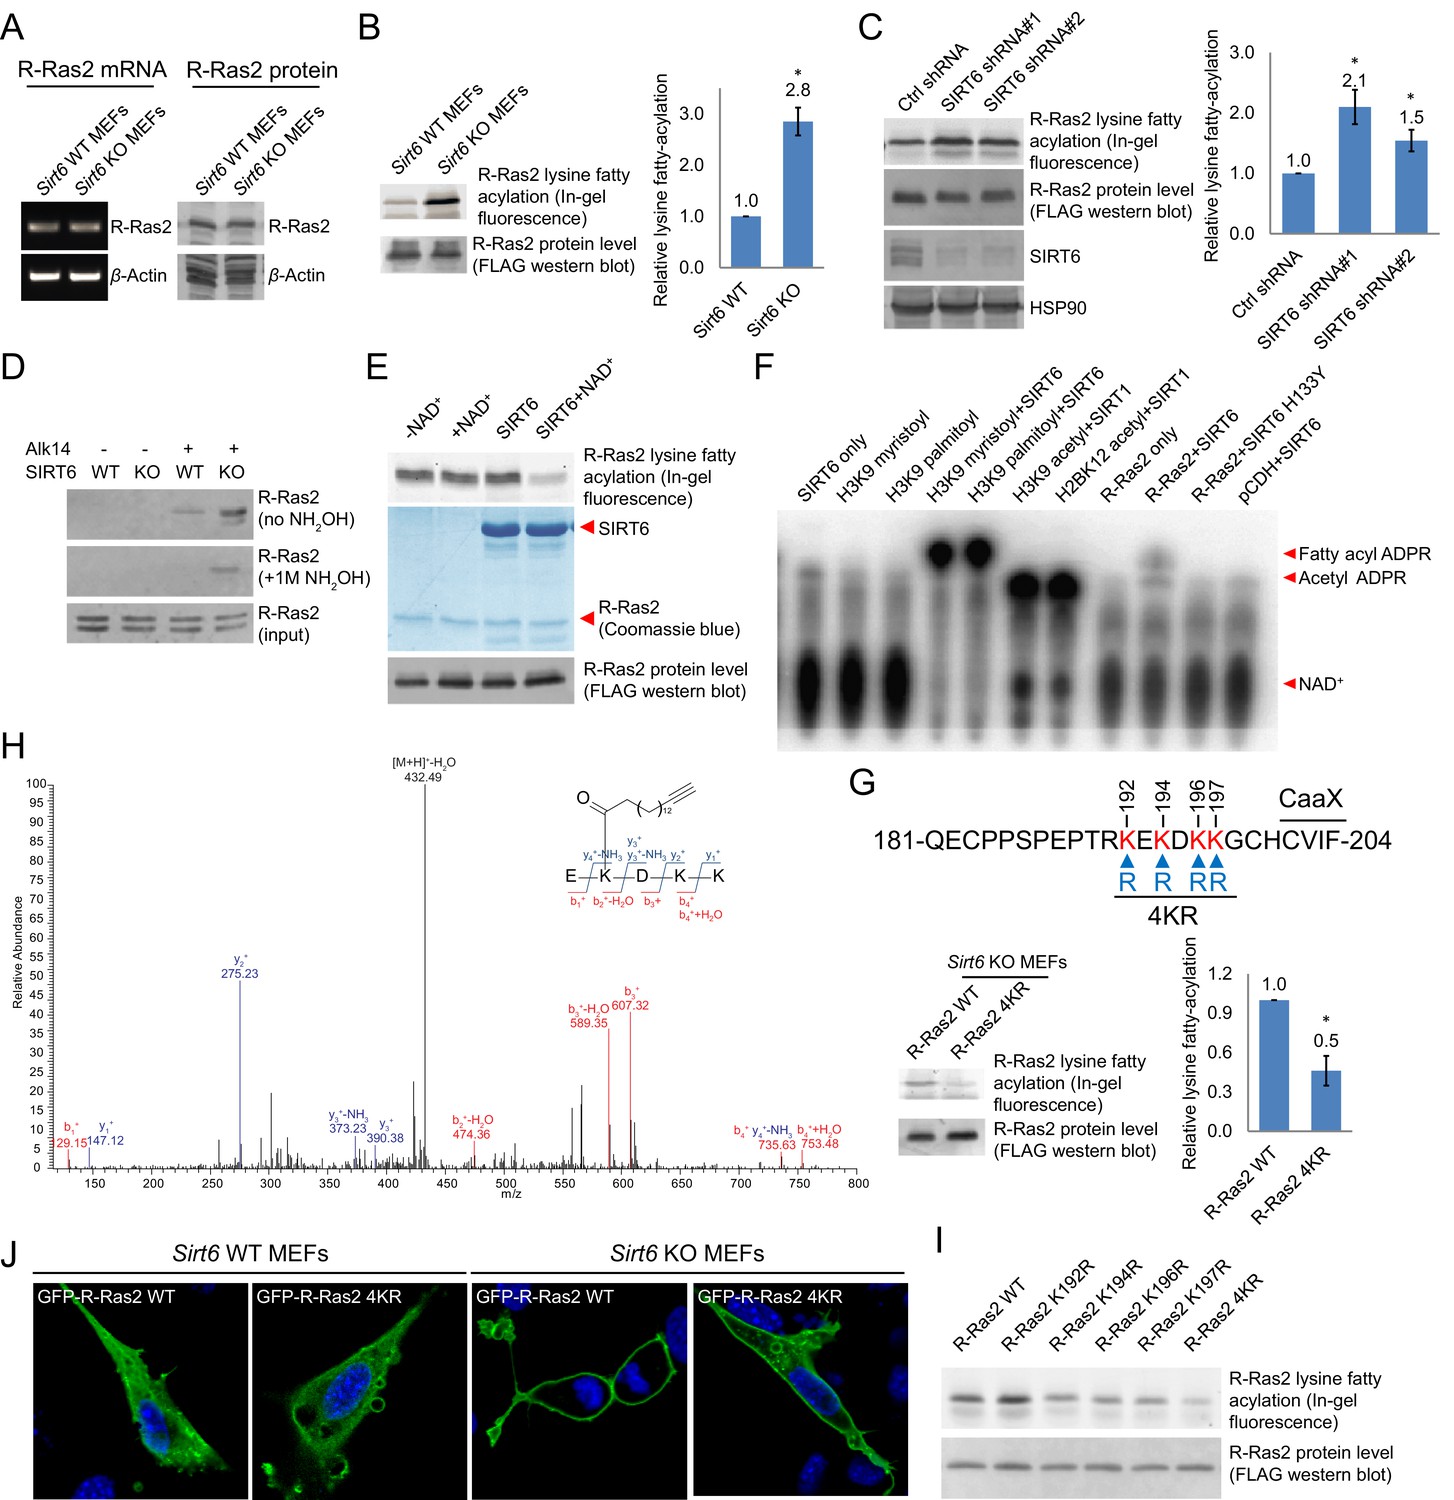
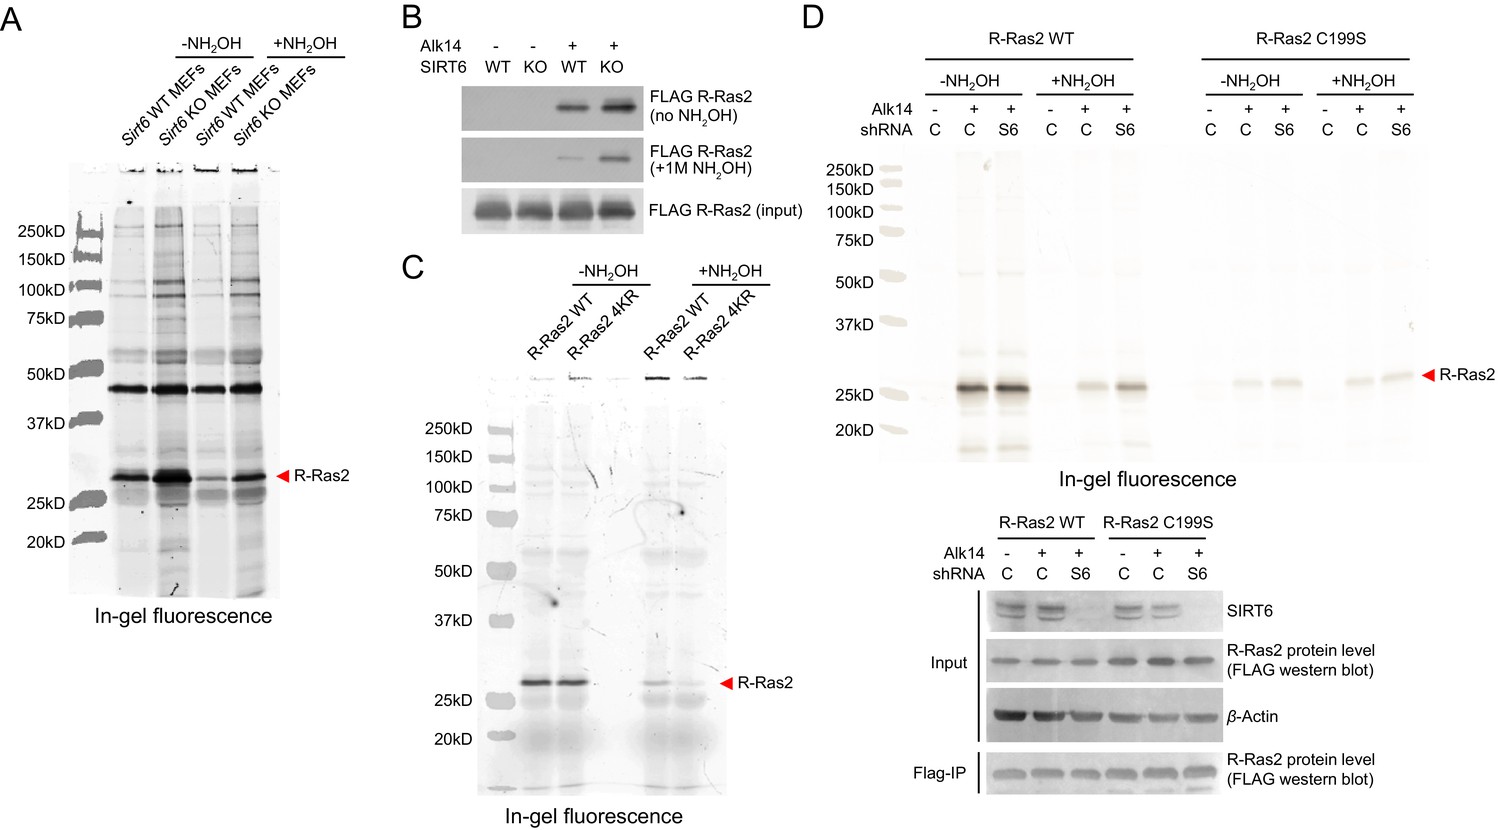
Validation of R-Ras2 as the defatty-acylation target of SIRT6.
(A) mRNA and protein levels of R-Ras2 in Sirt6 WT and KO MEFs. (B) In-gel fluorescence (with NH2OH treatment) showing that R-Ras2 has higher lysine fatty acylation level in Sirt6 KO MEFs than in Sirt6 WT MEFs. Right histogram shows the quantification of bands on the fluorescence gel. Values with error bars indicate mean ± s.d. of three biological replicates. * indicates p<0.05. The full fluorescence gel is shown in Figure 2—figure supplement 2A. (C) Detection of R-Ras2 lysine fatty acylation levels in control and SIRT6 knockown HEK 293 T cells by in-gel fluorescence. Right histogram shows the quantification of bands on the fluorescence gel. Values with error bars indicate mean ± s.d. of three biological replicates. * indicates p<0.05. (D) Lysine fatty acylation levels of endogenous R-Ras2 in Sirt6 WT and KO MEFs. (E, F) SIRT6 defatty-acylated R-Ras2 in a NAD+-dependent manner in vitro. In-gel fluorescence was used to detect R-Ras2 lysine fatty acylation (E). A 32P-NAD+ assay was used to detect fatty acyl ADPR product from defatty-acylation reaction. (F). (G) In-gel fluorescence (with NH2OH treatment) showing that mutation of four lysine residues at the C-terminus of R-Ras2 significantly decreased lysine fatty acylation in Sirt6 KO MEFs. Right histogram shows the quantification of bands on the fluorescence gel. Values with error bars indicate mean ± s.d. of three biological replicates. * indicates p<0.05. The full fluorescence gel including R-Ras2 total fatty acylation levels (without NH2OH treatment) is shown in Figure 2—figure supplement 2C. (H) Tandem mass (MS/MS) spectrum of doubly charged Alk14 modified (on K194) R-Ras2 peptide. The b- and y- ions are shown along with the peptide sequence. (I) In-gel fluorescence (with NH2OH treatment) showing that single mutation of four lysine residues at the C-terminus of R-Ras2 did not affect R-Ras2 lysine fatty acylation. (J) Confocal imaging showed that R-Ras2 WT was mainly localized in the plasma membrane in Sirt6 KO MEFs. R-Ras2 WT in Sirt6 WT MEFs as well as R-Ras2 4KR in Sirt6 WT and KO MEFs was localized in both the intracellular vesicles and plasma membrane (n = 5, 5, 5, 6 cells for each sample from left to right, respectively. The images of other cells were shown in Figure 2—figure supplement 4A.
Figure 2—figure supplement 1
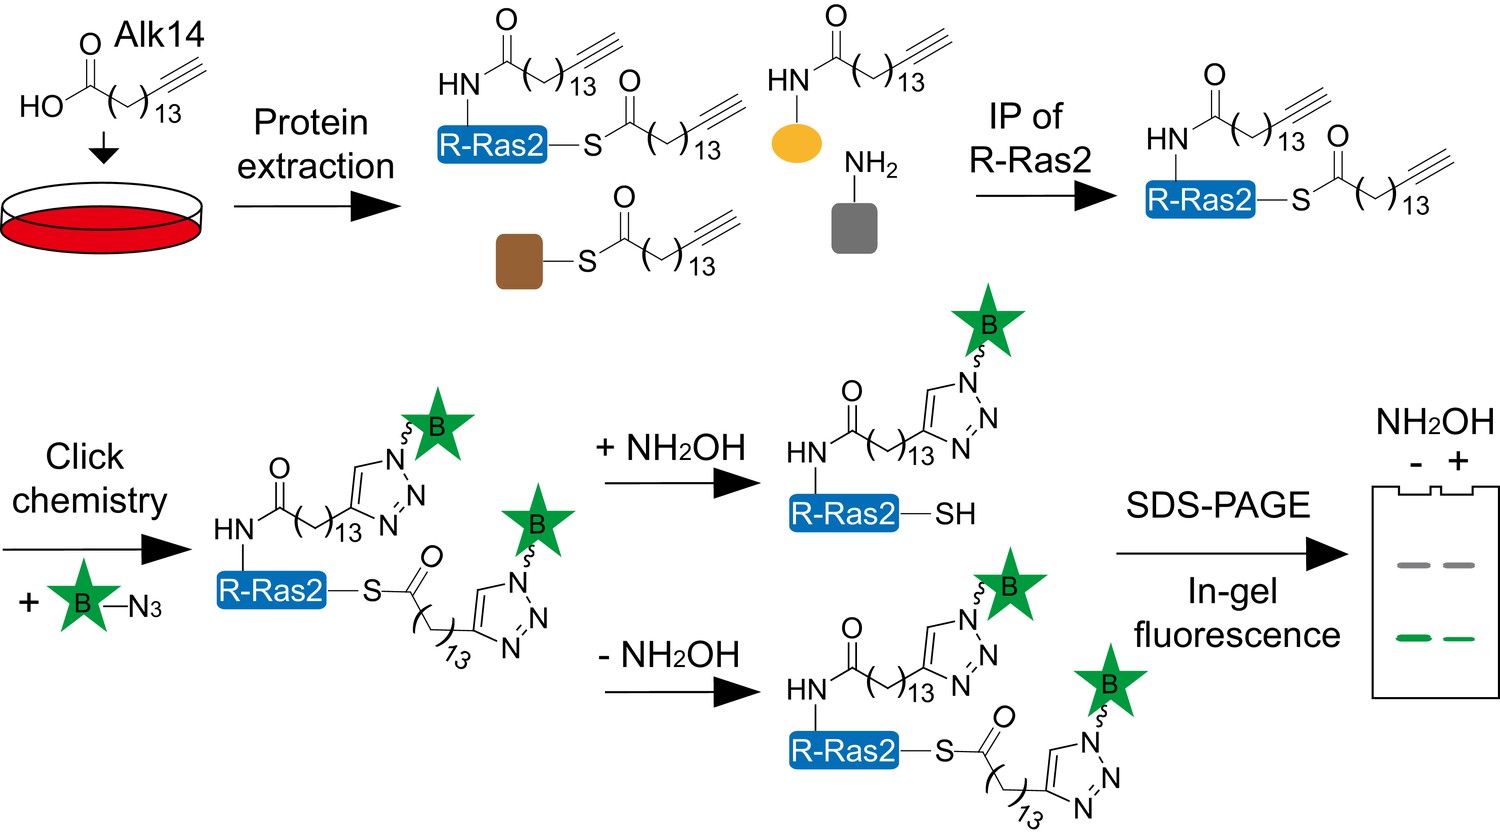
Scheme showing the in-gel fluorescence method with Alk14 metabolic labeling to identify R-Ras2 as a lysine fatty acylated protein.
FLAG-tagged R-Ras2 protein was enriched from whole cell lysates by FlAG immunoprecipitation. Alk14-labeled R-Ras2 protein was detected by in-gel fluorescence after incorporating BODIPY (B)-azide using click chemistry.
Figure 2—figure supplement 2
Validation of R-Ras2 as the defatty-acylation target of SIRT6.
(A) Full gel image of R-Ras2 fatty acylation level with or without NH2OH treatment in Sirt6 WT and KO MEFs. (B) Lysine fatty acylation levels of overexpressed R-Ras2 in Sirt6 WT and KO MEFs. (C) Full gel image of R-Ras2 WT and 4KR fatty acylation levels with or without NH2OH treatment in Sirt6 KO MEFs. (D) In-gel fluorescence showing lysine fatty acylation level of overexpressed R-Ras2 WT and C199S mutant in HEK 293T cells with SIRT6 knockdown. C, control shRNA. S6, SIRT6 shRNA#1.
Figure 2—figure supplement 3
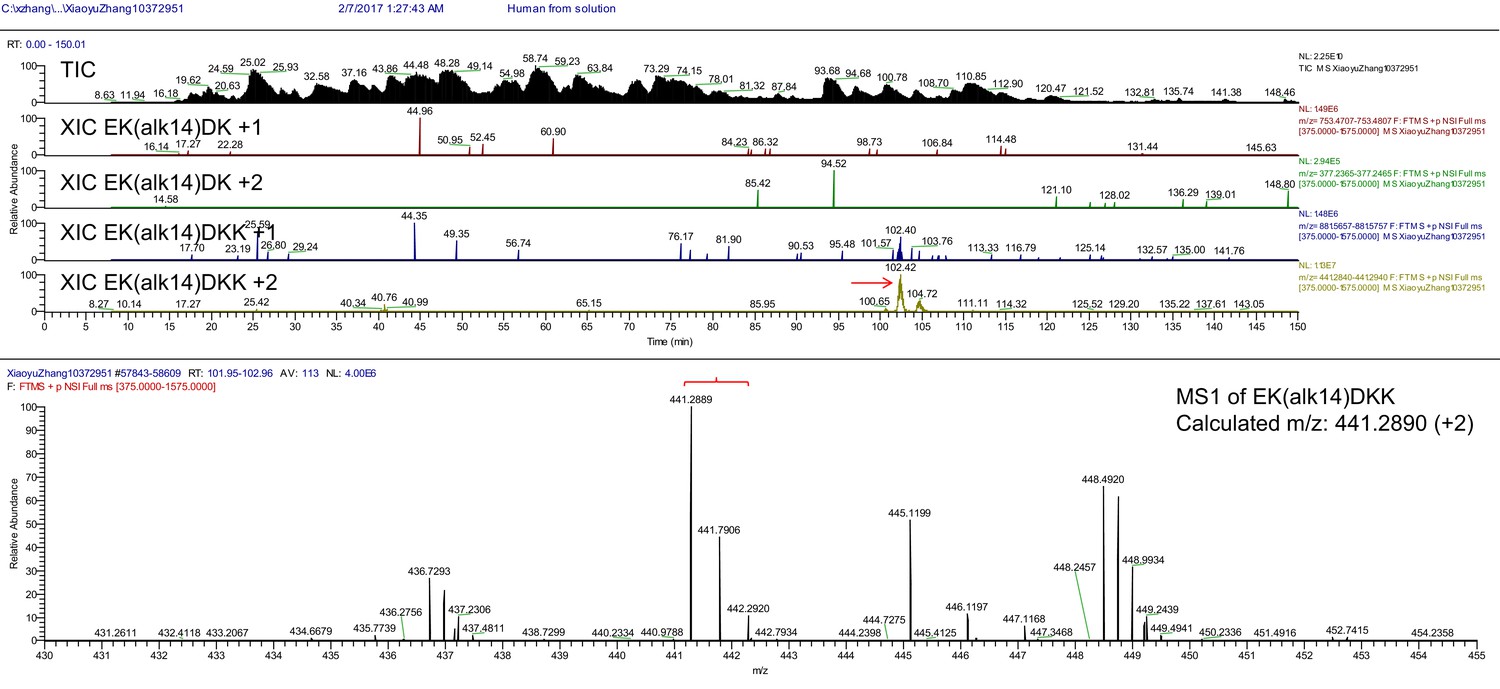
Total ion chromatogram (TIC), extracted ion chromatogram (XIC) and parent MS (MS1) of Ak14 modified R-Ras2 peptide.
https://doi.org/10.7554/eLife.25158.008
Figure 2—figure supplement 4
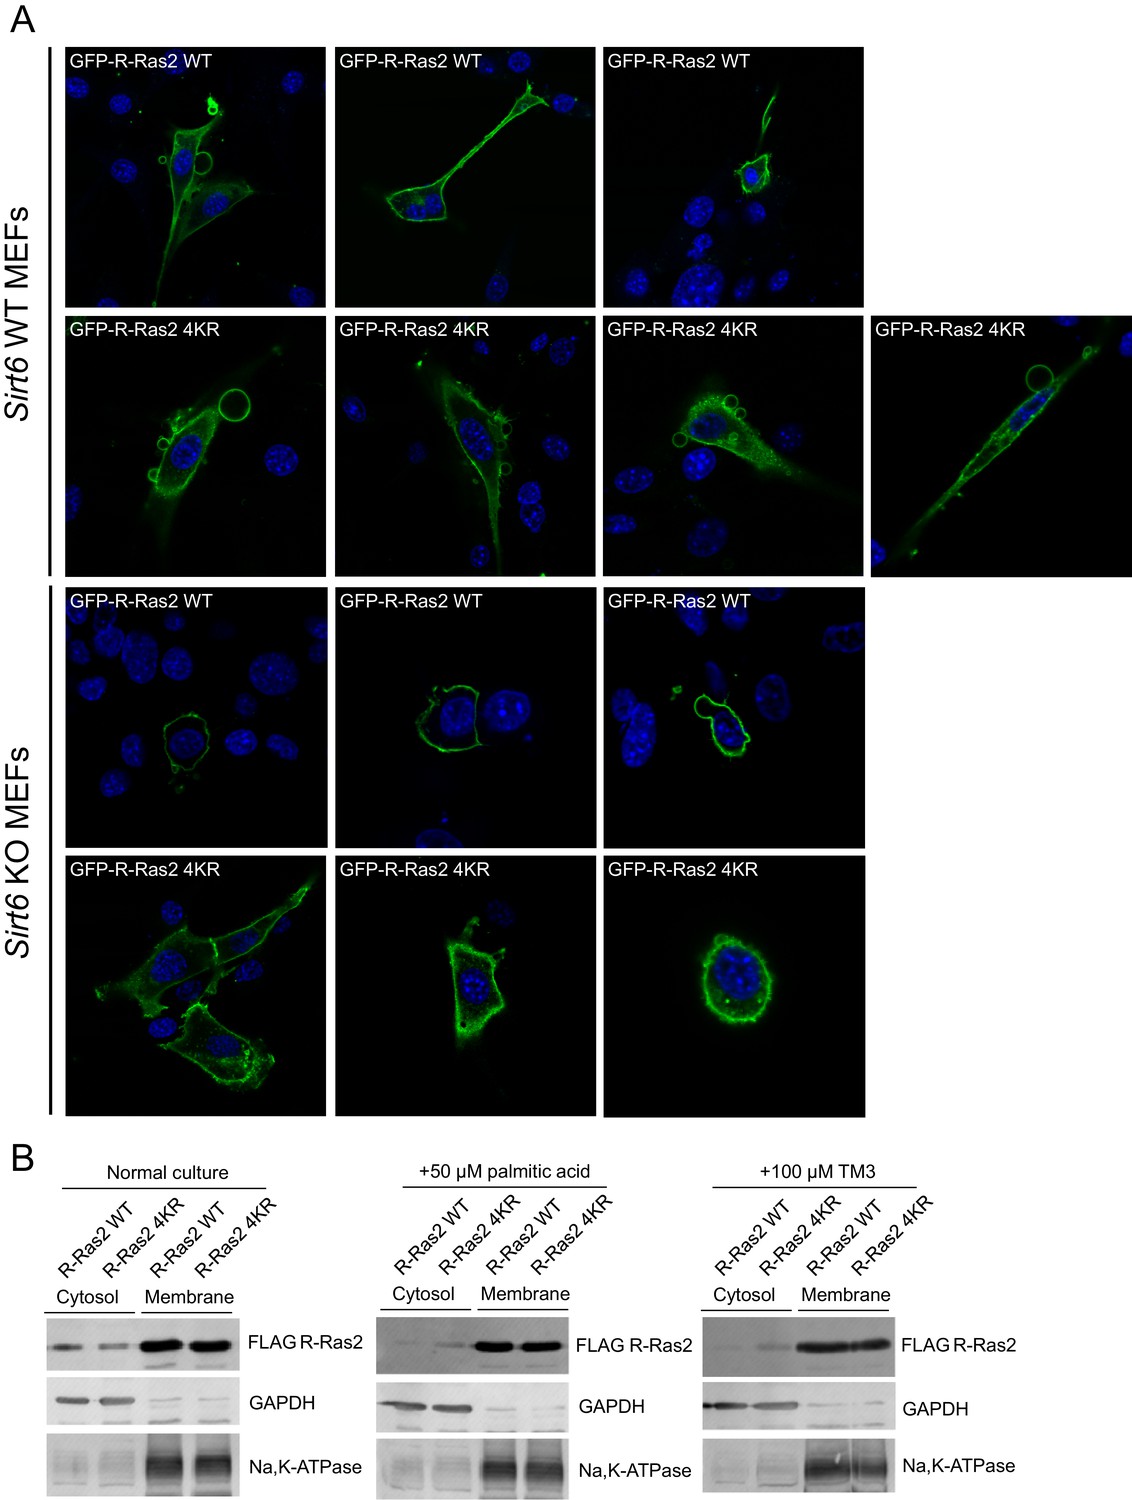
Lysine fatty acylation targets R-Ras2 to plasma membrane.
(A) Confocal imaging showing subcellular localization of GFP-tagged R-Ras2 WT and 4KR in Sirt6 WT and KO MEFs. (B) Subcellular fractionation of R-Ras2 WT and 4KR in HEK 293T cells with palmitic acid or TM3 treatment. GAPDH was used as the marker of cytosol fraction and Na,K-APTase was used as the marker of plasma membrane fraction.
Figure 3 with 1 supplement
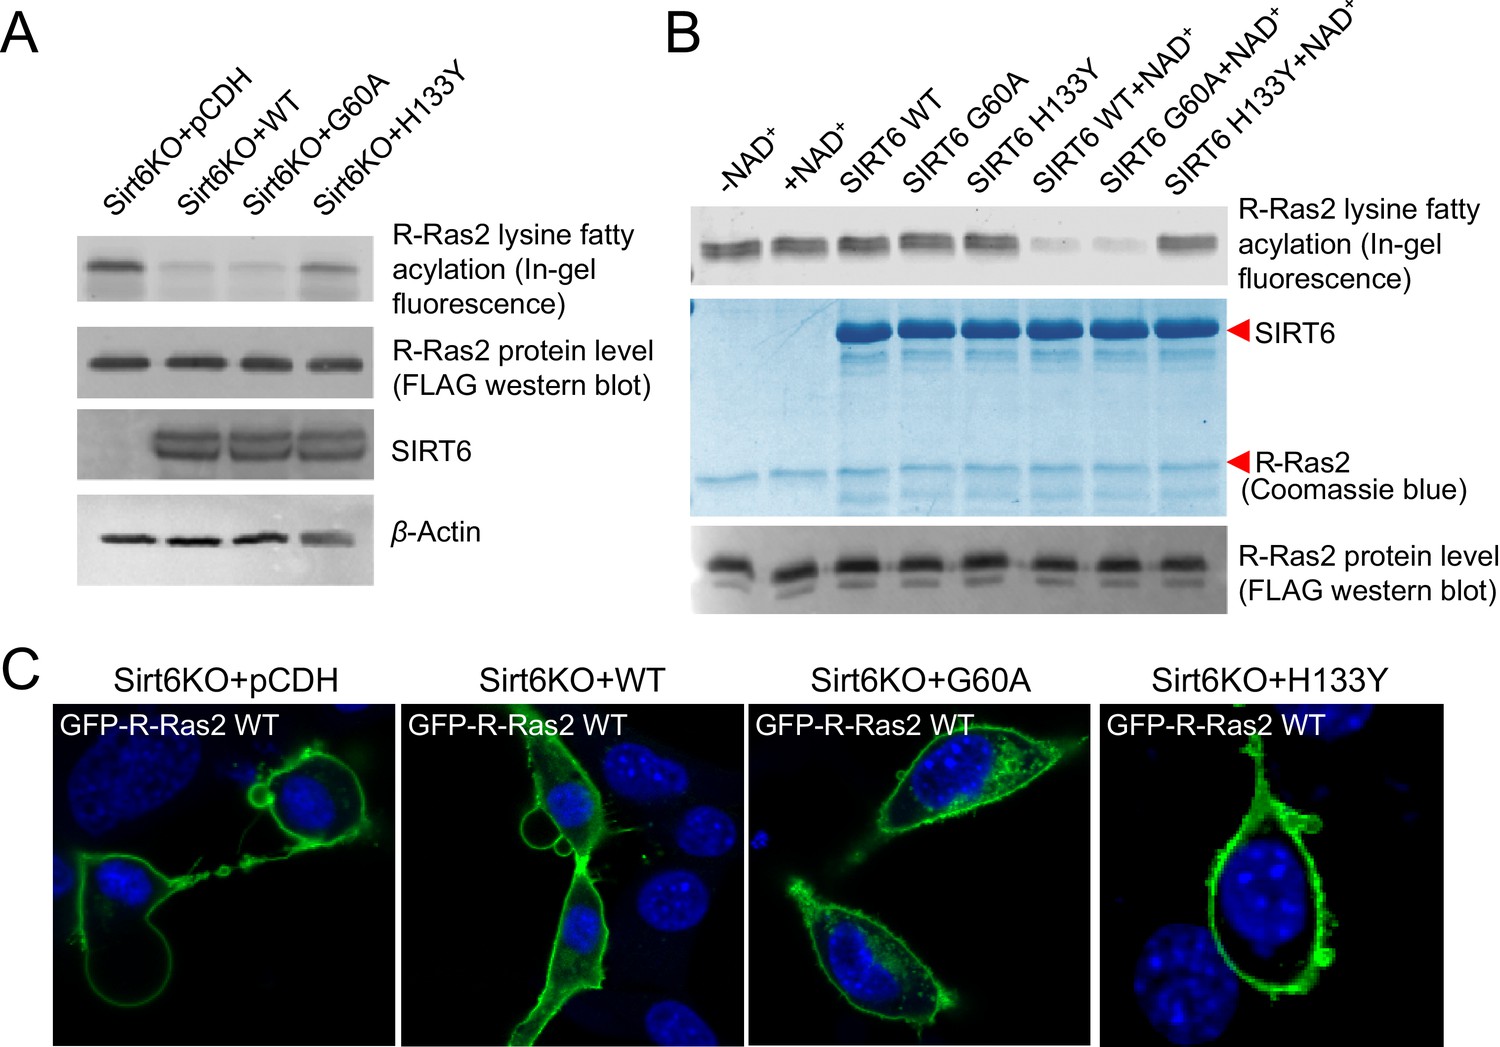
SIRT6 defatty-acylase activity is required for regulating R-Ras2 lysine fatty acylation and subcellular localization.
(A) Detection of R-Ras2 lysine fatty acylation levels in Sirt6 KO MEFs expressing pCDH empty vector, SIRT6 WT, G60A or H133Y by in-gel fluorescence. (B) In-gel fluorescence showed that SIRT6 WT and G60A defatty-acylated R-Ras2 in a NAD+-dependent manner in vitro. (C) Confocal imaging showing the localization of GFP-tagged R-Ras2 WT in Sirt6 KO MEFs expressing pCDH empty vector, SIRT6 WT, G60A or H133Y (n = 5, 6, 5, 5 cells for each sample from left to right, respectively). The images of other cells were shown in Figure 3—figure supplement 1A.
Figure 3—figure supplement 1
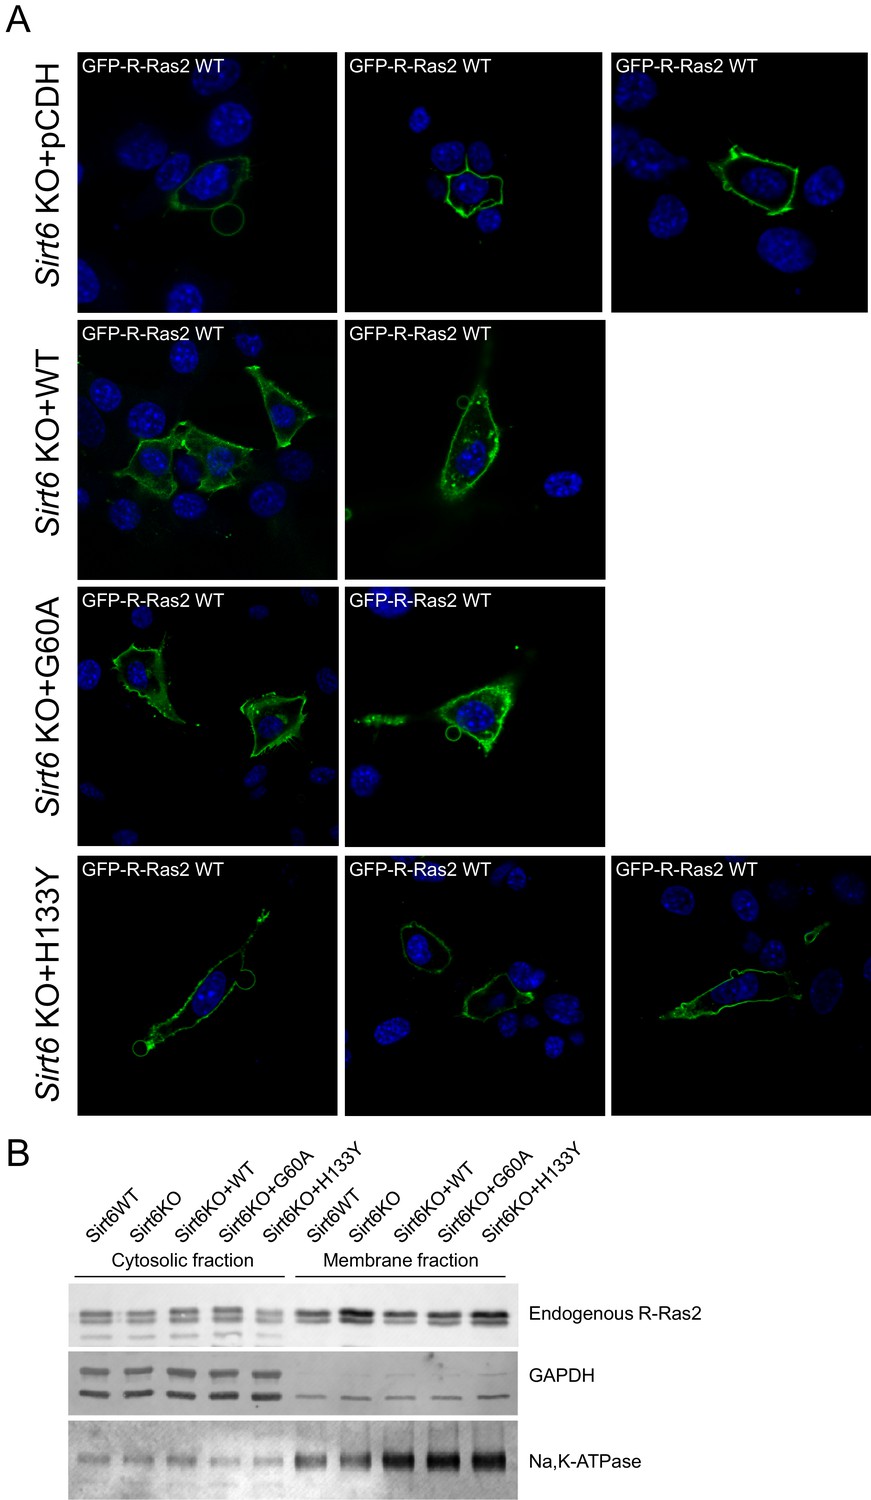
The defatty-acylase activity of SIRT6 regulates R-Ras2 subcellular localization.
(A) Confocal imaging showing the localization of GFP-tagged R-Ras2 in Sirt6 KO MEFs expressing pCDH empty vector, SIRT6 WT, G60A or H133Y. (B) Subcellular fractionation showing the localization of endogenous R-Ras2 in Sirt6 WT MEF, Sirt6 KO MEFs, and Sirt6 KO MEFs expressing SIRT6 WT, G60A or H133Y.
Figure 4 with 2 supplements
Lysine fatty acylation of R-Ras2 activates PI3K-Akt pathway and promotes cell proliferation in MEFs.
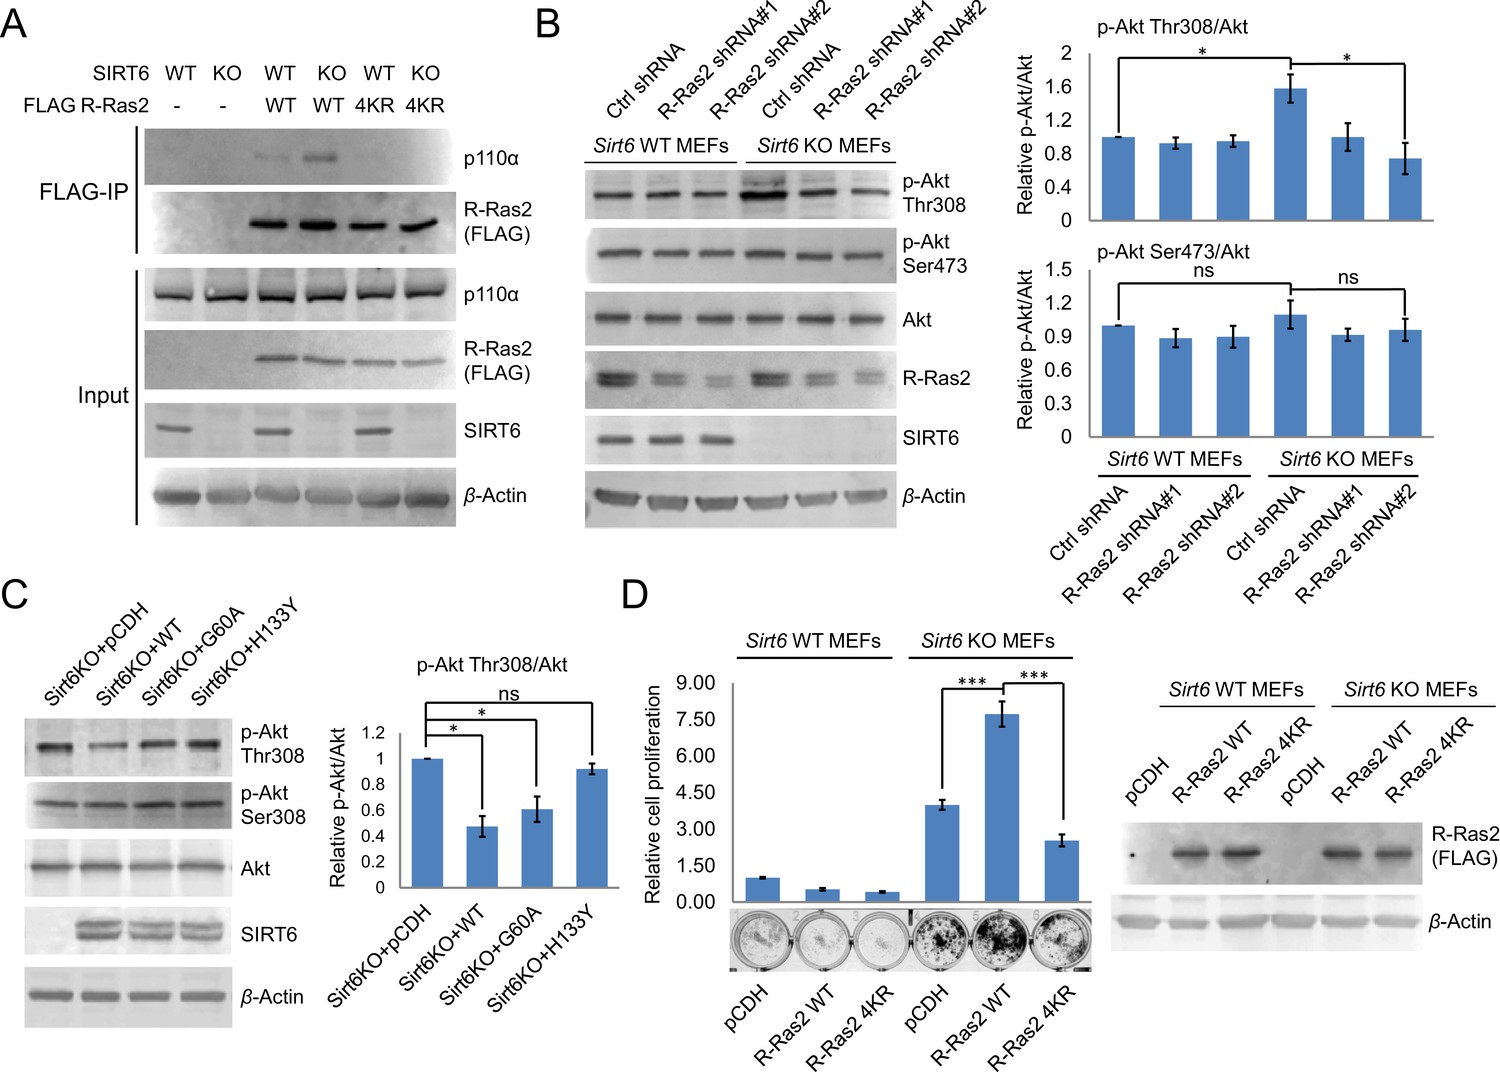
(A) Co-IP experiment showed that R-Ras2 WT in Sirt6 KO MEFs had more p110α interaction than R-Ras2 WT in Sirt6 WT MEFs and R-Ras2 4KR in Sirt6 WT or KO MEFs. (B) Knockdown of R-Ras2 in Sirt6 KO MEFs decreased p-Akt Thr308, but not p-Akt Ser473, to a level similar to that in Sirt6 WT MEFs. Right histogram shows the quantification of bands on the Western blot membrane. Values with error bars indicate mean ± s.d. of three biological replicates. * indicates p<0.05. The images of the other western blots used for quantification are shown in Figure 4—figure supplement 2A. (C) Expressing SIRT6 WT or SIRT6 G60A in Sirt6 KO MEFs decreased p-Akt Thr308, but not p-Akt Ser473. Right histogram shows the quantification of bands on the western blot membrane. Values with error bars indicate mean ± s.d. of three biological replicates. * indicates p<0.05. The images of other western blots for quantification are shown in Figure 4—figure supplement 2B. (D) R-Ras2 WT but not R-Ras2 4KR promoted cell proliferation in Sirt6 KO MEFs. Values with error bars indicate mean ± s.d. of three biological replicates. *** indicates p<0.005.
Figure 4—figure supplement 1
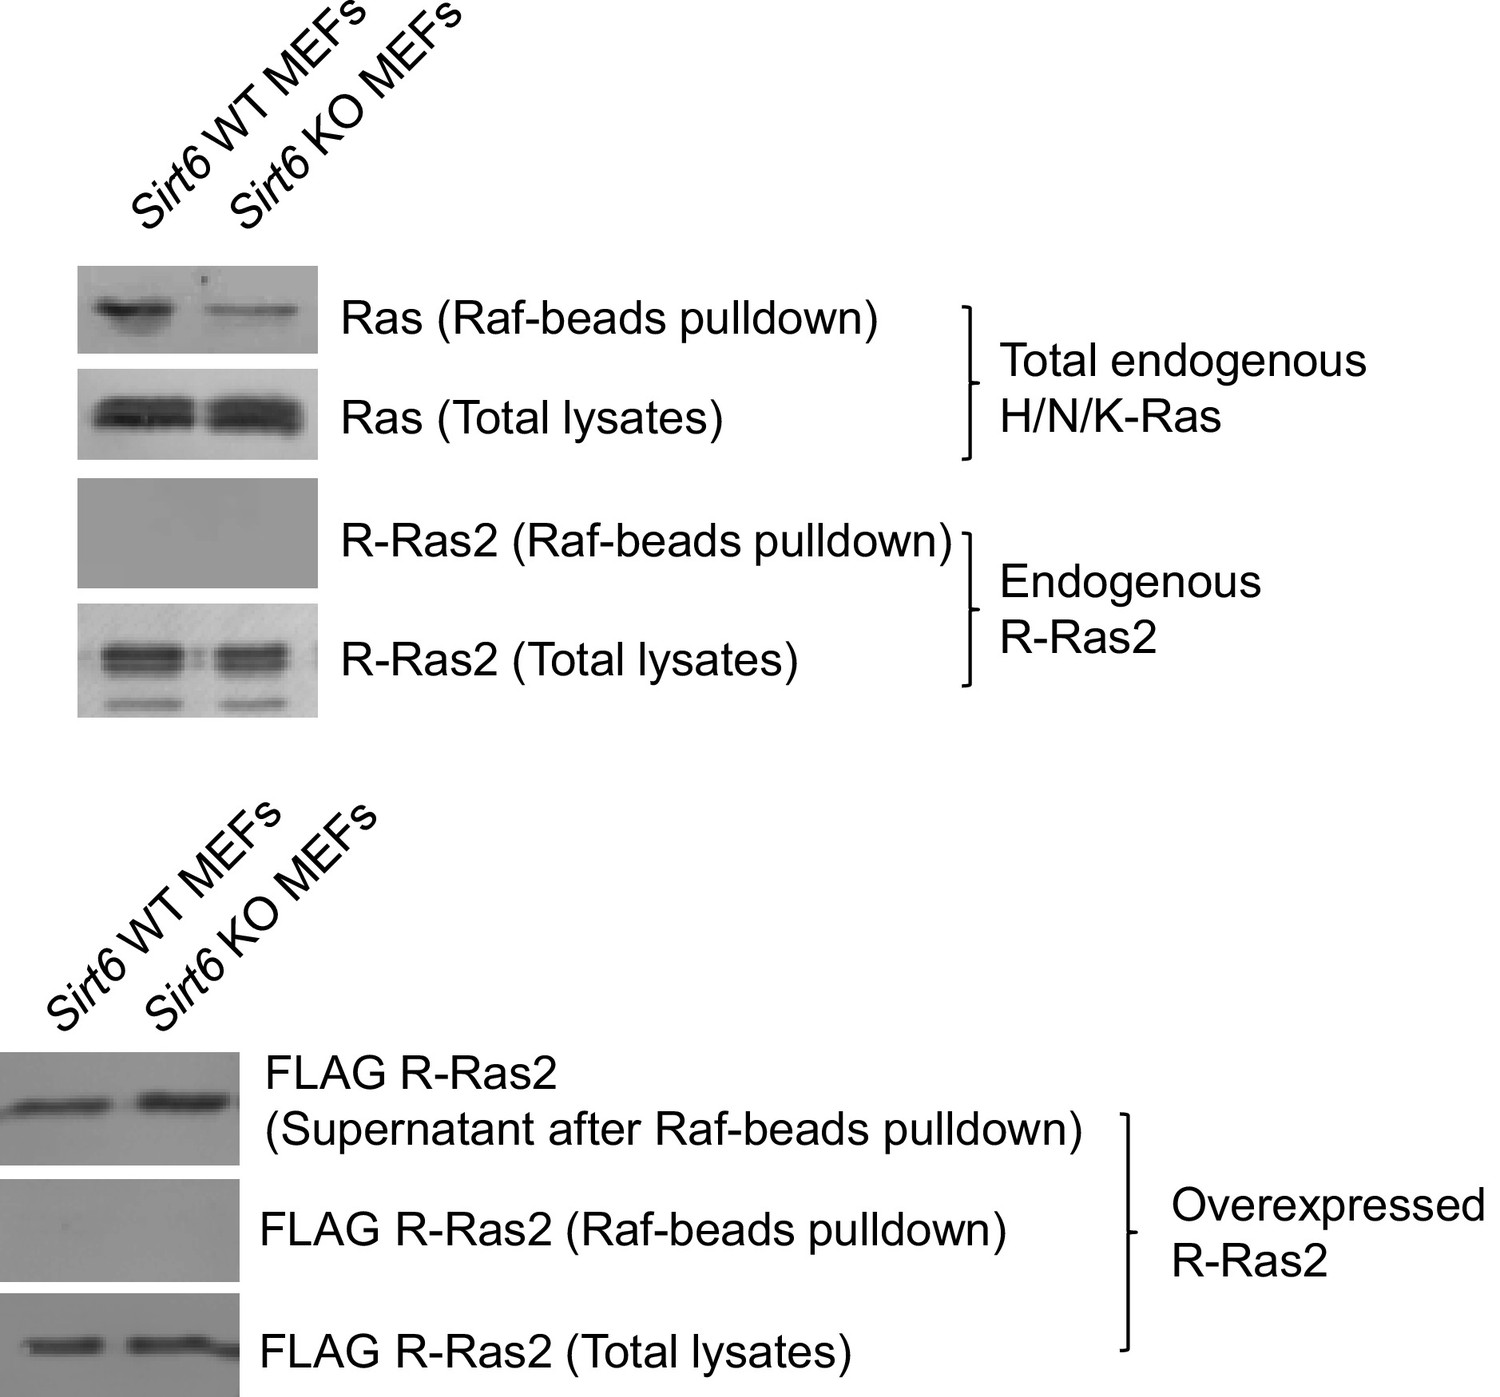
Raf-RBD binding assay showed that both overexpressed and endogenous R-Ras2 did not bind Raf RBD-conjugated argarose beads.
Total endogenous Ras (H-Ras, N-Ras and K-Ras) was used as the positive control.
Figure 4—figure supplement 2
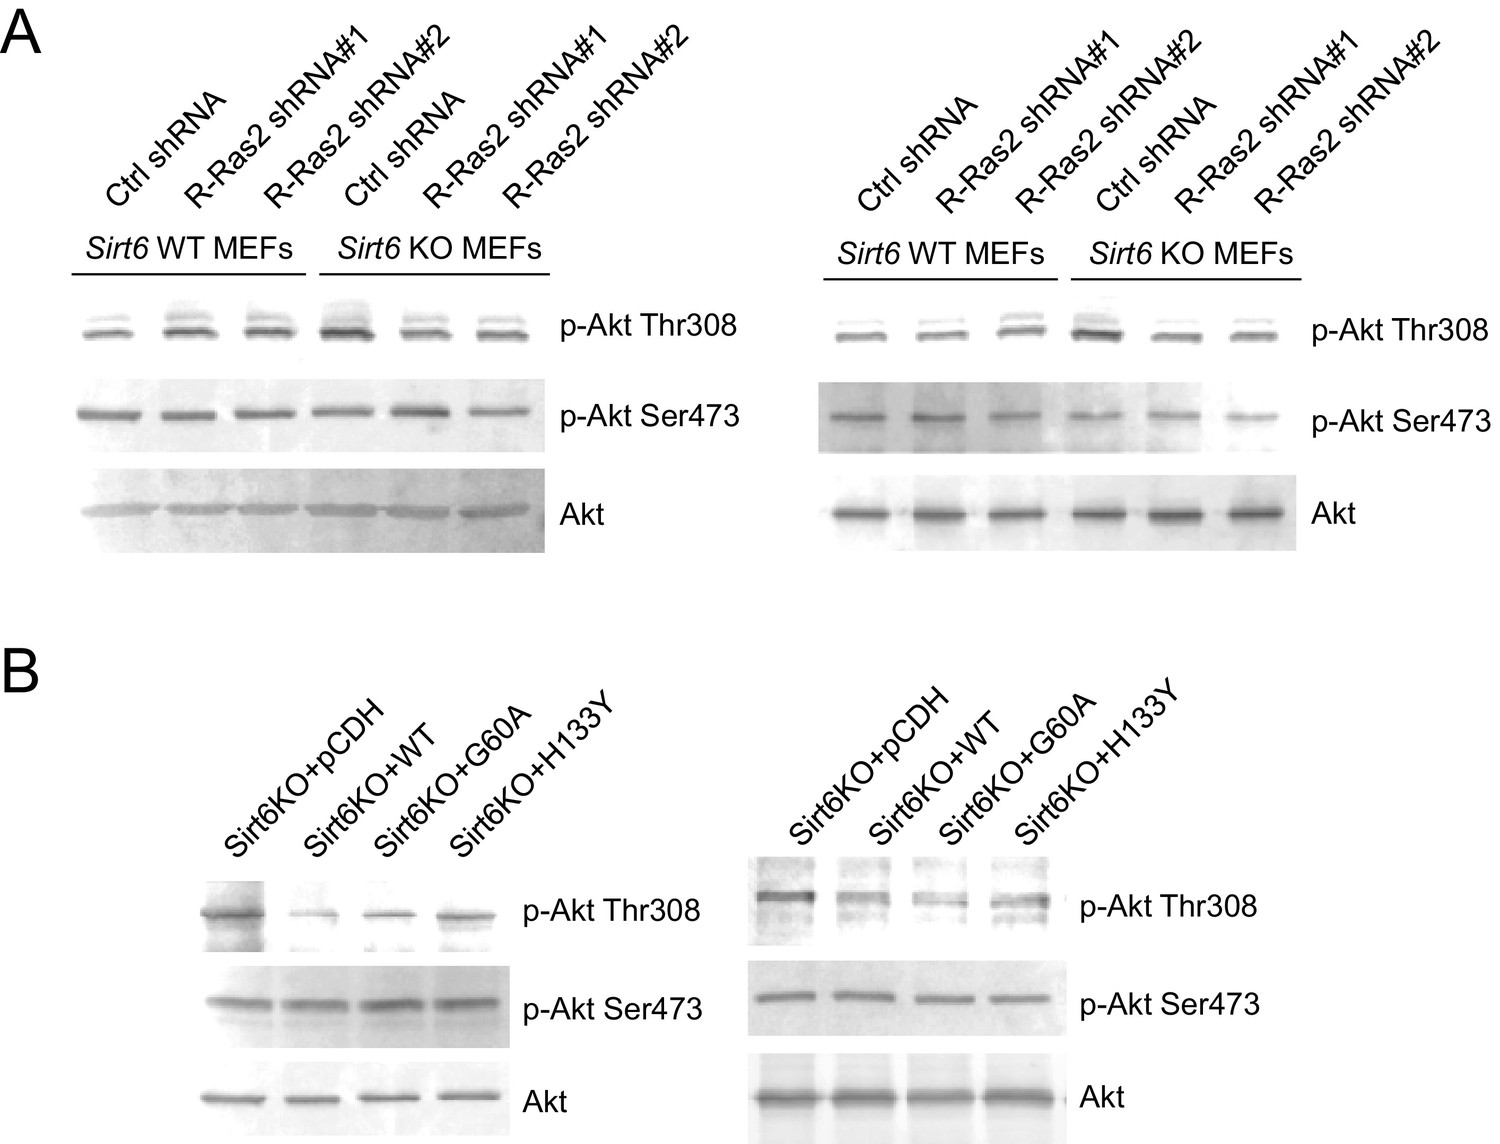
The images of other western blots for quantification.
(A) Knockdown of R-Ras2 in Sirt6 KO MEFs decreased p-Akt Thr308, but not p-Akt Ser473, to a level similar to that in Sirt6 WT MEFs. (B) Expressing SIRT6 WT or SIRT6 G60A in Sirt6 KO MEFs decreased p-Akt Thr308, but not p-Akt Ser473.
Additional files
-
Supplementary file 1
Protein list of Alk12 SILAC in Sirt6 WT and KO MEFs
- https://doi.org/10.7554/eLife.25158.015
-
Supplementary file 2
Protein list of Alk14 SILAC in Sirt6 WT and KO MEFs
- https://doi.org/10.7554/eLife.25158.016
-
Supplementary file 3
Protein list of total protein SILAC in Sirt6 WT and KO MEFs
- https://doi.org/10.7554/eLife.25158.017
Download links
A two-part list of links to download the article, or parts of the article, in various formats.
Downloads (link to download the article as PDF)
Open citations (links to open the citations from this article in various online reference manager services)
Cite this article (links to download the citations from this article in formats compatible with various reference manager tools)
SIRT6 regulates Ras-related protein R-Ras2 by lysine defatty-acylation
eLife 6:e25158.
https://doi.org/10.7554/eLife.25158


