Chemical structure-guided design of dynapyrazoles, cell-permeable dynein inhibitors with a unique mode of action
- Rockefeller University, United States
- Feinberg School of Medicine, Northwestern University, United States
- Tri-Institutitional Therapeutics Discovery Institute, United States
- Takeda Pharmaceuticals Ltd, Japan
- Medical Research Council Laboratory of Molecular Biology, United Kingdom
- California Institute of Technology, United States
- Stanford University School of Medicine, United States
- Stanford University, United States
Figures
Figure 1 with 1 supplement
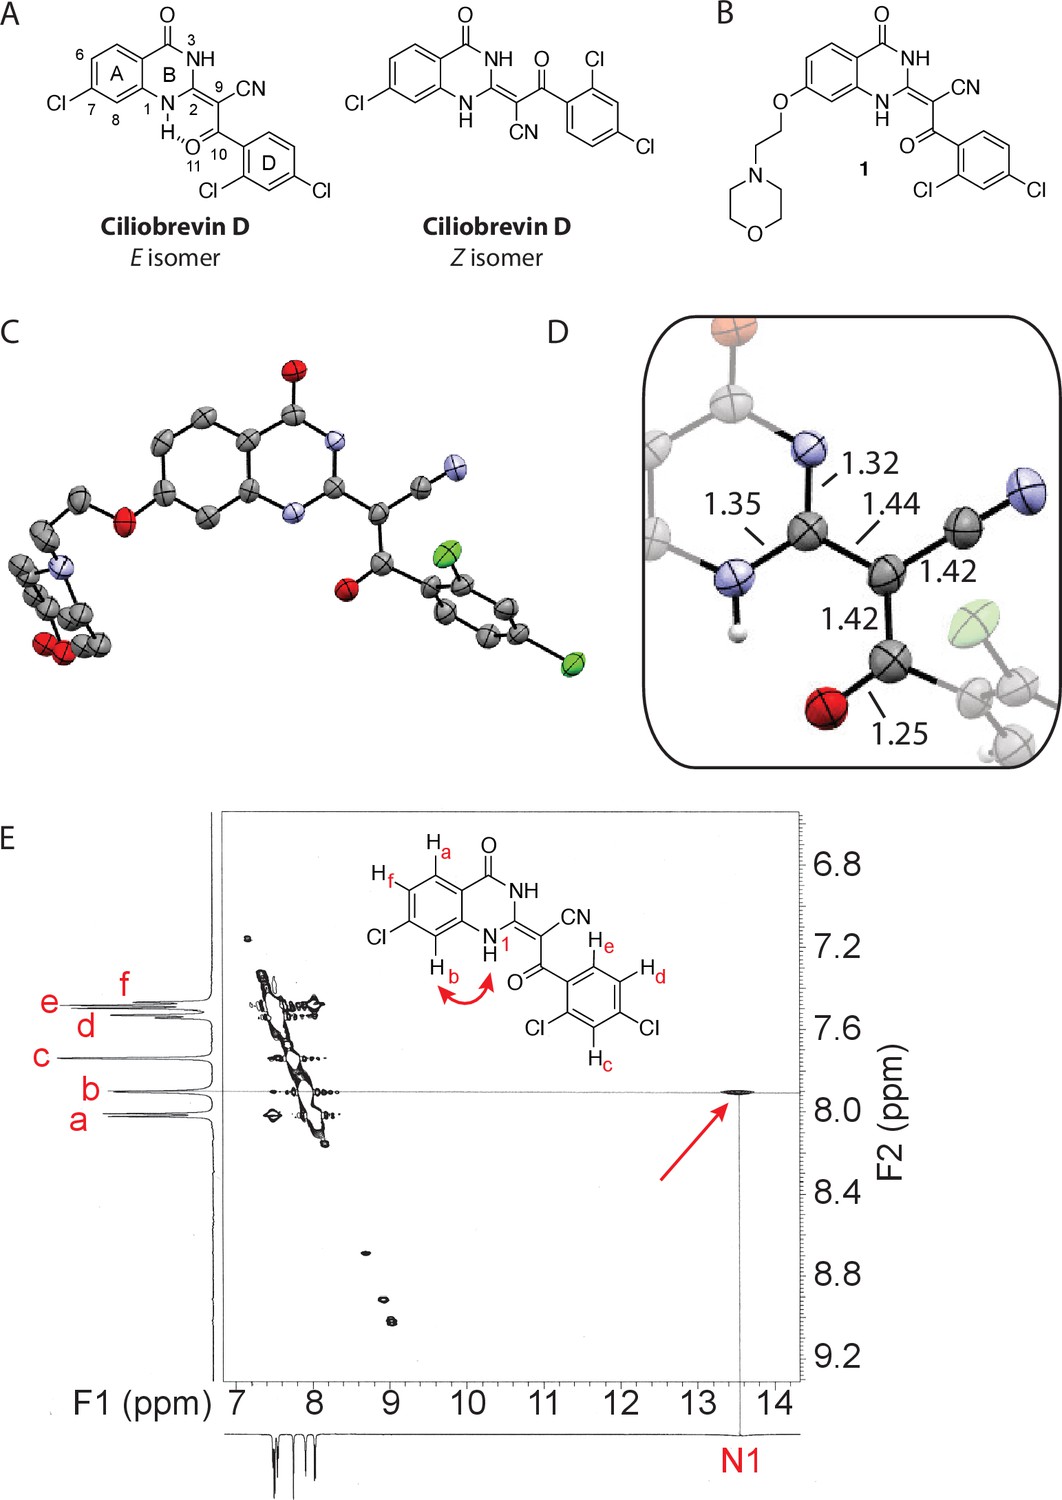
Analysis of the conformation of the ciliobrevin scaffold.
(A) E and Z isomers about the C2-C9 bond of ciliobrevin D are shown. Possible hydrogen-bond in the E configuration is indicated (dashed line). Selected atoms are numbered for reference. (B) Compound 1 was used for x-ray crystallography. (C) X-ray structure of 1. Displacement ellipsoids are shown at the 50% probability level. (D) Enlarged (2x) image of acrylonitrile moiety with selected bond lengths indicated (Å). Protons are shown to illustrate possible hydrogen-bonding interaction. Color legend: carbon-grey, hydrogen-white, nitrogen-blue, oxygen-red, chlorine-green. (E) Nuclear Overhauser effect spectroscopy (NOESY) spectrum for ciliobrevin D. A cross-peak corresponding to interaction between Hb and the N1 proton is indicated with a single-headed arrow. Protons corresponding to peaks in the spectrum of ciliobrevin D are indicated. Coupling is indicated by a double-headed arrow. A one-dimensional proton NMR spectrum of ciliobrevin D is shown in Figure 1—figure supplement 1.
Figure 1—figure supplement 1
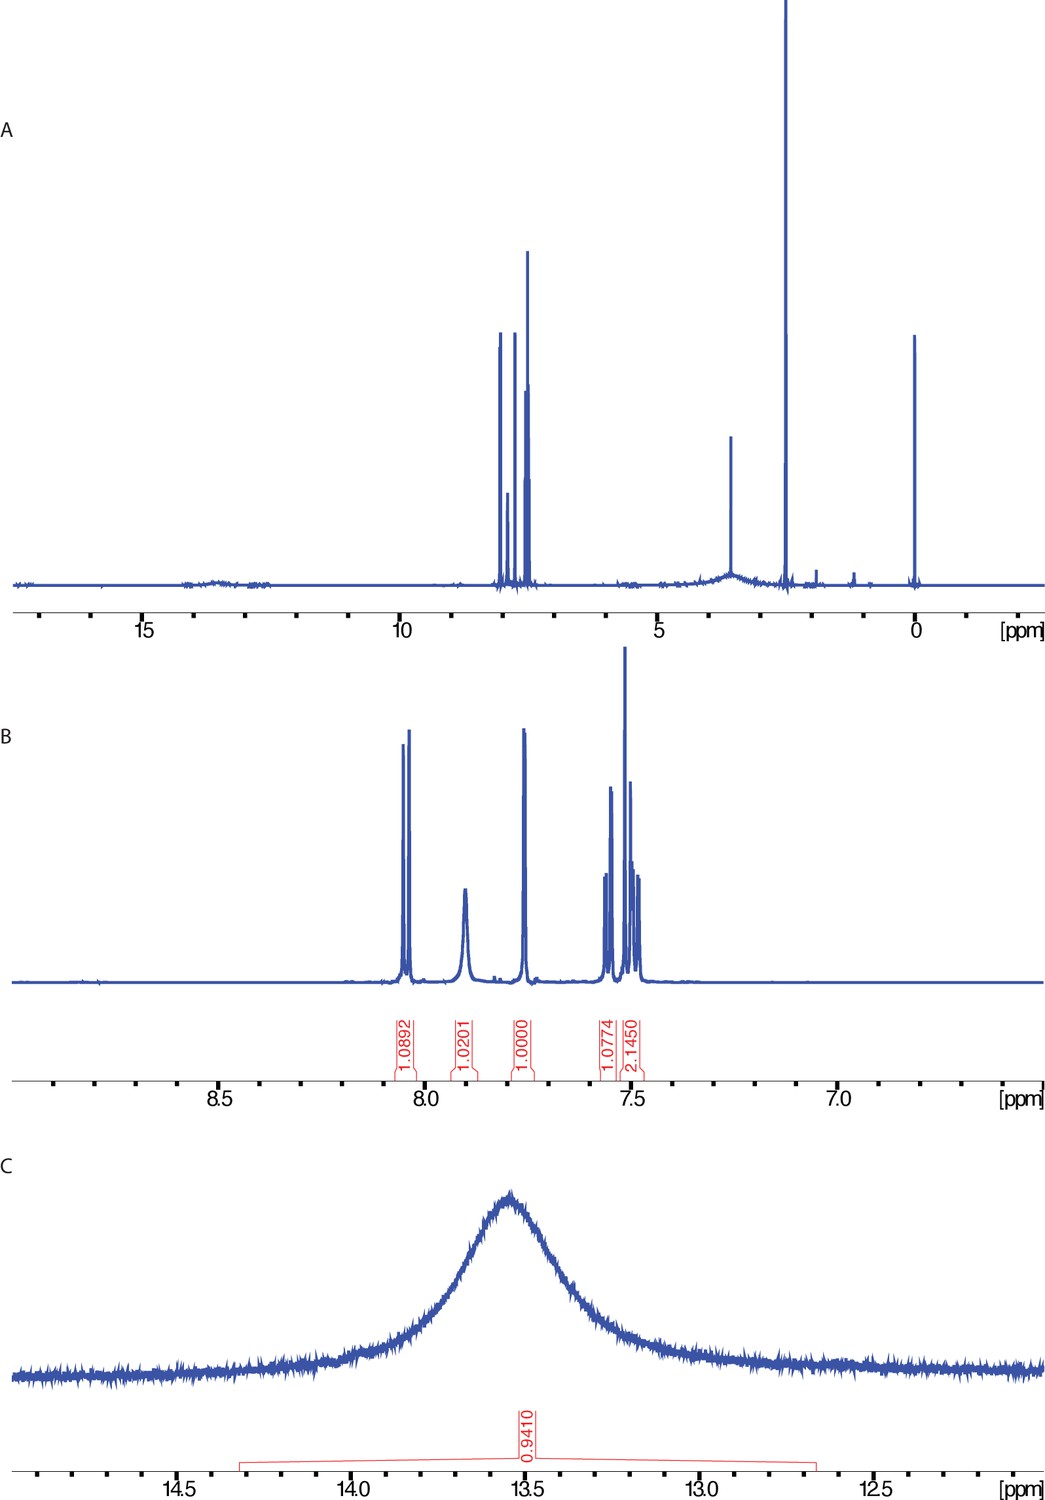
1H NMR spectrum of ciliobrevin D.
NMR taken on a 600 MHz instrument (solvent: DMSO-d6). (A) Full spectrum. (B) Enlarged view of the aromatic region. (C) Enlarged view highlighting peak at 13.5 ppm.
Figure 2
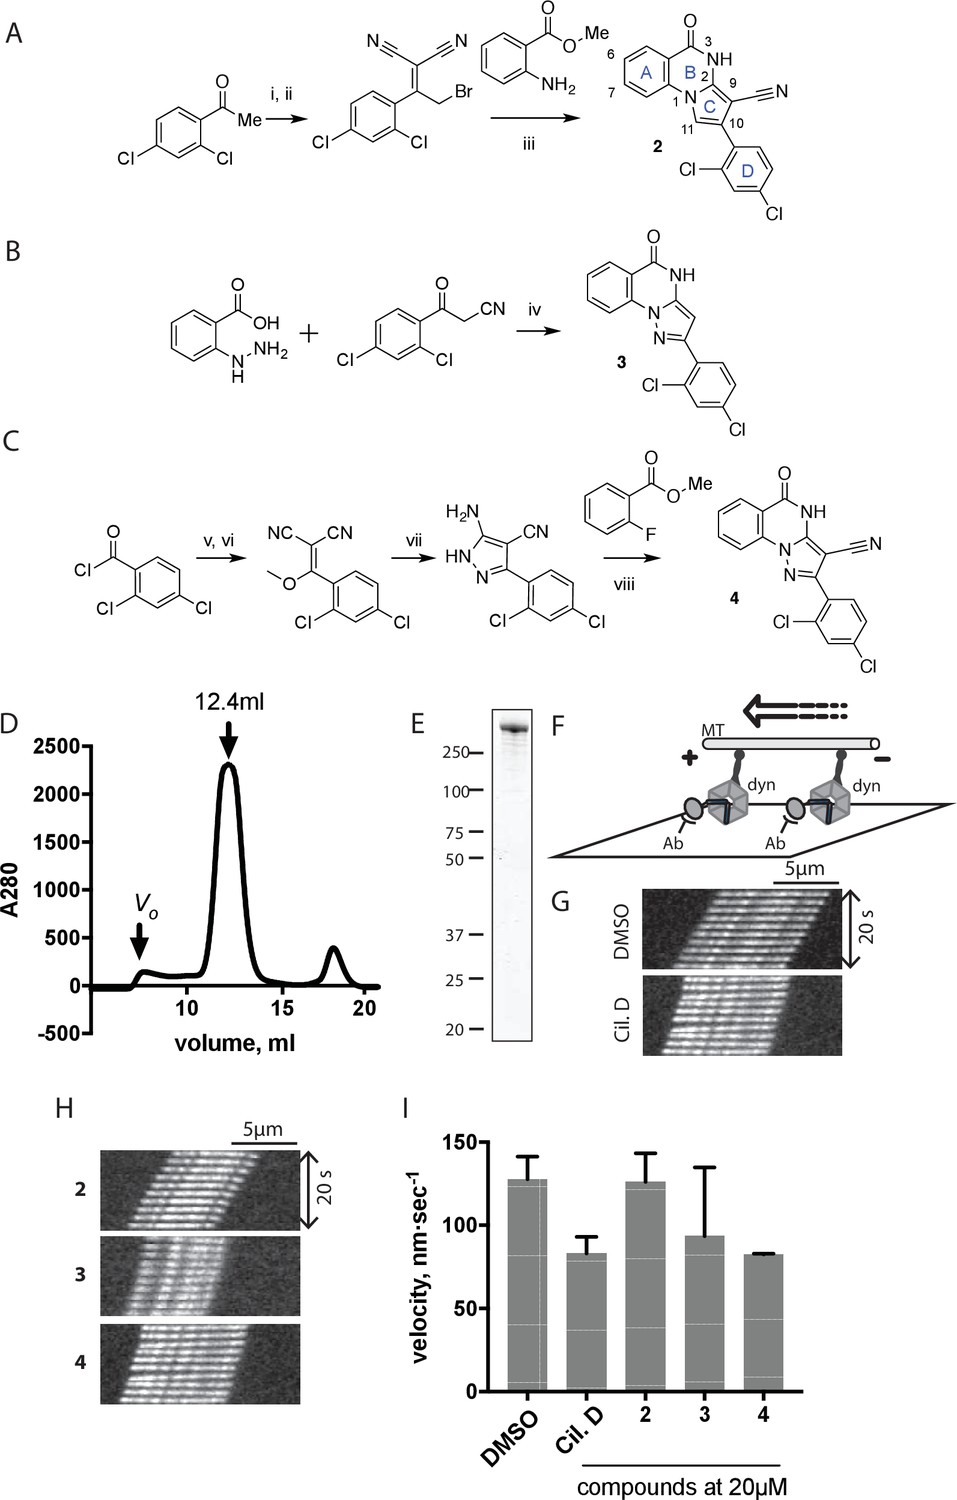
Synthesis of ciliobrevin D derivatives and analysis of their activity against dynein 2.
(A–C) Synthesis of ciliobrevin derivatives. (A) Pyrroloquinazolinone derivative. Reagents, conditions, and yield (%): (i) malononitrile, ammonium acetate, toluene, 100°C, 13 hr, 72%; (ii) bromine, carbon tetrachloride, 70°C, 9 hr, 38%; (iii) methyl anthranilate, isopropanol, 100°C, 20 hr, 15%. Selected atoms are numbered for reference. (B–C) Pyrazoloquinazolinone derivatives. Reagents, conditions, and yield (%): (iv) acetic acid, 150°C (microwave), 30 min, 26%. (v) malononitrile, sodium hydride, tetrahydrofuran, 0°C, 1 hr, 96%; (vi) dimethyl sulfate, N,N-diisopropylethylamine, dioxane, 60°C, 23 hr, 27%; (vii) hydrazine hydrate, ethanol, 80°C, 6 hr, 82%; (viii) methyl 2-fluorobenzoate, potassium carbonate, dimethylformamide, 140°C, 30 min, 11%. (D) Gel filtration trace (Superose 6) for GFP-dynein 2, with volume at elution peak indicated. Vo, void volume. (E) SDS-PAGE analysis (Coomassie blue stain) of GFP-dynein 2, ~0.5 µg protein loaded. (F) Schematic of microtubule motility assay. Anti-GFP antibody (Ab), GFP-dynein (dyn), and microtubule (MT) are indicated. (G) Montages of fluorescent microtubules moving on GFP-dynein-2-coated glass slides in the solvent control (2% DMSO) or in the presence of ciliobrevin D (20 µM). (H) Montages of fluorescent microtubules moving on GFP-dynein-2-coated glass coverslips in the presence of compounds 2–4 (20 µM). (I) Mean velocity of dynein-2-driven microtubule gliding in the presence of control solvent (2% DMSO), ciliobrevin D, or compounds 2–4 (mean. + S.D., n ≥ 3). Number of microtubules quantified: DMSO-327, Cil. D-85, 2–98, 3–90, 4–77. All motility assays were run at 1 mM MgATP, 0.05 mg/mL casein, and 2% DMSO. For all montages, the interval between successive images is 2 s and total time elapsed is 20s. Horizontal scale bar, 5 µm.
Figure 3 with 1 supplement
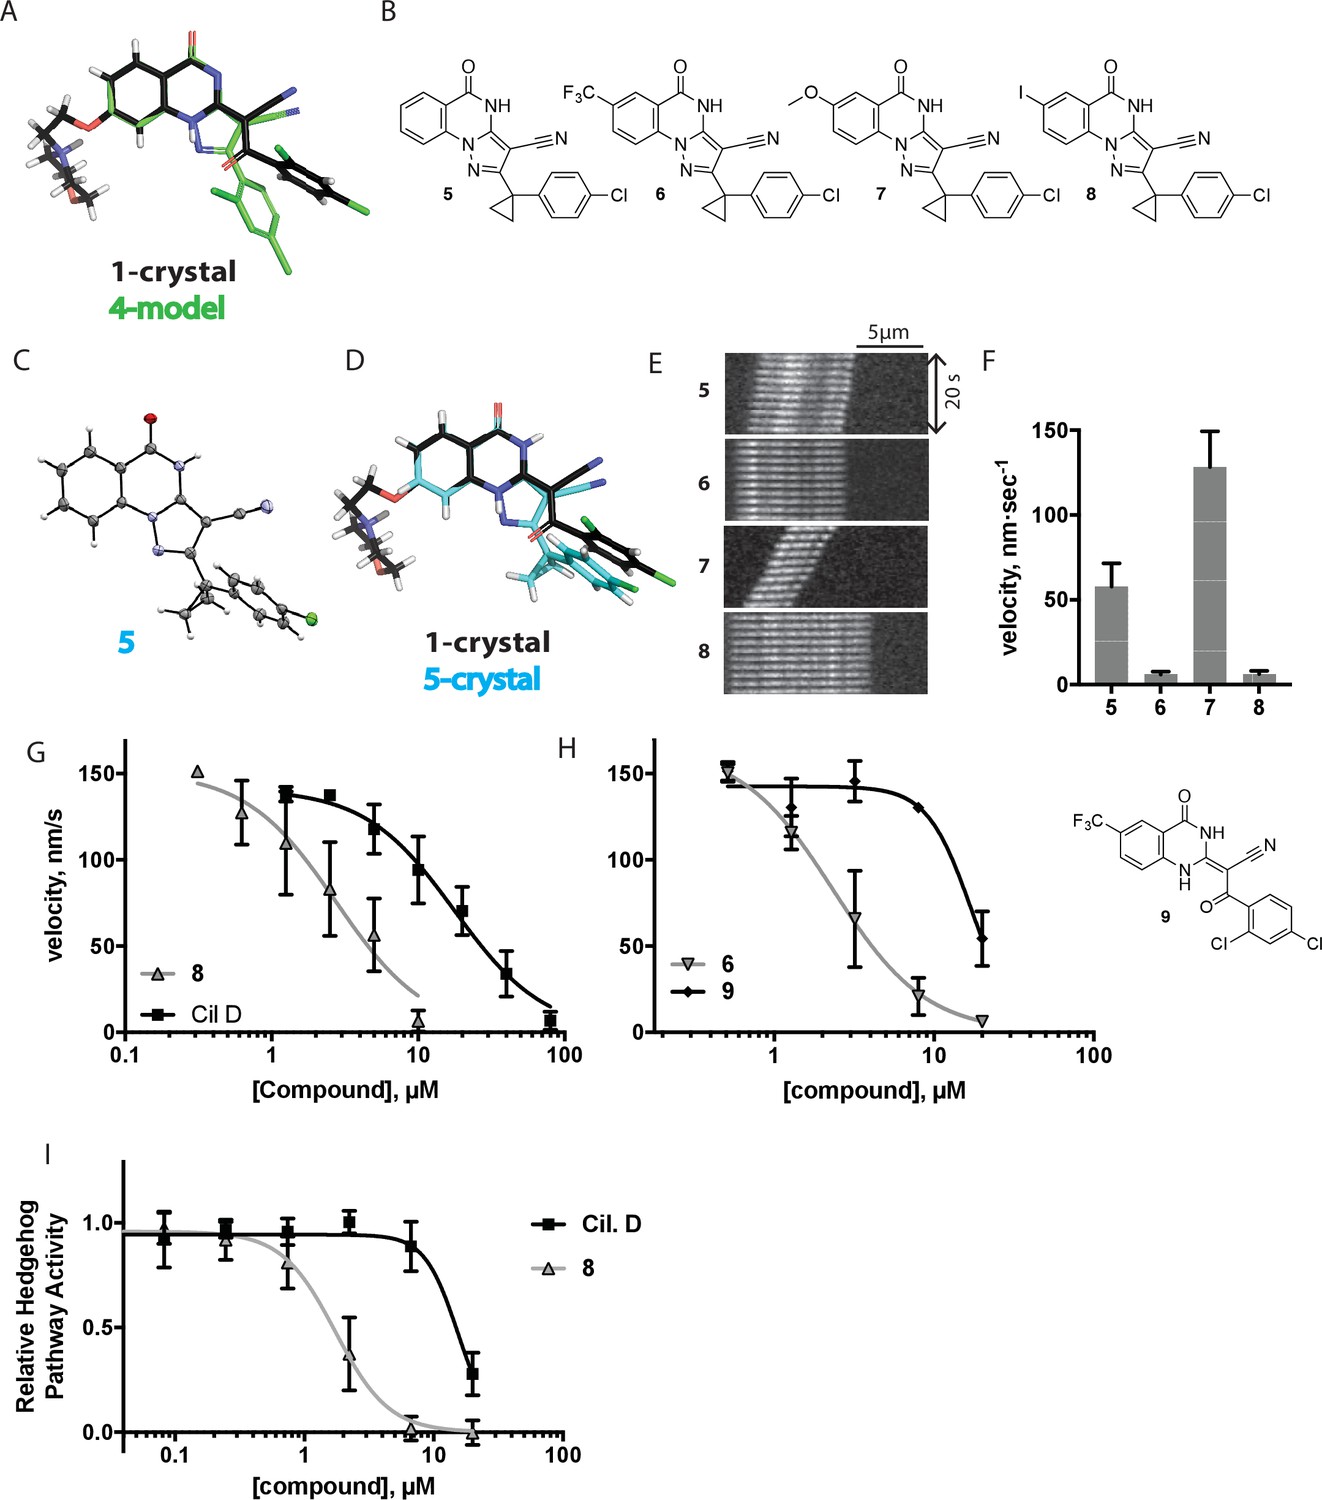
Chemical structure analysis, design, and evaluation of pyrazoloquinazolinone derivatives of ciliobrevin.
(A) Superposition of the crystal structure of 1 with the computational model of 4 (green). (B) Pyrazoloquinazolinone ciliobrevin derivatives with cyclopropyl group. (C) Crystal structure of 5. Displacement ellipsoids are shown at the 50% probability level. (D) Superposition of the crystal structure of 1 with the crystal structure of 5 (cyan). (E) Montages of fluorescent microtubules moving on GFP-dynein-2-coated glass coverslips in the presence of compounds 5–8 (20 µM). The interval between successive images is 2 s and total time elapsed is 20s. Horizontal scale bar, 5 µm. (F) Velocity of dynein-2-driven microtubule gliding in the presence of compounds 5–8 (mean + S.D., n ≥ 3). Number of microtubules quantified: 5–91, 6–63, 7–86, 8–56. (G) Inhibition of GFP-dynein-2-driven motility by 8 and ciliobrevin D. IC50 values: 8: 2.6 ± 1.3 µM (mean ± S.D., n = 3); ciliobrevin D: 20 µM (range: 19–21 µM, n = 2). Velocity distribution histograms for inhibition of dynein-2-driven microtubule motility are presented in Figure 3—figure supplement 1. Number of microtubules quantified: 8: 10 µM-36, 5 µM-59, 2.5 µM-98, 1.3 µM-112, 0.6 µM-102, 0.3 µM-126; Ciliobrevin D: 80 µM-10, 40 µM-47, 20 µM-78, 10 µM-85, 5 µM-99, 2.5 µM-66, 1.3 µM-80; (H) Inhibition of GFP-dynein-2-driven motility by 6 and 9. The chemical structure of 9 is shown. IC50 values: 6: 2.9 ± 0.6 µM (mean ± S.D., n = 3). 9: 17.7 µM (range: 17.2–18.2, n = 2). Number of microtubules quantified: 6: 20 µM-38, 8 µM-24, 3.2 µM-48, 1.3 µM-50, 0.5 µM-53; 9: 20 µM-29, 8 µM-54, 3.2 µM-50, 1.3 µM-54, 0.5 µM-56. (I) Dose-dependent inhibition of Gli-driven luciferase reporter expression by ciliobrevin D and compound 8. IC50 values (mean ± S.D.): ciliobrevin D: 15.5 ± 3 µM (n = 4); 8: 1.9 ± 0.6 µM (n = 5). For G, H, and I, IC50 values reported reflect the mean (with range if n = 2 or S.D. if n ≥ 3) of separate IC50 values obtained from independent dose-response analyses. Data were fit to a sigmoidal dose-response curve and the fit was constrained such that the value at saturating compound = 0. Individual data points presented reflect mean of values determined from n ≥ 2 independent replicates ± S.D. (G, I) or ± range (H). All motility assays were performed at 1 mM MgATP, 0.05 mg/mL casein, and 2% DMSO.
Figure 3—figure supplement 1
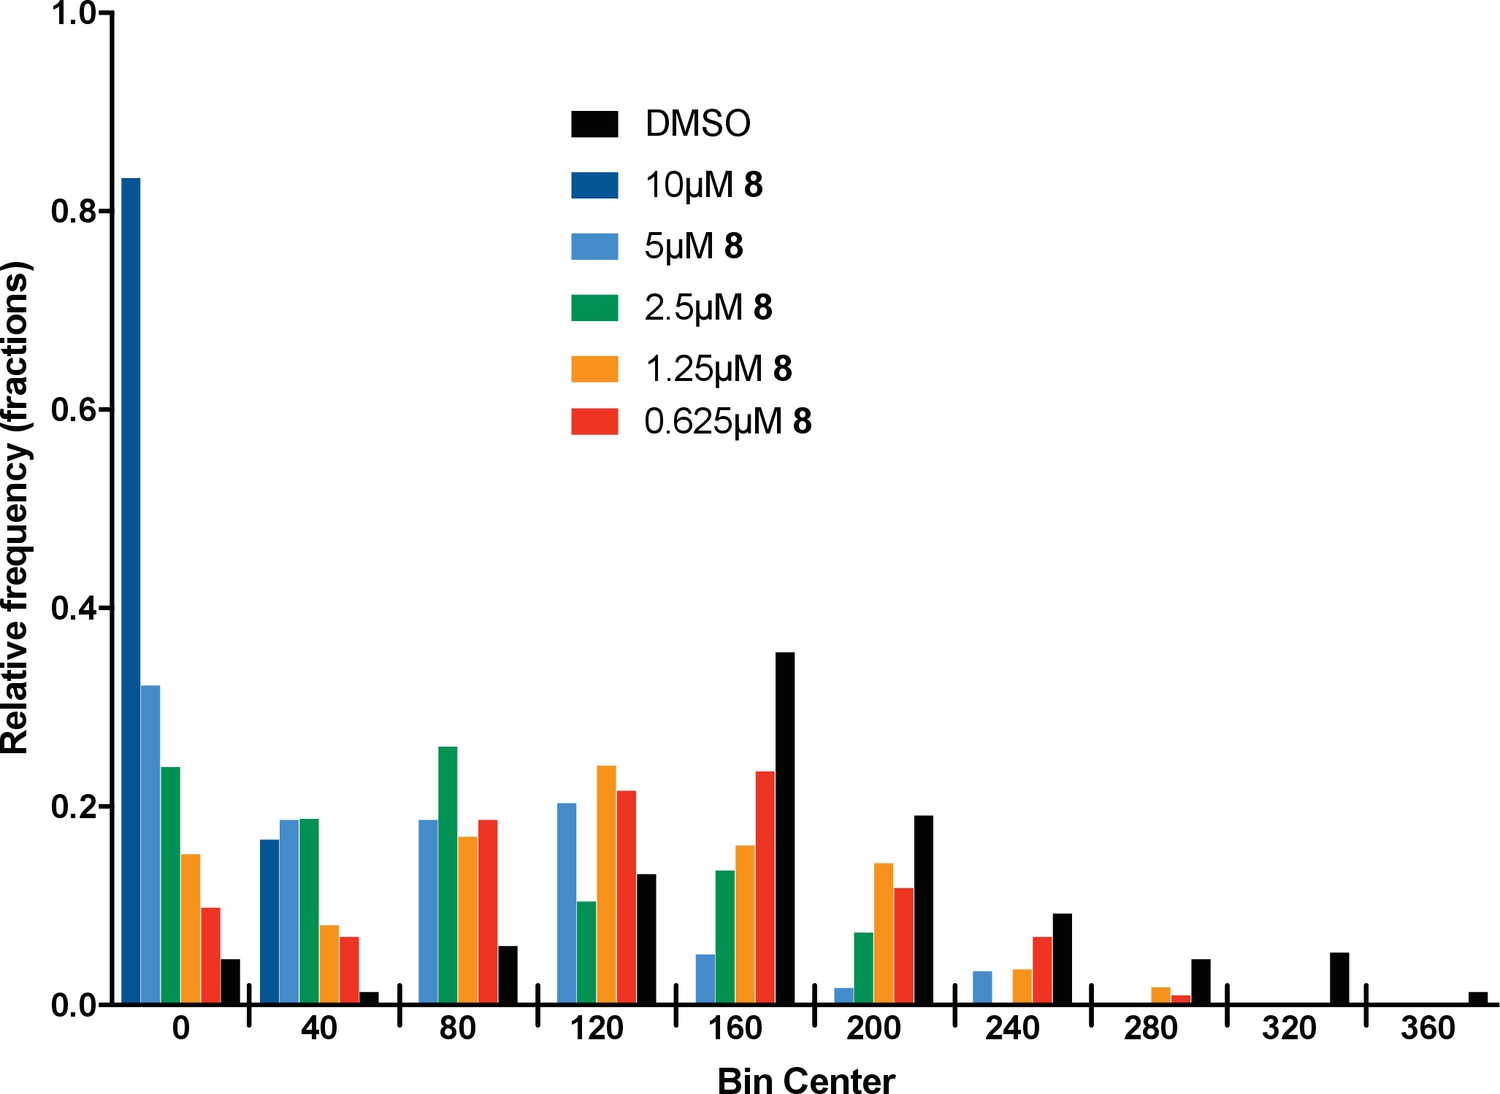
Microtubule velocity distribution histograms for dynein-2-driven microtubule gliding in the presence of different concentrations of compound 8.
At least 36 microtubules were analyzed per experimental condition.
Figure 4 with 3 supplements
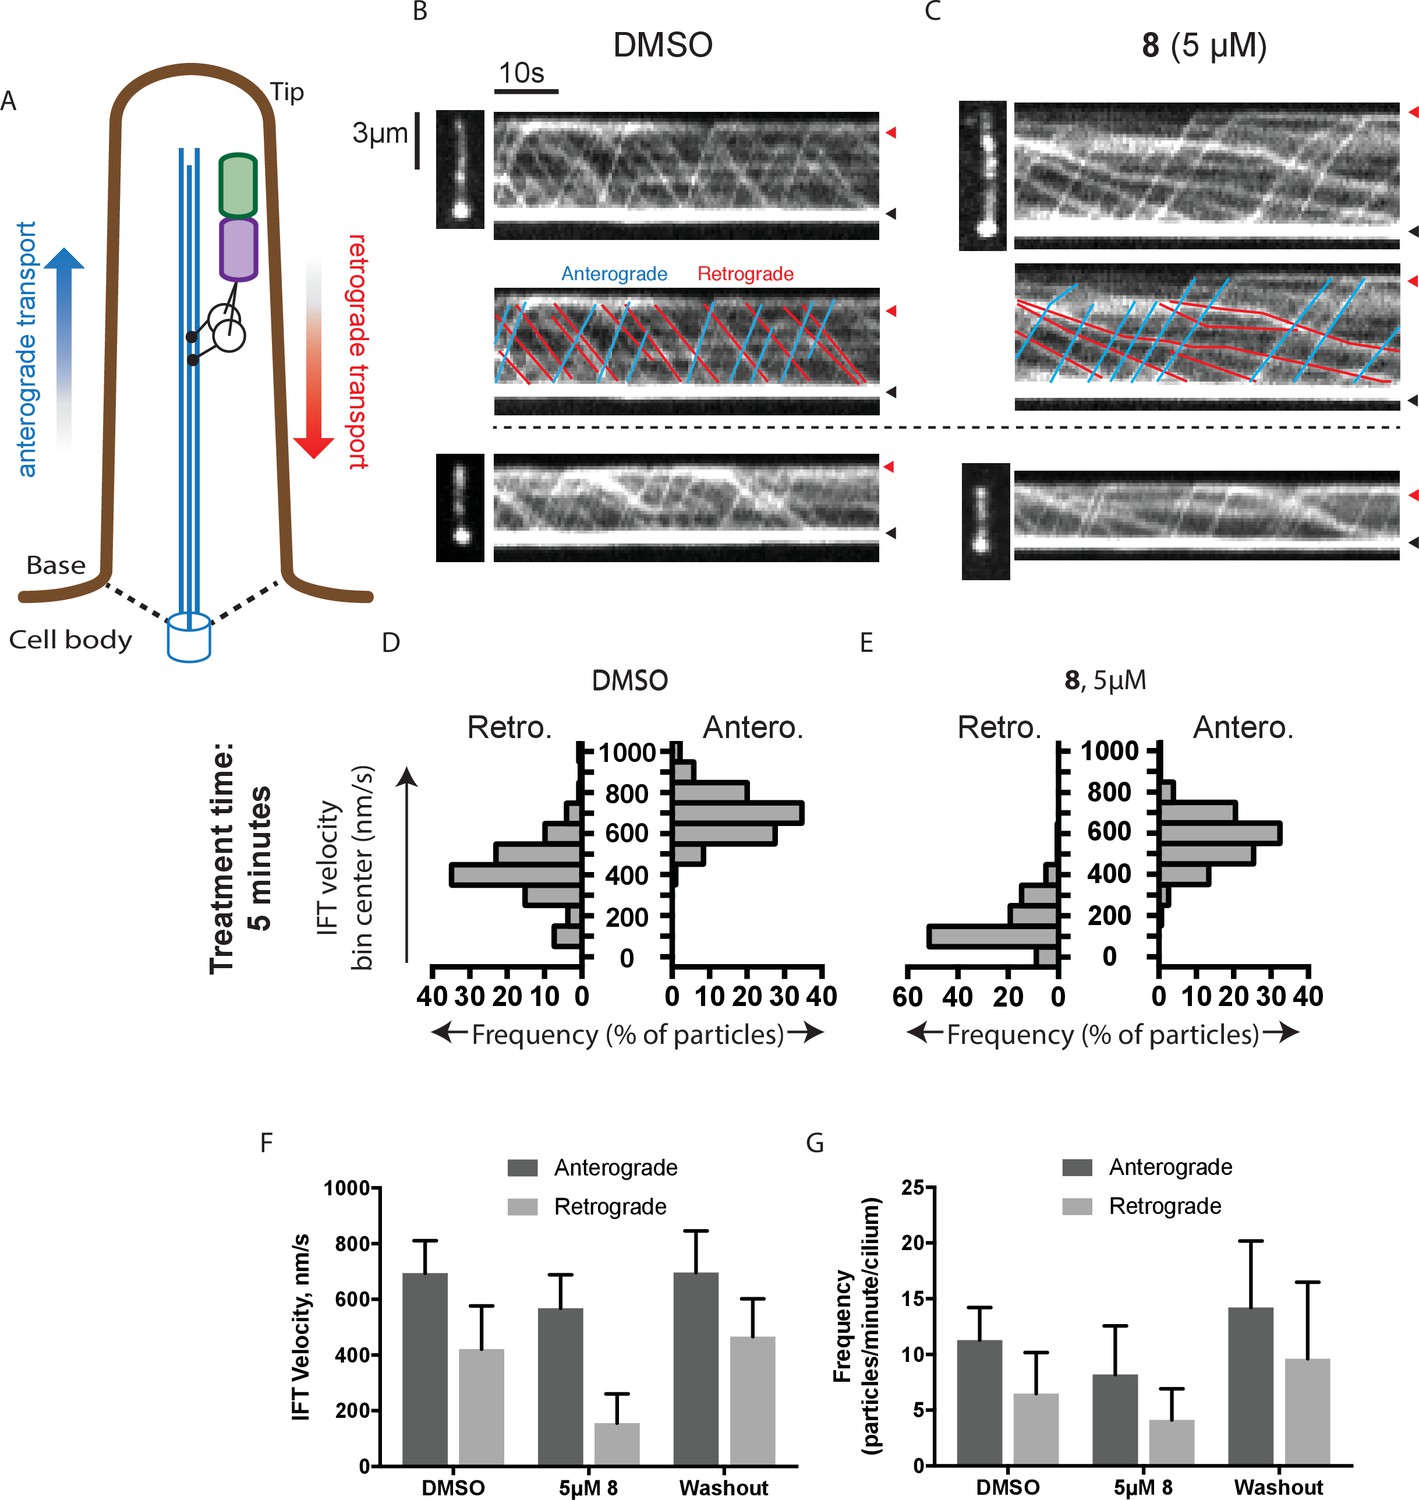
Analysis of the effect of dynapyrazole-A (8) on intraflagellar transport.
(A) Schematic of cilium showing microtubule-based axoneme (blue) and dynein (black), and an intraflagellar transport particle (purple) containing mNeonGreen-IFT88 (green). Anterograde and retrograde transport directions are indicated. (B–C) Images from time-lapse series and associated kymographs showing motion of mNeonGreen-IFT88-containing particles in primary cilia of living murine kidney cells (IMCD3). Cilium tip (red arrowhead) and base (black arrowhead) are indicated. Red (retrograde) and blue (anterograde) traces have been added to one kymograph per condition to illustrate particle tracks. Image scale bar, 3 µm; Kymograph horizontal scale bar, 10 s; kymograph vertical scale bar, 3 µm. (D–E) Velocity distribution histograms showing anterograde and retrograde velocities in the solvent control (0.3% DMSO, D) and in the presence of 5 µM 8 (E) at 5 min after initiation of experiment. Analyses of cells treated with 5 µM 8 for 10 min are shown in Figure 4—figure supplement 1. Analyses of cells treated with 10 µM 8 are shown in Figure 4—figure supplement 2. (F–G). Intraflagellar transport velocities (F) and frequencies (G) after washout of dynapyrazole-A. Bars represent mean + S.D. Data analysis (Va, anterograde velocity, nm/s; Vr, retrograde velocity, nm/s; Fa, anterograde frequency, counts/minute; Fr, retrograde frequency, counts/minute; values are mean ± S.D. Na, number of anterograde particles analyzed; Nr, number of retrograde particles analyzed; C, number of cilia analyzed). DMSO, Va 694 ± 117, Vr 421 ± 156, Fa 11.3 ± 3, Fr 6.5 ± 4, Na 429, Nr 244, C 38; 5 µM 8, Va 566 ± 116, Vr 156 ± 107, Fa 8.5 ± 5, Fr 4.1 ± 3, Na 443, Nr 211, C 52; Washout, Va 697 ± 149, Vr 467 ± 136, Fa 14.2 ± 6, Fr 9.6 ± 7, Na 256, Nr 173, C 18.
Figure 4—figure supplement 1

Analysis of intraflagellar transport following 10 min exposure to 5 µM dynapyrazole-A (compound 8).
(A) Velocity distribution histograms showing anterograde and retrograde velocities in the solvent control (0.3% DMSO) and in the presence of 5 µM compound 8 (B) at 10 min after treatment. (C) Analysis of intraflagellar transport particle frequencies. Data analysis (Va, anterograde velocity, nm/s; Vr, retrograde velocity, nm/s; Fa, anterograde frequency, counts/minute; Fr, retrograde frequency, counts/minute; values are mean ± S.D. Na, number of anterograde particles analyzed; Nr, number of retrograde particles analyzed; C, number of cilia analyzed). DMSO, Va 655 ± 124, Vr 354 ± 134, Fa 10.2 ± 3, Fr 5.9 ± 3, Na 276; Nr 145, C 18; 5 µM 8, Va 572 ± 121, Vr 202 ± 180, Fa 6.9 ± 4, Fr 4.2 ± 3, Na 125, Nr 75, C 18.
Figure 4—figure supplement 2
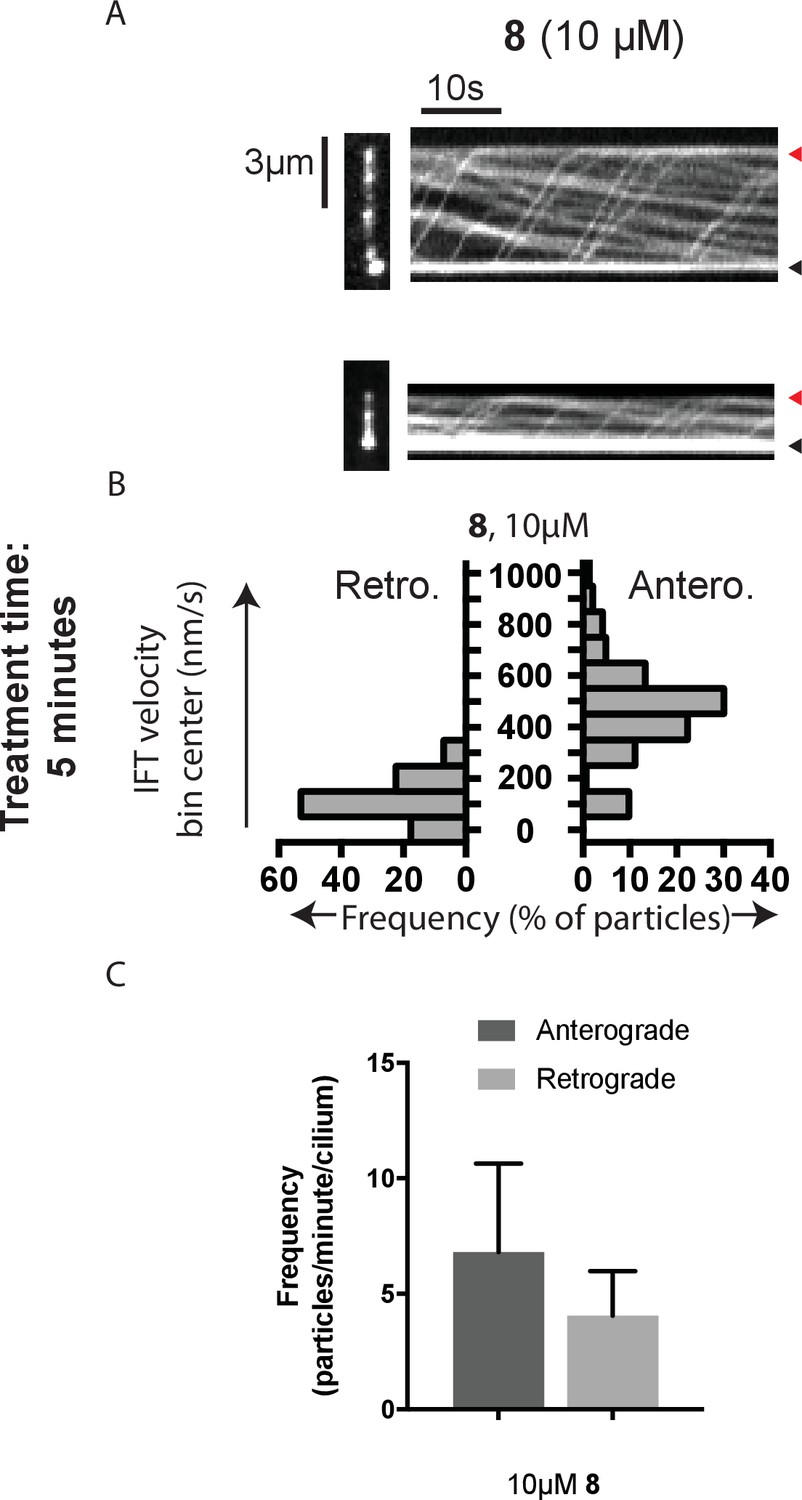
Analysis of intraflagellar transport at 10 µM dynapyrazole-A (compound 8).
(A) Still images from time-lapse series and associated kymographs of mNeonGreen-IFT88-containing particles in representative primary cilia treated with 10 µM compound 8. Still image scale bar, 3 µm; interval between frames, 0.5 s. Kymograph horizontal scale bar, 10 s; vertical scale is identical to cilium image. (B) Velocity distribution histograms for anterograde and retrograde motion. (C) Analysis of particle frequency in the presence of 10 µM compound 8. Data analysis (Va, anterograde velocity, nm/s; Vr, retrograde velocity, nm/s; Fa, anterograde frequency, counts/minute; Fr, retrograde frequency, counts/minute; values are mean ± S.D. Na, number of anterograde particles analyzed; Nr, number of retrograde particles analyzed; C, number of cilia analyzed). 10 µM 8, Va 466 ± 183, Vr 121 ± 78, Fa 6.8 ± 4, Fr 4.0 ± 2, Na 143, Nr 85, C 21.
Figure 4—figure supplement 3
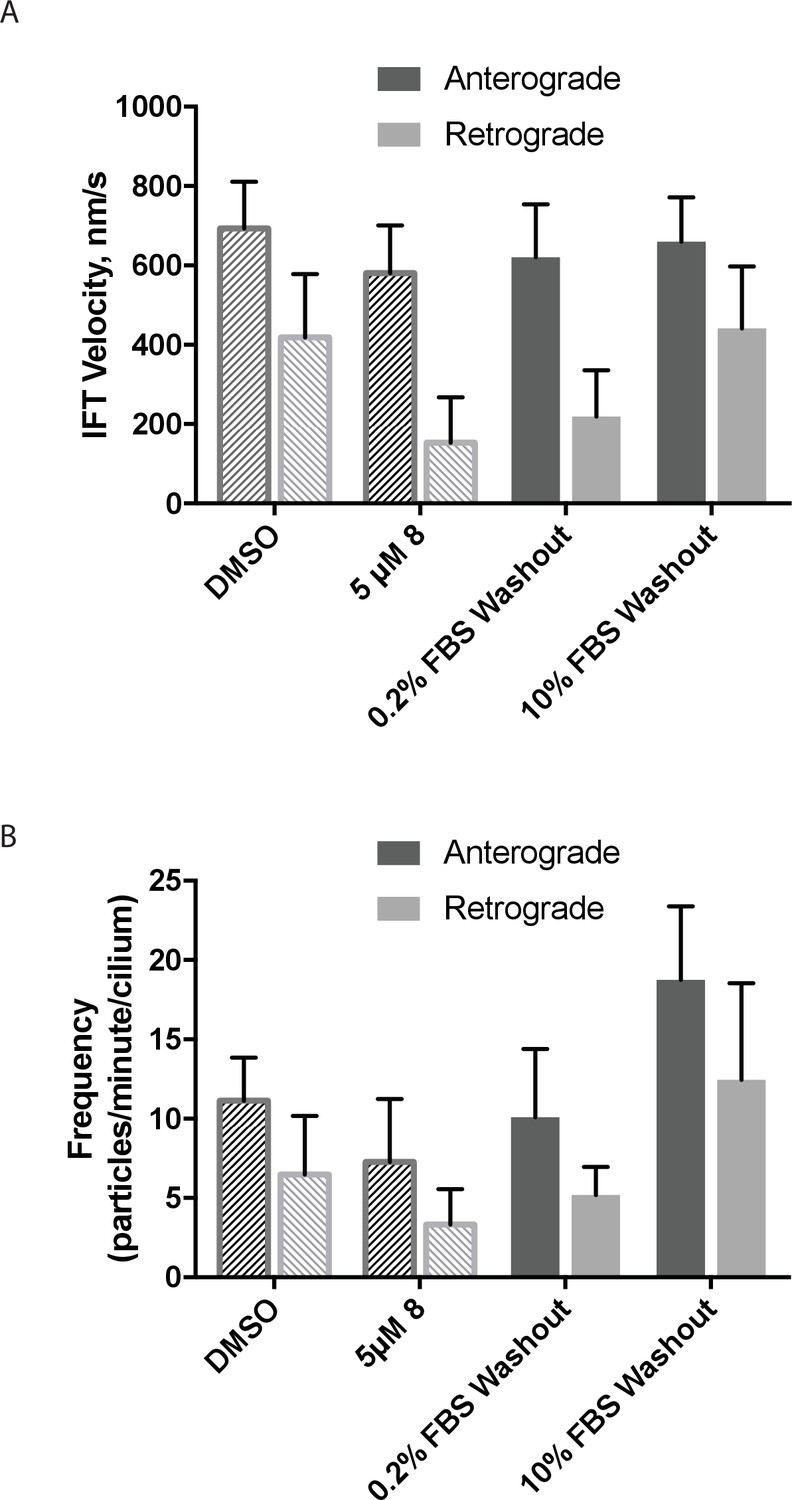
The effect of serum concentration on washout of dynapyrazole-A (compound 8) in intraflagellar transport assays.
(A) mNeonGreen-IFT88 particle velocities following washout of dynapyrazole-A for 1 hr in media with either low serum (0.2% FBS) or high serum (10% FBS). (B) Particle frequencies following low-serum and high-serum washout. Reference values for solvent control (0.3% DMSO) and inhibited/pre wash-out (5 µM 8) states are shown as checked bars in both (A and B). These values are also shown in Figure 4F and G, respectively, and are included here for reference. Bars represent mean ± S.D. Data analysis (Va, anterograde velocity, nm/s; Vr, retrograde velocity, nm/s; Fa, anterograde frequency, counts/minute; Fr, retrograde frequency, counts/minute; values are mean ± S.D. Na, number of anterograde particles analyzed; Nr, number of retrograde particles analyzed; C, number of cilia analyzed). 0.2% FBS washout, Va 620 ± 134, Vr 219 ± 117, Fa 10.1 ± 4, Fr 5.2 ± 2, Na 111, Nr 57, C 11. 10% FBS washout, Va 660 ± 112, Vr 441 ± 156, Fa 18.8 ± 5, Fr 12.4 ± 6, Na 283, Nr 186, C 16.
Figure 5 with 5 supplements

Inhibition of dynein 1 activity by dynapyrazole-A (compound 8).
(A) Gel filtration trace (Superose 6) for GFP-dynein 1, with volume at elution peak indicated. Vo, void volume. (B) SDS-PAGE analysis (Coomassie blue stain) of GFP-dynein 1, ~0.5 µg protein loaded. (C) Montages of fluorescent microtubules moving on GFP-dynein 1-coated glass coverslips in the presence of 1 mM ATP and either DMSO, ciliobrevin D or 8 (10µM). The interval between successive images is 2 s and total time elapsed is 20s. Horizontal scale bar, 5 µm. (D) Inhibition of GFP-dynein 1-driven motility by 8 and ciliobrevin D (mean ± S.D., n = 3). IC50 values for 8: 2.3 ± 1.4 µM (n = 3); ciliobrevin D: 15 ± 2.9 µM (n = 3). Number of microtubules quantified: 8: 20 µM-98, 10 µM-105, 5 µM-108, 2.5 µM-97, 1.3 µM-134, 0.6 µM-99, 0.3 µM-43, 0.2 µM-29; ciliobrevin D: 40 µM-64, 20 µM-74, 10 µM-82, 5 µM-79, 2.5 µM-81, 1.3 µM-87. IC50 values reported reflect the mean (± S.D.) of separate IC50 values obtained from independent dose-response analyses. Data were fit to a sigmoidal dose-response curve and the fit constrained such that the value at saturating compound >0. All motility assays were performed at 1 mM MgATP, 0.05 mg/mL casein, and 2% DMSO. Velocity distribution histograms for inhibition of dynein-1 driven microtubule motility are presented in Figure 5—figure supplement 1. Analysis of microtubule attachment to dynein-coated coverslips is presented in Figure 5—figure supplement 2. (E - J) Images of CAD cell neurites stained with Lysotracker Red. in the presence of DMSO control (0.1%), 3.5 µM and 5 µM (8). Scale bar, 10 µm. (E–G) Phase contrast microscopy images of CAD cells. (H–J) Overlay of successive images of lysosome motility in CAD cell neurites. Sixty images, spaced 1s apart, are stacked and successive images colored using FIJI according to the temporal color code shown. (K–M) Kymographs corresponding to images in H-J. The kymograph size is 60 s (vertical) by 37 µm (horizontal) and the anterograde and retrograde orientations are indicated. (N) Quantitation of lysosome velocity. (O) Quantitation of total lysosome displacement over the time course of imaging (1 min). Data are mean of n ≥ 2 experiments with ≥150 particles counted per experiment. Number of frame-to-frame velocities measured: DMSO-anterograde: 14167, DMSO-retrograde: 14973, 3.5 µM 8-anterograde: 11283, 3.5 µM 8-retrograde: 11340, 5 µM 8-anterograde: 9449, 5 µM 8-retrograde: 10458. For O, number of particles counted: DMSO-3770, 5 µM 8–2400, 3.5 µM 8–840. Error bars: S.D. (DMSO, 5 µM 8), or range of values (3.5 µM 8).
Figure 5—figure supplement 1
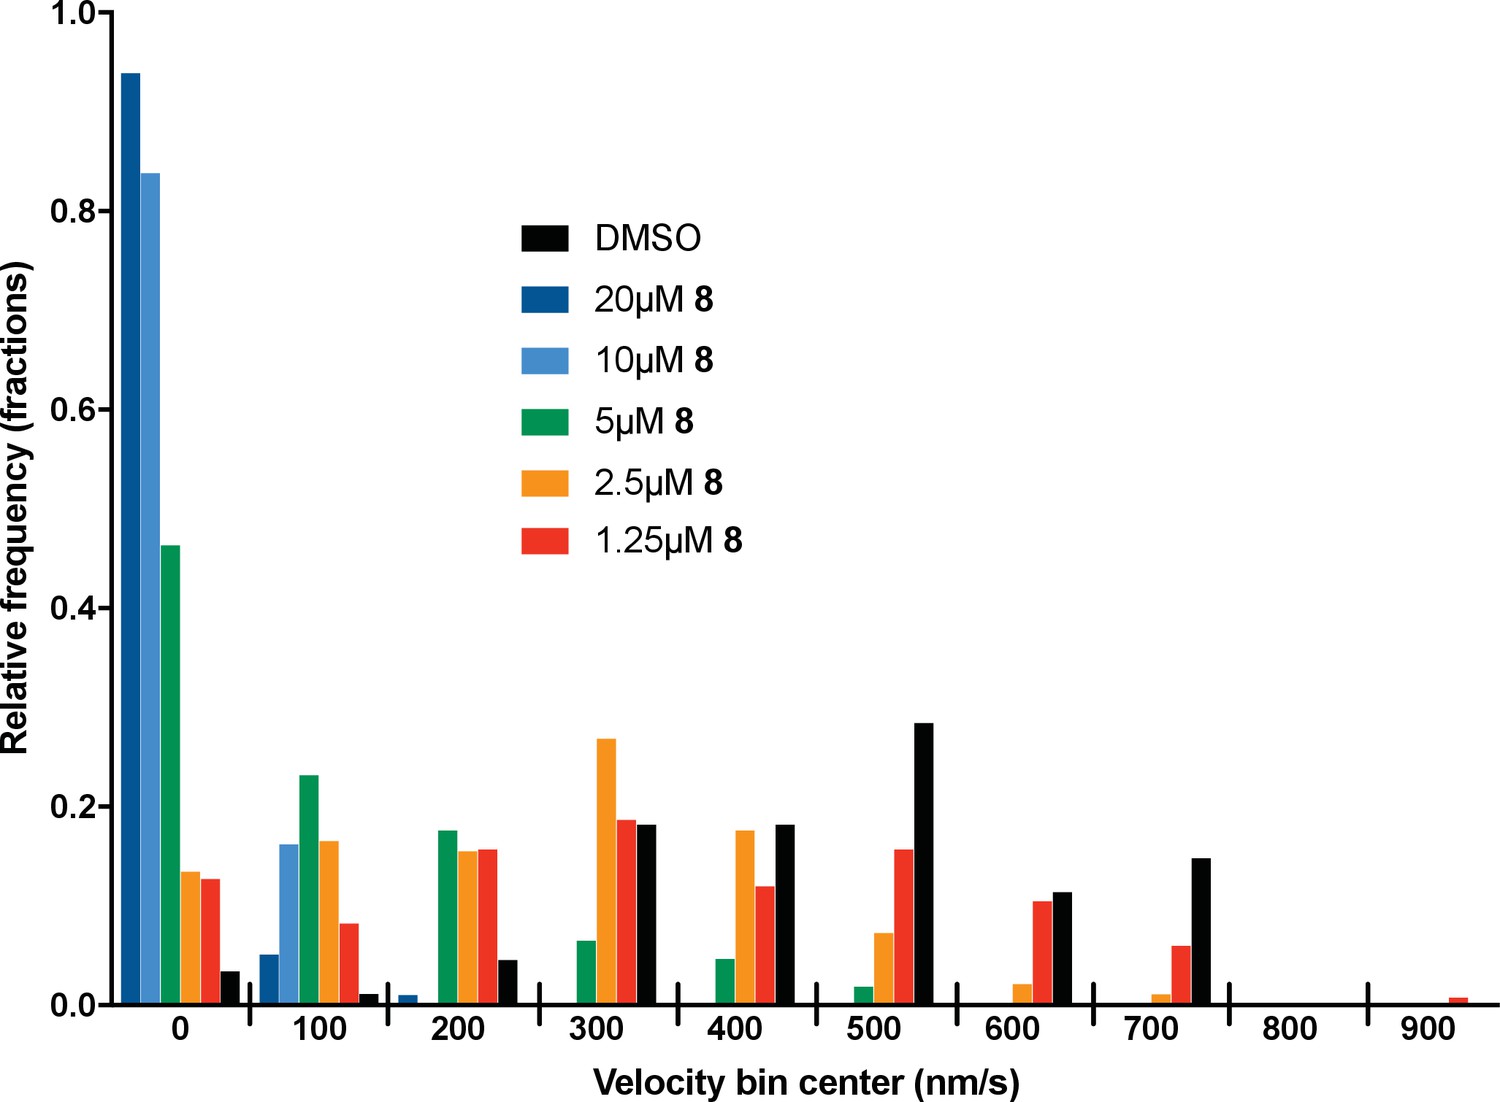
Microtubule velocity distribution histograms for dynein-1-driven microtubule gliding in the presence of different concentrations of compound dynapyrazole-A (compound 8).
At least 88 microtubules were analyzed per experimental condition.
Figure 5—figure supplement 2
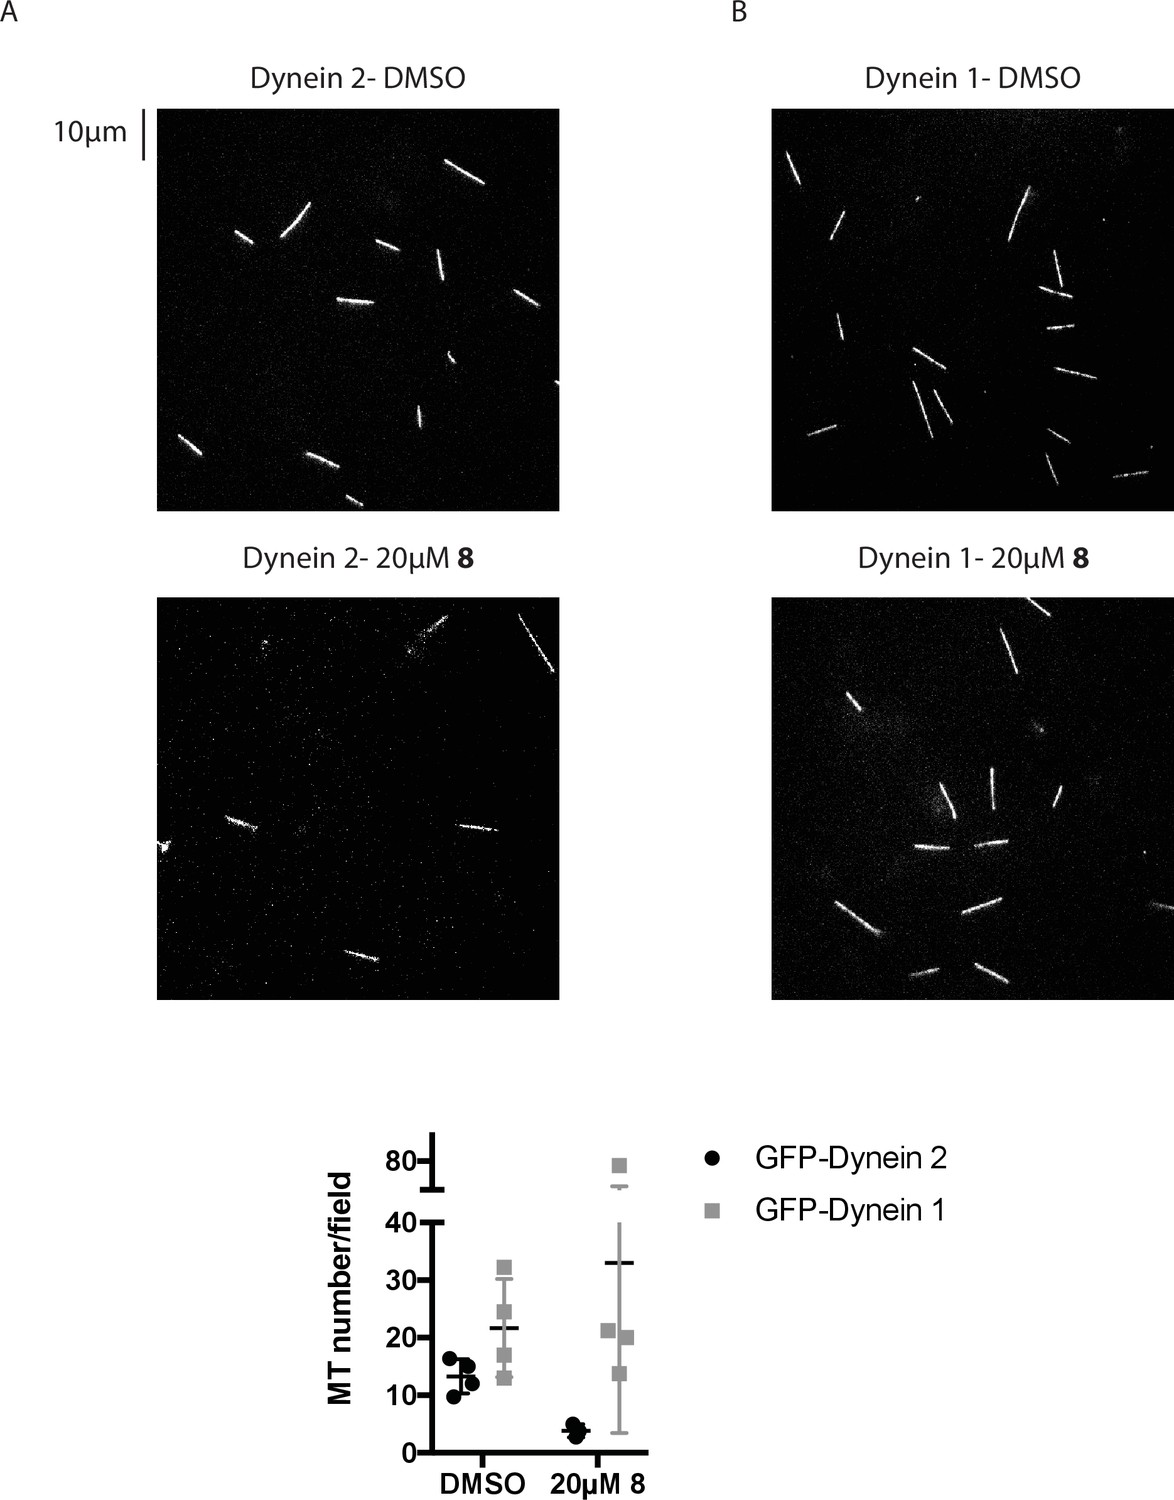
Analysis of the number of microtubules associated with coverslips in gliding assays.
(A, B) Images from time-lapse movies of microtubule motility driven by GFP-dynein 2 (A) or GFP-dynein 1 (B) at 1 mM MgATP. Scale bar, 10 µm. (C) Quantification of microtubule number. Each data point represents the average count of microtubules in four fields of view in a each independent experiment. Mean ± S.D from n ≥ 3 experiments.
Figure 5—figure supplement 3
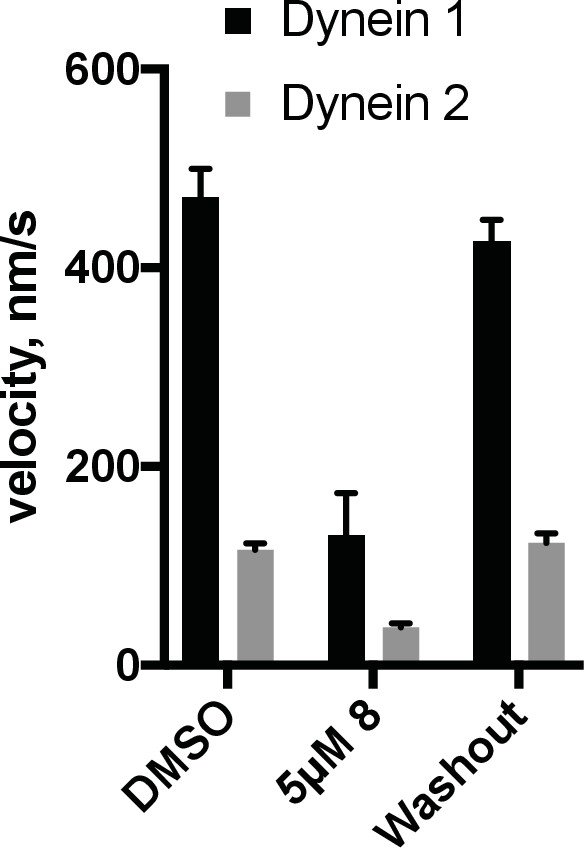
Reversibility of inhibition by dynapyrazole-A (compound 8).
The GFP-dynein 1 and GFP-dynein 2 motility assays were conducted at 1 mM ATP and 0.05 mg/mL casein. Chambers exposed to inhibitor (5 µM 8) were imaged and then buffer A (see motility methods) supplemented with 1 mM ATP was flowed into the chamber, followed by a 1-min incubation. This process was repeated twice and then reaction mix containing 2% DMSO and 1 mM ATP was flowed into the chamber using ~4 chamber volumes and the chambers were then sealed. Time-lapse movies of the washout condition were taken 10–15 min after last addition of reaction mix. Data shown reflect average of n = 3 washout experiments (+S.D.) and n = 2 for the DMSO controls (+ range).
Figure 5—figure supplement 4
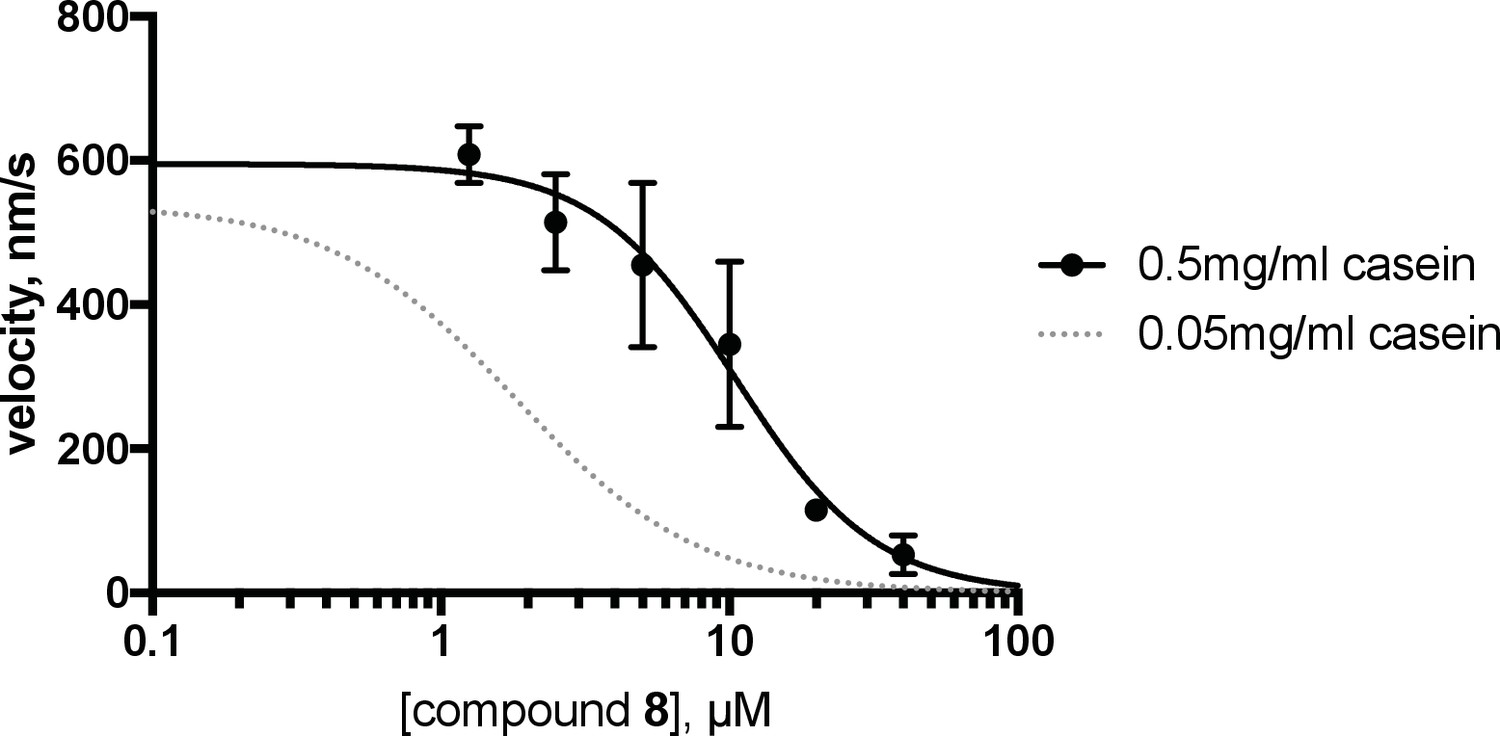
Analysis of the effect of blocking agent on dynein inhibition by dynapyrazole-A (compound 8).
The GFP-dynein 1 motility assay was conducted at 1 mM ATP in a reaction mix containing 0.5 mg/mL casein. Mean data from three experiments are shown (± S.D). In the presence of 0.5 mg/ml casein, the IC50 was 10.5 ± 4.6 µM (n = 3, mean of 3 separate IC50 fits, ± S.D.). Curves shown represent fit to average value for a given compound concentration. The curve shown in grey reflects the same data as used in Figure 5D (IC50 = 2.3 µM).
Figure 5—figure supplement 5
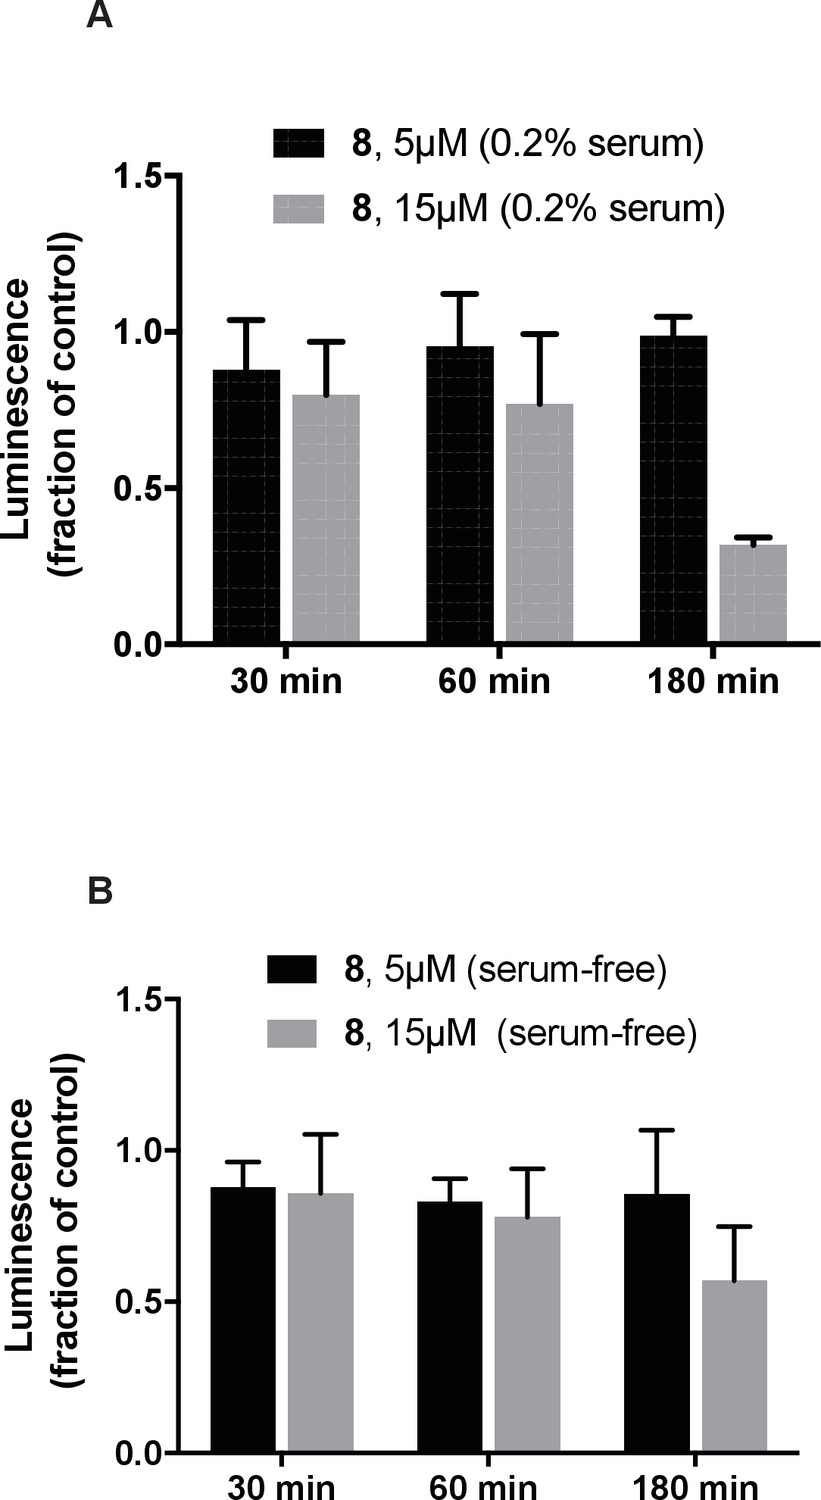
Analysis of the effect of dynapyrazole-A (compound 8) on intracellular ATP concentrations.
IMCD3 cells incubated in either low-serum (A-0.2% FBS) or serum-free (B) media were treated with dynapyrazole-A (5 µM, 15 µM) over the course of 3 hr. Cellular ATP content was measured using the CellTiter-glo assay system. Bars represent mean ± S.D. of n = 3 independent replicates.
Figure 6 with 5 supplements

Analysis of the mechanism of dynein inhibition by dynapyrazole-A (compound 8).
(A) Basal ATPase activity of GFP-dynein in the solvent control (2% DMSO, n = 8) and in the presence of 8 (40µM, n = 4) and ciliobrevin D (40 µM, n = 4). (B) SDS-PAGE analysis (Coomassie blue stain) of His-dynein 1, ~0.5 µg protein loaded. Mass spectrometry showed that the impurity (~15%, triangles) is likely to be a fragment of dynein (Figure 6—figure supplement 1) (C) Basal ATPase activity of His-dynein in the solvent control (2% DMSO, n = 11) and in the presence of 8 (40µM, n = 11) and ciliobrevin D (40 µM, n = 5). (D) Microtubule-stimulated ATPase activity of His-dynein 1 across a range of microtubule concentrations in the solvent control (2% DMSO) or in the presence of 30 µM 8 (2.5 µM microtubules, n = 5; 8 µM microtubules, n = 4; 8 µM microtubules, 30 µM 8, n = 3; 15 µM microtubules, 2% DMSO, n = 4; 15 µM microtubules, 30 µM 8, n = 3) (E) Dose-dependent inhibition of microtubule-stimulated His-dynein 1 ATPase activity by 8 (2.5 µM microtubules, IC50: 6.2 ± 1.6 µM, n = 3). (F) SDS-PAGE analysis (Coomassie blue stain) of dynein following irradiation with ultraviolet light at 365 nm. The components included in the photocleavage reaction loaded into each lane are indicated above the lane. Arrowheads indicate dynein photocleavage products. (G) Analysis of gel band intensity for photocleavage reactions. Values are mean + S.D., n = 3. (H) Gel filtration traces (Superose 6) for His-dynein 1 wild-type and AAA3 Walker A mutant. Peak elution volumes are 12.2, and 12.4 mL, respectively. Vo, void volume. (I) SDS-PAGE analysis (Coomassie blue stain) of Walker A mutant His-dynein 1 protein, ~0.5 µg protein loaded. Mass spectrometry data confirming the presence of the K2601A mutation in this construct is shown in Figure 6—figure supplement 4. (J) Basal and microtubule-stimulated ATPase activity of the AAA3 Walker A-mutant His-dynein 1 in the solvent control (2% DMSO) and in the presence of 8 (30µM). (K) Inhibition of the basal ATPase activity of the AAA3 Walker A-mutant His-dynein 1 by 8 (IC50: 5.5 ± 1.6 µM, n = 5) and ciliobrevin D (IC50: 38.4 ± 6.3 µM, n = 3). IC50 values reported reflect the mean (±S.D.) of separate IC50 values obtained from independent dose-response analyses. For (E) and (K), data were fit to a four-parameter sigmoidal dose-response curve in PRISM and fits were constrained such the value at saturating compound >0. All ATPase assays were performed at 1 mM MgATP and 2% DMSO. All data presented are mean ± S.D. of n ≥ 3 data points, except in K, where replicate numbers for individual datapoints were as follows. 8: 80 µM-2, 40 µM-5, 20 µM-5, 10 µM-5, 5 µM-5, 2.5 µM-5, 1.3 µM-5, 0.6 µM-2. Ciliobrevin D: 80 µM-2, 40 µM-3, 20 µM-3, 10 µM-3, 5 µM-3, 2.5 µM-3.
Figure 6—figure supplement 1
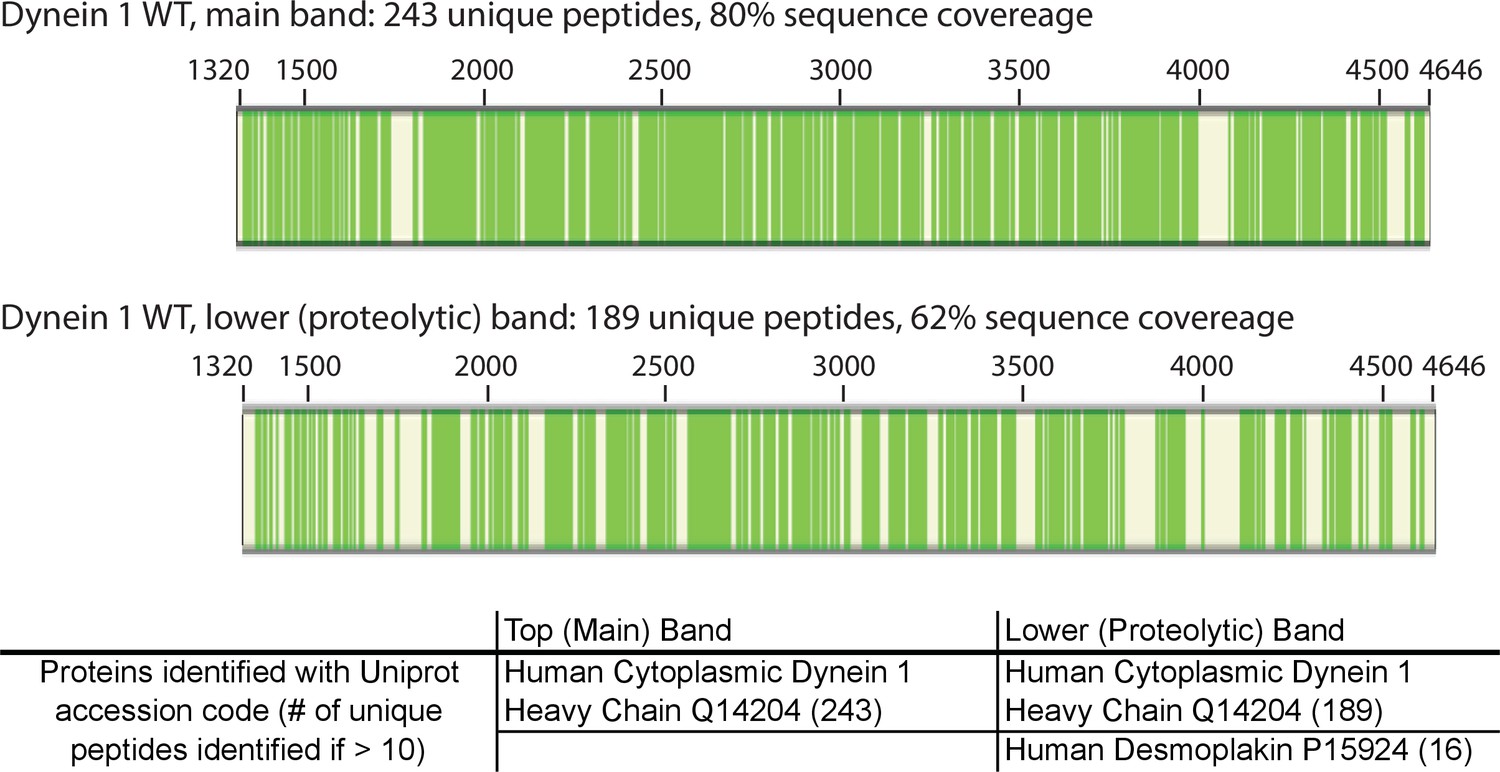
Mass spectrometry-based analysis of wild-type His-dynein 1.
Protein sample was run on an SDS-PAGE gel. The largest band at >350 KDa and a minor band (indicated with triangles in Figure 6B) were excised from a gel and analyzed. Peptides identified by mass spectrometry are indicated (green bars, schematic generated using Proteome Discoverer 1.4, Thermo Scientific). Common contaminants are excluded (e.g. trypsin, keratin). The minor band was also identified as His-dynein 1 and is likely a product of partial proteolysis.
Figure 6—figure supplement 2
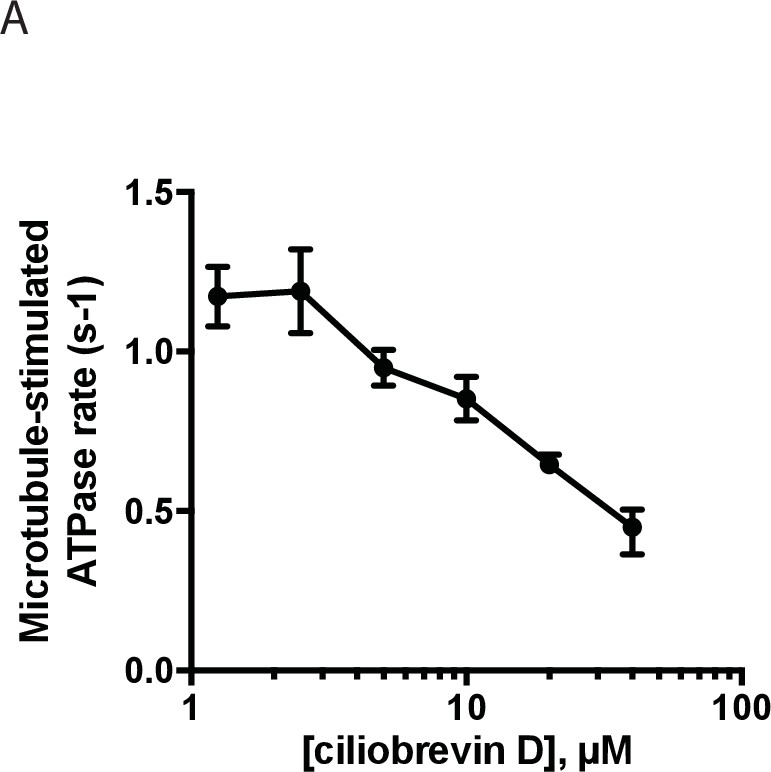
Dose-dependent inhibition of microtubule-stimulated His-dynein 1 ATPase activity by ciliobrevin D (2.5 µM microtubules).
Data are presented as mean ± range, n ≥ 2.
Figure 6—figure supplement 3
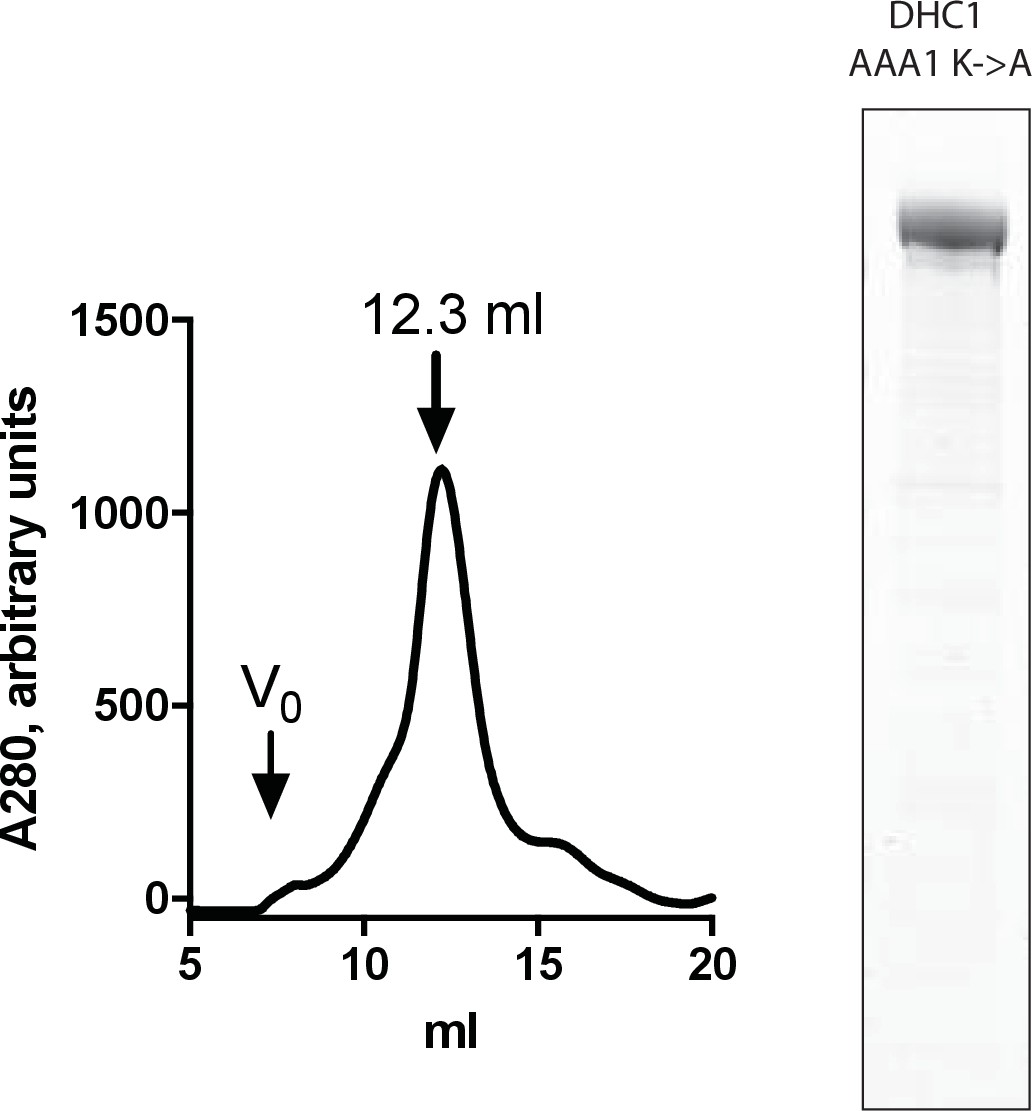
Purification and testing of His-dynein 1 with Walker A mutation in AAA1.
Gel filtration trace (Superose 6) for His-dynein 1 with K1912A (AAA1 Walker A lysine to alanine), with volume at elution peak indicated. SDS-PAGE analysis (Coomassie stain) of this protein, ~0.5 µg protein loaded. Vo, void volume. The ATPase activity for this enzyme was measured as 0.05–0.1 s−1 and was <2x above background hydrolysis in the absence of enzyme.
Figure 6—figure supplement 4
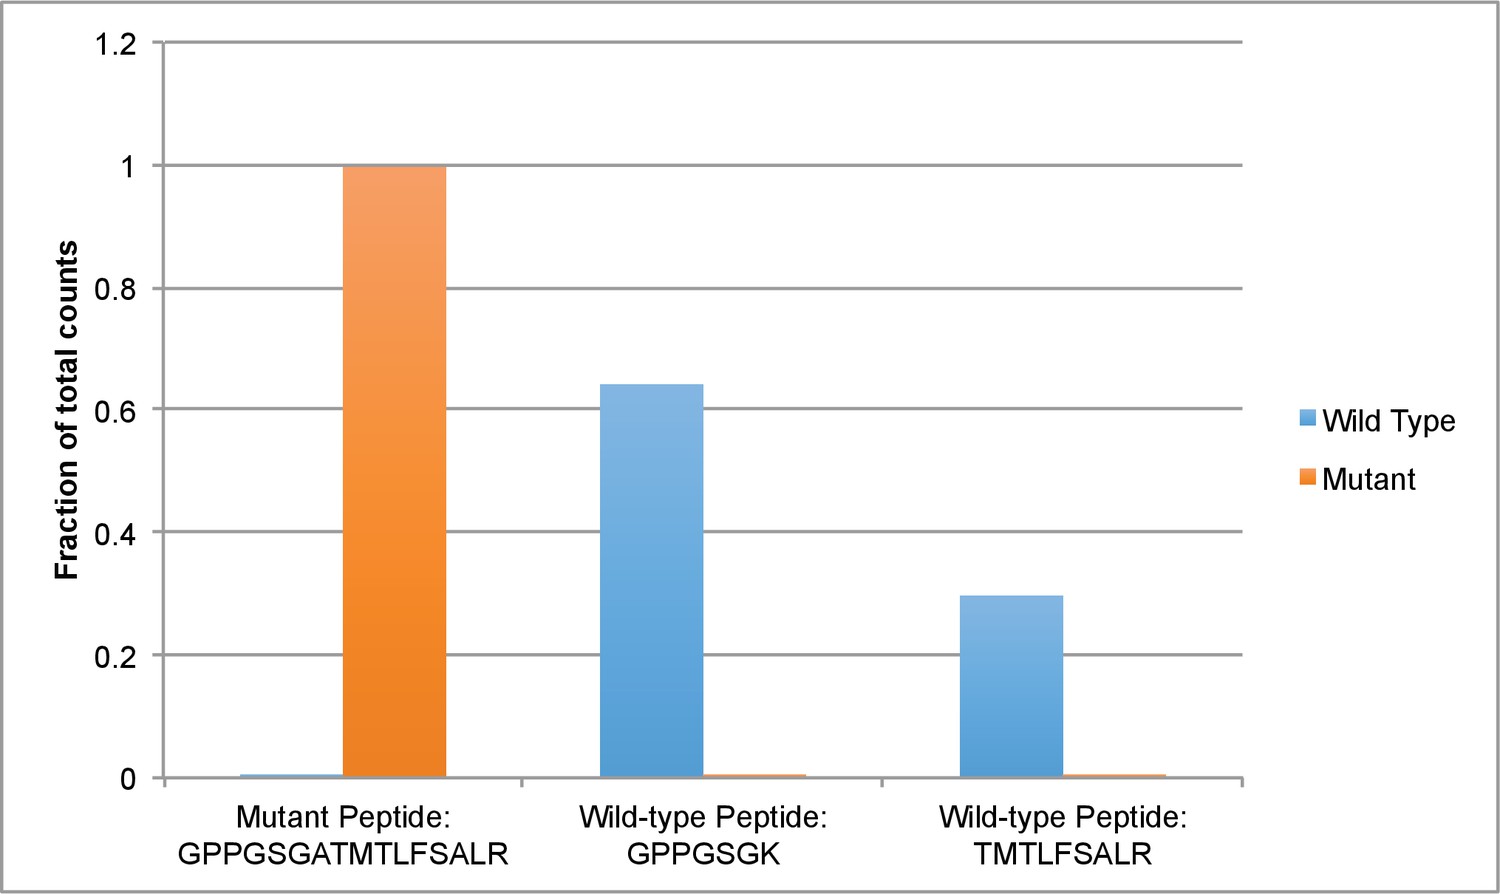
Mass spectrometry-based analysis of His-dynein 1 with Walker A mutation in AAA3.
Protein samples of wild-type and mutant (K2601A, AAA3 Walker A lysine to alanine) were run in separate lanes of an SDS-PAGE gel. Gel bands for each protein were excised, trypsinized. Peptides allowing for the differentiation of dynein 1 wild-type and mutant (all in the Walker A region) and also peptides that could serve as loading controls were targeted in a parallel reaction monitoring experiment (Peterson et al., 2012). Data were analyzed using Skyline (MacLean et al., 2010) combined with ProteomeDiscoverer 1.4 (Thermo Fisher) and Mascot (Matrix Science). For each protein, peptide counts for the peptides GPPGSGATMTLFSALR, GPPGSGK, and TMTLFSALR were divided by the sum of counts for all three peptides and this value is presented below. GPPGSGATMLFSALR peptide is expected in the AAA3 mutant, whereas GPPGSGK and TMTLFSALR are expected in the wild-type enzyme.
Figure 6—figure supplement 5
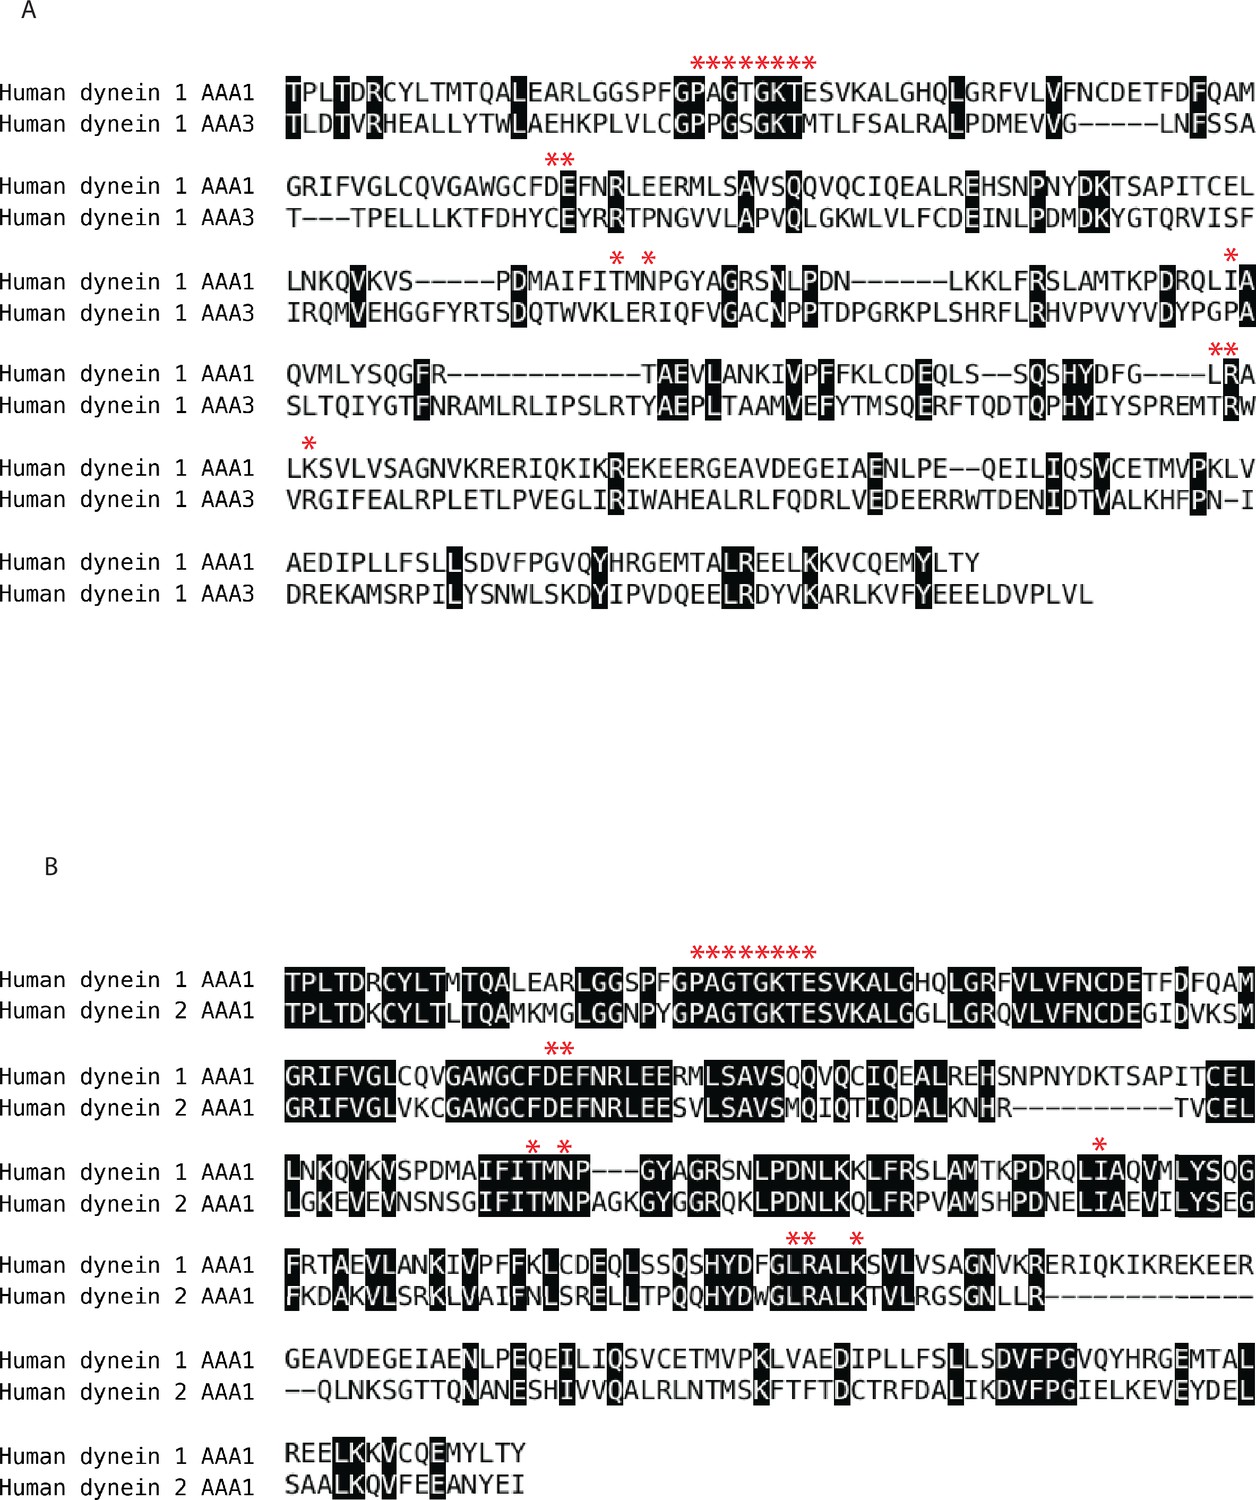
Sequence analysis of human cytoplasmic dynein isoforms 1 and 2.
Alignments were performed using the ClustalW algorithm for the following protein fragments: (A) human dynein 1 AAA1 (T1882-Y2193) and human dynein 1 AAA3 (T2571-L2911) (B) human dynein 1 AAA1 (T1882-Y2193) and human dynein 2 AAA1 (T1665-I1954). Residues in in black boxes are identical across isoforms. Red stars denote residues < 4 Å from the nucleotide (ADP-Vanadate) in AAA1 of human dynein 2 (PDB 4RH7). Some residues within this 4 Å shell are not included in this sequence alignment because they are located in adjacent AAA domains. Domain boundaries were chosen based on analysis of available crystal structures and sequence alignments. Uniprot accession numbers: dynein 1-Q14204 dynein 2-Q8NCM8.
Chemical structure 1
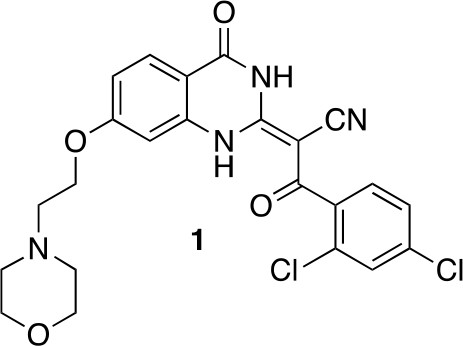
(2E)-3-(2,4-dichlorophenyl)-2-[7-(2-morpholinoethoxy)-4-oxo-1H-quinazolin-2-ylidene]-3-oxo-propanenitrile (1).
https://doi.org/10.7554/eLife.25174.030
Scheme 1
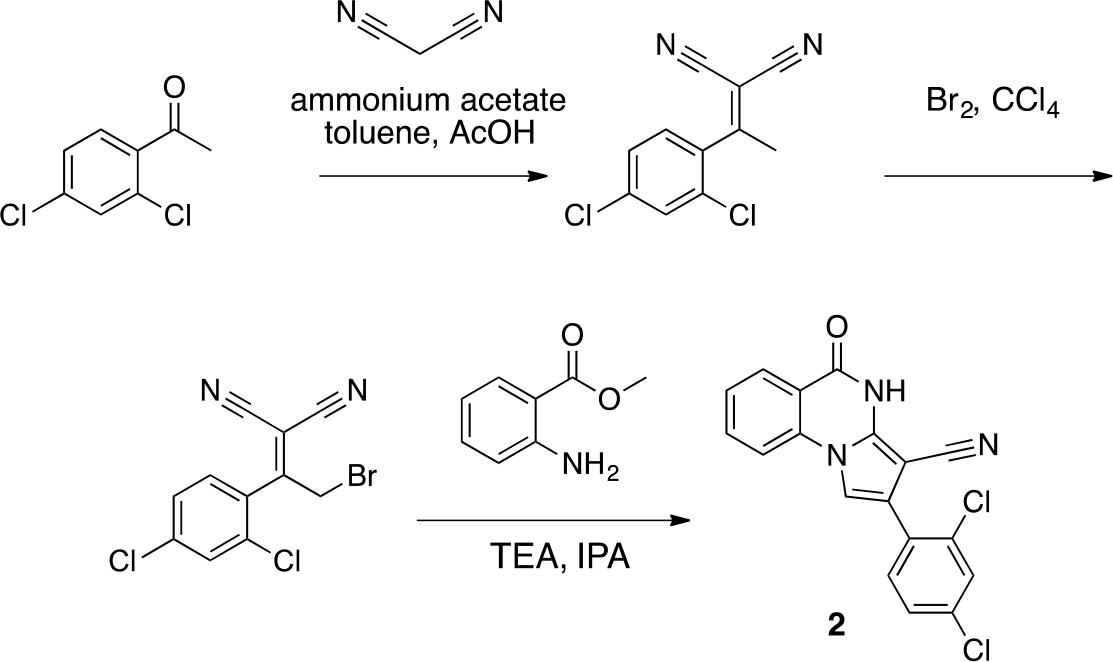
Synthesis of 2 based on literature precedent (Süsse and Johne, 1981).
https://doi.org/10.7554/eLife.25174.031
Chemical structure 2
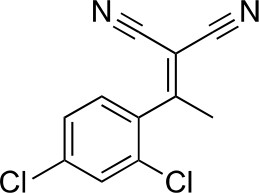
2-[1-(2,4-dichlorophenyl)ethylidene]propanedinitrile.
https://doi.org/10.7554/eLife.25174.032
Chemical structure 3
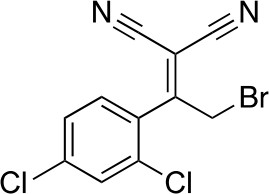
2-[2-bromo-1-(2,4-dichlorophenyl)ethylidene]propanedinitrile.
https://doi.org/10.7554/eLife.25174.033
Chemical structure 4

2-(2,4-dichlorophenyl)-5-oxo-4H-pyrrolo[1,2-a]quinazoline-3-carbonitrile (2).
https://doi.org/10.7554/eLife.25174.034
Chemical structure 5
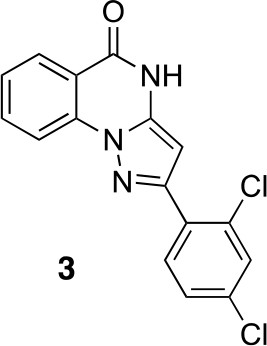
2-(2,4-dichlorophenyl)-4H-pyrazolo[1,5-a]quinazolin-5-one (3).
https://doi.org/10.7554/eLife.25174.035
Scheme 2

Synthesis of aminopyrazole precursor for 4 based on literature precedent for related compounds (Bussenius et al., 2012).
https://doi.org/10.7554/eLife.25174.036
Chemical structure 6

2-[(2,4-dichlorophenyl)-hydroxy-methylene]propanedinitrile.
https://doi.org/10.7554/eLife.25174.037
Chemical structure 7
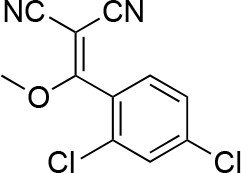
2-[(2,4-dichlorophenyl)-methoxy-methylene]propanedinitrile.
https://doi.org/10.7554/eLife.25174.038
Chemical structure 8
5-amino-3-(2,4-dichlorophenyl)-1H-pyrazole-4-carbonitrile.
https://doi.org/10.7554/eLife.25174.039
Chemical structure 9

2-(2,4-dichlorophenyl)-5-oxo-4H-pyrazolo[1,5-a]quinazoline-3-carbonitrile, 4.
https://doi.org/10.7554/eLife.25174.040
Scheme 3
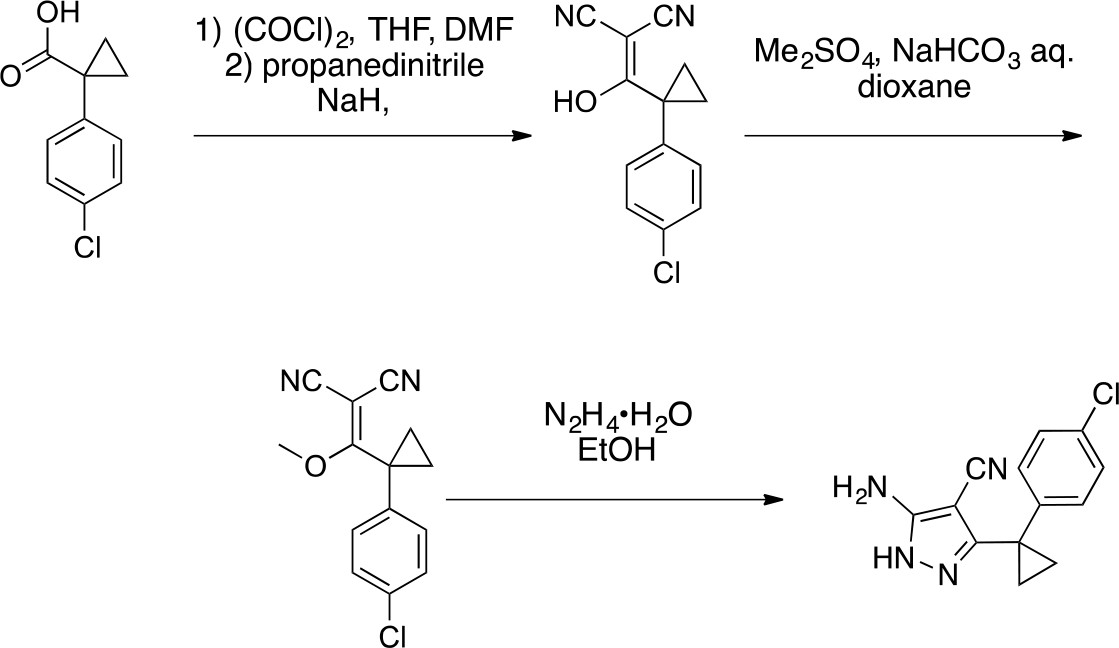
Synthesis of cyclopropyl-substituted aminopyrazole precursor for 5, 6, 7, and 8.
https://doi.org/10.7554/eLife.25174.041
Chemical structure 10

2-((1-(4-chlorophenyl)cyclopropyl)(hydroxy)methylene)malononitrile.
https://doi.org/10.7554/eLife.25174.042
Chemical structure 11

2-((1-(4-chlorophenyl)cyclopropyl)(methoxy)methylene)malononitrile.
https://doi.org/10.7554/eLife.25174.043
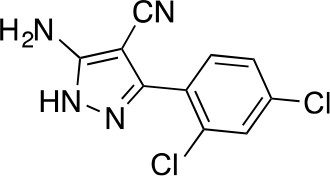
Chemical structure 12
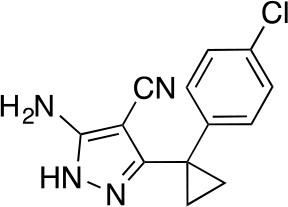
5-Amino-3-[1-(4-chlorophenyl)cyclopropyl]-1H-pyrazole-4-carbonitrile.
https://doi.org/10.7554/eLife.25174.044
Chemical structure 13
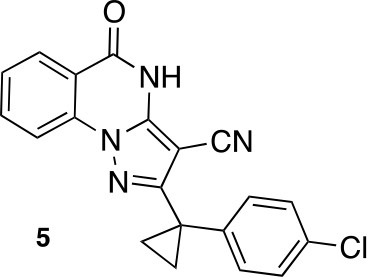
2-[1-(4-chlorophenyl)cyclopropyl]-5-oxo-4H-pyrazolo[1,5-a]quinazoline-3-carbonitrile (5).
https://doi.org/10.7554/eLife.25174.045
Chemical structure 14
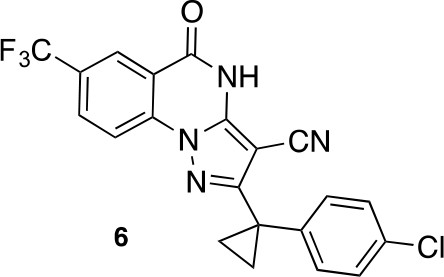
2-(1-(4-chlorophenyl)cyclopropyl)-5-oxo-7-(trifluoromethyl)-4,5-dihydropyrazolo[1,5-a]quinazoline-3-carbonitrile (6).
https://doi.org/10.7554/eLife.25174.046
Chemical structure 15
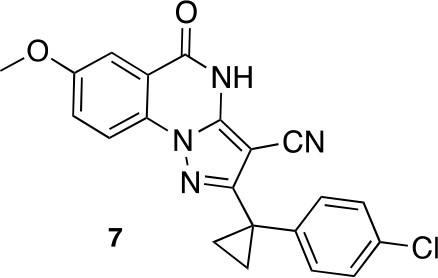
2-[1-(4-chlorophenyl)cyclopropyl]-7-methoxy-5-oxo-4H-pyrazolo[1,5-a]quinazoline-3-carbonitrile (7).
https://doi.org/10.7554/eLife.25174.047
Chemical structure 16
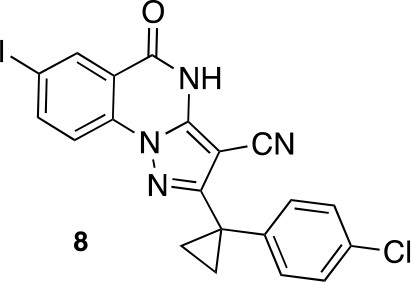
2-[1-(4-chlorophenyl)cyclopropyl]-7-iodo-5-oxo-4H-pyrazolo[1,5-a]quinazoline-3-carbonitrile (8).
https://doi.org/10.7554/eLife.25174.048
Scheme 4
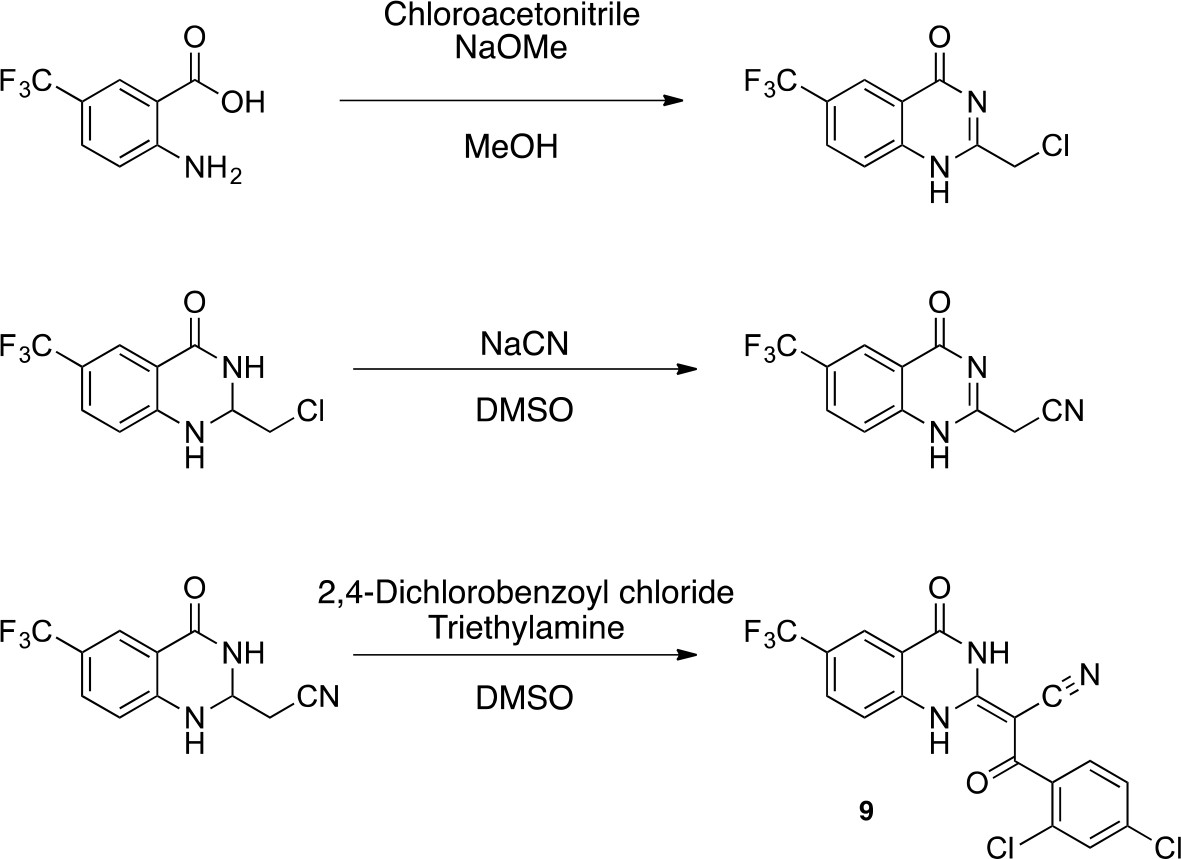
Synthesis of 9.
https://doi.org/10.7554/eLife.25174.049
Chemical structure 17
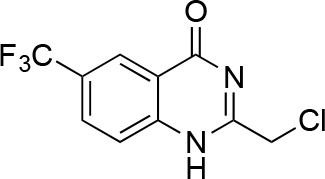
2-(chloromethyl)-6-(trifluoromethyl)-2,3-dihydroquinazolin-4(1H)-one.
https://doi.org/10.7554/eLife.25174.050
Chemical structure 18
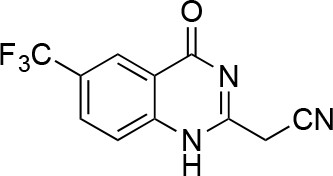
2-(4-oxo-6-(trifluoromethyl)-1,4-dihydroquinazolin-2-yl)acetonitrile.
https://doi.org/10.7554/eLife.25174.051
Chemical structure 19
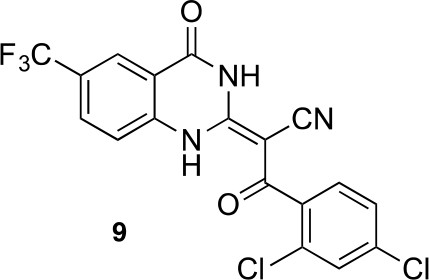
(E)-3-(2,4-dichlorophenyl)-3-oxo-2-(4-oxo-6-(trifluoromethyl)-3,4-dihydroquinazolin-2(1H)-ylidene)propanenitrile (9).
https://doi.org/10.7554/eLife.25174.052
Chemical structure 20
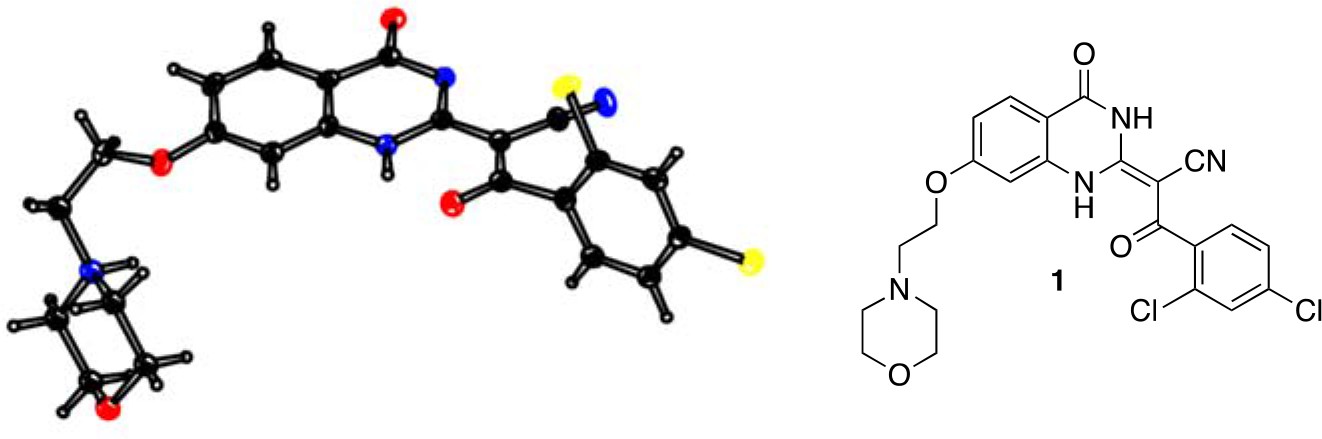
ORTEP drawing of 1, thermal ellipsoids are drawn at 20% probability.
Color code: black: carbon; blue: nitrogen; yellow: chlorine; red: oxygen.
Chemical structure 21
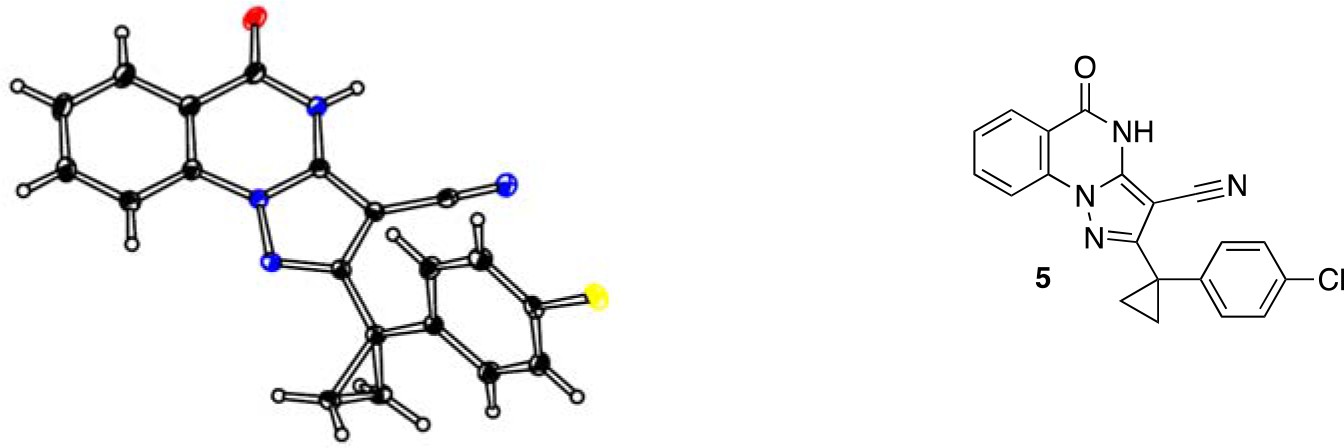
ORTEP of 5, thermal ellipsoids are drawn at 30% probability.
Color code: black: carbon; blue: nitrogen; yellow: chlorine; red: oxygen.
Videos
Video 1
Dynamics of intraflagellar transport particles.
Timelapse movie of mNeonGreen-IFT88 particles in IMCD3 cells under solvent control conditions (0.3% DMSO). Scale bar, 3 µm. Time, min:sec.
Video 2
Dynamics of intraflagellar transport particles.
Timelapse movie of mNeonGreen-IFT88 particles in IMCD3 cells under solvent control conditions (0.3% DMSO). Scale bar, 3 µm. Time, min:sec.
Video 3
Dynamics of intraflagellar transport particles.
Timelapse movie of mNeonGreen-IFT88 particles in IMCD3 cells in the presence of compound 8 (5 µM). Scale bar, 3 µm. Scale bar, 3 µm. Time, min:sec.
Video 4
Dynamics of intraflagellar transport particles.
Timelapse movie of mNeonGreen-IFT88 particles in IMCD3 cells in the presence of compound 8 (5 µM). Scale bar, 3 µm. Scale bar, 3 µm. Time, min:sec.
Video 5
Lysosome dynamics in CAD cell neurites.
Time-lapse movies of Lysotracker Red-treated CAD cells in the solvent control (0.1% DMSO). Time, min:sec.
Video 6
Lysosome dynamics in CAD cell neurites treated with dynapyrazole-A (compound 8).
Time-lapse movies of Lysotracker Red-treated CAD cells in the presence of dynapyrazole-A (compound 8, 3.5 µM). Time, min:sec.
Video 7
Lysosome dynamics in CAD cell neurites treated with dynapyrazole-A (compound 8).
Time-lapse movies of Lysotracker Red-treated CAD cells in the presence dynapyrazole-A (compound 8, 5 µM). Time, min:sec.
Download links
A two-part list of links to download the article, or parts of the article, in various formats.
Downloads (link to download the article as PDF)
Open citations (links to open the citations from this article in various online reference manager services)
Cite this article (links to download the citations from this article in formats compatible with various reference manager tools)
Chemical structure-guided design of dynapyrazoles, cell-permeable dynein inhibitors with a unique mode of action
eLife 6:e25174.
https://doi.org/10.7554/eLife.25174


