Sonic Hedgehog switches on Wnt/planar cell polarity signaling in commissural axon growth cones by reducing levels of Shisa2
- University of California, San Diego, United States
Figures
Figure 1 with 1 supplement
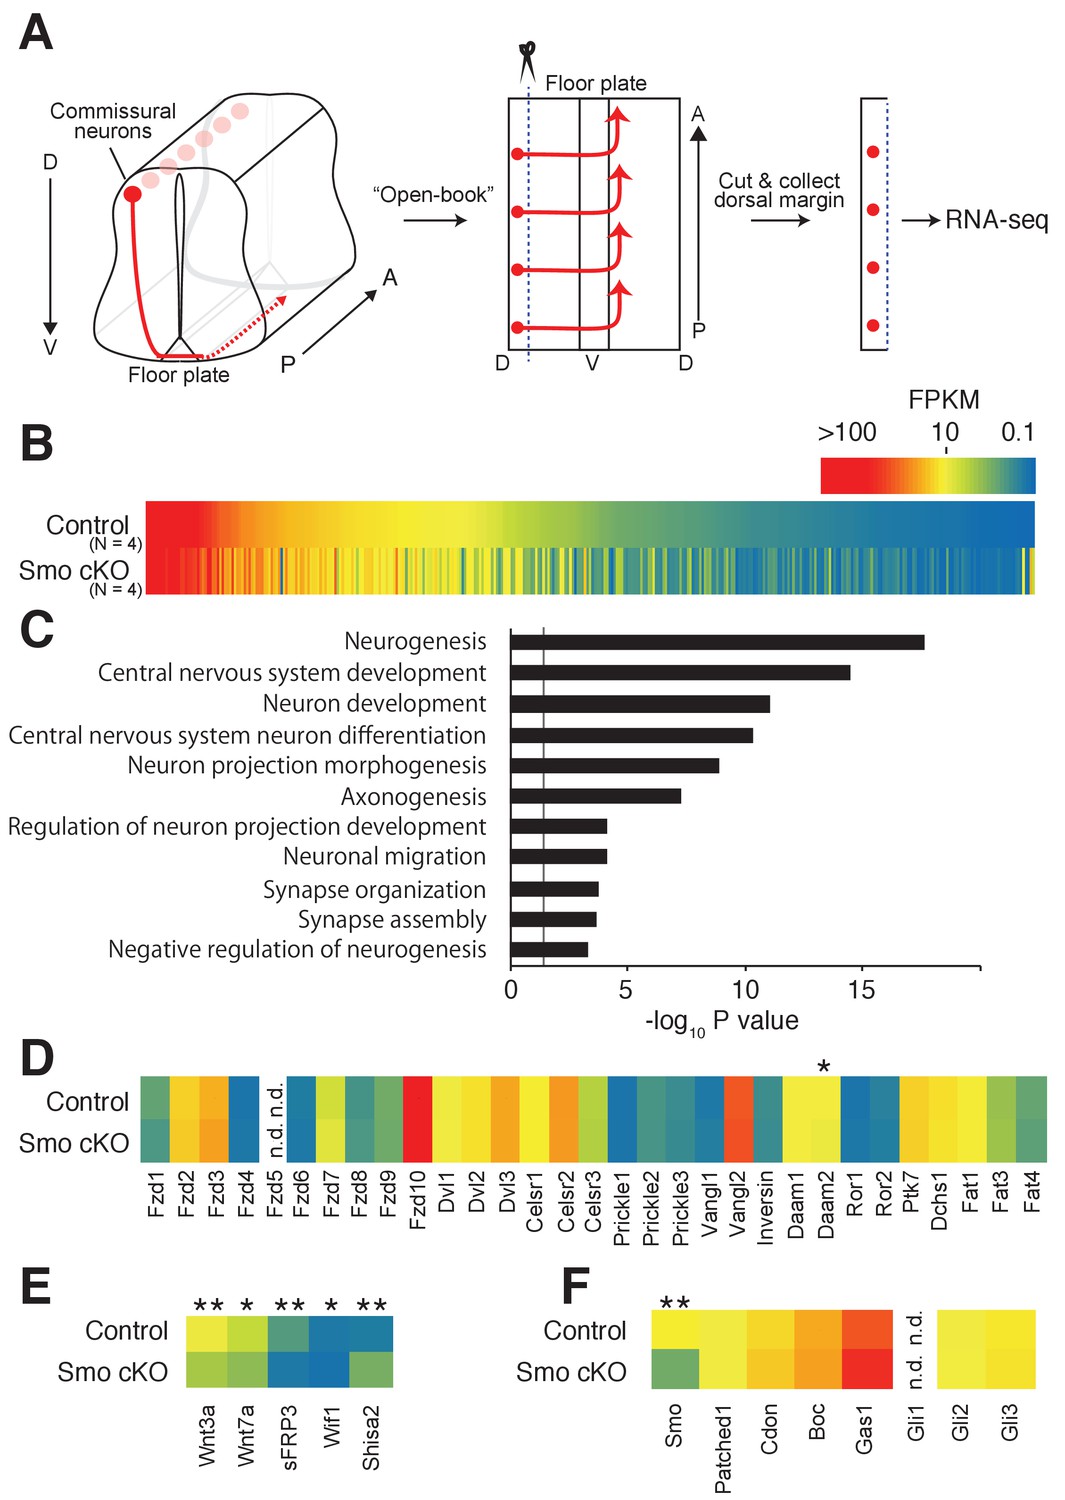
Shh–Smo signaling regulates Shisa2 expression in dorsal spinal cord.
(A) Schematics of dorsal commissural neuron trajectory in mouse spinal cord at E11.5. Cell bodies of commissural neurons (red circles) are close to the dorsal margin of the spinal cord. Their axons (red line) project to the ventral midline and cross to the contralateral side of the spinal cord (dashed red line). Using an ‘Open-Book’ preparation, dorsal margins from Smofl/fl (control) or Smofl/fl; Wnt1-Cre (Smo cKO) were isolated followed by RNA extraction and RNA-sequencing. (B) Heat map of changes of mRNAs levels. (C) Gene ontology analysis. (D) Heat map of expression levels of PCP genes in control and Smo cKO. No significant changes were observed except Daam2. (E) Heat map of expression levels of Wnt pathway genes. mRNA levels of Wnt3a, Wnt7a, sFRP3 and Wif1 were decreased in Smo cKO. Shisa2 mRNA level was increased (FPKMcontrol = 1.25; FPKMcKO = 4.82; q = 0.0038). (F) Heat map of expression levels of Shh pathway genes. No significant changes were observed except for Smo itself (FPKMcontrol = 14.62; FPKMcKO = 4.63; q = 0.0038). * denotes a q-value of = 0.048, ** denotes a q-value of = 0.0039.
Figure 1—figure supplement 1
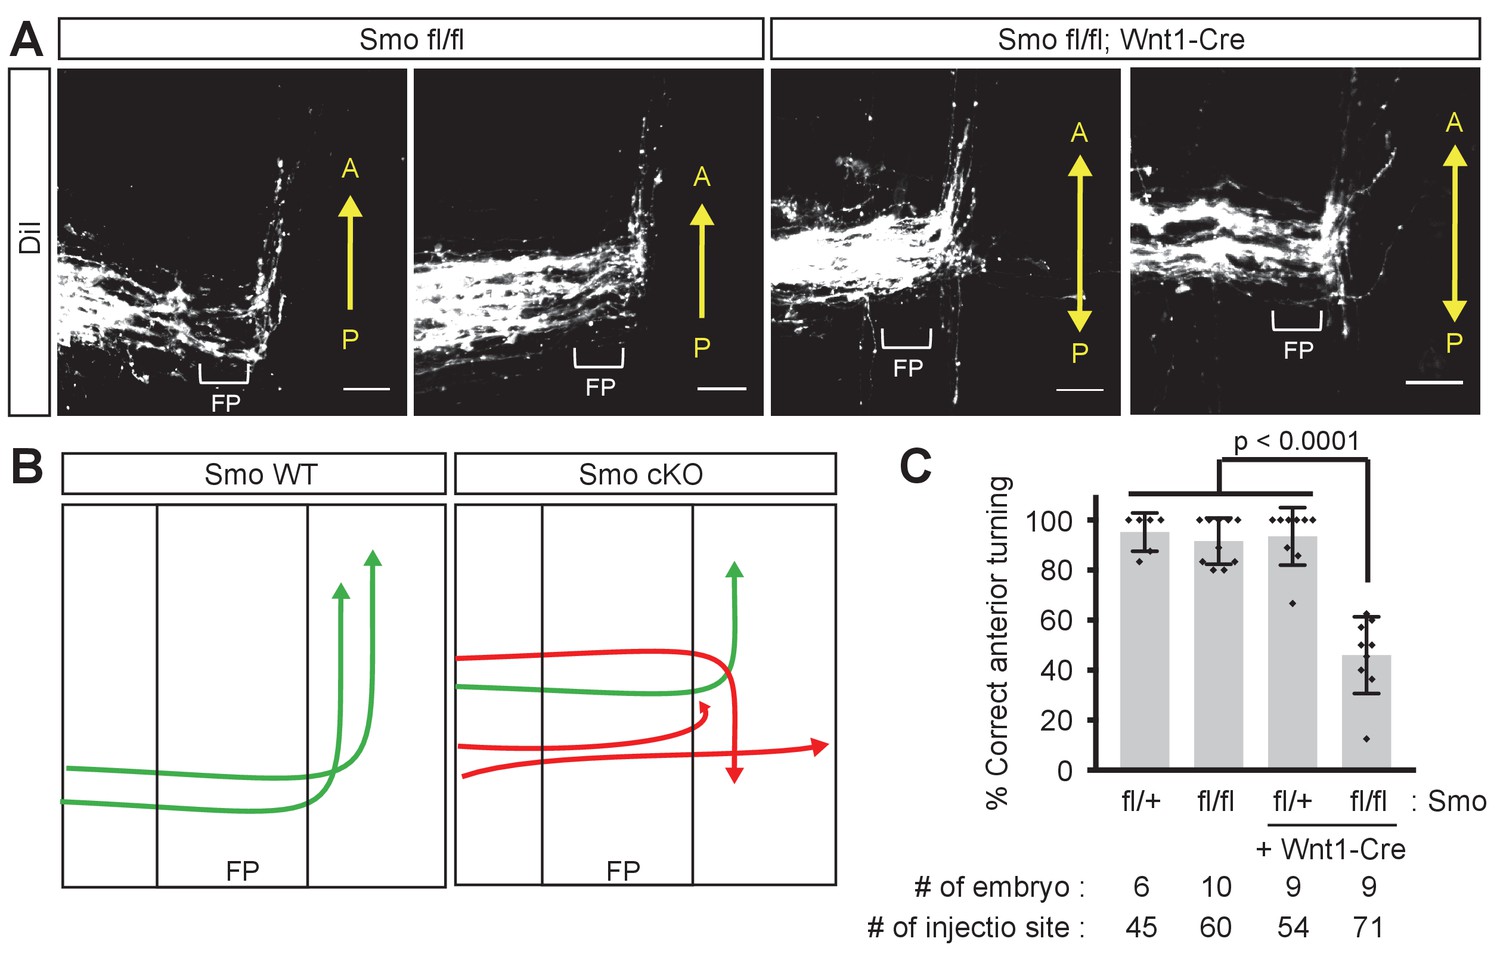
Smo is required for A–P guidance of commissural axons.
(A) Representative images of DiI traced mouse commissural axons at E11.5. In the controls (Smofl/fl), commissural axons turn anteriorly in a normal way. In Smo cKO (crossed with Wnt1-Cre), commissural axons showed A–P guidance defects. (B) Illustration of the phenotypes in Smo cKO mice. (C) Quantification of (A). The graph represents the percentage of injection sites that showed correct anterior turning. Approximately half of the injection sites showed A–P guidance defects. In the chart, the gray bars show the means of all data points, the black bars indicate the standard deviations, and diamond dots indicate individual data points.
Figure 2
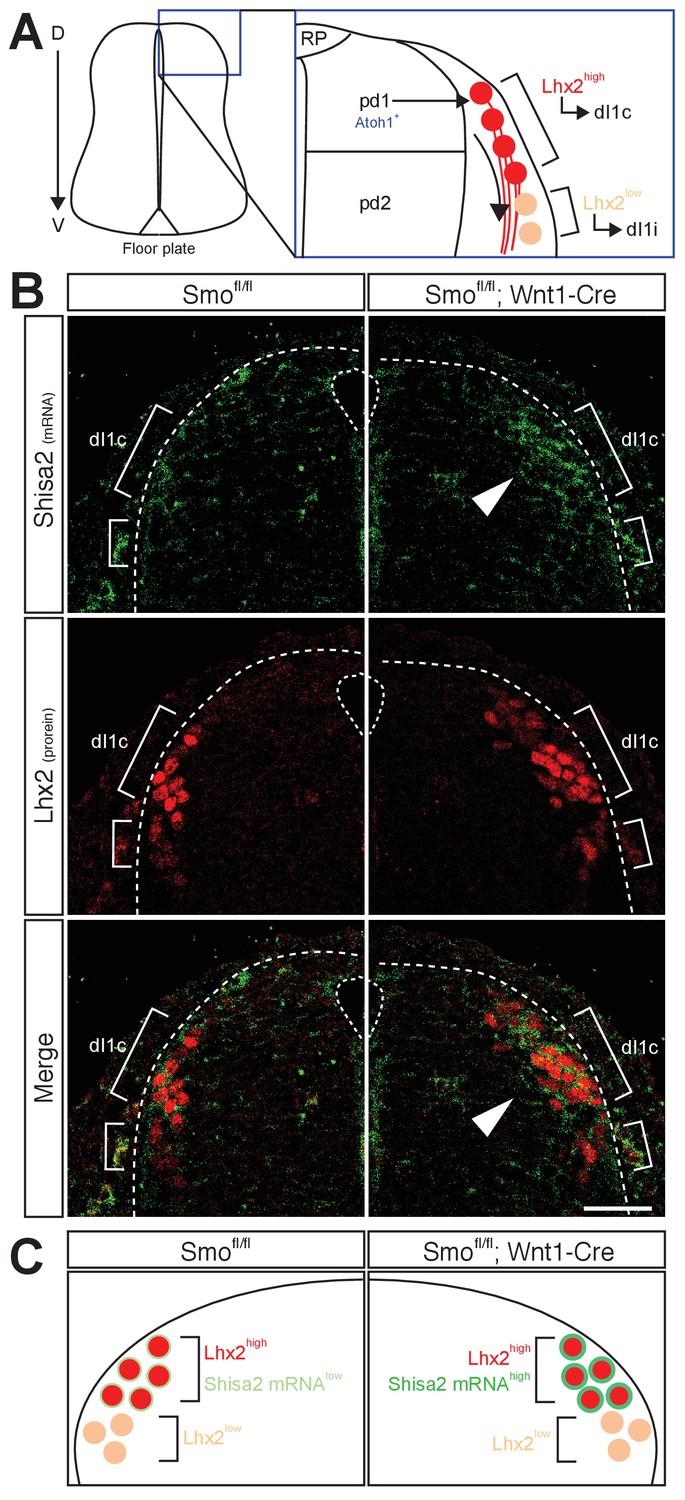
Shh–Smo signaling regulates mRNA level of Shisa2 in dI1 commissural neurons.
(A) A schematics of dI1 commissural neurons in dorsal spinal cord. Atoh1-positive pdI1 progenitors differentiate into dI1 neurons. After differentiation, cell bodies migrate laterally. Lhx2high neurons project axons contralaterally (dI1c), whereas Lhx2low neurons migrate more ventrally at E11.5 (dI1i). Lhx2low neurons start to extend axons at E12.5. (B) Shisa2 mRNA is elevated in Lhx2high dI1 neurons in Smo cKO dorsal spinal cord (white arrow head). Dash lines indicate the lateral margin of spinal cord. Scale bar: 50 μm.
Figure 3 with 1 supplement
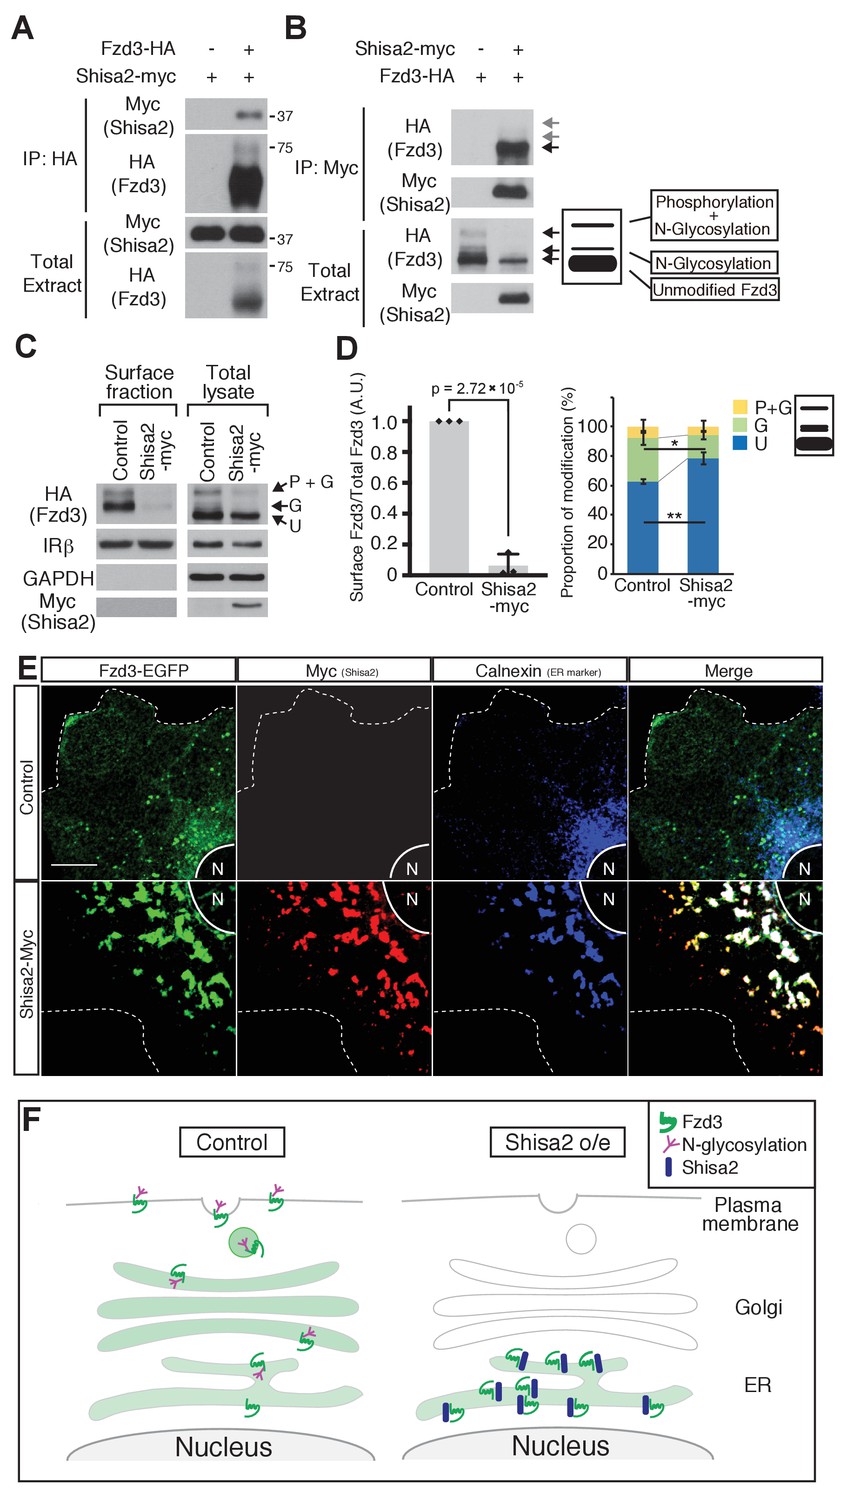
Shisa2 inhibits Frizzled3 (Fzd3) glycosylation and translocation to the plasma membrane.
(A) Shisa2 was pulled down by Fzd3 in a co-immunoprecipitation assay. (B) Fzd3 was pulled down by Shisa2 in a co-immunoprecipitation assay. The major form of co-immunoprecipitated Fzd3 is the unmodified form. Arrows indicate the bands corresponding to different forms of Fzd3. (C) Fzd3 surface expression and glycosylation are inhibited by Shisa2. Cell surface proteins were labeled with biotin and then precipitated with Neutravidin agarose. Precipitants and total lysates were subject to immunoblotting with the indicated antibodies. p+G represents ‘phosphorylated and glycosylated’, G represents ‘glycosylated’, and U represents ‘unmodified’ Fzd3. (D) Quantification of cell-surface levels of Fzd3 (left panel) and the proportion of different forms of Fzd3 (right panel). Shisa2 overexpression robustly suppresses cell-surface expression of Fzd3. Shisa2 overexpression significantly increases the amount of ‘unmodified’ Fzd3 and reduces ‘glycosylated’ Fzd3. Data are the mean ±SD from four independent experiments. * denotes p<0.05, ** denotes p<0.005. (E) Fzd3–EGFP was retained in the ER in the presence of Shisa2. In the control, Fzd3–EGFP was localized widely in the periphery as well as in the perinuclear region, as indicated by Calnexin, an ER marker. By contrast, in Shisa2-overexpressing cells, most Fzd3–EGFP was retrained in the perinuclear region, co-localized with Shisa2 and Calnexin. Scale bar: 10 μm. N: nucleus. Dashed lines indicate cell outlines. (F) A schematic of Shisa2 effects on Fzd3 trafficking. Left: in control cells, Fzd3 is glycosylated in ER and translocated to the cell surface through the Golgi/trans-Golgi network. Right: in Shisa2-expressing cells, glycosylation of Fzd3 is inhibited and Fzd3 is not translocated to the cell surface.
Figure 3—figure supplement 1
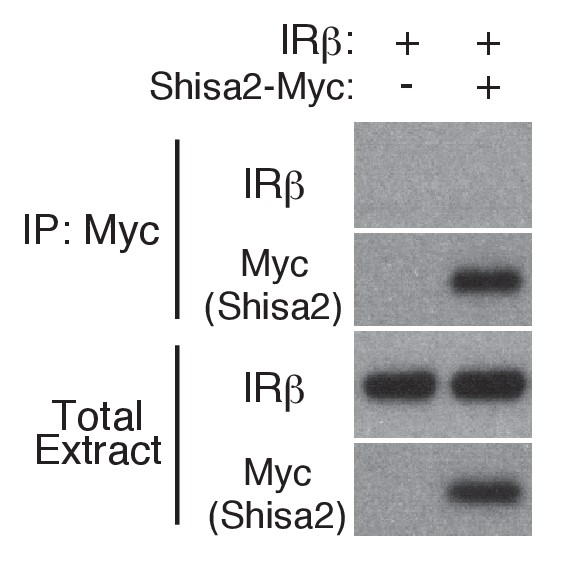
IRβ is not co-immunoprecipitated with Shisa2.
The indicated plasmids were transfected into 293 T cells. After 48 hr, cell lysates were subjected to immunoprecipitation with anti-Myc antibodies.
Figure 4 with 1 supplement
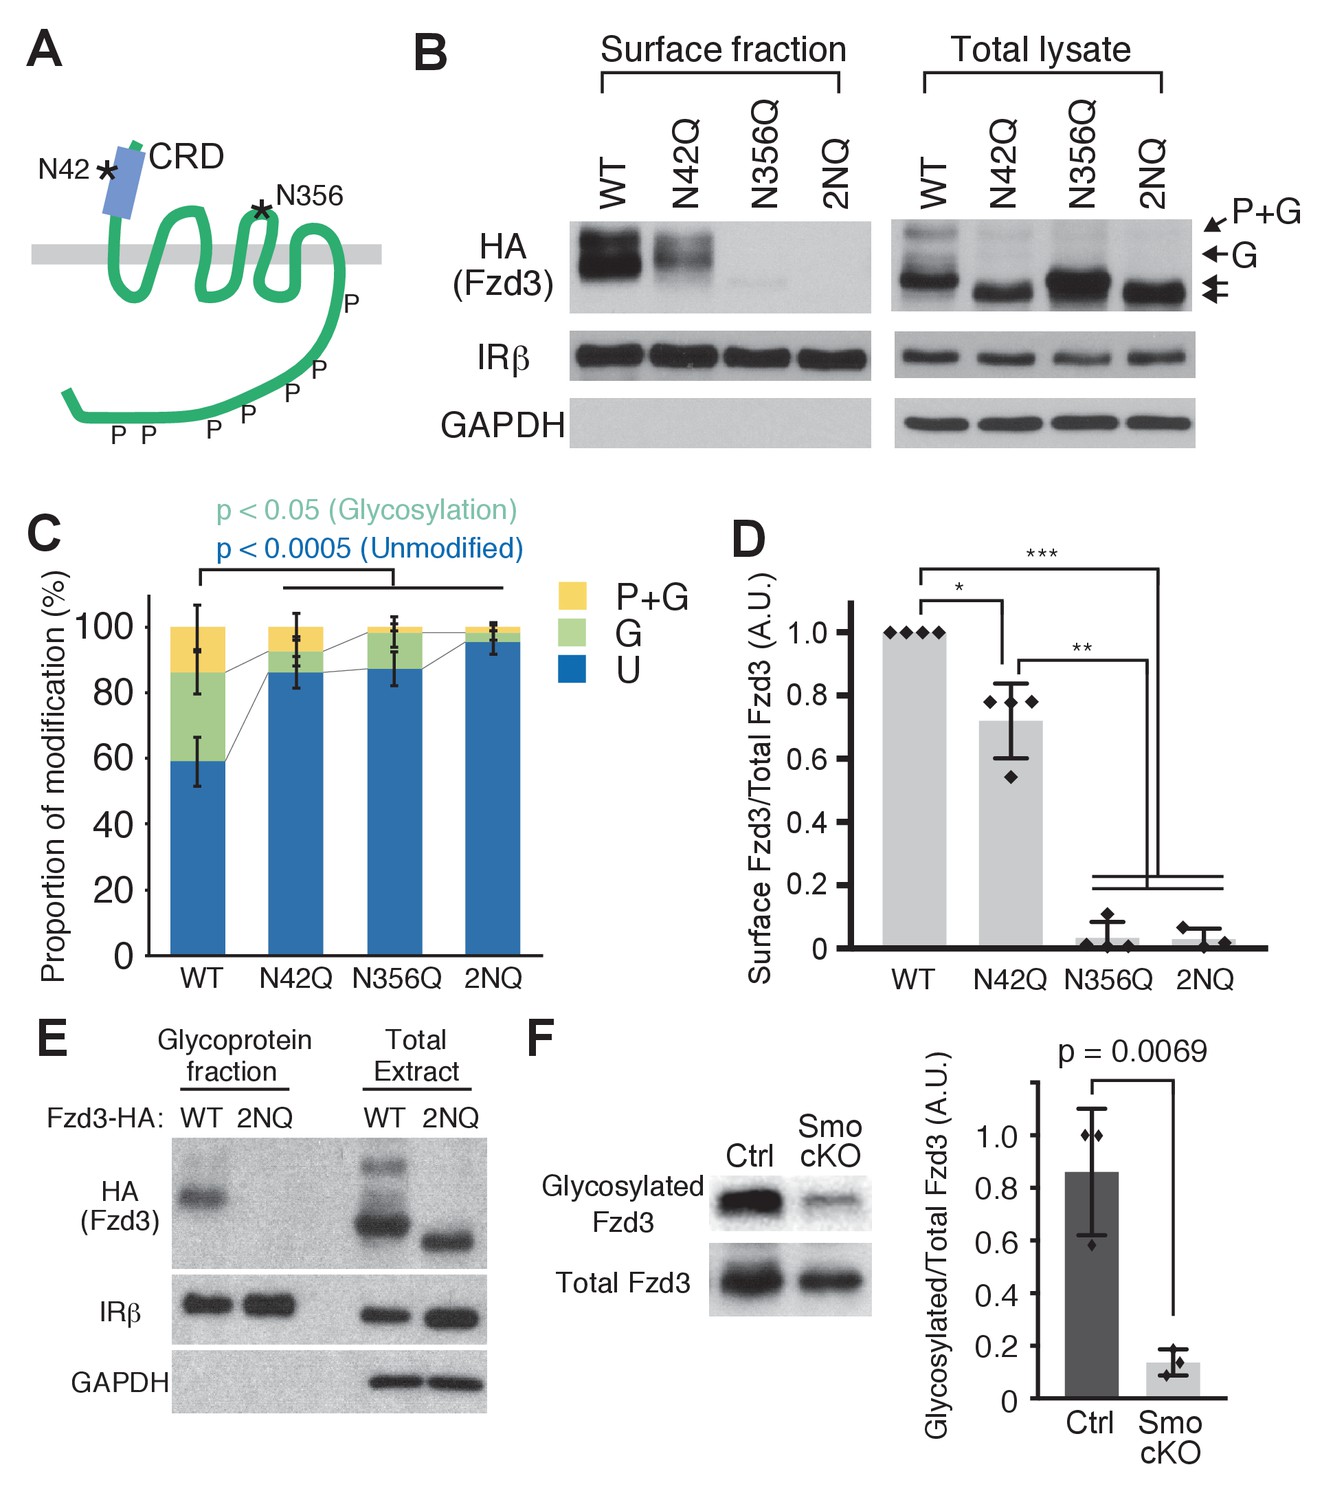
Frizzled3 (Fzd3) glycosylation sites required for its cell-surface expression.
(A) Putative glycosylation sites in Fzd3. N42 is in the cysteine rich domain (CRD), and N356 is in the second extracellular loop. (B) N42Q, N356Q and 2NQ mutantations affected Fzd3 glycosylation as well as its cell-surface expression. (C, D) Quantification of the cell-surface level of Fzd3 (C) and proportions of Fzd3-modification forms (D). Single mutations (N42Q, N356Q) and double mutation (2NQ) significantly reduced ‘glycosylated’ Fzd3 and increased ‘unmodified’ Fzd3. N42Q mutants showed reduced levels of cell-surface Fzd3. However, N356Q mutation completely eliminated cell-surface Fzd3. Data are the mean ±SD from four independent experiments (2NQ; three experiments). * denotes p<0.001; ** denotes p<5 × 10⁻⁷; *** denotes p<1 × 10⁻⁸. (E) Enrichment of glycosylated Fzd3 using the Glycosylation Isolation Kit, WGA (Thermo Scientific). Fzd3 WT was detected in the glycoprotein fraction but 2NQ mutant was not. (F) Fzd3 glycosylation in the dorsal spinal cord is reduced in Smo cKO. Dorsal spinal cord tissues from control and Smo cKO E11.5 embryos were collected and lysed, followed by glycoprotein isolation. Glycosylated Fzd3 was significantly decreased in Smo cKO. Data are the mean ±SD from three control and three Smo cKO embryos.
Figure 4—figure supplement 1

Validation of anti-Fzd3 antibody.
Dorsal spinal cord tissues from E11.5 embryos from Fzd3+/+, Fzd3+/– and Fzd3–/– were collected and lysed. Two embryos for Fzd3+/+ and Fzd3–/– were analyzed. An asterisk (*) indicates a non-specific band overlapping with the ‘phosphorylated and glycosylated’ band. The Fzd3 band and the glycosylated Fzd3 band (Figure 4G) are clearly lost in Fzd3–/–.
Figure 5 with 1 supplement
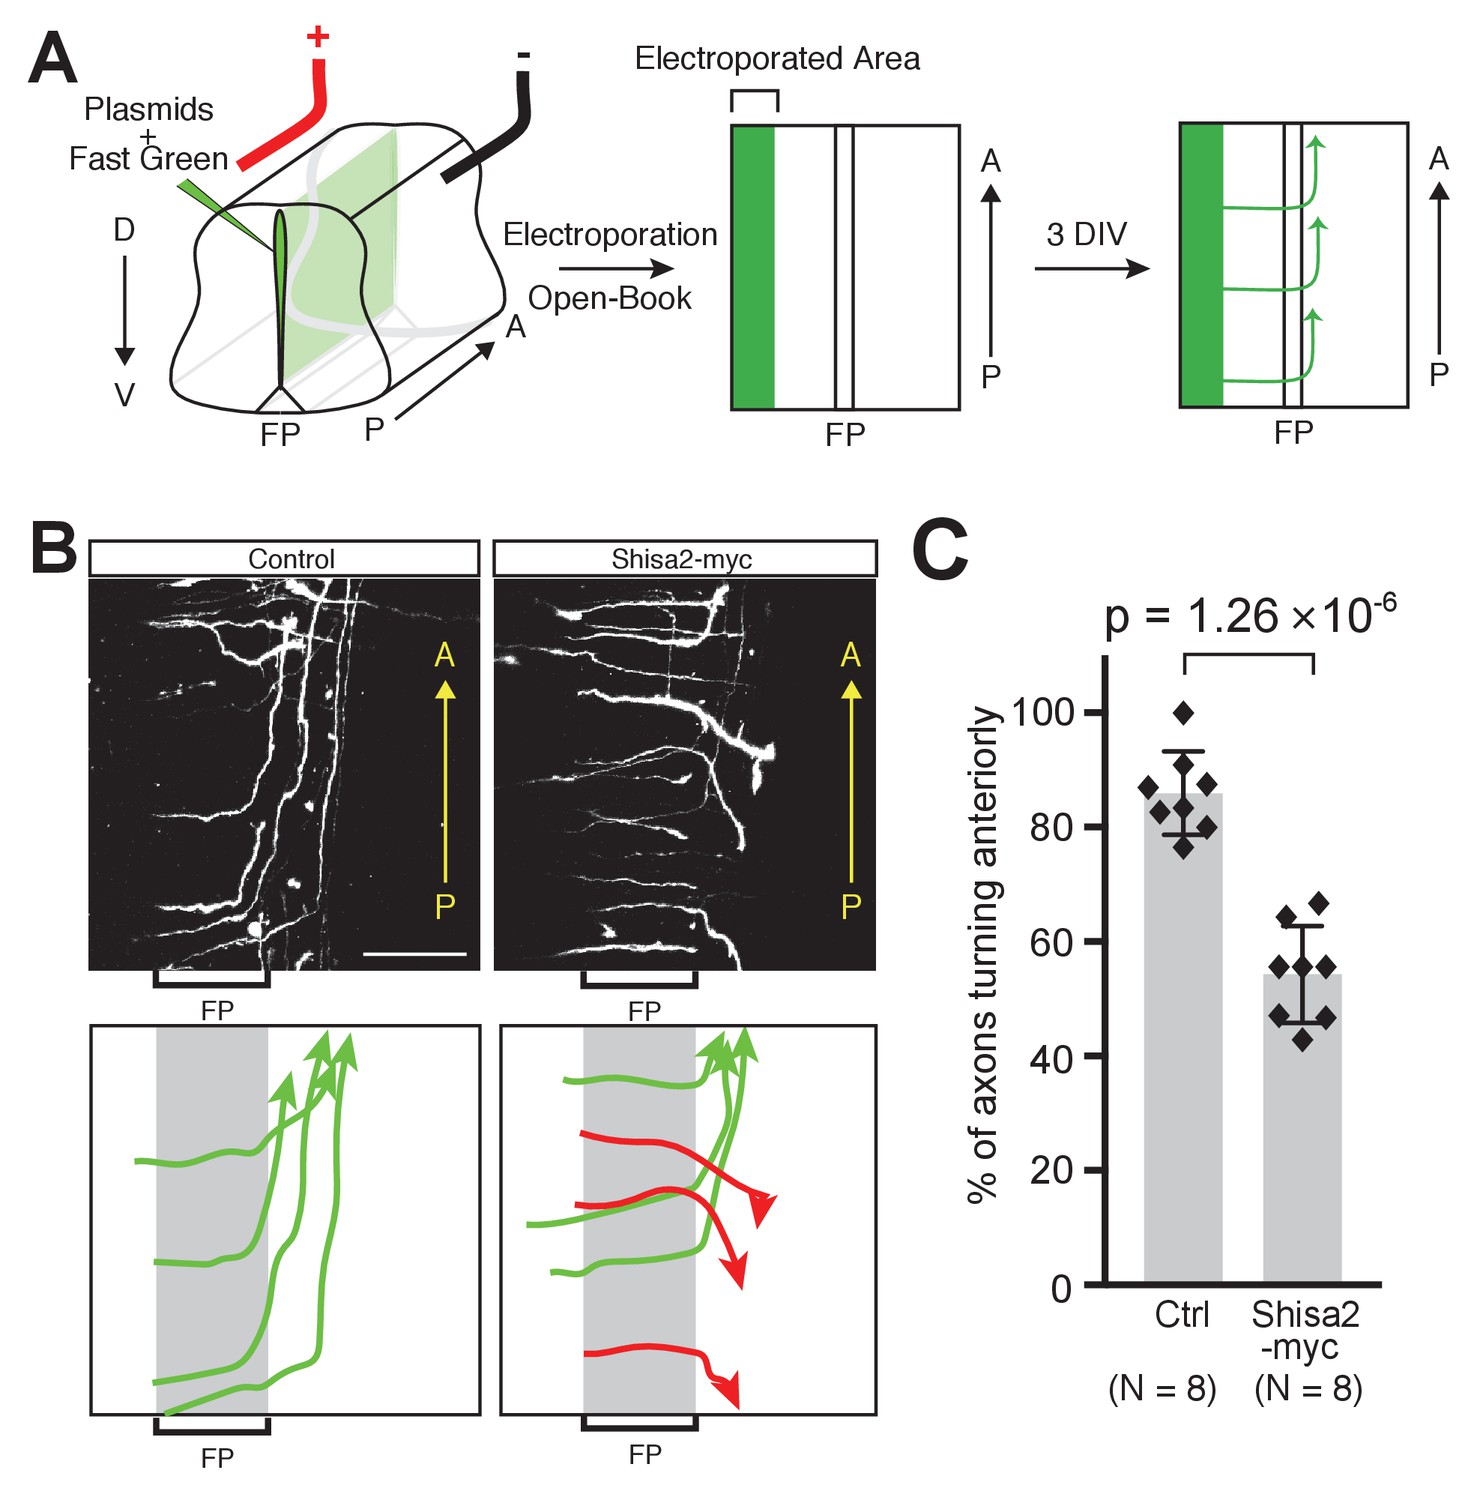
Shisa2 overexpression lead to A–P guidance defects after midline crossing.
(A) Schematic of experimental design. Plasmids cocktail and Fast Green dye were injected into the ventricle of rat embryonic spinal cord (E13) and electroporated into the dorsal region. The spinal cord ‘open-book’ explants were prepared and cultured in collagen matrix for 72 hr. Axons were visualized by staining for tdTomato expressed by co-electroporated plasmid. (B) (Top) Shisa2 expression randomized the turning of post-crossing commissural axons along the A–P axis. (Bottom) Axons in the images on the top panels were traced manually. Green arrows indicate correct (anterior) turning, whereas red arrows indicate posterior turning. FP, floor plate. Scale bars, 50 μm. (C) Quantification of A–P guidance defects. The graph represents the percentage of the axons that turned anteriorly (correct turning). Gray bars indicate averages of all data points, black bars indicate standard deviations, and diamond dots indicate individual data points (Control; eight embryos, Shisa2-myc; eight embryos).
Figure 5—figure supplement 1
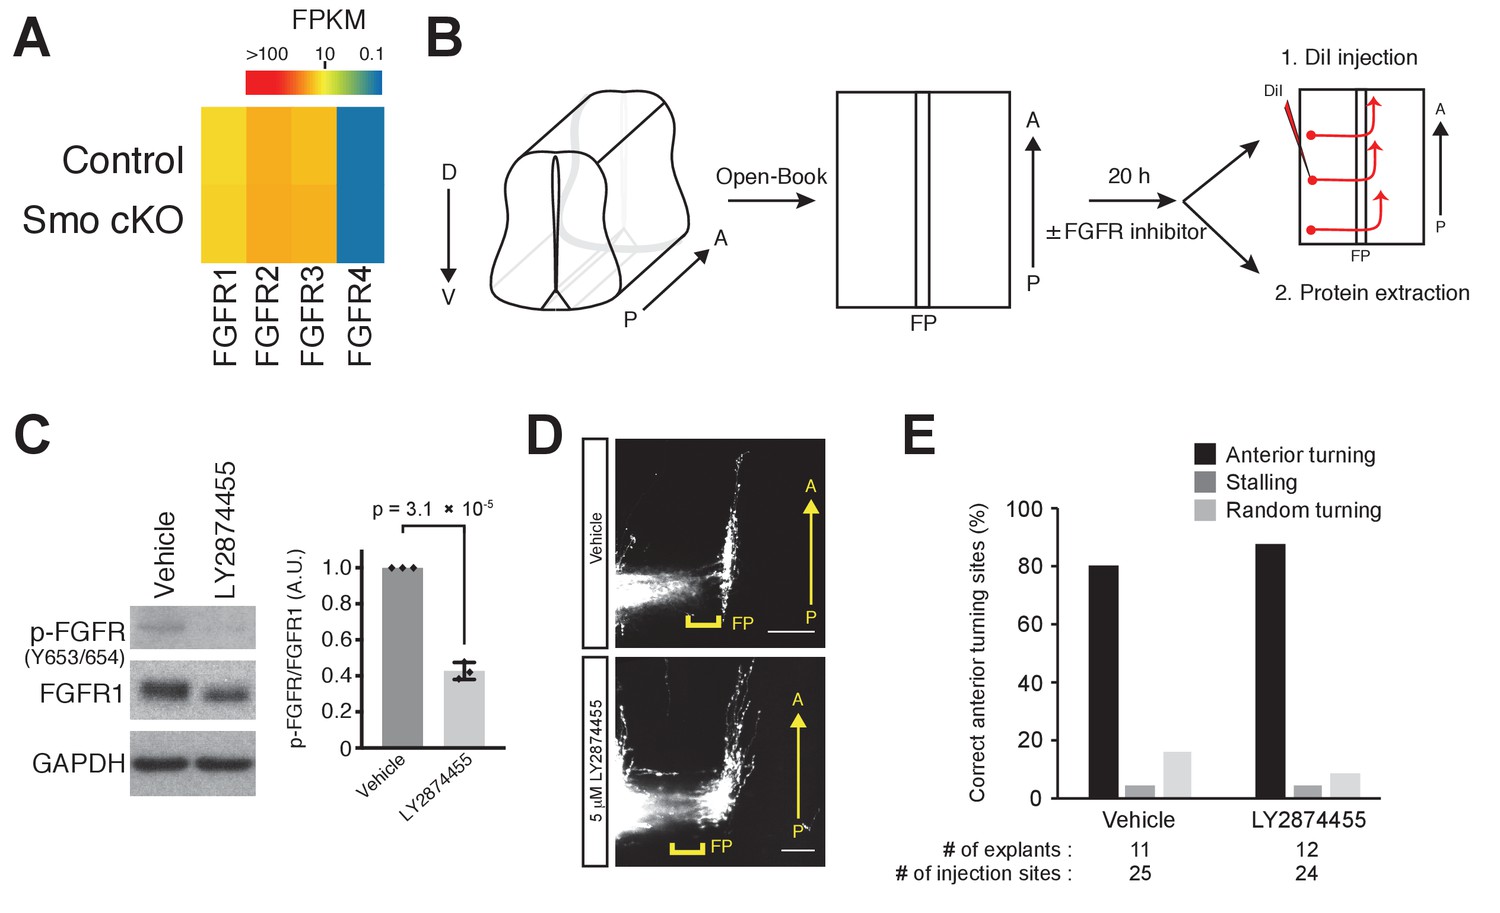
FGFR signaling is not required for A–P guidance of commissural axons.
(A) Heat map of FGFR expression in dorsal spinal cord. FGFR1, FGFR2, and FGFR3 are expressed in the dorsal spinal cord. Expression of FGFR4 is lower than that of FGFR1, FGFR2, and FGFR3. No significant difference in expression levels was observed between control and Smo cKO. (B) ‘Open-book’ spinal cord explants were cultured in collagen matrix for 20 hr with DMSO as vehicle control or with 5 μM LY2874455. Explants were either lysed for western blot (WB) analysis or fixed in 4% PFA followed by DiI injection to visualize commissural axons. (C) The lysates were subject to immunoblotting with anti-phospho-FGFR (Y653/Y654) and total FGFR1. (Left) Representative images of WB. (Right) Quantification data of relative phosphor-FGFR. Data are mean ±SD from three independent explants of each condition. (D) DiI tracing of commissural axons in ‘open-book’ culture. (E) The percentage of injection sites with correct anterior turning in (C).
Figure 6 with 2 supplements

Shisa2 knockdown lead to precocious anterior turning before midline crossing.
(A) Two different shRNA constructs targeting rat Shisa2 can knock down WT Shisa2 but not shRNA-resistant Shisa2 (rescue construct) transfected into 293 T cells. (B) Quantification of (A). (C) Shisa2 knockdown induces precocious turning of commissural axons through premature Wnt–PCP signaling activation. Commissural axons expressing either of the two ShRNA constructs turned before crossing or in the floor plate. This ‘precocious turning’ was eliminated by co-expression of a Shisa2 rescue construct or of Vangl2 shRNA. FP: floor plate. Scale bars: 50 μm. (D) The percentage of axons that turn before or after midline crossing is quantified. Purple represents turning before entering the floor plate; orange represents turning in the floor plate; green represents turning after crossing the floor plate. Data are the mean ±SD. n represents the sample number.
Figure 6—figure supplement 1
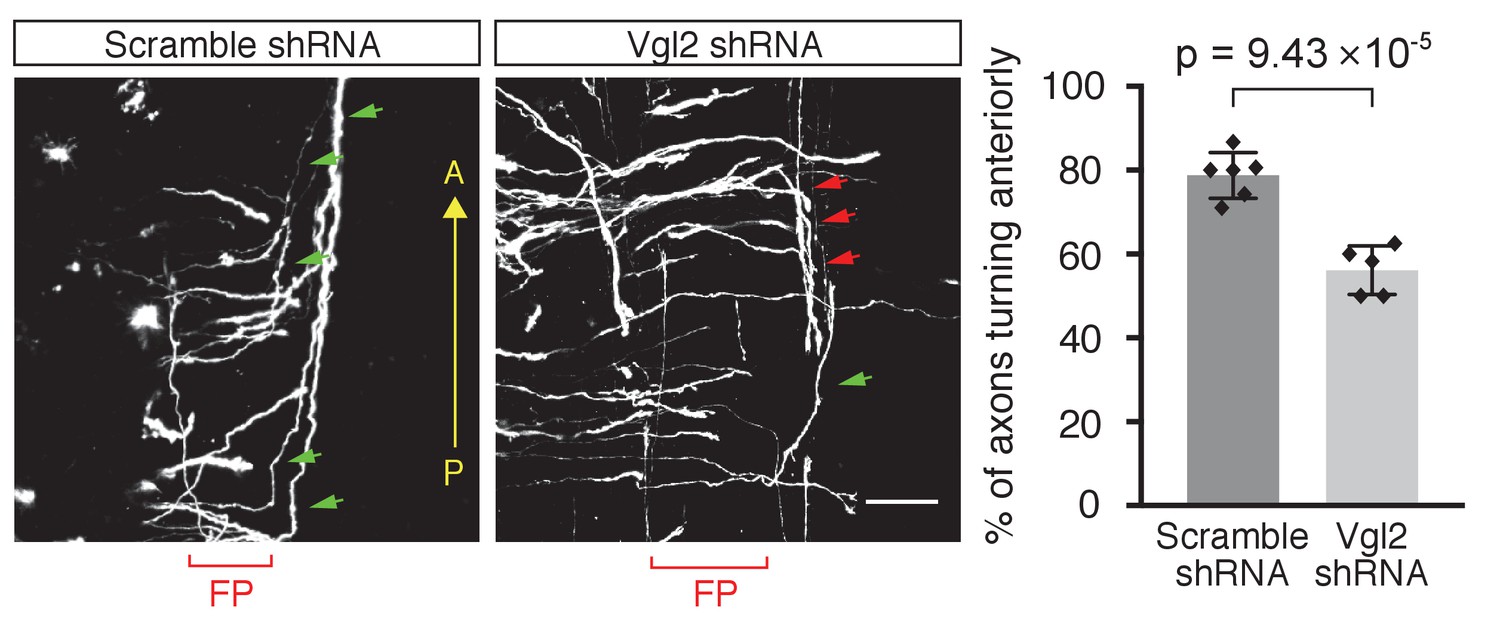
Vangl2 is required for A–P guidance of post-crossing commissural axons.
Scrambled- shRNA- or Vangl2-shRNA-expressing plasmids were electroporated into dorsal spinal cord of E13 rat. Green arrowheads indicate correct (anterior) turning, whereas red arrowheads indicate posterior turning. The graph represents the percentage of axons that turned anteriorly (correct turning). Data are mean ±SD with each data point (Scramble shRNA, six embryos; Vangl2 shRNA, five embryos). FP, floor plate. Scale bars, 50 μm.
Figure 6—figure supplement 2
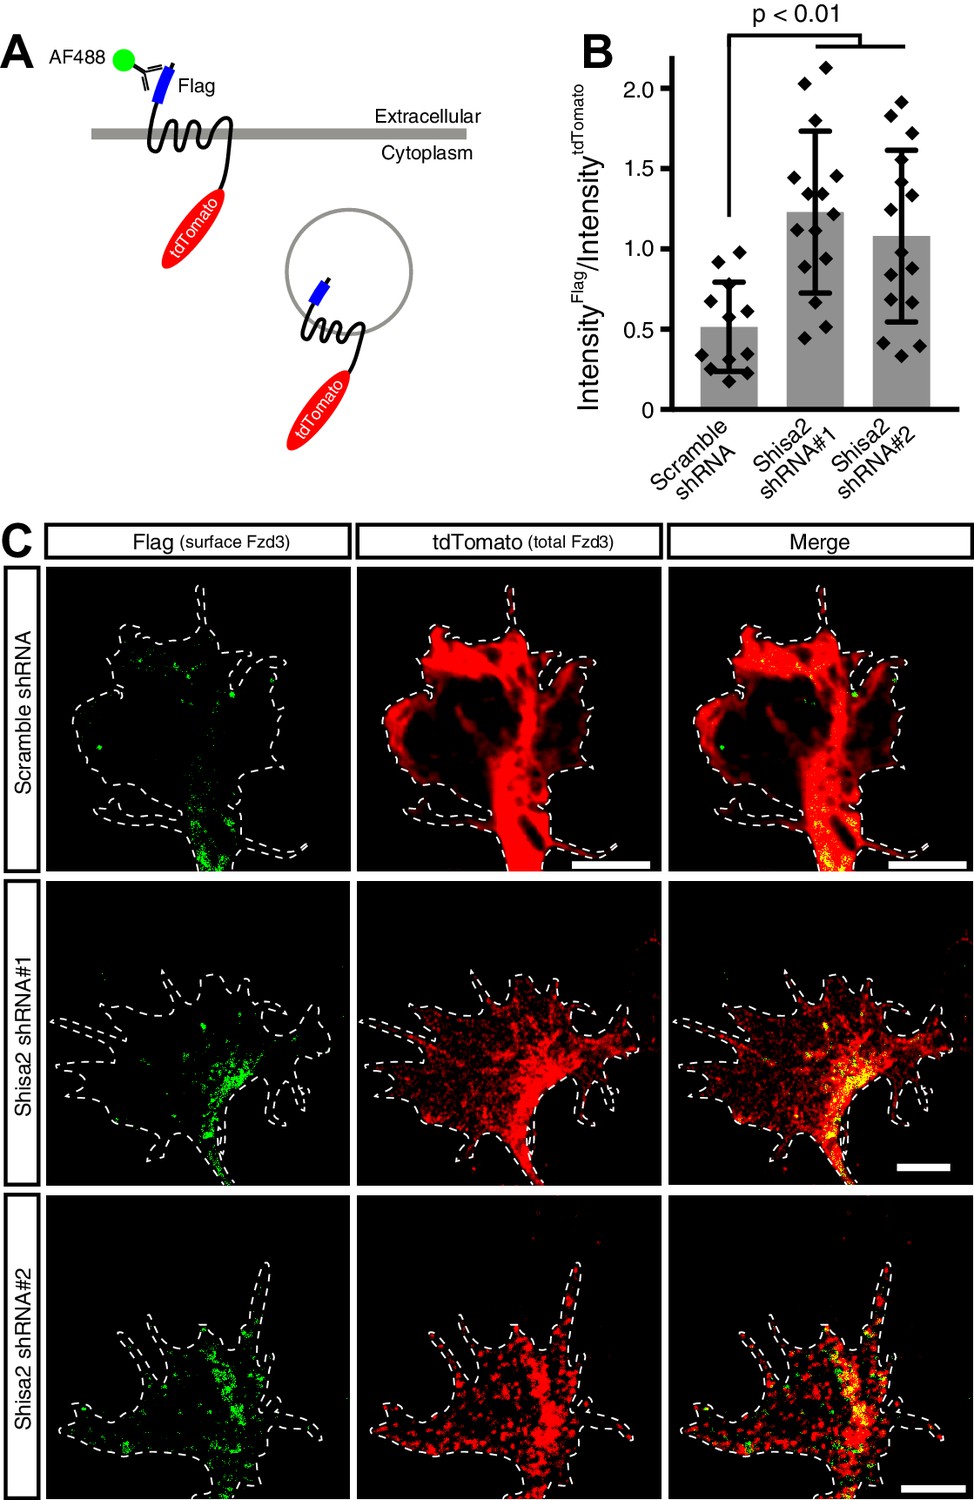
Shisa2 regulates Frizzled3 (Fzd3) trafficking in the growth cone of commissural neurons.
(A) A schematic diagram of a Fzd3 construct that is both Flag-tagged and tdTomato tagged. (B) Quantification of cell-surface levels of the tagged Fzd3. FLAG signal intensity (cell surface Fzd3) was normalized by tdTomato signal intensity (total Fzd3). Shisa2 knockdown resulted in elevated cell-surface levels of Fzd3. Data are mean ±SD with each data point (Scramble shRNA = 12; Shisa2 shRNA#1 = 15; Shisa2 shRNA#2 = 15). (C) Representative images of Flag–Fzd3–tdTomato positive growth cones with Scramble or Shisa2 shRNA. Scale bars: 5 μm. Dashed lines indicate outlines of the growth cones.
Figure 7 with 1 supplement
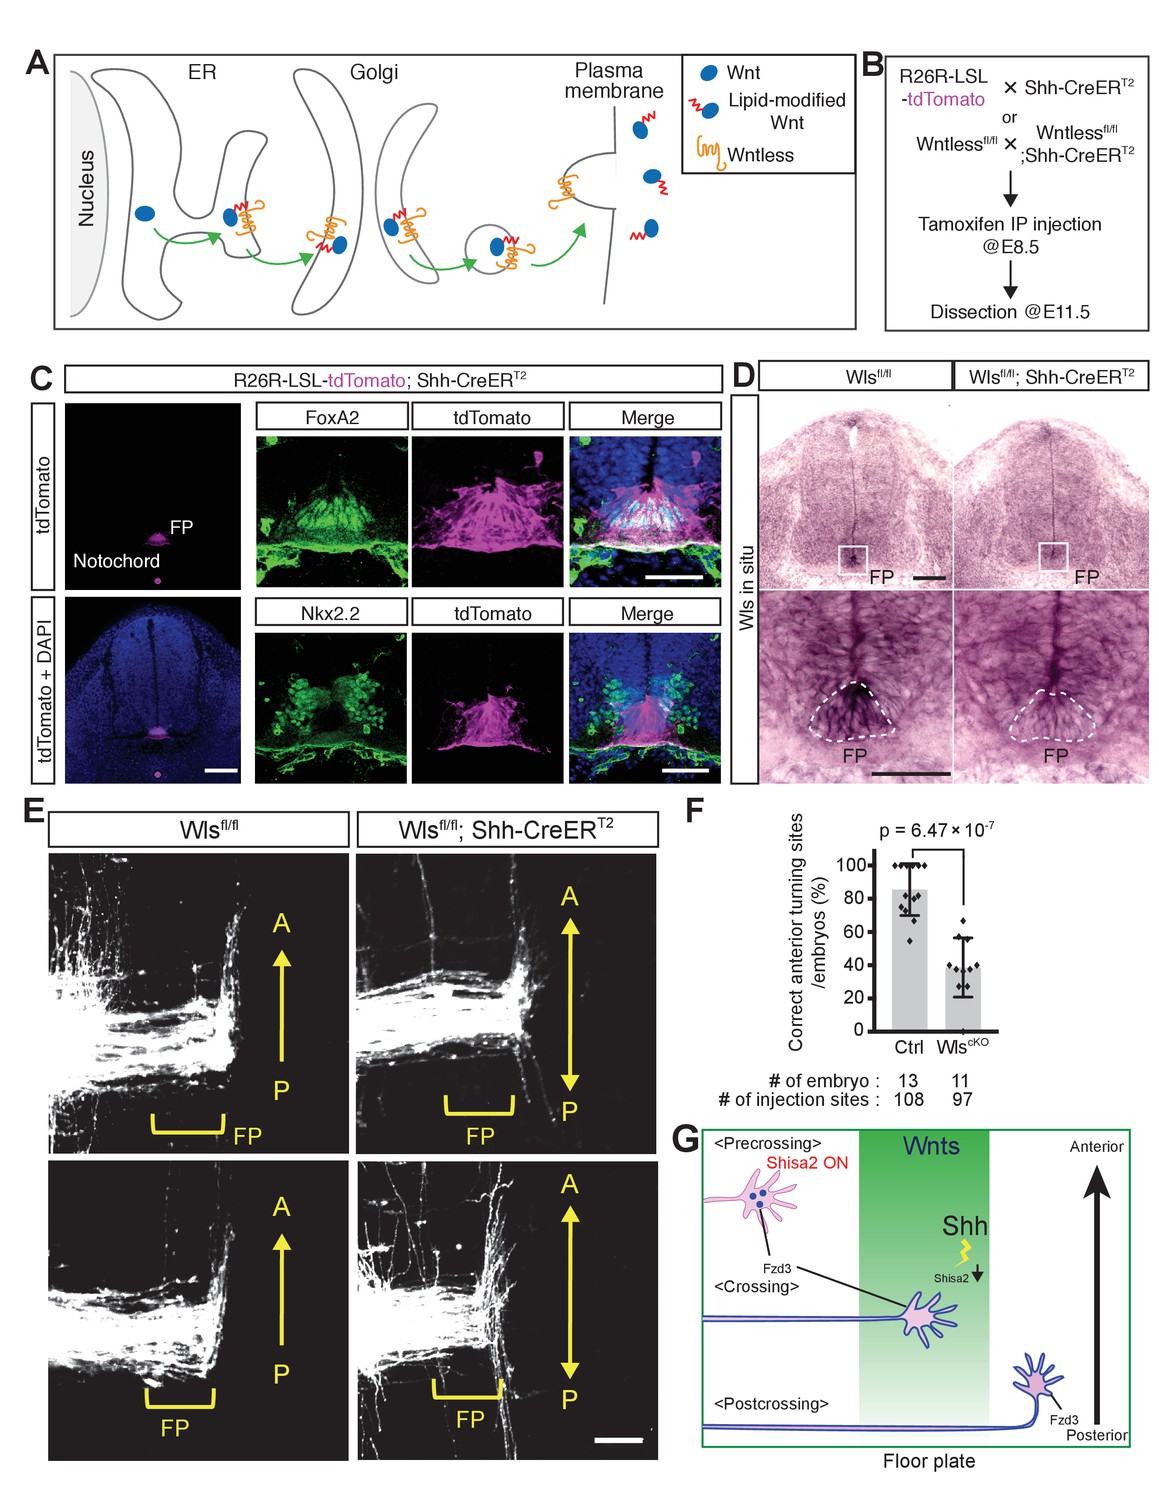
Wntless (Wls) in the floor plate is essential for A–P guidance of commissural axons.
(A) Schematic of Wls function in Wnt secretion. Wls is required for Wnts secretion. (B) Schematic of experimental design. Tamoxifen (0.1 mg/g of mother) was injected intraperitoneally at E8.5. Embryos were harvested and dissected at E11.5 for immunohistochemistry (IHC), in situ hybridization (ISH) and DiI tracing experiments. (C) Cre recombination (tdTomato signal) was detected specifically in the notochord and floor plate. After intraperitoneal injection of tamoxifen (0.1 mg/g mother) at E8.5, embryos were collected at E11.5 and transverse sections were immunostained with the indicated antibodies. FoxA2 is a floor plate marker and Nkx2.2 marks the cells immediately outside the floor plate. (D) Loss of Wls mRNA in the floor plate of Wls cKO (Wls fl/fl; Shh-CreERT2). FP, floor plate. Scale bars, 50 μm. (E) Commissural axons, labeled by lipophilic DiI injection into the dorsal spinal cord, showed A–P guidance defects in Wlsfl/fl; Shh-CreERT2. FP, floor plate. Scale bars, 50 μm. (F) Quantification of A–P guidance defects in (E). The graph represents the percentage of injection sites that showed normal anterior turning (correct turning). Gray bars indicate means of all data points, black bars indicate standard deviations, and diamond dots indicate individual data points (control = 13, cKO = 11). (G) A model for the midline switch of Wnt responsiveness. Before reaching the floor plate, commissural neurons express higher levels of Shisa2. Fzd3 is not glycosylated and not translocated to the cell surface. Therefore, growth cones are not able to sense the Wnt gradient. After commissural axons reach the floor plate, Shh–Smo signaling is activated in the cell bodies of commissural neurons and Shisa2 expression is decreased, allowing Fzd3 to be glycosylated and translocated to the surface of the commissural axon growth cones. After crossing the floor plate, a sufficient amount Fzd3 is on the cell surface and the growth cones can now detect the Wnt gradient and turn anteriorly.
Figure 7—figure supplement 1
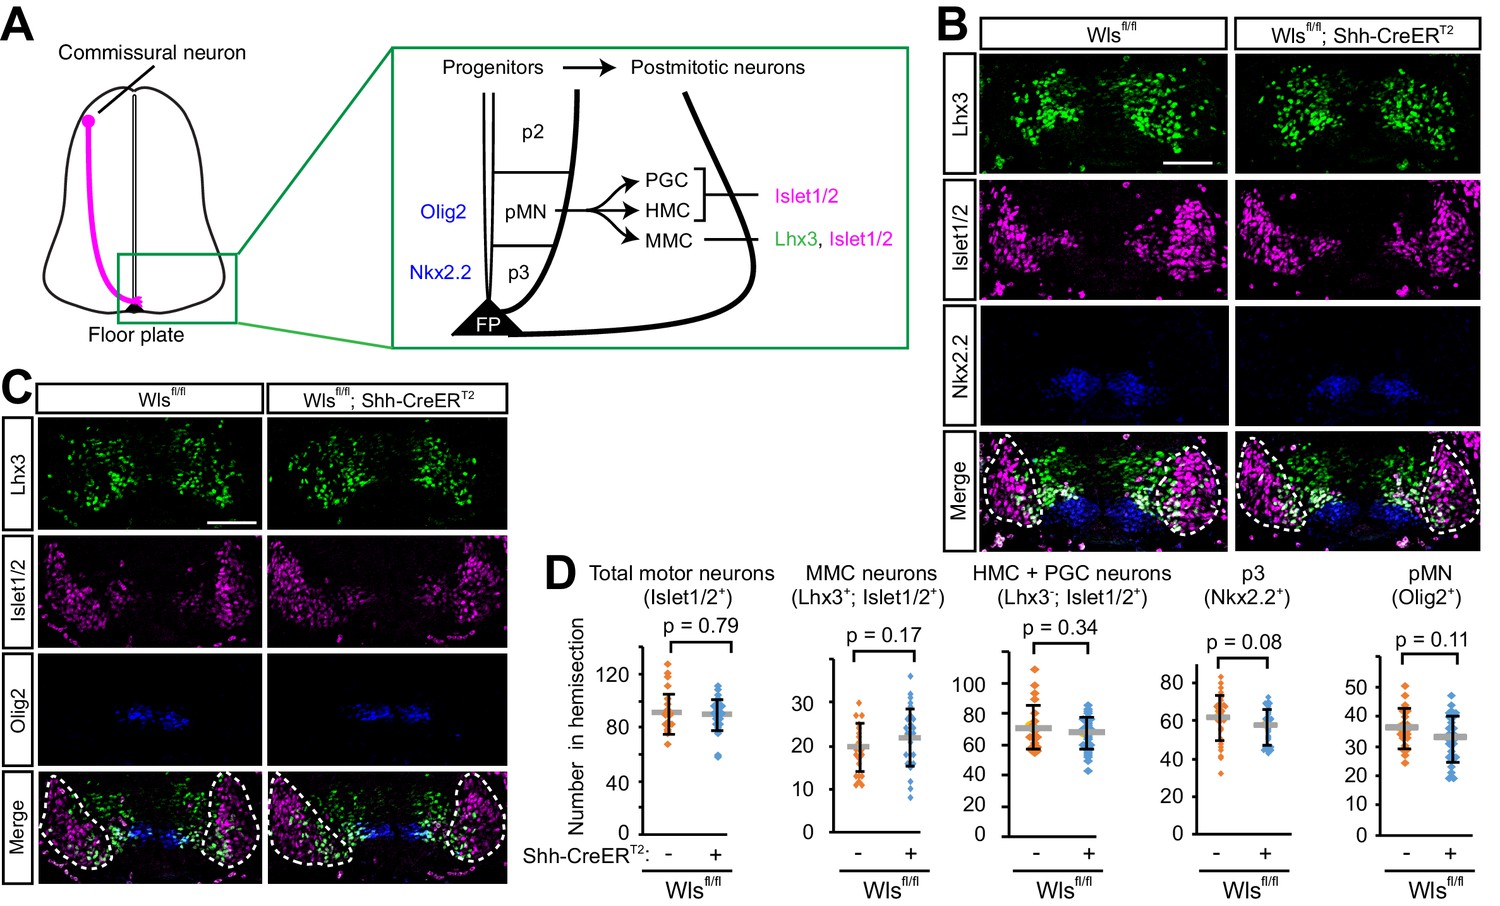
Wntless is not required for cell-fate specification in the ventral spinal cord at E11.5.
(A) Schematics of an E11.5 mouse spinal cord. The pink line indicates the axons of the TAG-1 positive commissural neurons approaching the ventral midline. Ventral progenitor domains and postmitotic neuronal domain (ventral horn) are highlighted in the green box. (B, C) Ventral progenitors and post-mitotic neurons are not affected in Wls cKO. Dashed white lines represent postmitotic ventral horn where MMC, HMC and PGC neurons are located. Scale bars, 50 μm. (D) Quantification of cell numbers in (B) and (C). Gray lines indicate means of all data points, black bars indicate standard deviations, and diamond dots indicate individual data points (Wlsfl/fl; four embryos, Wlsfl/fl; Shh-CreERT2; five embryos).
Additional files
-
Transparent reporting form
- https://doi.org/10.7554/eLife.25269.016
Download links
A two-part list of links to download the article, or parts of the article, in various formats.
Downloads (link to download the article as PDF)
Open citations (links to open the citations from this article in various online reference manager services)
Cite this article (links to download the citations from this article in formats compatible with various reference manager tools)
Sonic Hedgehog switches on Wnt/planar cell polarity signaling in commissural axon growth cones by reducing levels of Shisa2
eLife 6:e25269.
https://doi.org/10.7554/eLife.25269


