RNA-dependent stabilization of SUV39H1 at constitutive heterochromatin
- Stanford University School of Medicine, United States
- Duke University Medical Center, United States
- University of Connecticut, United States
Figures
Figure 1 with 2 supplements
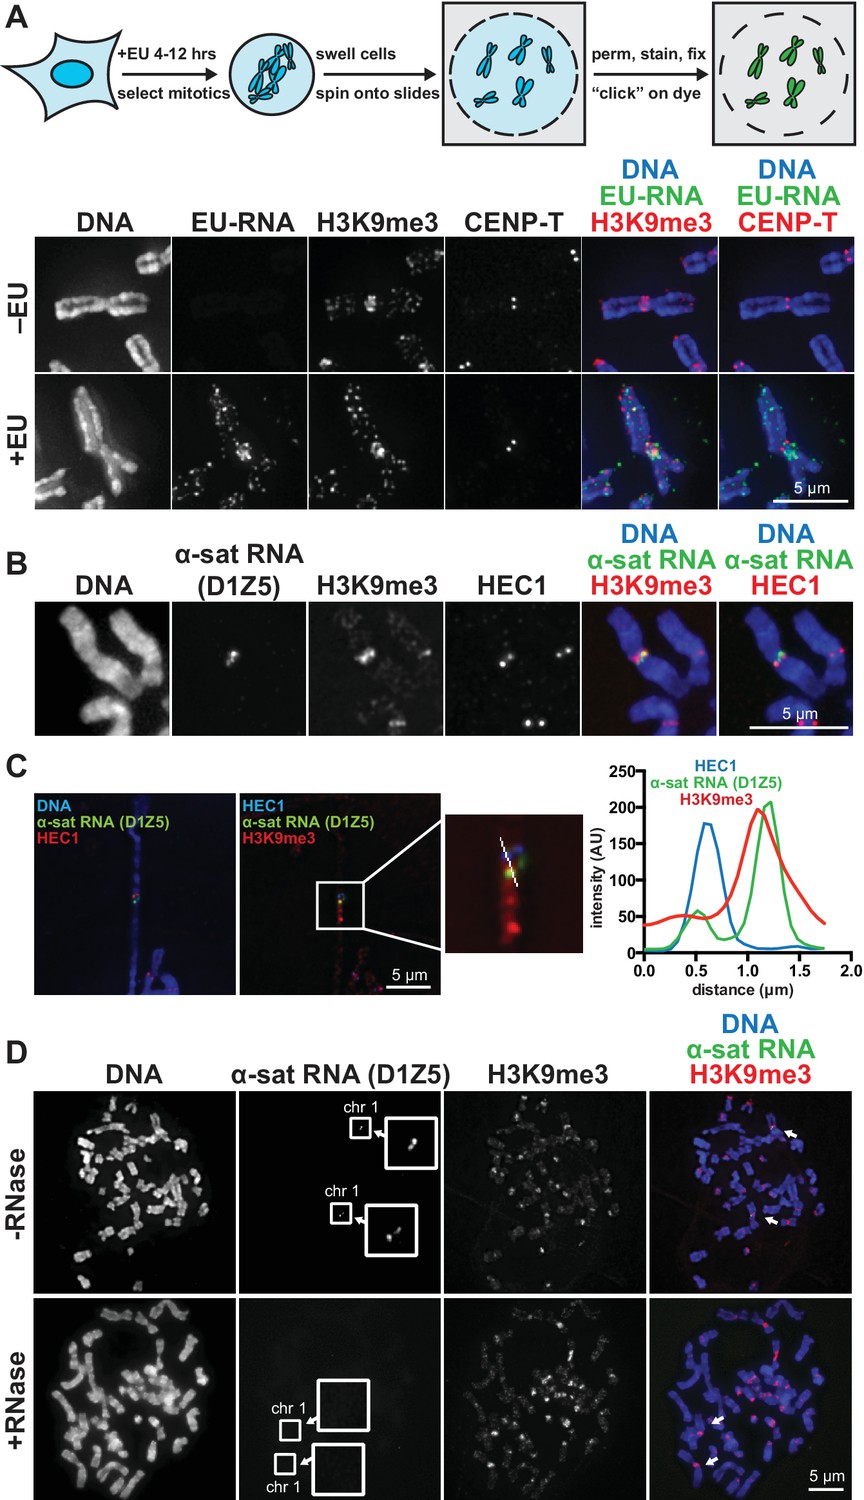
RNA associates with the pericentric regions of human mitotic chromosomes.
(A) RNA localization on human mitotic chromosomes. A schematic of the chromosome-associated RNA labeling approach is shown at top. Mitotic HeLa cells were spun onto coverslips and stained for DNA (blue), ethynyl uridine labeled RNA (EU-RNA, green), and H3K9me3 (red) or CENP-T (red) to mark centromeres. Top row of images: cells were not treated with EU (-EU). Bottom row of images: cells were labeled with EU for 12 hr (+EU). (B) α-satellite RNA localization on mitotic chromosomes. Mitotic DLD-1 cells were spun onto coverslips, then α-satellite RNA was detected with a probe recognizing the pericentric D1Z5 array on human chromosome 1 (green). Chromosomes were also stained for DNA (blue), H3K9me3 (red), and HEC1 (red) antibodies to mark pericentric heterochromatin and the core centromere/kinetochore region. (C) D1Z5 α-satellite RNA overlaps with pericentric heterochromatin, but not the core centromere/kinetochore. α-satellite RNA FISH with the D1Z5 probe (green) on a stretched DLD-1 mitotic chromosome, co-stained for DNA (blue), H3K9me3 (red), and HEC1 (red). Line scans show α-satellite RNA overlaps with H3K9me3, but not HEC1. (D) RNase sensitivity of D1Z5 α-satellite RNA FISH signal. Spread mitotic DLD-1 cells were treated ± RNases, then stained for DNA (blue), D1Z5 α-satellite RNA (green), and H3K9me3 (red). See also Figure 1—figure supplement 1 and 2.
Figure 1—figure supplement 1
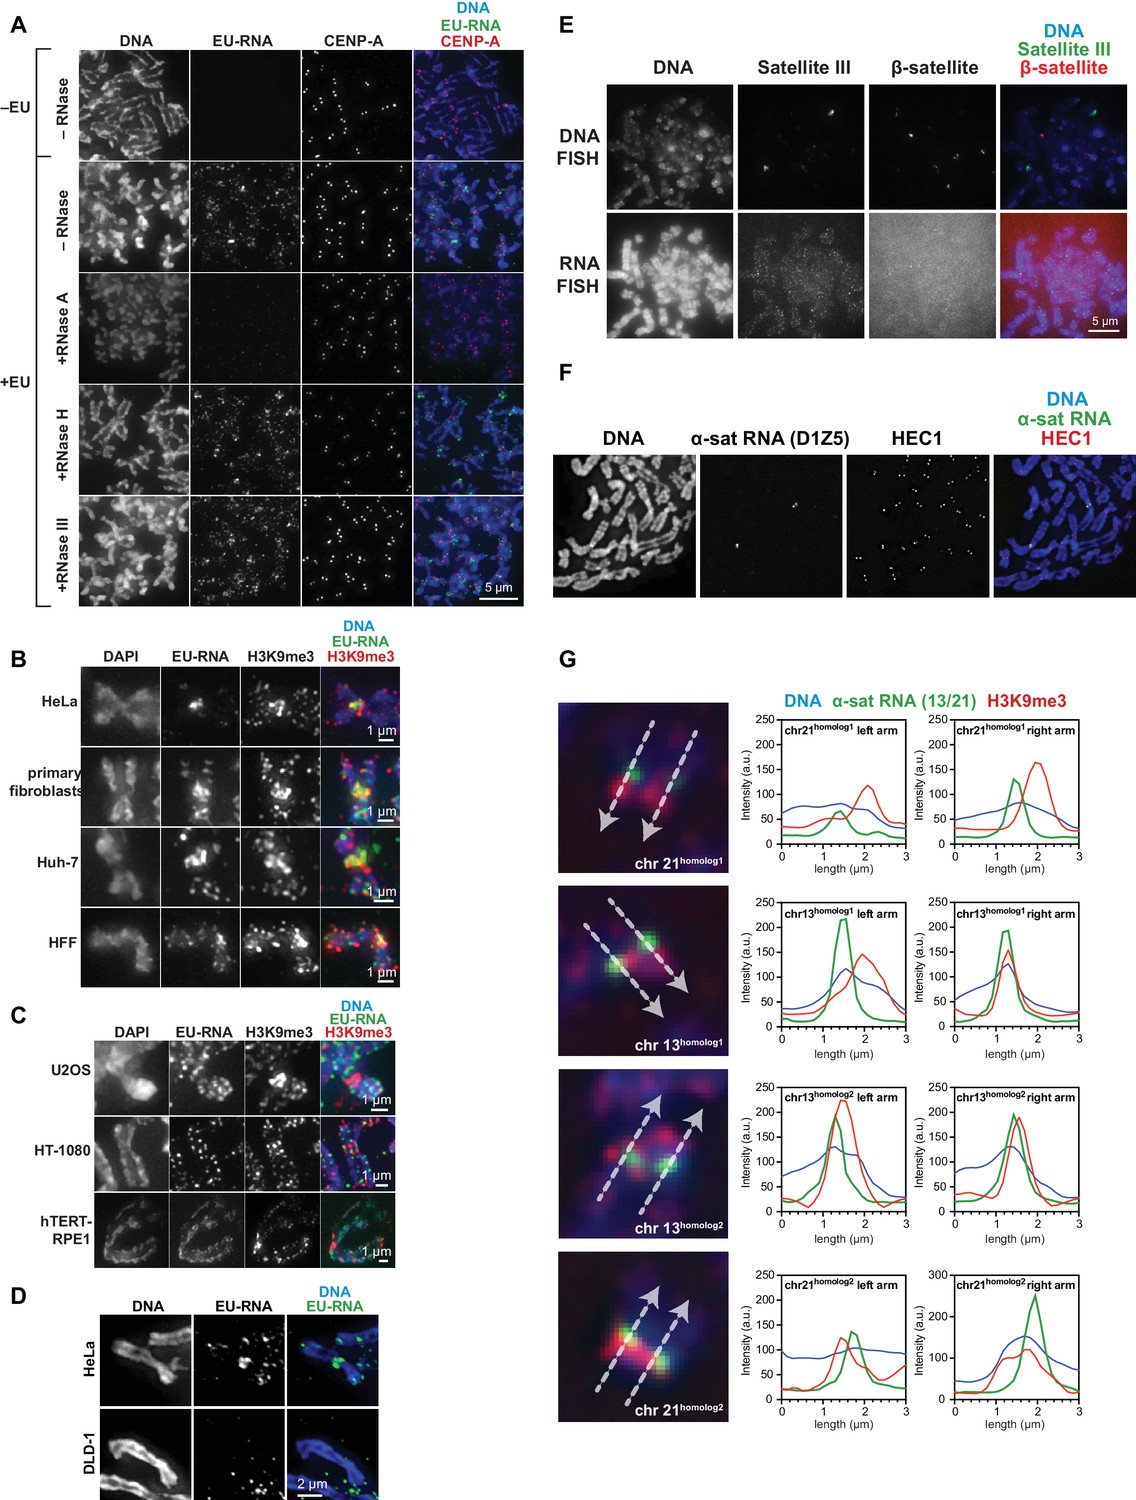
Characterization of chromosome-associated pericentric RNA.
(A) RNase sensitivity of pericentric RNA. EU-labeled mitotic HeLa cells were spun onto coverslips and incubated with or without RNase A, RNase H, or RNase III as indicated, then stained for DNA (blue), EU-RNA (green) and CENP-A (red) to mark centromeres. (B, C) Representative images of different types of human cell lines, showing RNA localization on mitotic chromosomes. Cells were labeled with EU for 12 hr, then mitotic cells were spun onto coverslips and stained for DNA (blue), EU-RNA (green), and H3K9me3 (red). (B) shows cell lines tested that, like HeLa cells, show RNA concentrated around centromeres. (C) shows cell lines tested that show no apparent concentration of RNA around centromeres. (D) EU-RNA staining on DLD-1 chromosomes. Cells were labeled with EU and stained as described above. Although α-satellite RNA is detected on DLD-1 chromosomes by RNA FISH, there is little detectable EU-RNA signal. (E) β-satellite and Satellite III DNA and RNA on human mitotic chromosomes. Mitotic DLD-1 cells were spread onto coverslips, RNA or DNA FISH was performed to detect Satellite III (green) and β-satellite (red) sequences, and then chromosomes were stained for DNA (blue). The β-satellite probe recognizes sequences on chromosomes 13, 14, 15, 21, and 22, and the Satellite III probe recognizes sequences on chromosomes 14 and 22. (F) RNA FISH for D1Z5, a chromosome 1 specific α-satellite array, on HeLa mitotic chromosomes. Mitotic HeLa cells were spread onto coverslips, RNA FISH was performed to detect chromosome 1-specific D1Z5 α-satellite sequences (green), and chromosomes were stained for HEC1 to mark centromeres (red) and with Hoechst to stain for DNA (blue). (G) RNA FISH on DLD-1 chromosomes with a probe specific to an α-satellite array on chromosomes 13 and 21. Mitotic DLD-1 cells were spread onto coverslips, RNA FISH was performed to detect α-satellite 13/21 (green), and then chromosomes were stained for DNA (blue) and H3K9me3 (red). Line scans of all four 13 and 21 chromosomes show localization of α-satellite RNA and H3K9me3. White arrows delineate direction of line scan, and the labeling of homologous chromosomes as ‘homolog 1’ or ‘homolog 2’ is arbitrary. The Y-axis represents the pixel intensity along the drawn line.
Figure 1—figure supplement 2
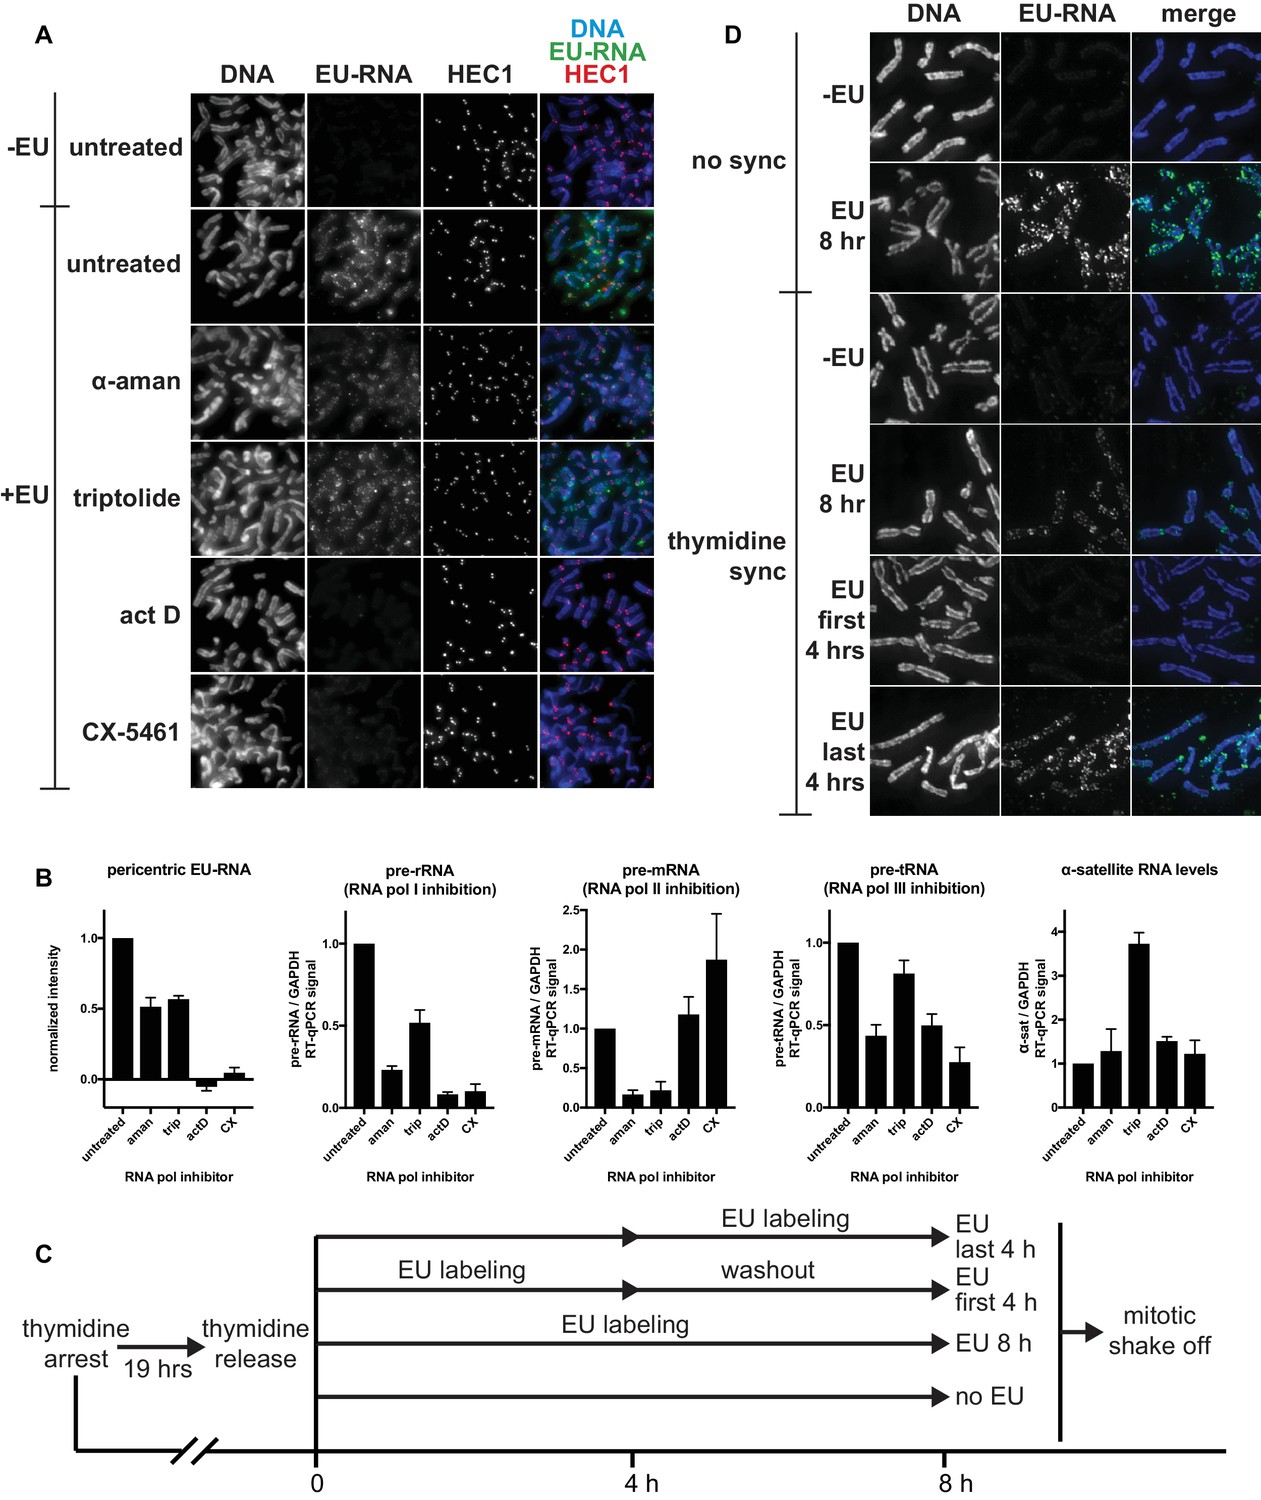
Identifying the transcriptional requirements for chromosome-associated RNA.
(A) Representative images showing chromosome-associated EU-RNA signal after inhibiting RNA polymerases. HeLa cells were incubated with 0.5 mM EU and 50 μg/mL α-amanitin, 1 μM triptolide, 50 ng/mL actinomycin D, or 1 μM CX-5461 for 6 hr, then mitotic cells were spun onto coverslips and stained for DNA (blue), EU-RNA (green), and HEC1 to mark centromeres (red). (B) Quantificaton of EU-RNA at pericentric regions and RT-qPCR controls to assess inhibition of transcription by different RNA polymerase inhibitors. Far left panel: images from the experiment shown in A were quantified using pericentromere finder software and HEC1 staining as a centromere marker. Shown are the means of 3 separate experiments, 15 images quantified per condition per experiment. Four rightmost panels: total RNA was purified from cells treated with the indicated polymerase inhibitors (same cells shown in A), and RT-qPCR was performed with primers for control RNAs to check for inhibition of specific polymerases and to measure α-satellite RNA levels. All values were normalized to GAPDH RNA levels. Shown are the means of 3 separate experiments. All error bars represent standard error. (C) Diagram describing EU pulse/chase experiment to assess when chromosome-associated RNA is being transcribed. HeLa cells were incubated with 2 mM thymidine for 19 hr, then thymidine was washed out and 0.5 mM EU was added at the indicated time intervals before mitotic shake off. (D) Resulting mitotic spreads from experiment outlined in C, showing that chromosome-associated RNA is transcribed in the few hours before mitosis. Cells were harvested by mitotic shake off, spun onto coverslips, and stained for DNA (blue), and EU-RNA (green).
Figure 2 with 1 supplement
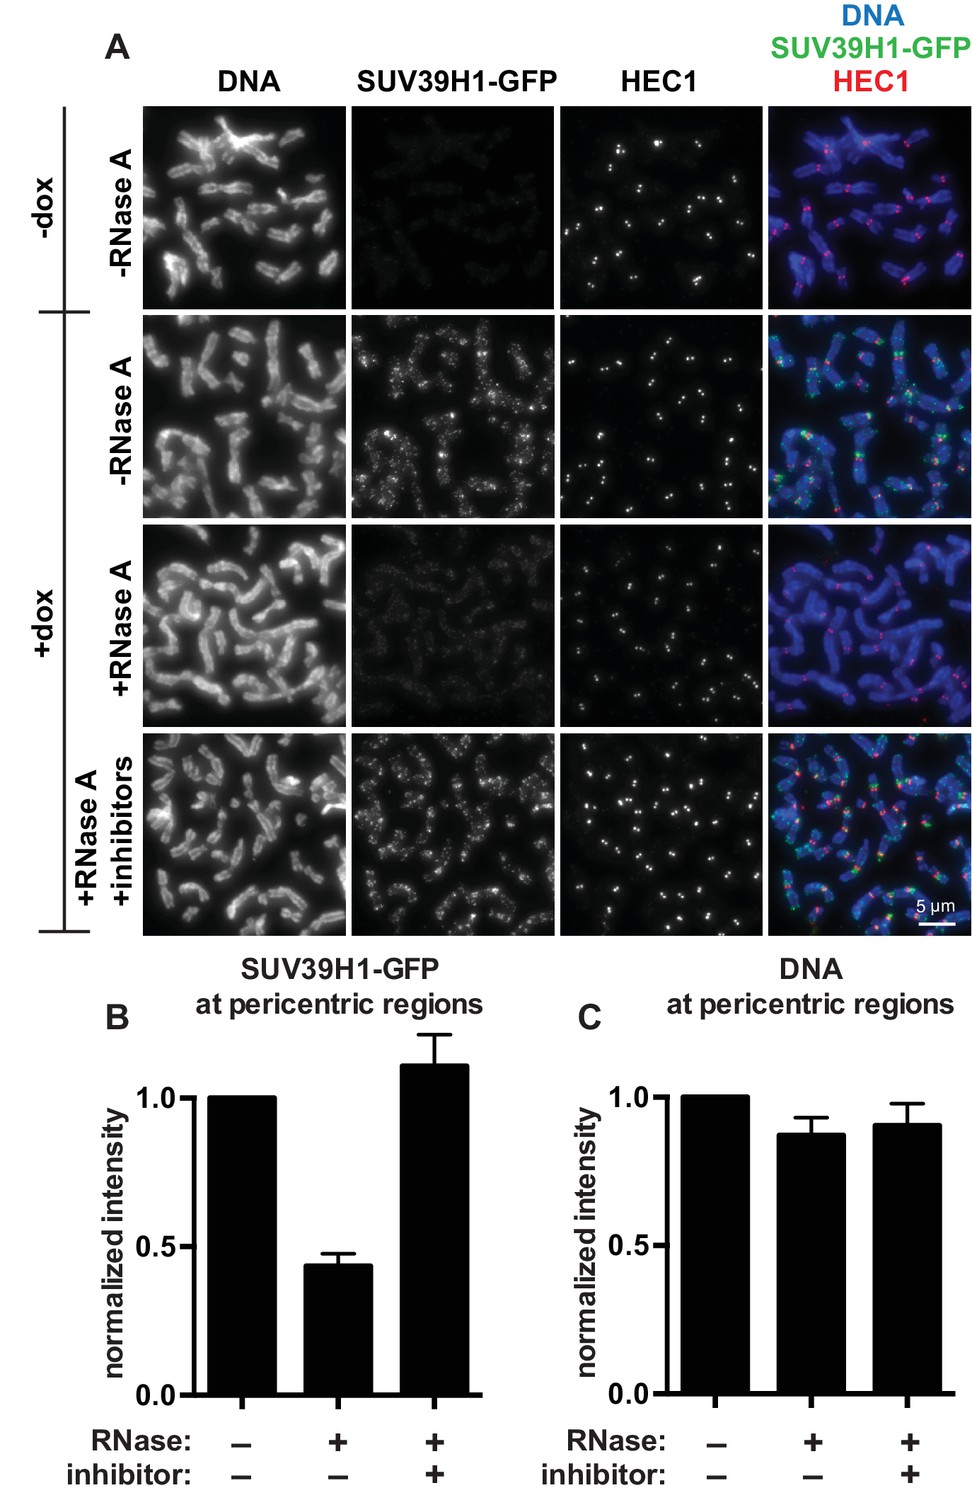
SUV39H1 localization on mitotic chromosomes is disrupted by RNase treatment.
(A) Mitotic HeLa cells expressing or not expressing SUV39H1-GFP (+/-dox) were spread onto coverslips and incubated without RNase, with RNase A, or with RNase A plus RNase inhibitors. Cells were then stained for DNA (blue), anti-GFP to detect SUV39H1 (green), and HEC1 to mark centromeres (red). (B) Quantification of SUV39H1-GFP pericentric signal. The graph shows the average signal after subtracting background (-dox) and normalizing to control levels (+dox, -RNase A). n = 5 separate experiments, 15 cells quantified per condition per experiment, error bars are standard error. (C) Quantification of DNA pericentric signal. The graph shows the average signal after normalizing to control levels (+dox, -RNase A). n = 5 separate experiments, 15 cells quantified per condition per experiment, error bars are standard error. See also Figure 2—figure supplement 1.
Figure 2—figure supplement 1
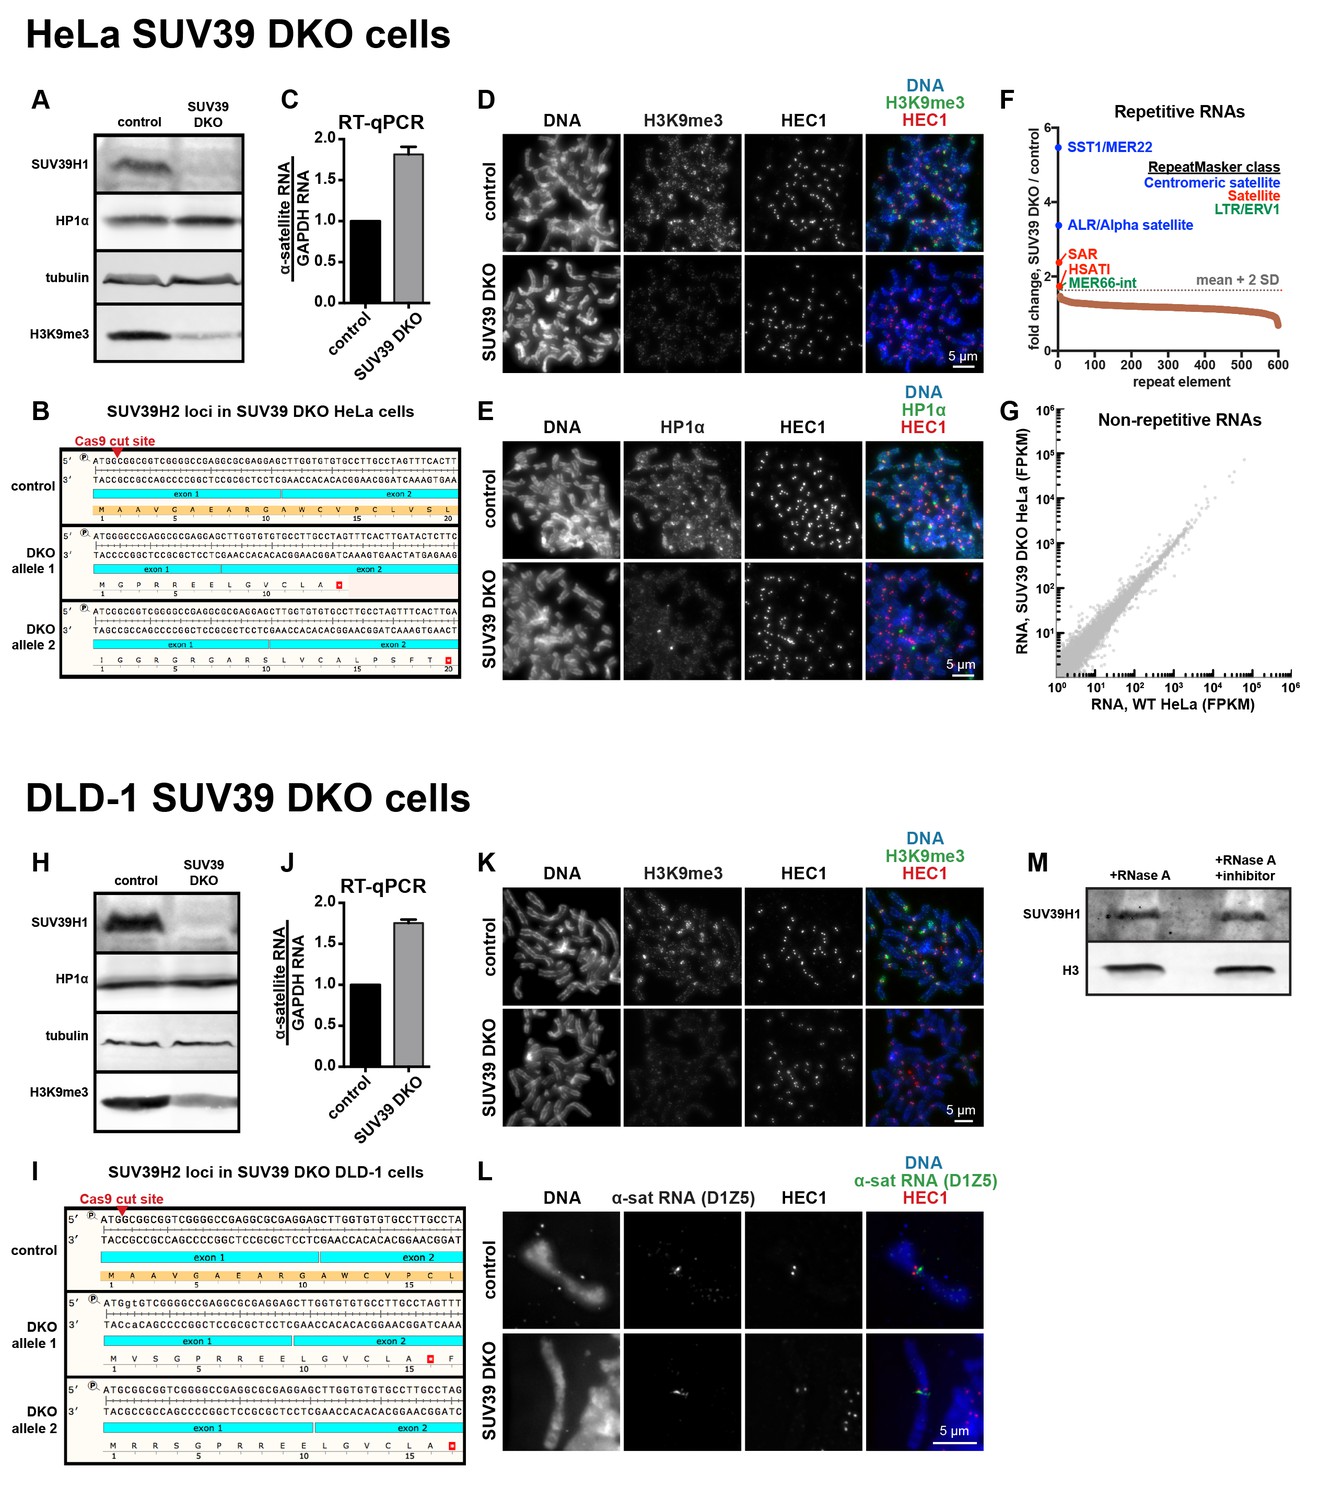
Characterization of SUV39 DKO human cells.
(A) Western blot analysis of HeLa SUV39 DKO cells, assessing total SUV39H1, HP1α, tubulin, and H3K9me3 levels. (B) Analysis of SUV39H2 loci in HeLa SUV39 DKO cells. A section of the SUV39H2 gene surrounding the targeted Cas9 cut site was PCRed from genomic DNA and sequenced. Two mutant alleles were identified, and both lead to an early translation termination of SUV39H2. (C) α-satellite RNA levels in HeLa SUV39 DKO cells were measured by reverse transcription followed by quantitative PCR (RT-qPCR). Total RNA was isolated from HeLa control and HeLa SUV39 DKO cells, then reverse transcribed and amplified with α-satellite or GAPDH primers. Shown is average of 5 independent measurements, normalized to control cells, error bars are standard error. (D) H3K9me3 localization in control or SUV39 DKO HeLa cells. Mitotic cells were spread onto coverslips, then stained for DNA (blue), H3K9me3 (green), and HEC1 (red) to mark core centromere/kinetochore regions. (E) HP1α localization in control or SUV39 DKO HeLa cells. Mitotic cells were spread onto coverslips, then stained for DNA (blue), HP1α (green), and HEC1 (red) to mark core centromere/kinetochore regions. (F) Analysis of repetitive RNAs in HeLa SUV39 DKO cells. Total RNA was isolated from HeLa control and HeLa SUV39 DKO cells, and a cDNA library was generated and sequenced. Fold change in RNAs (SUV39 DKO / control) transcribed from different repeat types were plotted as a rank order from highest to lowest. Repeat types with over 300 reads were included. The horizontal gray dotted line represents a cutoff of 2 standard deviations from the mean of the dataset. Brown dots represent repeat types that fall under two standard deviations from the mean. Repeats that were enriched more than two standard deviations from the mean are labeled, and colors represent the RepeatMasker broad repeat class to which that repeat type belongs. (G) Comparative analysis of non-repetitive RNA levels in HeLa control and HeLa SUV39 DKO cells. RNA was isolated and sequenced as described in F, and non-repetitive (uniquely mapping) RNAs were analyzed. FPKM: Fragments Per Kilobase of transcript per Million mapped reads. (H) Western blot analysis of DLD-1 SUV39 DKO cells, assessing total SUV39H1, HP1α, tubulin, and H3K9me3 levels. (I) Analysis of SUV39H2 loci in DLD-1 SUV39 DKO cells. A section of the SUV39H2 gene surrounding the targeted Cas9 cut site was PCRed from genomic DNA and subjected to MiSeq sequencing. Two mutant alleles were identified, and both lead to an early stop in the translation of SUV39H2. (J) α-satellite RNA levels in DLD-1 SUV39 DKO cells were measured by reverse transcription followed by quantitative PCR (RT-qPCR). Total RNA was isolated from DLD-1 control and DLD-1 SUV39 DKO cells, then reverse transcribed and amplified with α-satellite or GAPDH primers. Shown is average of 5 independent measurements, normalized to control cells, error bars are standard error. (K) H3K9me3 localization in control or SUV39 DKO DLD-1 cells. Mitotic cells were spread onto coverslips, then stained for DNA (blue), H3K9me3 (green), and HEC1 (red) to mark core centromere/kinetochore regions. (L) α-satellite RNA localization in control or SUV39 DKO DLD-1 cells. Mitotic cells were spread onto coverslips, then stained for DNA (blue), α-satellite (D1Z5 probe, green), and HEC1 (red) to mark core centromere/kinetochore regions. (M) Western blot showing SUV39H1 and histone H3 protein levels in cell lysates treated with RNase A or RNase A plus RNase inhibitors.
Figure 3 with 1 supplement
SUV39H1 directly binds nucleic acids through its chromodomain.
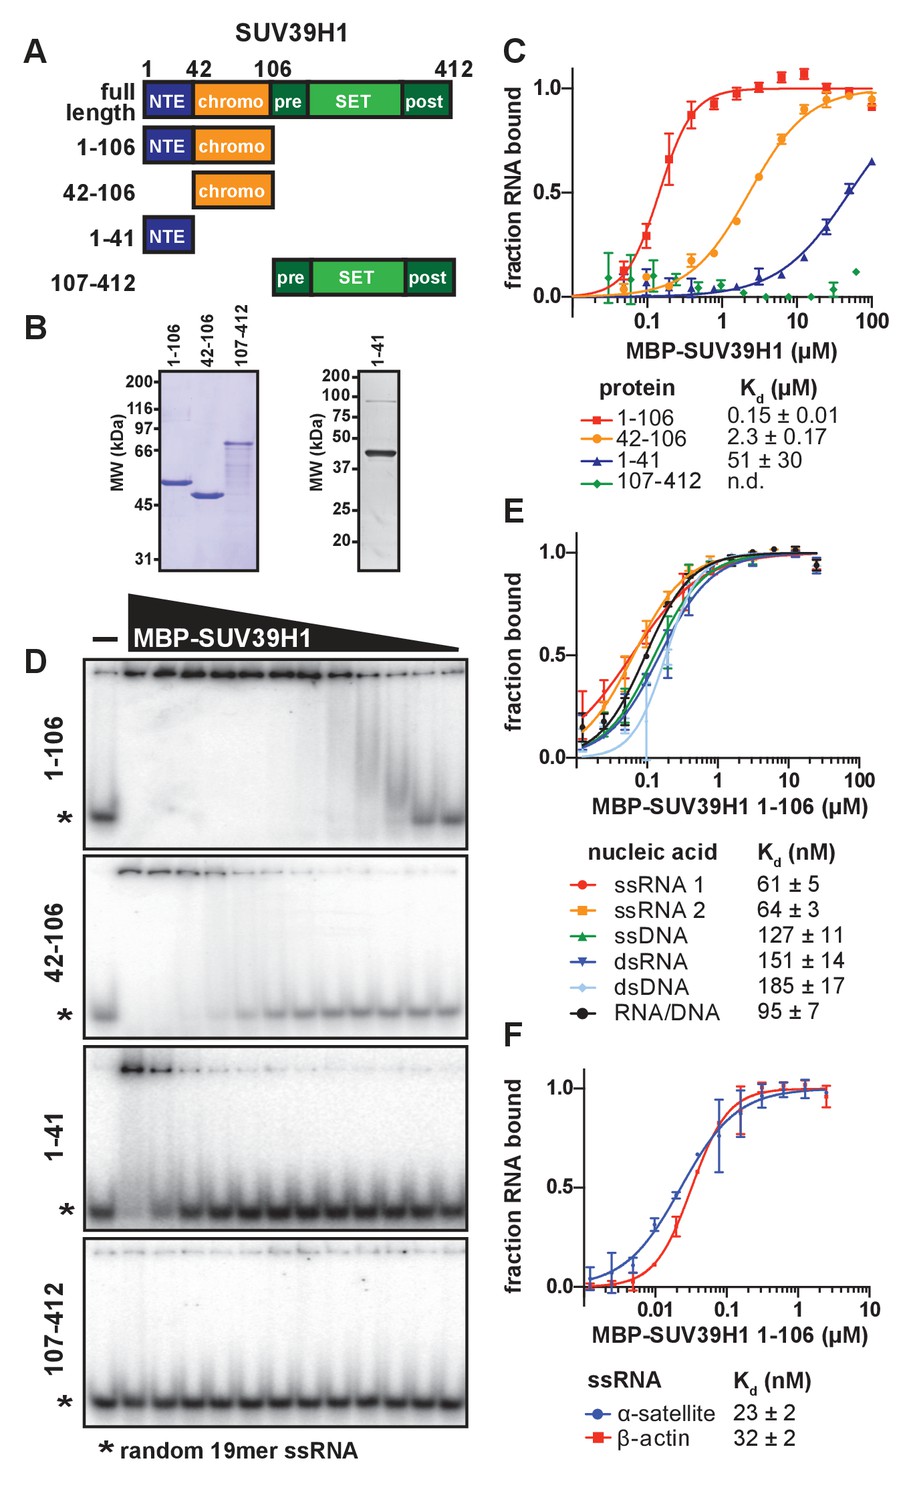
(A) Domain schematic of SUV39H1 truncations. NTE, N-terminal extension; chromo, chromodomain; pre, pre-SET; post, post-SET. Amino acid residues are listed above and to the left of each truncation. (B) Coomassie-stained gel of purified human SUV39H1 truncations fused to MBP. (C) Quantification of SUV39H1 domains binding to 19mer RNA. Binding curves are from quantifying EMSAs shown in 3D. Error bars are standard deviation from two independent experiments. Dissociation constants (Kd, μM) displayed on graph are determined by non-linear fitting of the binding curves. Standard error represents the error of the curve fitting to the average of the two experimental replicates. (D) Representative EMSAs showing binding of purified MBP-SUV39H1 truncations with a 19mer RNA oligo (*), 1–41, 42–106 and 1–106 diluted 2-fold from 100 μM, 107–412 diluted 2-fold from 62 μM. Quantified in 3C. (E) Binding of SUV39H1 to all nucleic acid types. Binding curves are from quantifying EMSAs (Figure 3—figure supplement 1C) of MBP-tagged SUV39H1 1–106 binding to 50mer nucleic acids (ssRNA, ssDNA, dsRNA, dsDNA, or RNA/DNA) (Figure 3—figure supplement 1B). Various nucleic acids are composed of the first 50 bases of E. coli maltose binding protein (MBP): ssRNA1, sense MBP 1–50; ssRNA 2, anti-sense MBP 1–50; ssDNA, sense MBP 1–50. Error bars, dissociation constants (Kd, μM), and standard error calculated as in 3C. (F) Quantification of MBP-SUV39H1 1–106 binding to 180mer α-satellite or β-actin ssRNA (representative EMSA in Figure 3—figure supplement 1E). Error bars, dissociation constants (Kd, μM), and standard error calculated as in 3C. See also Figure 3—figure supplement 1.
Figure 3—figure supplement 1
Characterization of SUV39H1-RNA binding in vitro.
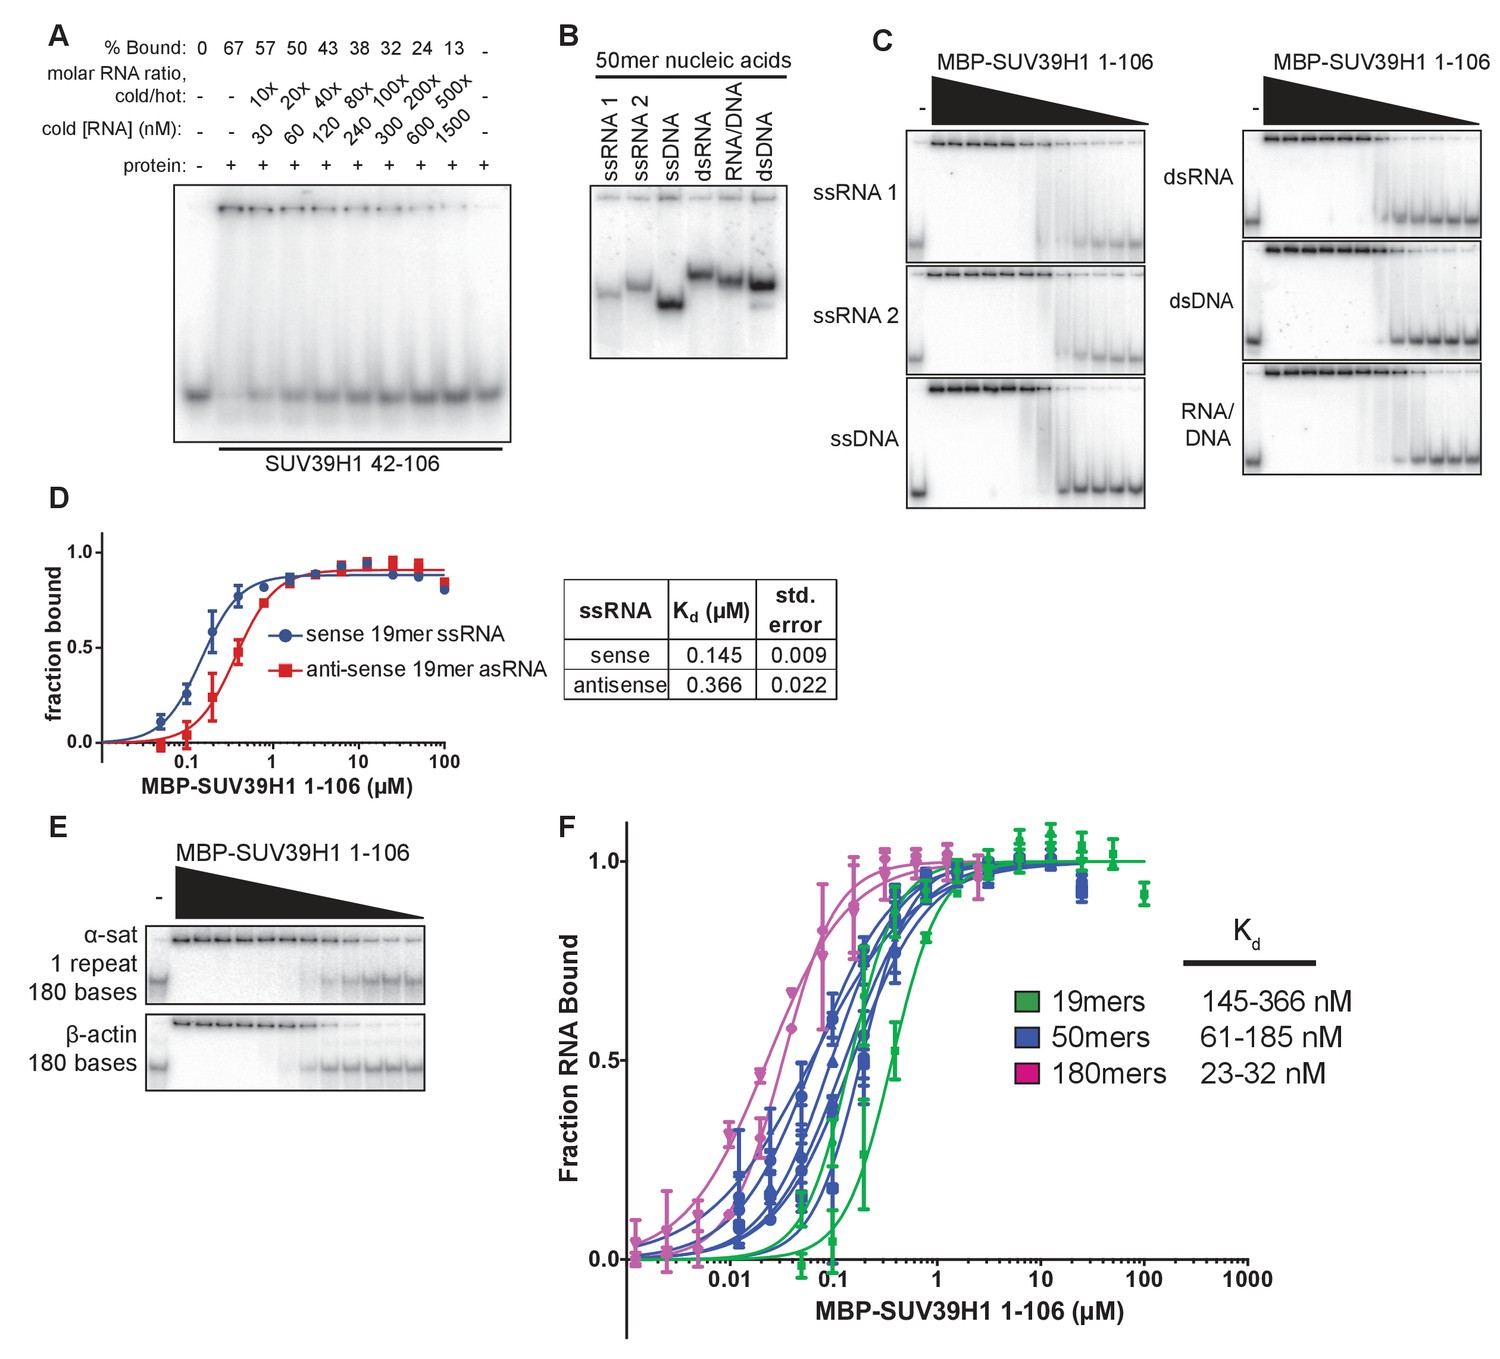
(A) Competitive binding assay measuring the ability of unlabeled 19mer ssRNA to compete with the interaction of labeled 19mer ssRNA binding to MBP-SUV39H1 42–106. MBP-SUV39H1 42–106 present at 12.4 μM, labeled RNA at approximately 3 nM, and unlabeled RNA at concentrations ranging from 30 to 1500 nM. Percent labeled RNA bound is quantified and listed. (B) Various nucleic acids oligonucleotides consisting of the first 50 bases of E. coli MBP run out on a native polyacrylamide gel. Oligonucleotides were annealed to create various nucleic acids and end labeled with radioactive 32P. ssRNA 1, sense MBP 1–50; ssRNA 2, anti-sense MBP 1–50; ssDNA, sense MBP 1–50. (C) Representative EMSAs showing the binding of purified MBP-SUV39H1 1–106 and to various nucleic acids, all composed of the E. coli MBP 1–50 sequence, shown in B. Protein is diluted 2-fold from 25 μM. Quantification in Figure 3E. (D) Left, binding curves showing binding of MBP-SUV39H1 1–106 and either sense or anti-sense 19mer ssRNA, protein diluted 2-fold from 100 µM. Error bars are standard deviation from two independent experiments. Right, dissociation constants (Kd, μM) determined by non-linear fitting of the binding curves. Standard error represents the error of the curve fitting to the average of two experimental replicates. (E) Representative EMSAs showing binding of purified MBP-SUV39H1 1–106 to 180 bases of either α-satellite or β-actin ssRNA. Protein diluted 2-fold from 2.5 μM. Quantification in Figure 3F. (F) SUV39H1 affinity increases as length of nucleic acid increases. Binding curves compiled from Figure 3E and F (50mers and 180mers, respectively) and D) (19mers) showing the binding of MBP-SUV39H1 1–106 to various nucleic acid types. 19mer random sequence: sense and antisense ssRNA; 50mer MBP 1–50: sense and antisense ssRNA, ssDNA, dsRNA, dsDNA, and RNA/DNA hybrid; 180mers: α-satellite and β-actin ssRNA. All sequences are described in the materials and methods. Error bars are standard deviation from two independent experiments. Dissociation constants (Kd, μM) displayed on graph are determined by non-linear fitting of the binding curves. Standard error represents the error of the curve fitting to the average of two experimental replicates.
Figure 4 with 1 supplement
Identification and biochemical characterization of SUV39H1 RNA binding-deficient mutants.
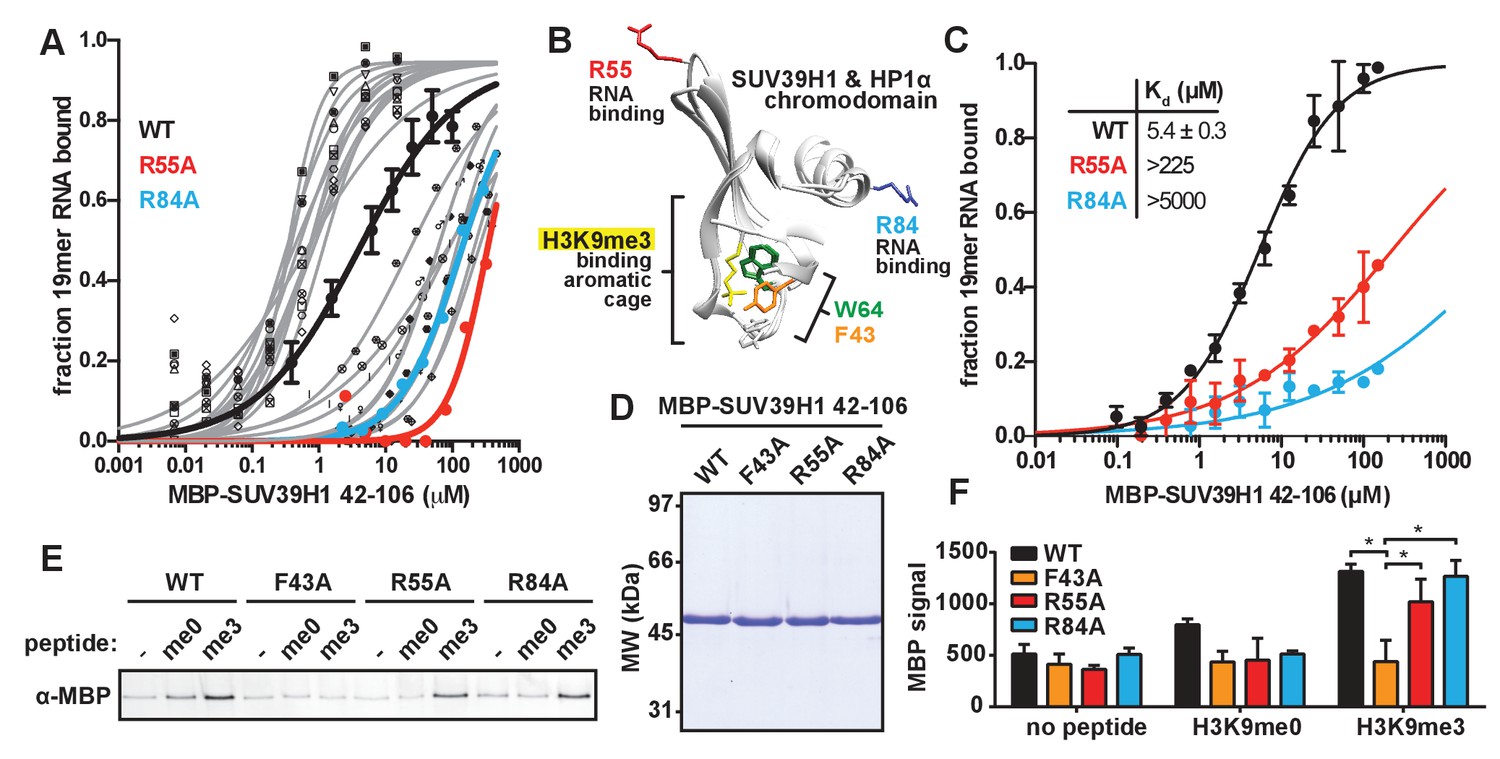
(A) Identification of SUV39H1 mutants that affect RNA binding. Binding curves from second round of EMSA screening showing the binding of purified MBP-SUV39H1 42–106 point mutants to 19mer RNA (table of measured dissociation constants in Figure 4—figure supplement 1B). (B) Crystal structures of the chromodomains of human SUV39H1 (aa 44–91) (Wang et al., 2012) and human HP1α (aa 18–68) bound to H3K9me3 peptide (yellow) (Kaustov et al., 2011). Residues in SUV39H1 important for RNA binding (red and blue) or H3K9me3 binding (green and orange) are highlighted. The H3K9me3 peptide was co-crystalized with HP1α, but not SUV39H1. (C) Quantification of WT SUV39H1, SUV39H1R55A, and SUV39H1R84A binding to 19mer RNA. Binding curves generated by quantifying filter binding assays shown in Figure 4—figure supplement 1D. Error bars are standard deviation from three independent experiments. Dissociation constants (Kd, μM) displayed on graph are determined by non-linear fitting of the binding curves. Standard error represents the error of the curve fitting to the average of the three experimental replicates. (D) Coomassie stained gel of purified MBP-SUV39H1 42–106 proteins – WT, F43A, R55A, or R84A. (E) Binding of SUV39H1 mutants to H3K9me3. Representative α-MBP western blot showing the amount of purified MBP-SUV39H1 42–106 protein, WT or indicated mutant, bound to streptavidin beads conjugated to either H3K9me0 (me0), H3K9me3 (me3), or no peptide (-) added. (F) Quantification of western blot shown in 4E, error bars are standard deviation, n = 3, *p<0.03. See also Figure 4—figure supplement 1.
Figure 4—figure supplement 1
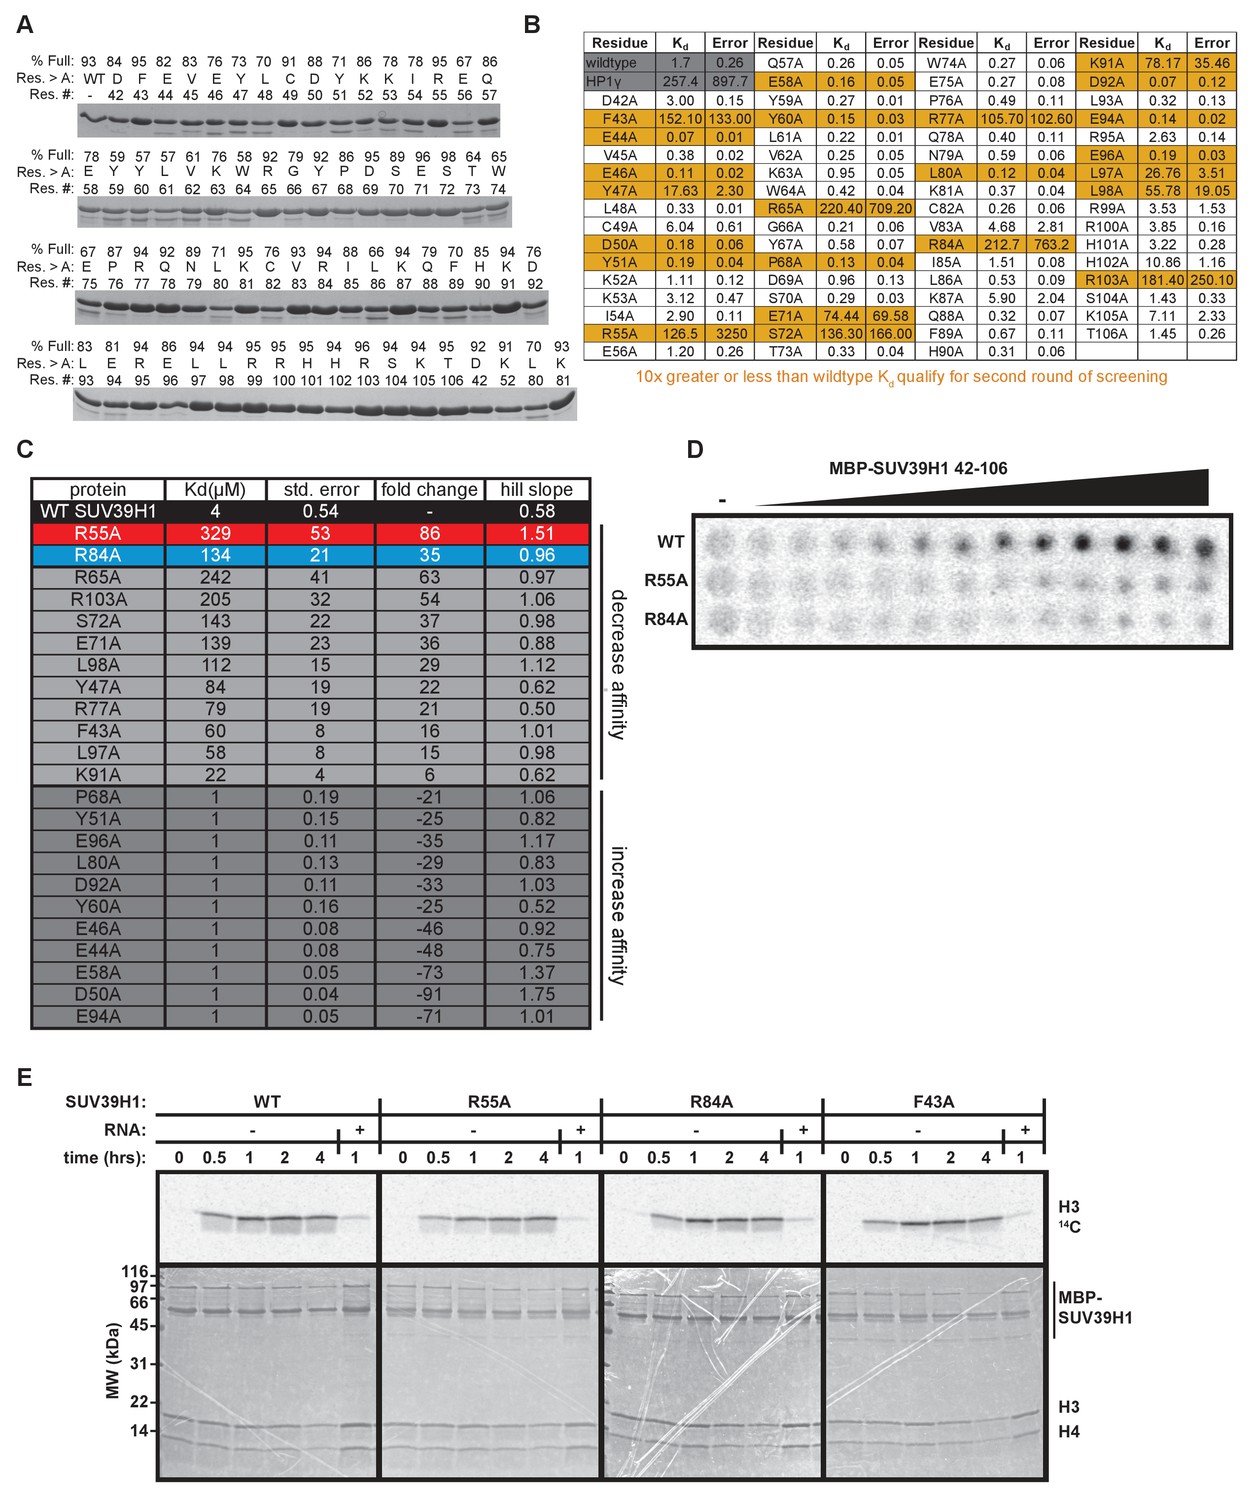
In vitro characterization of SUV39H1 chromodomain mutants.
(A) Coomassie stained gels showing purified MBP-SUV39H1 42–106 alanine point mutants. Percent full length protein calculated by dividing (signal of the top band) / (signal of the top band + signal of the bottom band). Res. #, residue number; res. > A, residue mutated to alanine; % full, percent full-length protein. (B) Table displaying the results from the first round of EMSA screening to measure the binding of MBP SUV39H1 42–106 to a random 19mer ssRNA (sense). Dissociation constants (Kd, μM) displayed on graph are determined by non-linear fitting of the binding curves. Standard error represents the error of the curve fitting to one experiment consisting of 6 protein concentrations analyzed for each mutant. Highlighted mutants (yellow) have either 10-fold greater or less RNA binding affinity compared to WT, and were re-measured in the second round of EMSAs (Figure 4A, Figure 4—figure supplement 1C). (C) Table showing dissociation constants (Kd, μM), standard error, Hill slope, and affinity fold-change compared to WT SUV39H1, of point mutants during the second round of EMSAs. Standard error represents the error of the curve fitting to one experiment consisting of 9 protein concentrations analyzed for each mutant and three independent experiments for WT SUV39H1. (D) Representative filter binding assay measuring RNA binding of WT SUV39H1, SUV39H1R55A, and SUV39H1R84A to random sense 19mer RNA. Quantification shown in Figure 4C. Purified proteins shown in Figure 4D, diluted 2-fold from 200 μM. (E) Histone methyltransferase assay comparing the activity of WT SUV39H1 to SUV39H1 point mutants. Full length purified MBP-SUV39H1 was incubated with purified H3/H4 tetramer and radioactive methyl donor (14C S-adenosyl methionine), +/- RNA, then run on a denaturing gel. Histone H3 methylation was detected with a phosphorimager (top panels), and proteins were visualized by Coomassie staining (bottom panels).
Figure 5 with 1 supplement
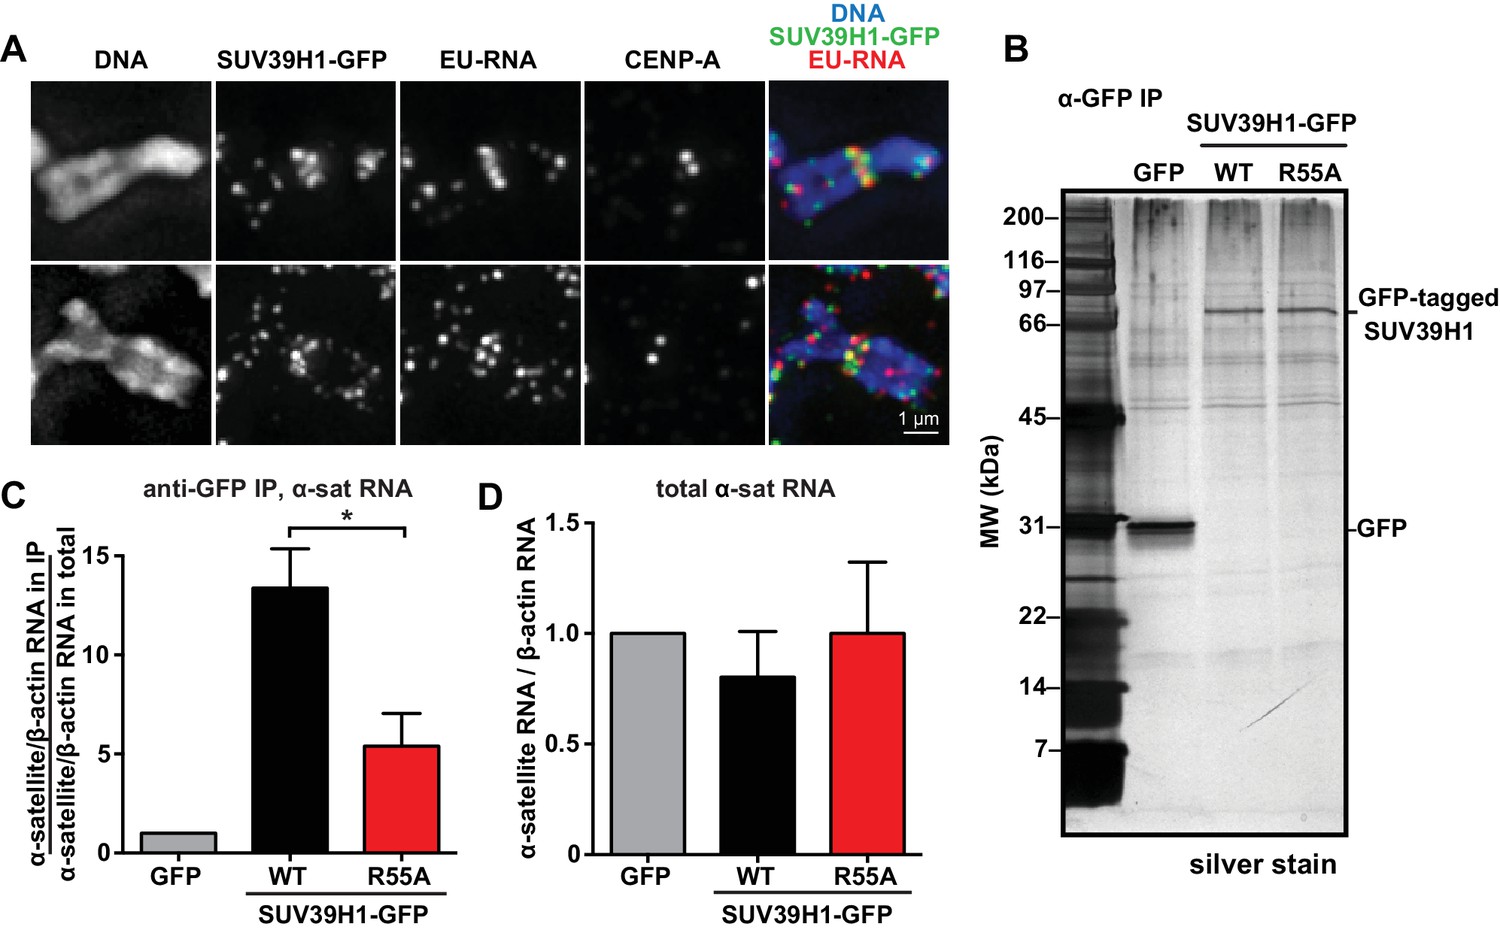
SUV39H1 association with α-satellite RNA in vivo depends on direct nucleic acid binding.
(A) Colocalization of SUV39H1 and RNA at pericentric regions. SUV39H1-GFP expressing HeLa cells were labeled with EU and induced with doxycycline for 6 hr, then mitotic cells were spun onto coverslips. Cells were stained for DNA (blue), with anti-GFP to detect SUV39H1-GFP (green), for EU-RNA (red), and CENP-A to mark centromeres. (B) Silver stained gel showing protein immunoprecipitated by an anti-GFP antibody from cell lines expressing GFP, SUV39H1-GFP, or SUV39H1R55A-GFP. (C) Quantification of α-satellite RNA immunoprecipitated with SUV39H1. RNA was isolated from IPs, and RT-qPCR was performed to detect α-satellite RNA sequence. Enrichment values are the ratio of α-satellite/β-actin RNA in the IP over the ratio of α-satellite/β-actin RNA in total lysate, normalized to the GFP values. Error bars are standard error, n = 3, *p<0.04. (D) Total α-satellite RNA levels in GFP, SUV39H1-GFP, and SUV39H1R55A-GFP cell lines, divided by the amount of β-actin RNA, normalized to the GFP values. See also Figure 5—figure supplement 1.
Figure 5—figure supplement 1

Immunoprecipitation of SUV39H1-GFP from human cells.
(A) Anti-GFP western blot of total input lysate (T), lysate after IP depletion (D), and IP samples (IP) from three different HeLa Flp-In T-REx cell lines. RNA was purified from anti-GFP immunoprecipitated material and analyzed by RT-qPCR (Figure 5). (B) Anti-SUV39H1 and anti-HP1α western blot of total input lysate (T), lysate after IP depletion (D), and IP samples (IP) from three different HeLa Flp-In T-REx cell lines, after performed RIP protocol immunoprecipitation.
Figure 6 with 1 supplement
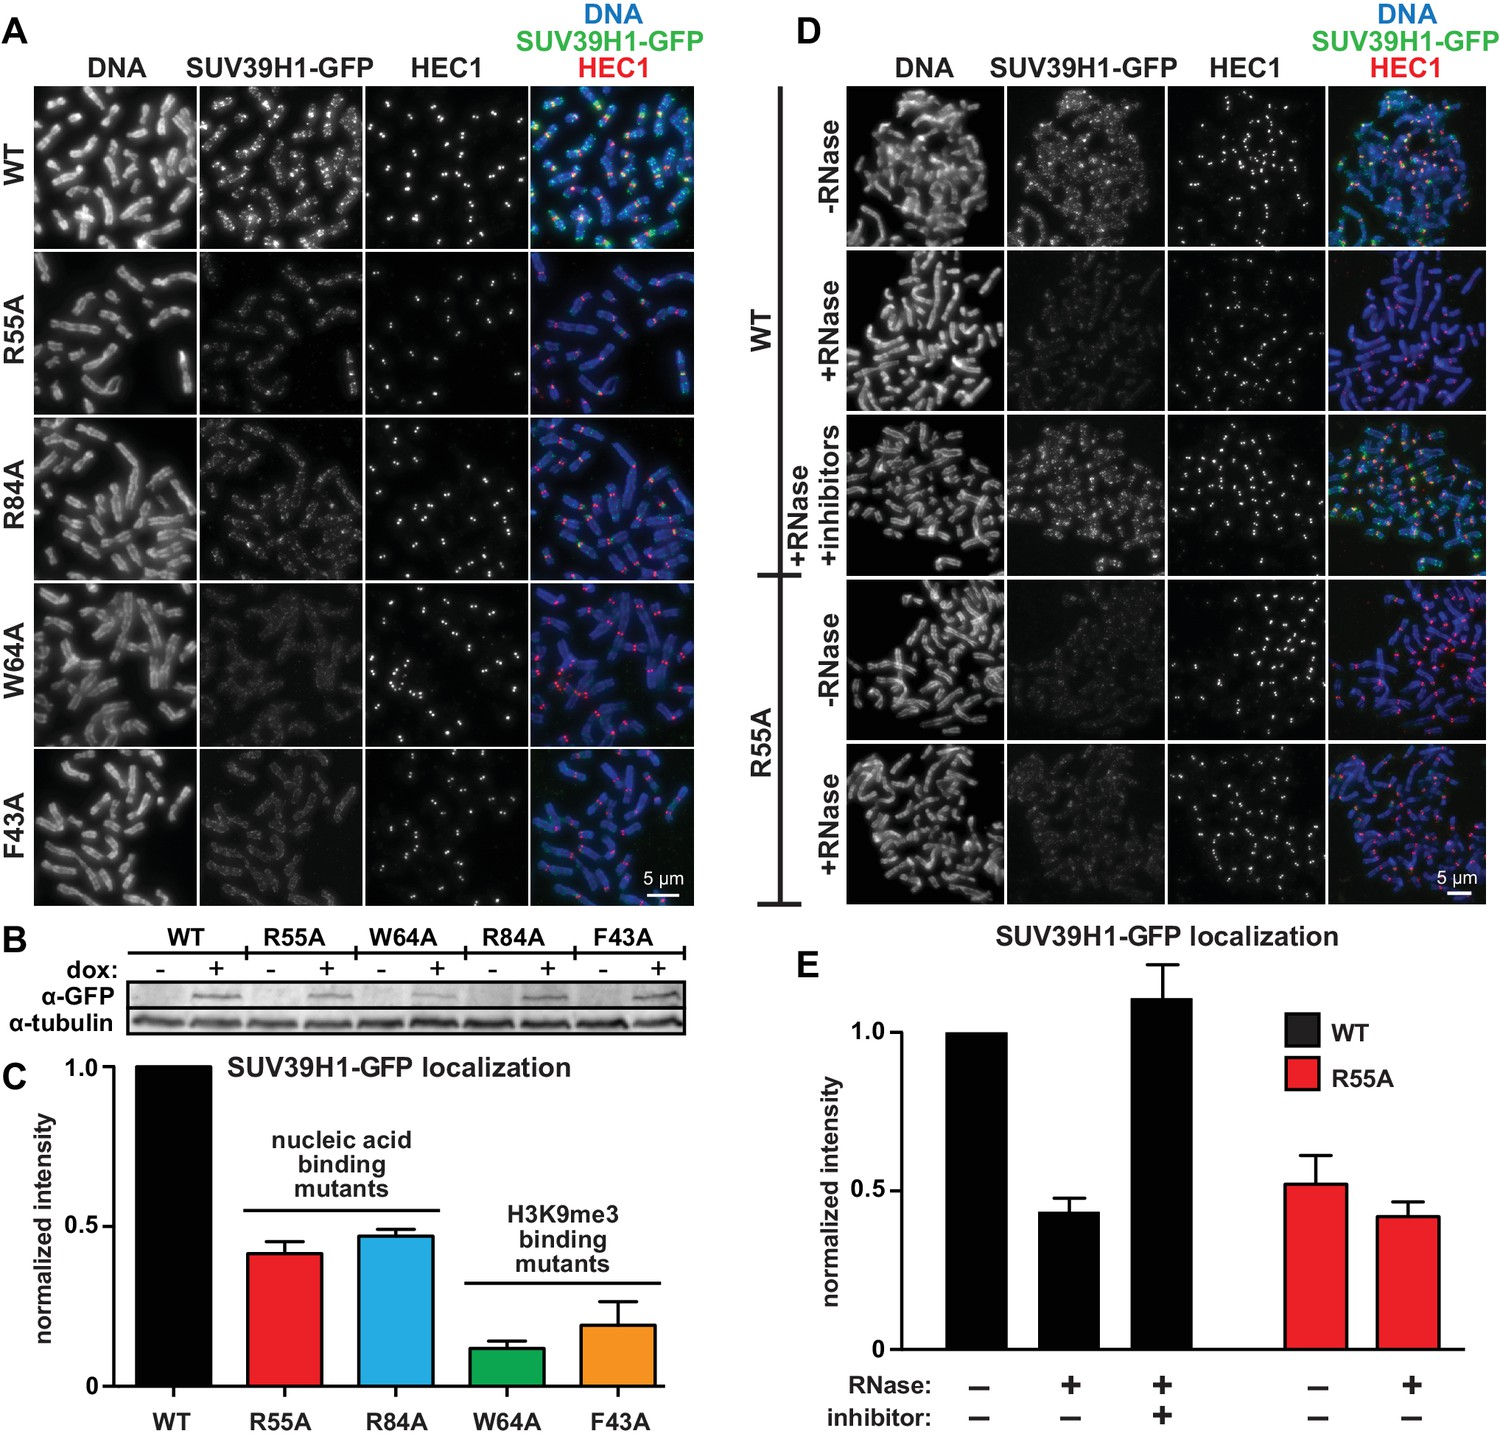
Direct nucleic acid binding by SUV39H1 regulates its localization on mitotic chromosomes.
(A) Localization of WT or mutant SUV39H1-GFP on human mitotic chromosomes. Expression of SUV39H1-GFP was induced in HeLa cell lines for 6 hr, then mitotic cells were spun onto coverslips and stained for DNA (blue), with anti-GFP to detect SUV39H1-GFP (green), and for HEC1 to mark centromeres (red). Shown are representative images. (B) Western blot assessing expression of inducible SUV39H1-GFP in HeLa cell lines after 6 hr of +/- doxycycline induction. (C) Quantification of SUV39H1-GFP levels at pericentric regions, from experiment shown in 6A. Each experiment was normalized to the WT measurement. Bars show the average of n = 3 separate experiments, 15 cells quantified per condition per experiment, error bars represent standard error. (D) Localization of WT or mutant SUV39H1-GFP on human mitotic chromosomes after RNase treatment. Mitotic HeLa cells expressing SUV39H1-GFP (WT or R55A) were spread onto coverslips and incubated without RNase, with RNase A, or with RNase A plus RNase inhibitors. Cells were then stained for DNA (blue), anti-GFP to detect SUV39H1 (green), and HEC1 to mark centromeres (red). Shown are representative images. (E) Quantification of SUV39H1-GFP levels at pericentric regions after RNase treatment, from experiment shown in 6D. Each experiment was normalized to the untreated WT measurement. Shown are the averages of n = 5 separate experiments, 15 cells quantified per condition per experiment, error bars represent standard error. See also Figure 6—figure supplement 1.
Figure 6—figure supplement 1
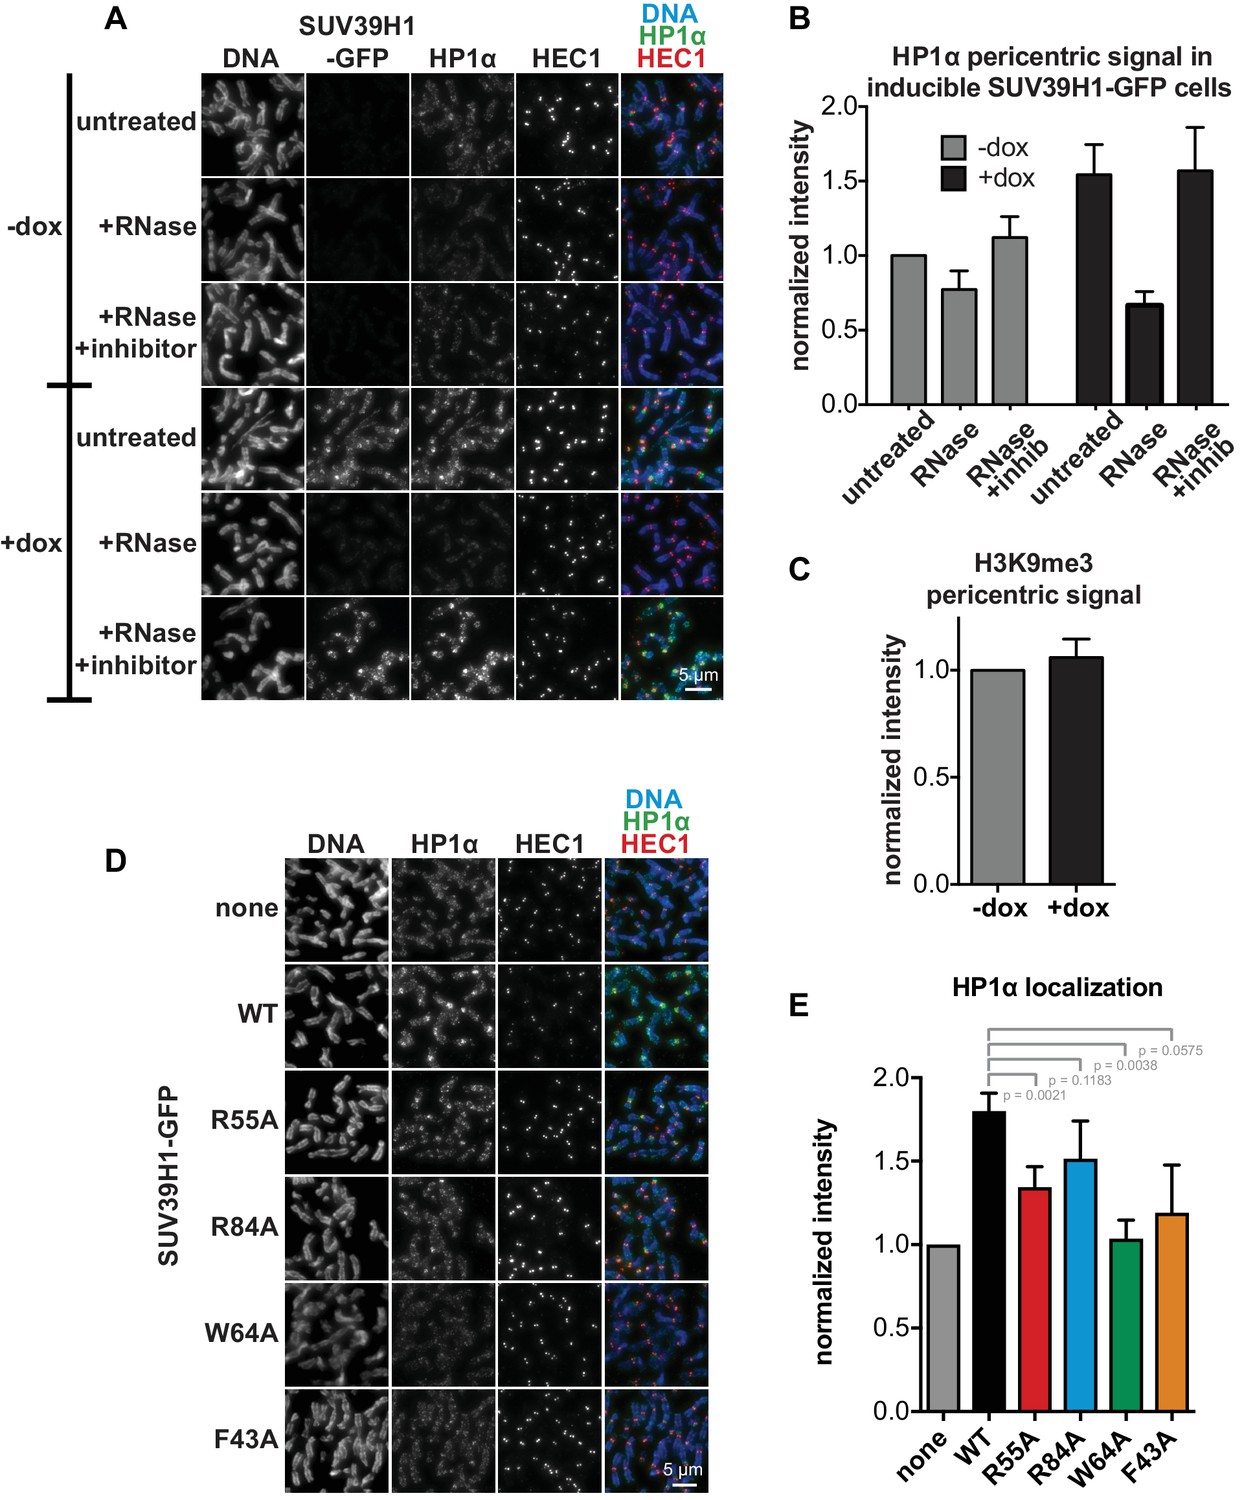
HP1α localization correlates with SUV39H1 localization, despite no change in H3K9me3 levels.
(A) Representative images of HP1α and SUV39H1-GFP localization on HeLa mitotic chromosomes after RNase treatment. Expression of SUV39H1-GFP was induced or not for 6 hr (+/- dox), then mitotic cells were spun onto coverslips and incubated without RNase, with RNase A, or with RNase A plus RNase inhibitors. Cells were then stained for DNA (blue), with an anti-GFP antibody to detect SUV39H1-GFP, HP1α (green), and HEC1 to mark centromeres (red). (B) Quantification of HP1α at pericentric regions from experiment shown in A. Each experiment was normalized to the untreated -dox measurement. Bars are the average of n = 5 separate experiments, 15 cells quantified per condition per experiment, error bars represent standard error. (C) Quantification of H3K9me3 at pericentric regions in HeLa cells with or without exogenous expression of SUV39H1-GFP for 6 hr (+/- dox). Bars are the average of n = 3 separate experiments, 15 cells quantified per condition per experiment, error bars represent standard error. (D) HP1α localization is reduced in cells expressing mutant SUV39H1-GFP compared to cells expressing WT SUV39H1-GFP. Expression of SUV39H1-GFP, WT or mutants, was induced or not for 6 hr (-/+ dox) in HeLa Flp in TREx cell lines. Mitotic cells were spun onto coverslips and stained for DNA (blue), HP1α (green), and HEC1 to mark centromeres (red). (E) Quantification of HP1α at pericentric regions from experiment shown in D. Each experiment was normalized to the wildtype measurement. Bars are the average of n = 5 separate experiments, 15 cells quantified per condition per experiment, error bars represent standard error. P values were calculated with paired, two-tailed t tests.
Figure 7 with 1 supplement
SUV39H1 depends on direct nucleic acid binding for its stable association with chromatin in interphase cells.
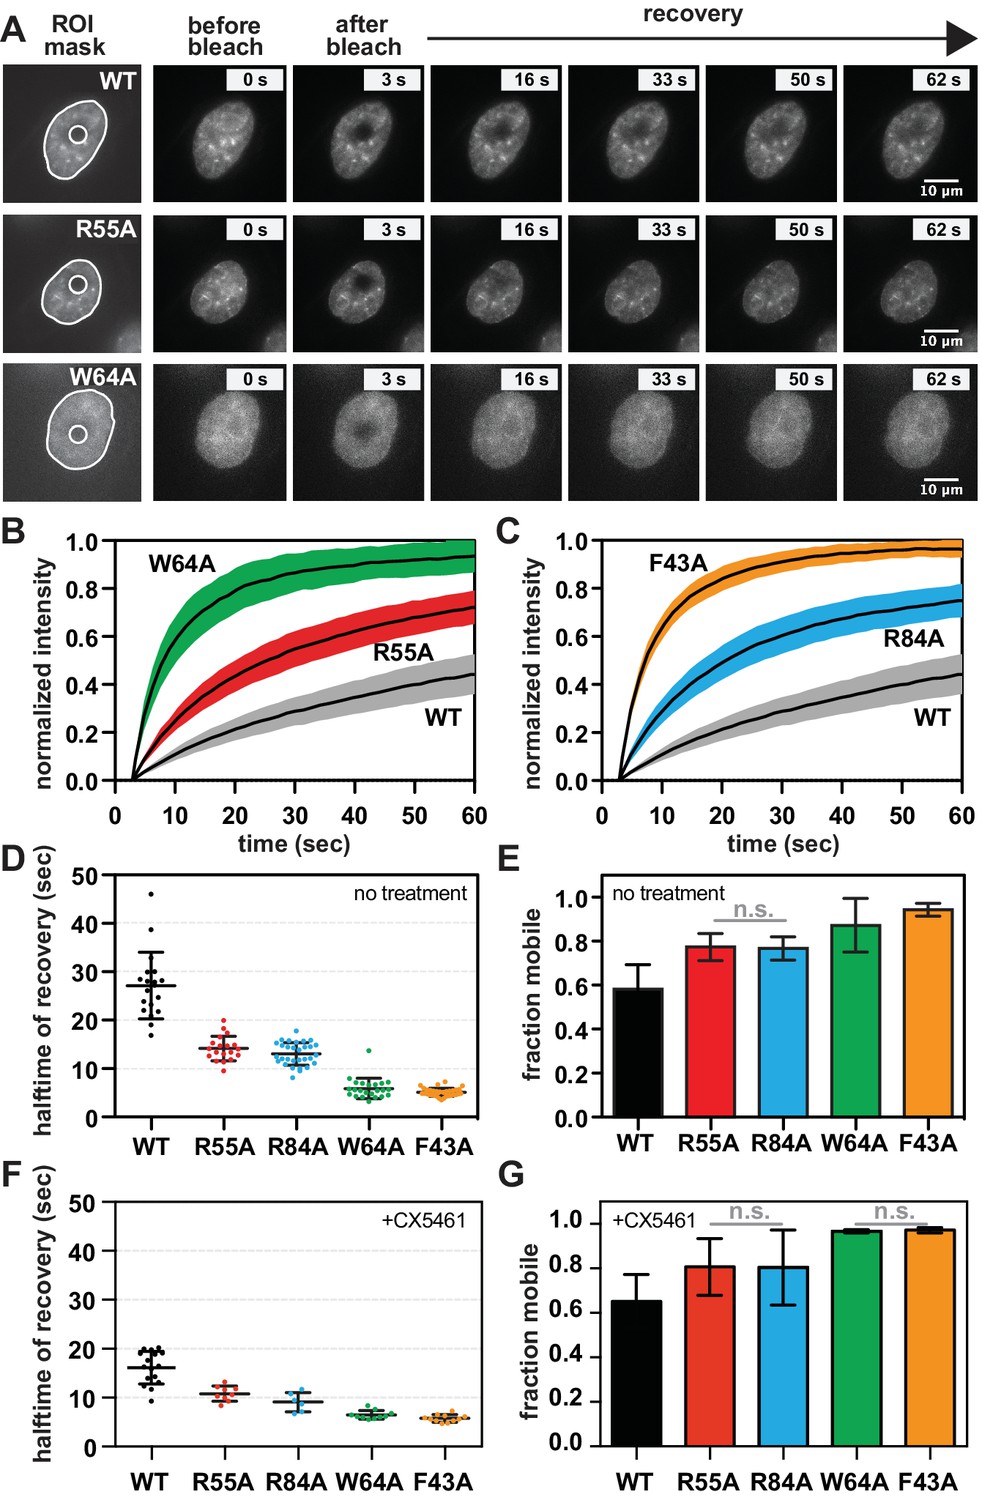
(A) Fluorescence recovery after photobleaching (FRAP) assay to measure SUV39H1-GFP association with chromatin. Montage of images of representative cells expressing either WT or mutant SUV39H1-GFP, as indicated, in our FRAP assay. Leftmost panel shows the ROIs used for quantification and analysis, with the innermost circle representing the diameter of the photobleached area. (B, C) Quantification of SUV39H1-GFP recovery after photobleaching. The fluorescence intensity of the bleached area was normalized relative to the whole nucleus, and plotted as a function of time for WT (gray, n = 19), R55A (red, n = 19), W64A (green, n = 23), R84A (blue, n = 23) and F43A (orange, n = 35) mutants. Black lines are the average between individual traces and colored shading represents standard deviation. WT curves are shown in both panels for clarity. (D) Half-time to recovery measurements from SUV39H1-GFP FRAP traces. Individual traces (averages shown in 7B and 7C) were fit to a single exponential, and the half-time to recovery for each curve was plotted for WT and mutant SUV39H1-GFP cells. (E) Quantification of the mobile fraction of SUV39H1-GFP. Bar graph of the mean amplitude of the curves from 7B and 7C. Error bars represent standard deviation. The differences between mobile fractions are statistically significant (p<0.01), except between R55A and R84A. (F) Half-time to recovery measurements from SUV39H1-GFP FRAP traces, in the presence of the RNA Pol I inhibitor CX5461. Individual traces were fit to a single exponential, and the half-time to recovery for each curve was plotted for WT and mutant SUV39H1-GFP cells. (G) Quantification of the mobile fraction of SUV39H1-GFP, in the presence of the RNA Pol I inhibitor CX5461. Bar graph of the mean amplitude of recovery curves. Error bars represent standard deviation. See also Figure 7—figure supplement 1.
Figure 7—figure supplement 1
Effect of transcription inhibition on SUV39H1 fluorescence recovery, and model for RNA-dependent retention of SUV39H1 at heterochromatin.
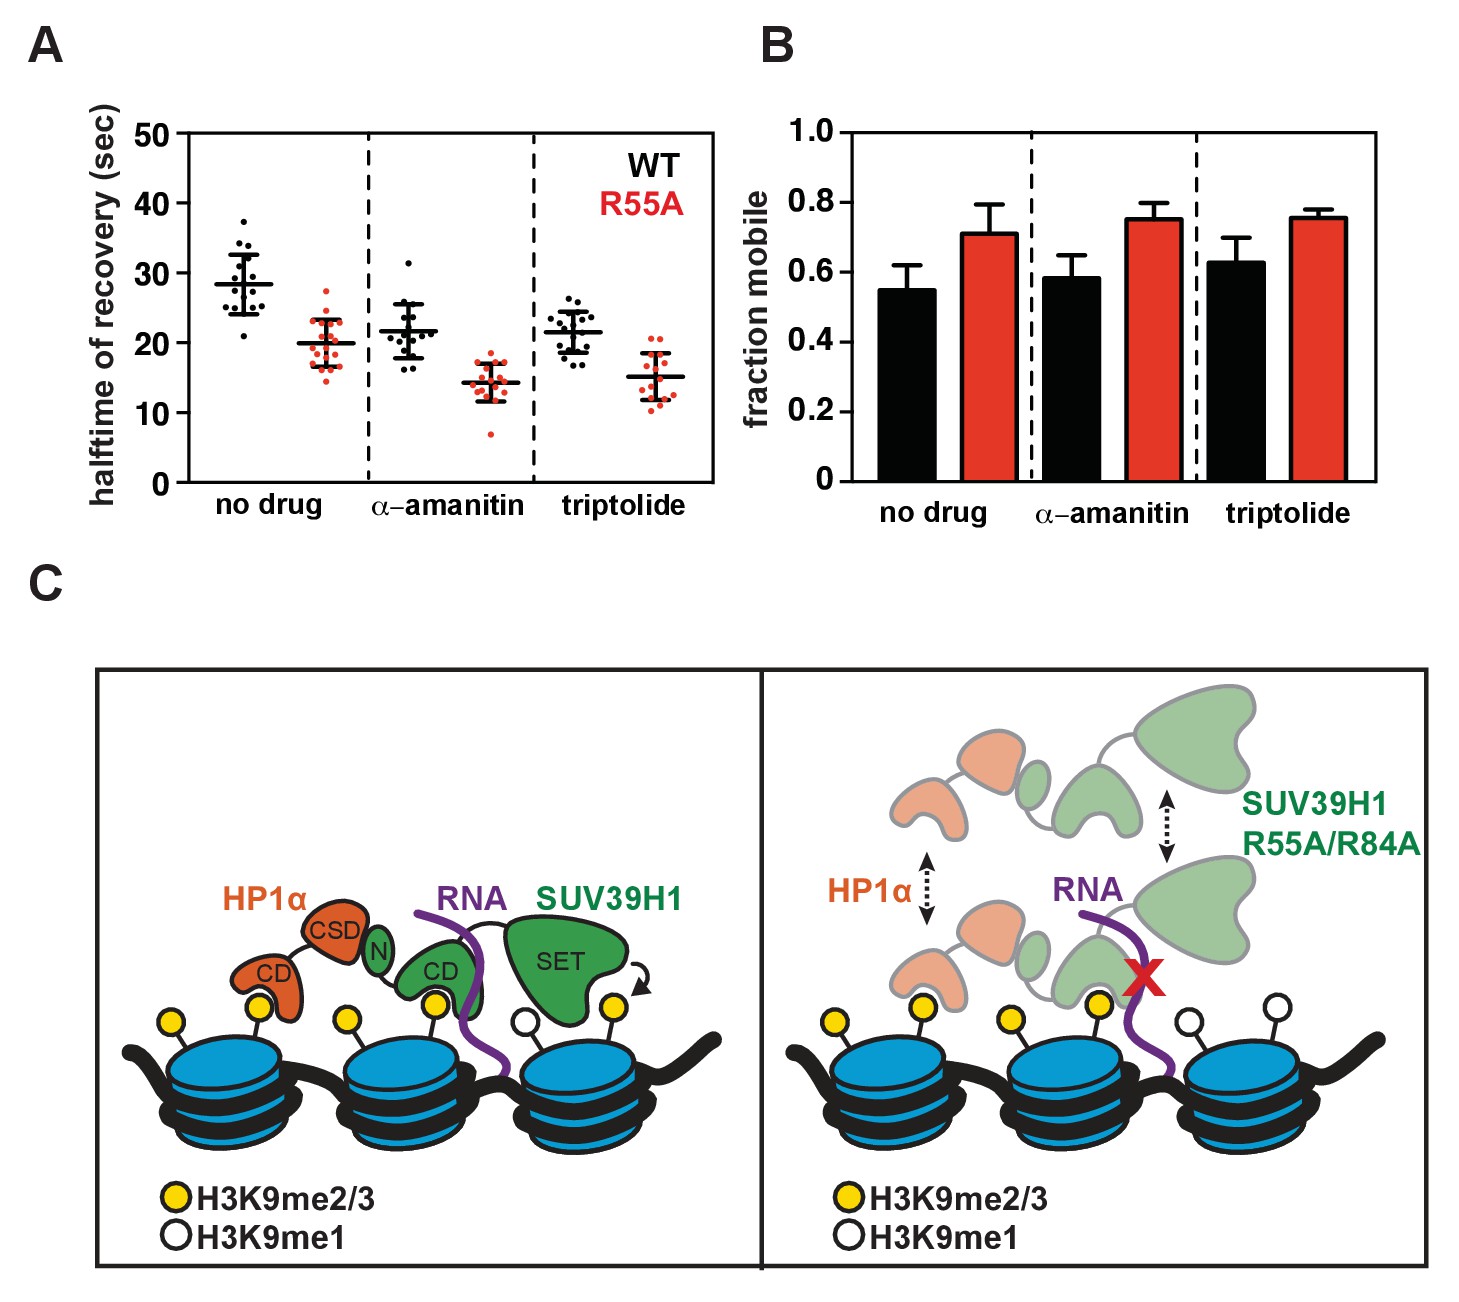
(A) Half-time to recovery measurements from SUV39H1-GFP FRAP traces, in the presence of two different RNA Pol II inhibitors, α-amanitin and triptolide. Individual traces were fit to a single exponential, and the half-time to recovery for each curve was plotted for WT and mutant SUV39H1-GFP cells. (B) Quantification of the mobile fraction of SUV39H1-GFP, in the presence of two different RNA Pol II inhibitors, α-amanitin and triptolide. Bar graph of the mean amplitude of recovery curves. Error bars represent standard deviation. (C) Model for RNA-dependent localization of SUV39H1. Left: WT SUV39H1 binds both H3K9me3 and RNA through via its chromodomain (CD), and these interactions properly localize SUV39H1 to heterochromatin. The SET domain of SUV39H1 (SET) methylates H3K9, and the N-terminus of SUV39H1 (N) helps to recruit HP1α via its chromoshadow domain (CSD). Right: When the interaction between SUV39H1 and RNA is disrupted, either by RNase or by the RNA binding mutants SUV39H1R55A or SUV39H1R84A, the association of SUV39H1 with heterochromatin is weakened. Although SUV39H1 can still bind H3K9me2/3, SUV39H1’s interaction with chromatin is more unstable and dynamic, and the levels of both SUV39H1 and HP1α bound to heterochromatin are reduced.
Figure 8
Nucleic acid binding and H3K9me3 binding both contribute to SUV39H1-mediated constitutive heterochromatin silencing.
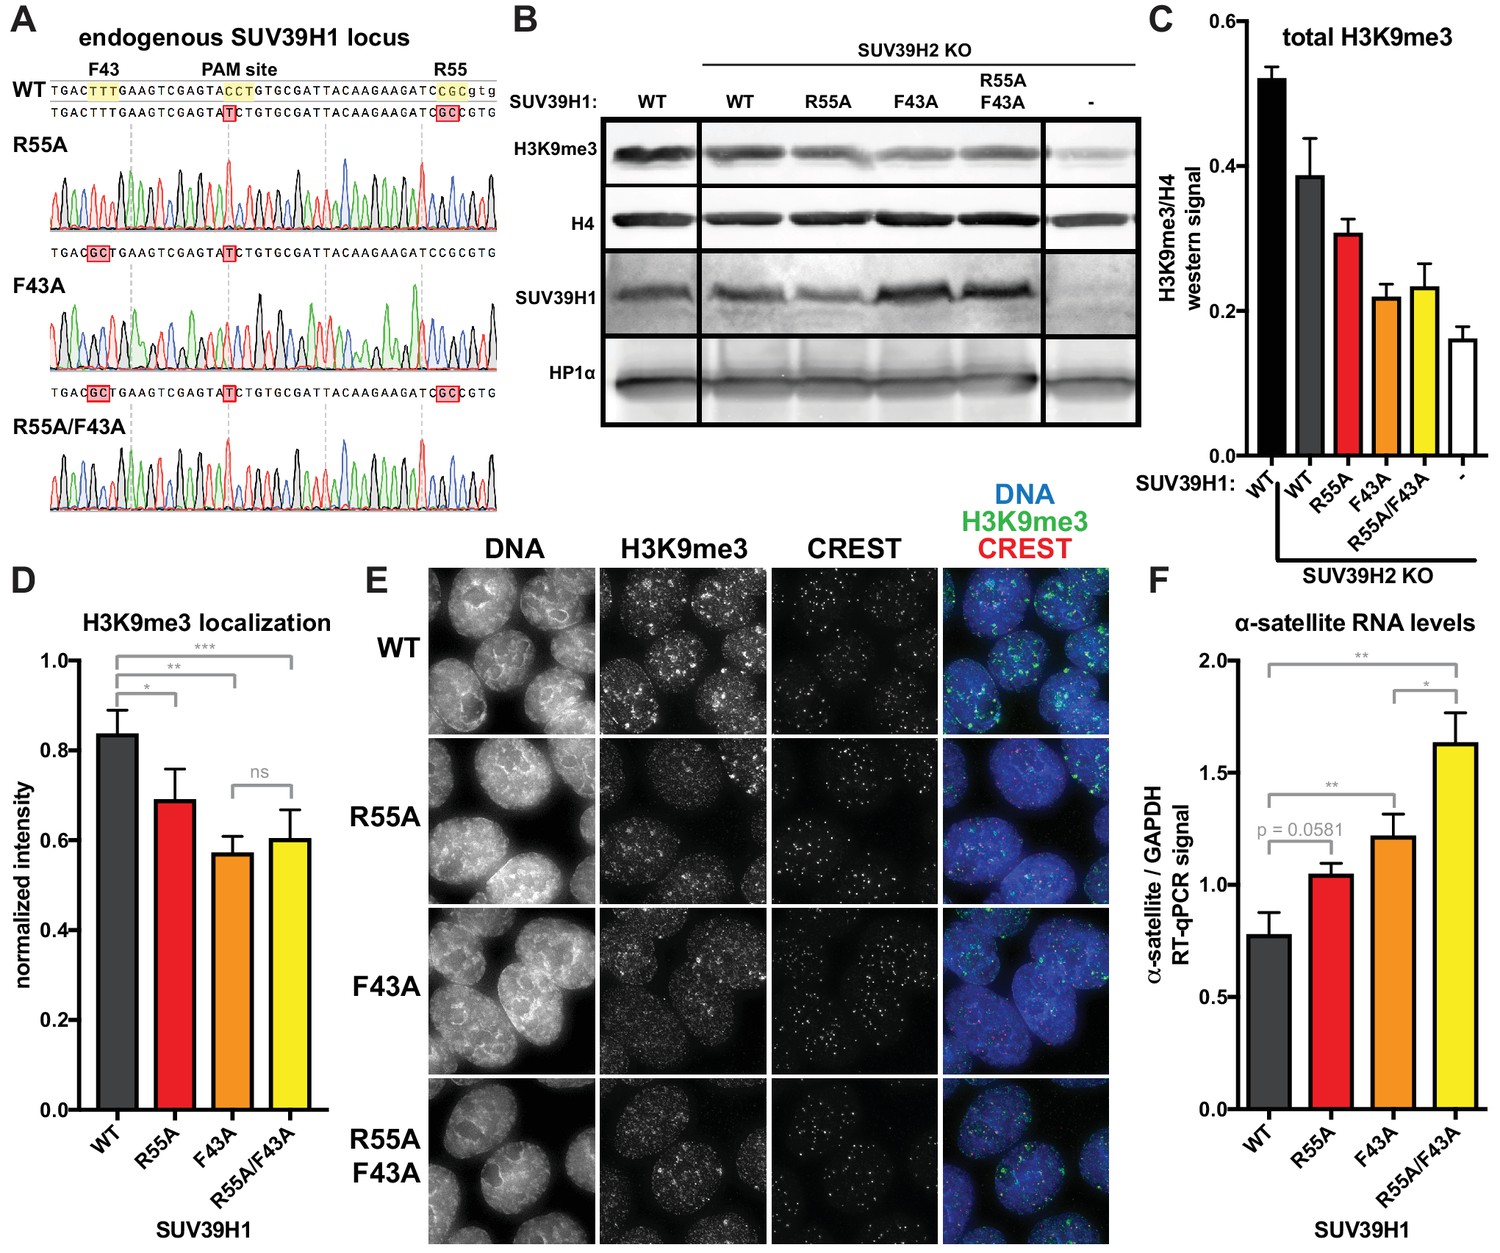
(A) Sanger DNA sequencing traces showing point mutations in the endogenous SUV39H1 locus in DLD-1 cells, generated by CRISPR/Cas9 gene editing. (B) Representative western blot showing H3K9me3, histone H4, SUV39H1, and HP1α levels in normal unedited DLD-1 cells (far left), or SUV39H2 KO DLD-1 cells with the indicated mutations in SUV39H1. (C) Total H3K9me3 levels in mutant SUV39 DLD-1 cells, measured by quantitative western blot. Nuclear lysate was prepared and blotted with indicated antibodies, and H3K9me3 signal was normalized to histone H4 levels. Graphed are the means of 3 repeats, errors bars represent standard error. (D) Quantification of H3K9me3 localization at centromeres in mutant SUV39 DLD-1 cells. Cells were grown on coverslips, fixed and permeabilized, then stained with the indicated antibodies, imaged, and quantified using centromere finder software, using CREST staining as a centromere marker. Graphed are the means of 4 repeats, error bars represent standard error. Significance was determined using paired, two-tailed t-tests. *p<0.05, **p<0.005, ***p<0.0005. (E) Representative images of immunofluorescence staining of mutant SUV39 DLD-1 cells, used for quantification shown in 8D. Cells are stained for DNA (blue), H3K9me3 (green), and CREST centromere stain (red). (F) Quantification of α-satellite RNA in mutant SUV39 DLD-1 cells by RT-qPCR. Total α-satellite RNA levels are normalized to GAPDH RNA levels. Graphed are the means of 3 repeats, error bars represent standard error. Significance was determined using paired, two-tailed t-tests. *p<0.05, **p<0.005.
Download links
A two-part list of links to download the article, or parts of the article, in various formats.
Downloads (link to download the article as PDF)
Open citations (links to open the citations from this article in various online reference manager services)
Cite this article (links to download the citations from this article in formats compatible with various reference manager tools)
RNA-dependent stabilization of SUV39H1 at constitutive heterochromatin
eLife 6:e25299.
https://doi.org/10.7554/eLife.25299


