Replication Study: Inhibition of BET recruitment to chromatin as an effective treatment for MLL-fusion leukaemia
- University of Pennsylvania, Perelman School of Medicine, Stem Cell and Xenograft Core, United States
- ProNovus Bioscience, LLC, United States
Figures
Figure 1 with 2 supplements
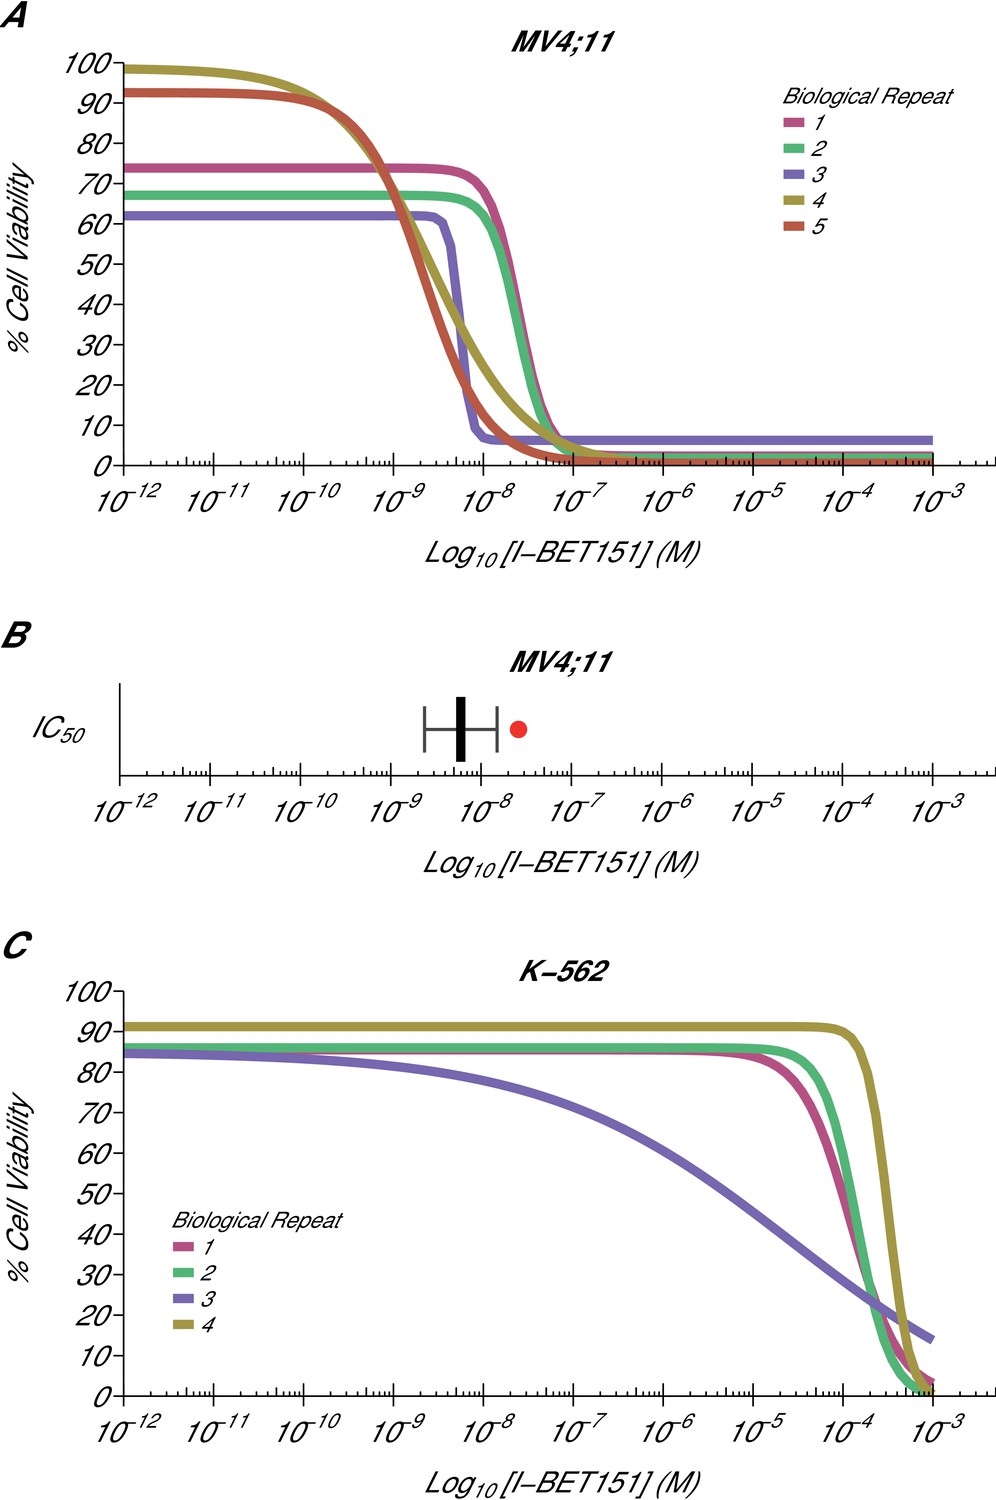
Cellular I-BET151 dose response curves in MLL-fusion leukaemia and non-MLL-fusion leukaemia cell lines.
Cell viability assays were performed for a MLL-fusion leukaemia cell line (MV4;11) and a non-MLL-fusion leukaemia cell line (K-562) with the I-BET151 inhibitor. Curves and absolute IC50 values were determined for each biological repeat. (A) Dose response curves for each biological repeat [n = 5] for the MV4;11 cell line. Percent cell viability is relative to DMSO treated cells. I-BET151 doses range from 1 pM to 1 mM. Exploratory one-sample t-test of IC50 values compared to a constant of 100 µM; t(4) = 20.63, p=3.26×10⁻⁵; Cohen’s d = 9.23, 95% CI [3.13, 15.45]. (B) The mean absolute IC50 value for MV4;11 cells and 95% confidence interval [n = 5] for this replication attempt is plotted with the IC50 value reported in Dawson et al. (2011) displayed as a single point (red circle) for comparison. (C) Dose response curves for each biological repeat [n = 4] for the K-562 cell line. Percent cell viability is relative to DMSO treated cells with I-BET151 dose range from 1 pM to 1 mM. The IC50 estimates were not able to be accurately determined following published guidelines (Sebaugh, 2011). Additional details for this experiment can be found at https://osf.io/zm3j4/.
Figure 1—figure supplement 1

Cellular I-BET151 dose response curves for each MV4;11 biological repeat.
This is the same experiment as in Figure 1. The dose response curve of each biological repeat for the MV4;11 cell line plotted individually with the absolute IC50 value listed. Additional details for this experiment can be found at https://osf.io/zm3j4/.
Figure 1—figure supplement 2
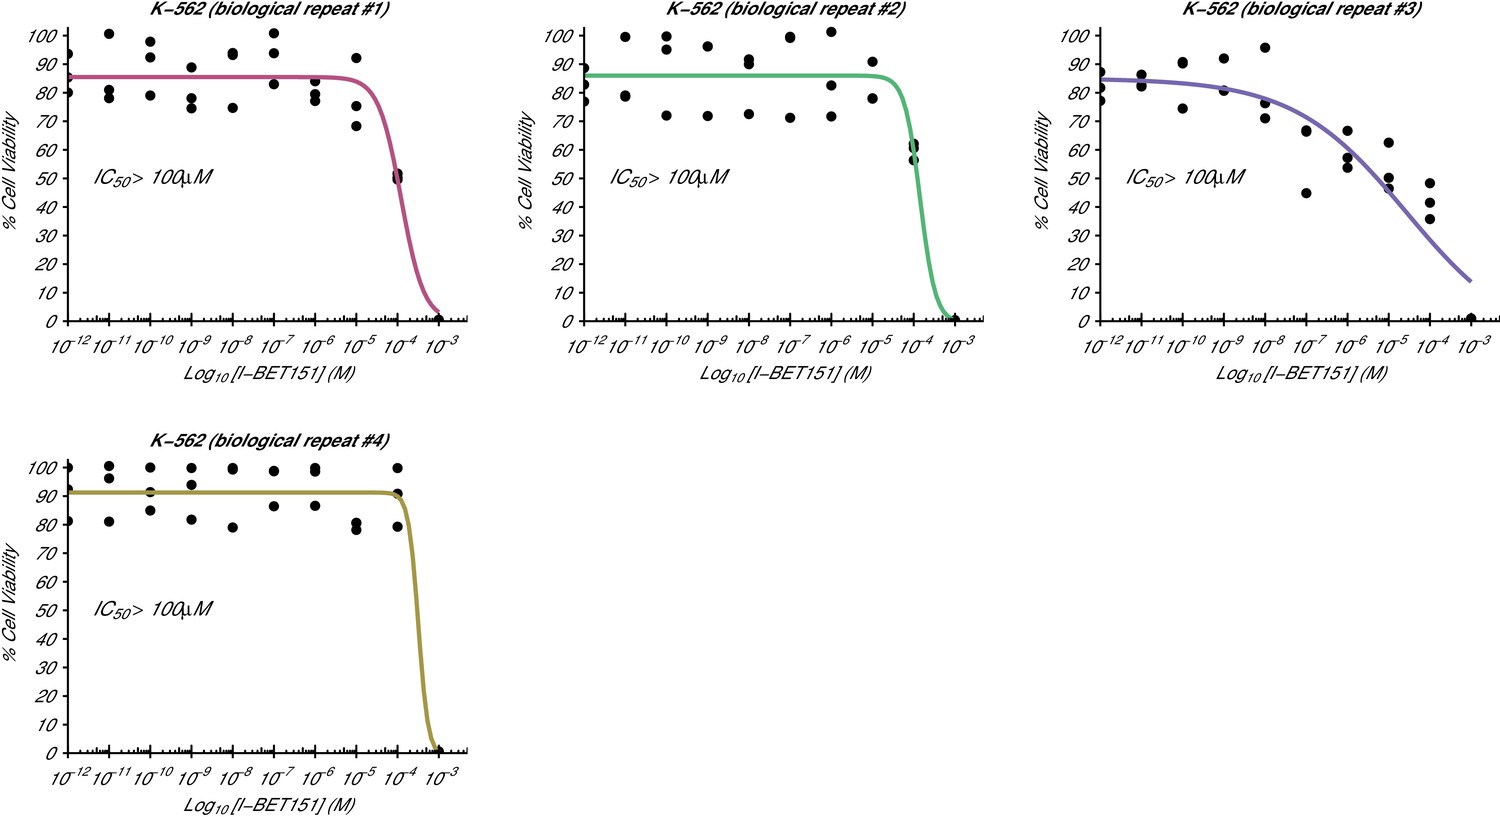
Cellular I-BET151 dose response curves for each K-562 biological repeat.
This is the same experiment as in Figure 1. The dose response curve of each biological repeat for the K-562 cell line plotted individually. The IC50 estimates were not able to be accurately determined following published guidelines (Sebaugh, 2011), and are listed as greater than 100 µM, which is the highest dose before inhibition started to be observed. Additional details for this experiment can be found at https://osf.io/zm3j4/.
Figure 2
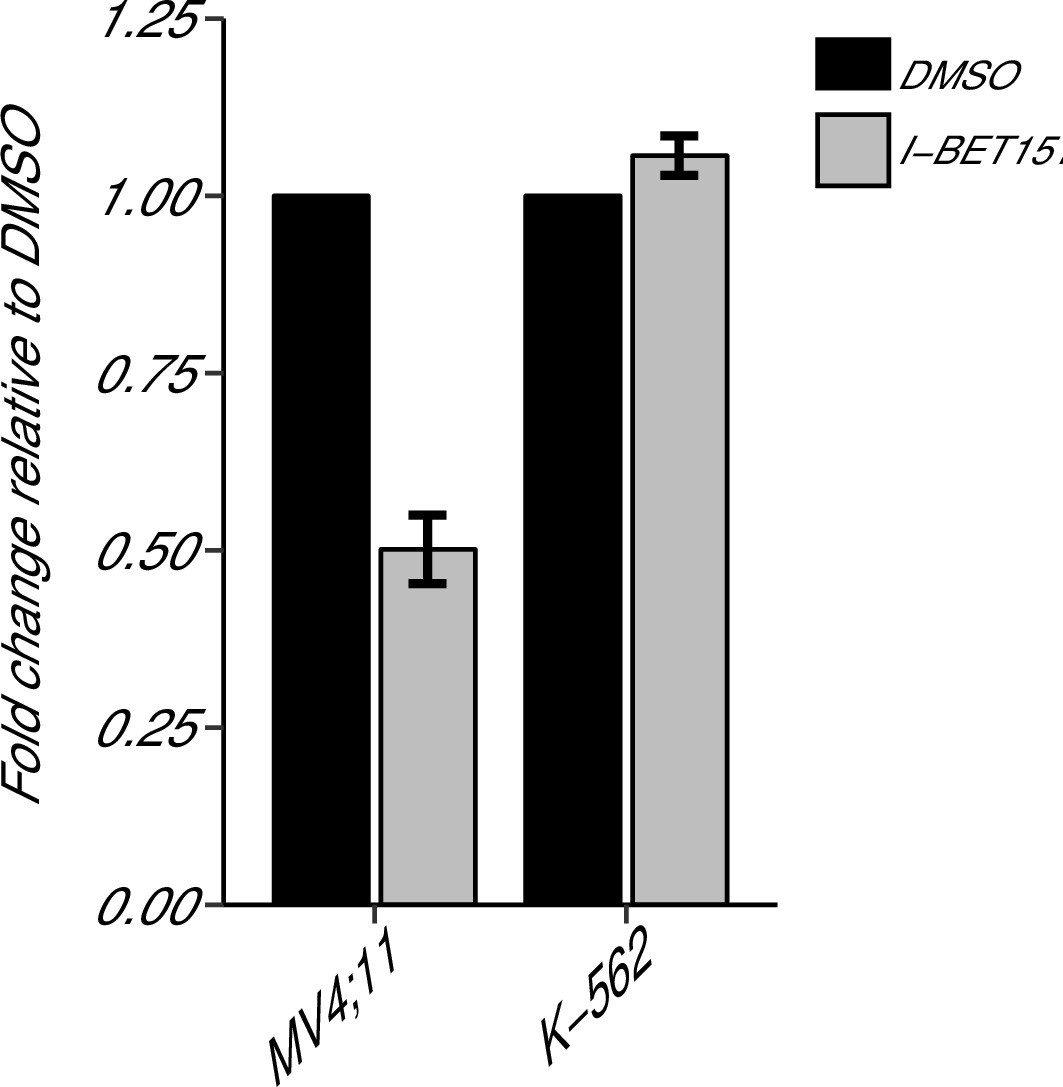
BCL2 expression in I-BET151 treated MV4;11 and K-562 cells.
MV4;11 and K-562 cells were treated with 500 nM I-BET151, or an equivalent volume of DMSO. Total RNA was isolated 6 hr after treatment and qRT-PCR was used to detect BCL2 and B2M expression. Fold change in BCL2 expression normalized to B2M and relative to DMSO is presented for I-BET151 treated MV4;11 and K-562 cells. Expression level of BCL2 in DMSO was assigned a value of 1. Means reported and error bars represent SD from three independent biological repeats. Two-sample t-test comparing fold gene expression values from MV4;11 cells to K-562 cells; t(4) = 17.23, uncorrected p=6.66×10⁻⁵, a priori Bonferroni adjusted significance threshold = 0.0167; (Bonferroni corrected p=0.0004). One-sample t-test comparing fold gene expression from K-562 cells to a constant of 1 (DMSO treated cells); t(2) = 3.53, uncorrected p=0.0719, a priori Bonferroni adjusted significance threshold = 0.0167; (Bonferroni corrected p=0.216). One-sample t-test comparing fold gene expression from MV4;11 cells to a constant of 1 (DMSO treated cells); t(2) = 17.86, uncorrected p=0.003, a priori Bonferroni adjusted significance threshold = 0.0167; (Bonferroni corrected p=0.009). Additional details for this experiment can be found at https://osf.io/np6gq/.
Figure 3 with 1 supplement

Maximal tolerated dose in an I-BET151 treated xenograft mouse model of MLL-fusion leukaemia.
Female NOD-SCID mice were conditioned with Busulfan and intravenously injected with 1 × 10⁷ MV4;11 cells in vehicle (PBS). Once disease was established (detectable MV4;11 cells from retro-orbital bleeds), mice were randomized into four cohorts and received daily IP injections of vehicle control [n = 5], 10 mg/kg I-BET151 [n = 5], 20 mg/kg I-BET151 [n = 5], or 30 mg/kg I-BET151 [n = 5]. The animals were monitored and their weight was measured for the duration of the 21 day treatment. The Y axis represents mouse weight in grams, the X axis represents days since the start of treatment. Additional information can be found at https://osf.io/juzmg/.
Figure 3—figure supplement 1

Maximal tolerated dose in an I-BET151 treated xenograft mouse model of MLL-fusion leukaemia.
This is the same experiment as in Figure 3. Female NOD-SCID mice xenotransplanted with MV4;11 cells were randomly assigned to receive daily IP injections of treatment. At the time of sacrifice, disease burden was evaluated in peripheral blood (PB), bone marrow (BM), and spleen cells. Number of mice analyzed: n = 5 for vehicle group, n = 5 for I-BET151 10 mg/kg group, n = 5 for I-BET151 20 mg/kg, and n = 5 for I-BET151 30 mg/kg. (A) Dot plot representing the percent of MV4;11 as the percent of HLA-A,B,C+ cells determined by flow cytometry analyses of the total cell population. Medians reported as crossbars. (B) Dot plot representing the absolute number of MV4;11 cells as determined using CountBright absolute counting beads. Medians reported as crossbars. Additional details for this experiment can be found at https://osf.io/juzmg/.
Figure 4 with 3 supplements
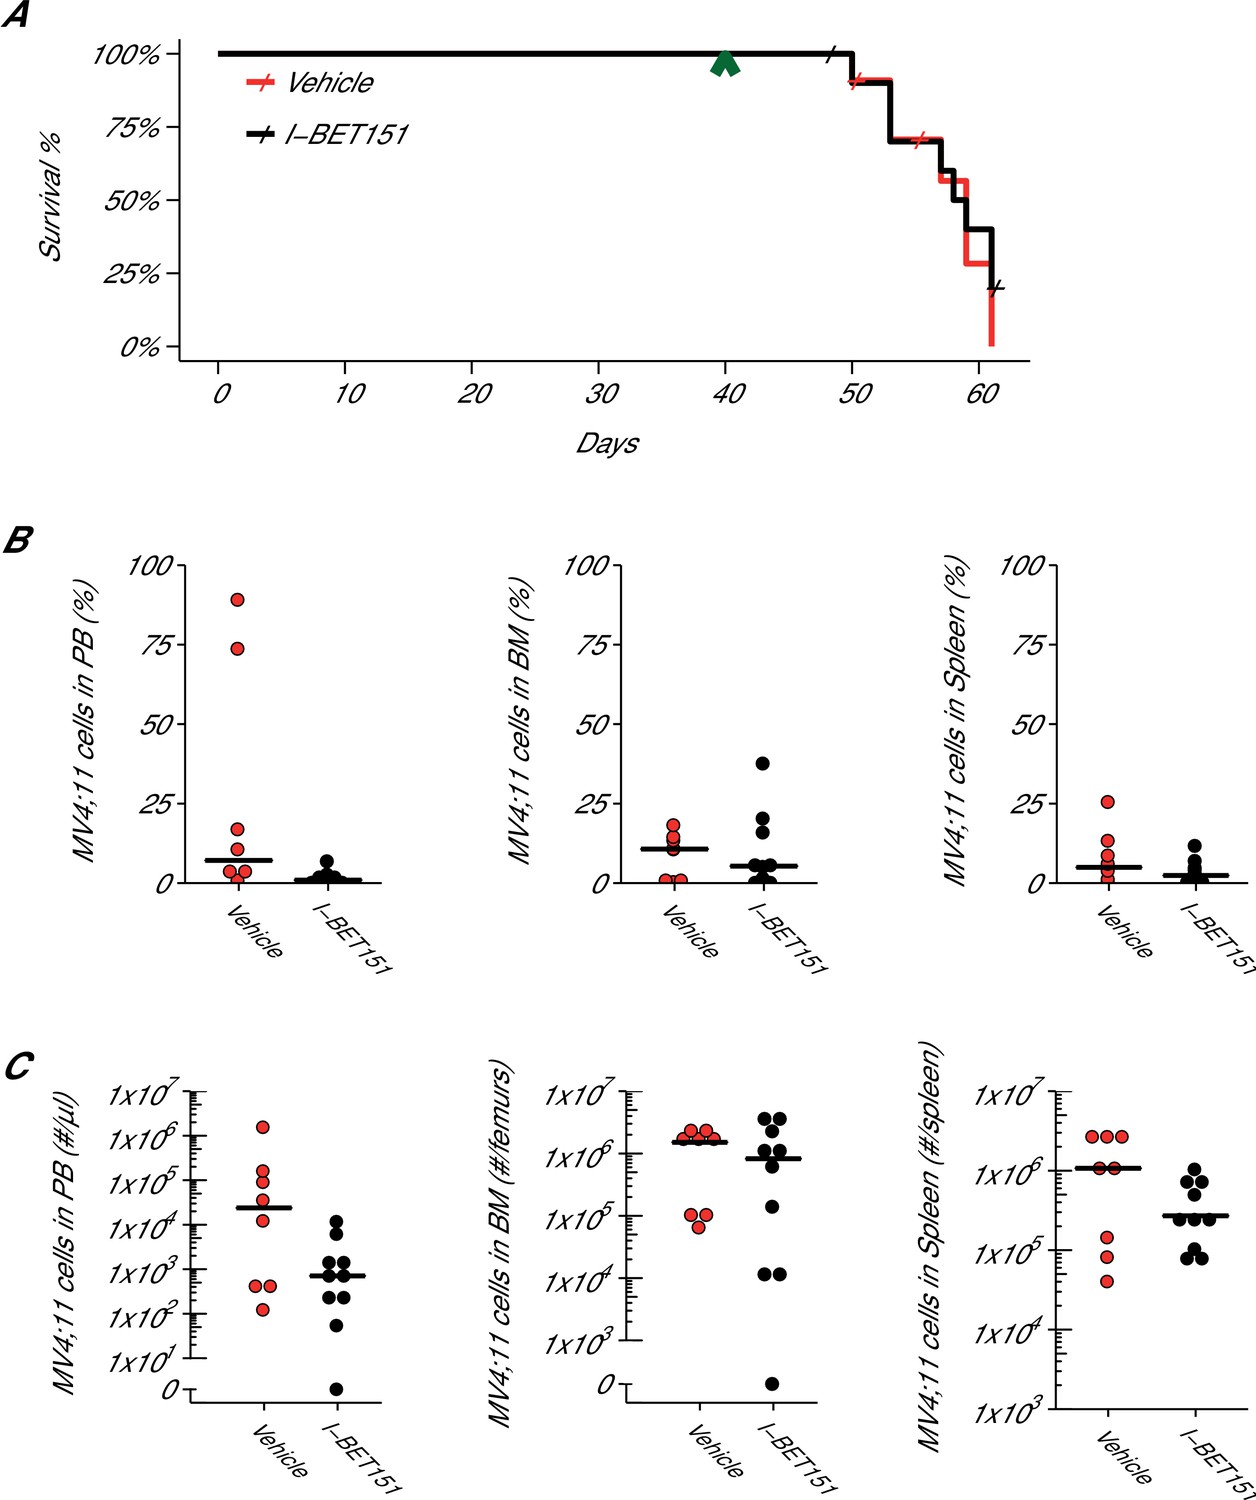
Efficacy study of I-BET151 in xenograft mouse model of MLL-fusion leukaemia.
Female NOD-SCID mice were xenotransplanted with 1 × 10⁷ MV4;11 cells after conditioning with Busulfan. Following establishment of disease (detectable MV4;11 cells from retro-orbital bleeds), mice were randomly assigned to receive daily IP injections of 20 mg/kg I-BET151 or vehicle control. (A) Kaplan-Meier plot of survival during the course of the study. Green arrowhead indicates when treatment commenced on day 40 with treatment continuing for the pre-specified period of 21 days. Animals with no detectable disease at the time of sacrifice (less than 0.5% of MV4;11 cells) or that were unable to be evaluated at the time of death were censored (denoted by a cross). Number of mice monitored: n = 11 for vehicle group and n = 12 for I-BET151 group. Log-rank (Mantel-Cox) test of I-BET151 treatment compared to vehicle control (p=0.536). (B–C) At the time of sacrifice, disease burden was evaluated in peripheral blood (PB), bone marrow (BM), and spleen cells. Number of mice analyzed: n = 8 for vehicle group and n = 10 for I-BET151 group. (B) The percent of MV4;11 cells was determined by flow cytometric analysis as the percent of HLA-A,B,C+ cells in the total nucleated population (both mouse and human cells). Dot plot with medians reported as crossbars. (C) The absolute number of MV4;11 cells each sample was also determined using CountBright absolute counting beads. Dot plot with medians reported as crossbars. Additional details for this experiment can be found at https://osf.io/jakpw/.
Figure 4—figure supplement 1
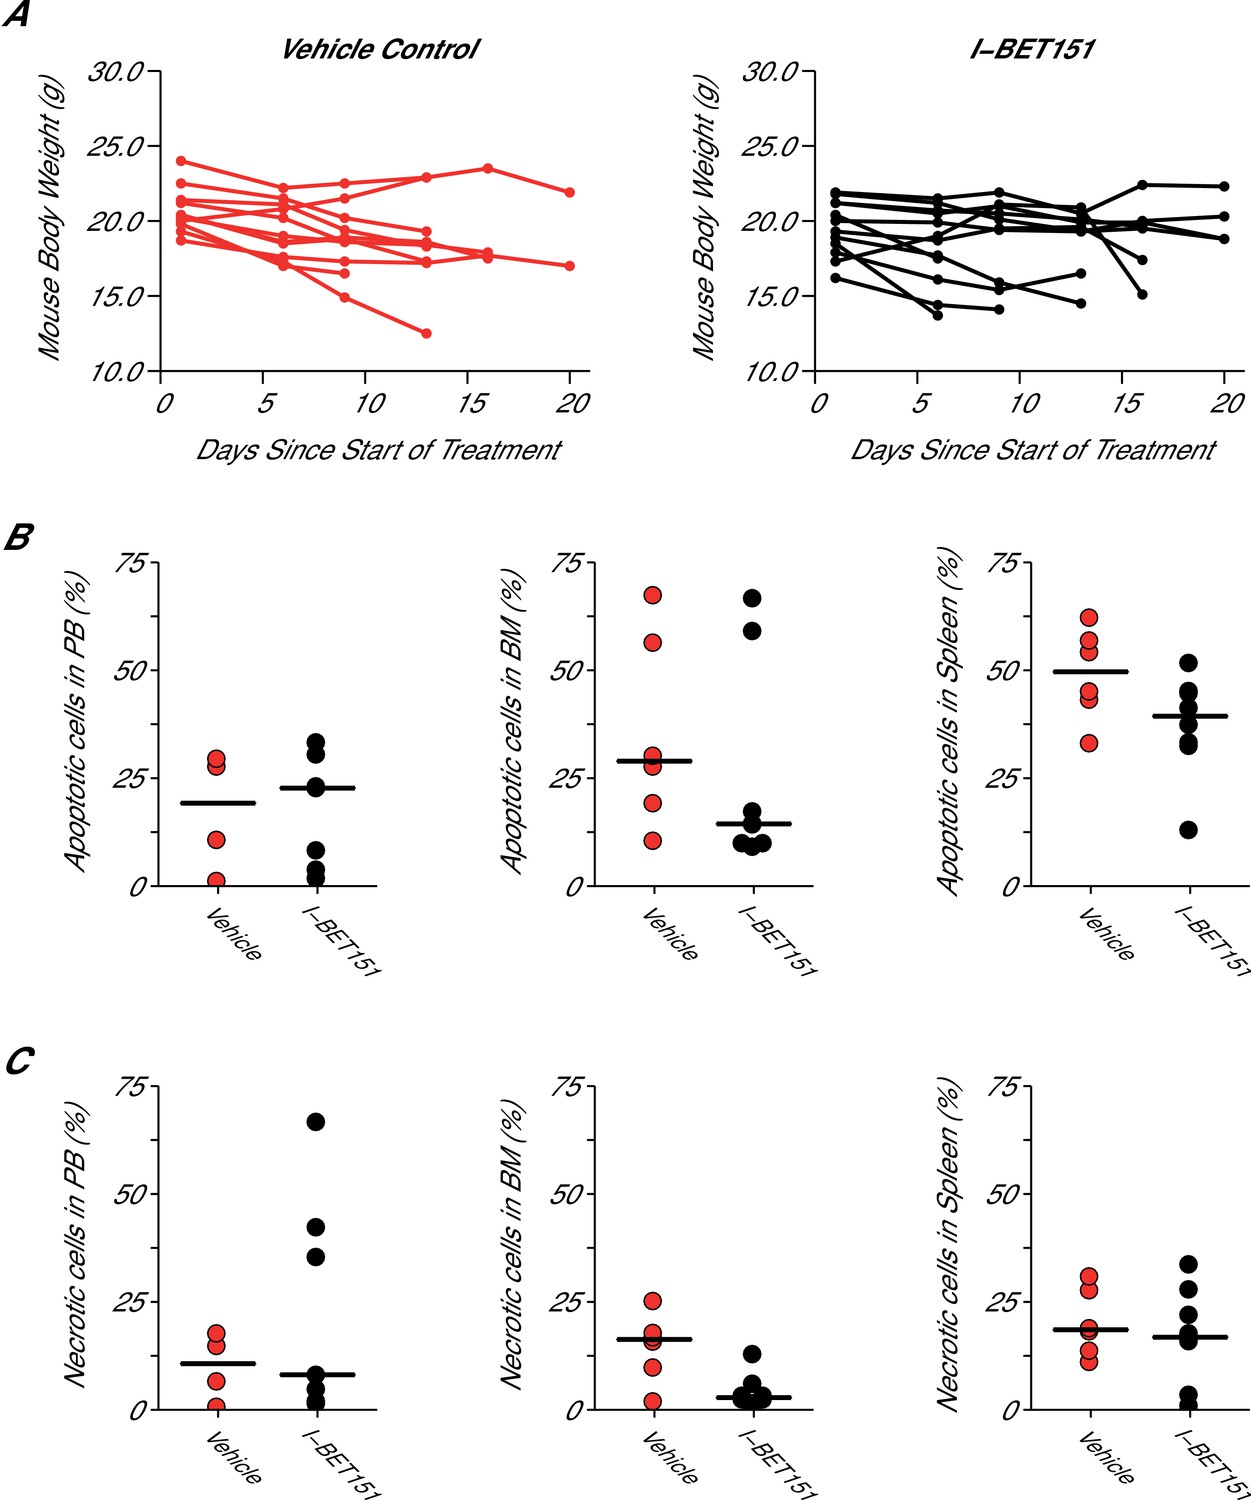
Mouse body weight and cell death analysis in I-BET151 treated xenograft mouse model of MLL-fusion leukaemia.
This is the same experiment as in Figure 4. Female NOD-SCID mice xenotransplanted with MV4;11 cells were randomly assigned to receive daily IP injections of 20 mg/kg I-BET151 or vehicle control after detection of disease. (A) During the course of treatment animals were monitored and their weight was measured twice a week over the 21 day treatment period. Number of mice monitored: n = 11 for vehicle group and n = 12 for I-BET151 group. (B–C) At the time of sacrifice, cell death (apoptotic and necrotic cells) was evaluated in peripheral blood (PB), bone marrow (BM), and spleen cells. Number of mice analyzed: PB: n = 4 for vehicle group and n = 7 for I-BET151 group; BM: n = 6 for vehicle group and n = 8 for I-BET151 group; Spleen: n = 6 for vehicle group and n = 8 for I-BET151 group. (B) The percent of MV4;11 cells that were apoptotic was determined by flow cytometric analysis as the percent of Annexin V+PI- cells in the HLA-A,B,C+ population. Dot plot with medians reported as crossbars. (C) The percent of MV4;11 cells that were necrotic was determined by flow cytometric analysis as the percent of Annexin V+PI+ cells in the HLA-A,B,C+ population. Dot plot with medians reported as crossbars. Additional details for this experiment can be found at https://osf.io/jakpw/.
Figure 4—figure supplement 2

Detection of HLA by immunohistochemistry in mouse tissues.
This is from the same experiment as in Figure 4. Female NOD-SCID mice xenotransplanted with MV4;11 cells were randomly assigned to receive daily IP injections of 20 mg/kg I-BET151 or vehicle control after detection of disease. Tissues containing observed tumors were fixed, sectioned, and stained with an antibody against human leukocyte antigen (HLA-A,B,C) and counterstained with hematoxylin. (A) Positive control staining of human tonsil tissue that was processed in parallel with other tissue sections (magnification: 400X left, 100X right). Representative images of various tissues from MV4;11 engrafted mice who received vehicle treatment, which include (B) stomach (magnification: 400X left, 100X right), (C) gastrointestinal tract (magnification: 400X left, 100X right), (D) mesentery (magnification: 400X left, 20X right), (E) ovary (magnification: 400X left, 20X right), and (F) peritoneal cavity (magnification: 400X). Mouse tissues (e.g. gastrointestinal mucosa) were negatively stained. Additional details for this experiment can be found at https://osf.io/jakpw/.
Figure 4—figure supplement 3
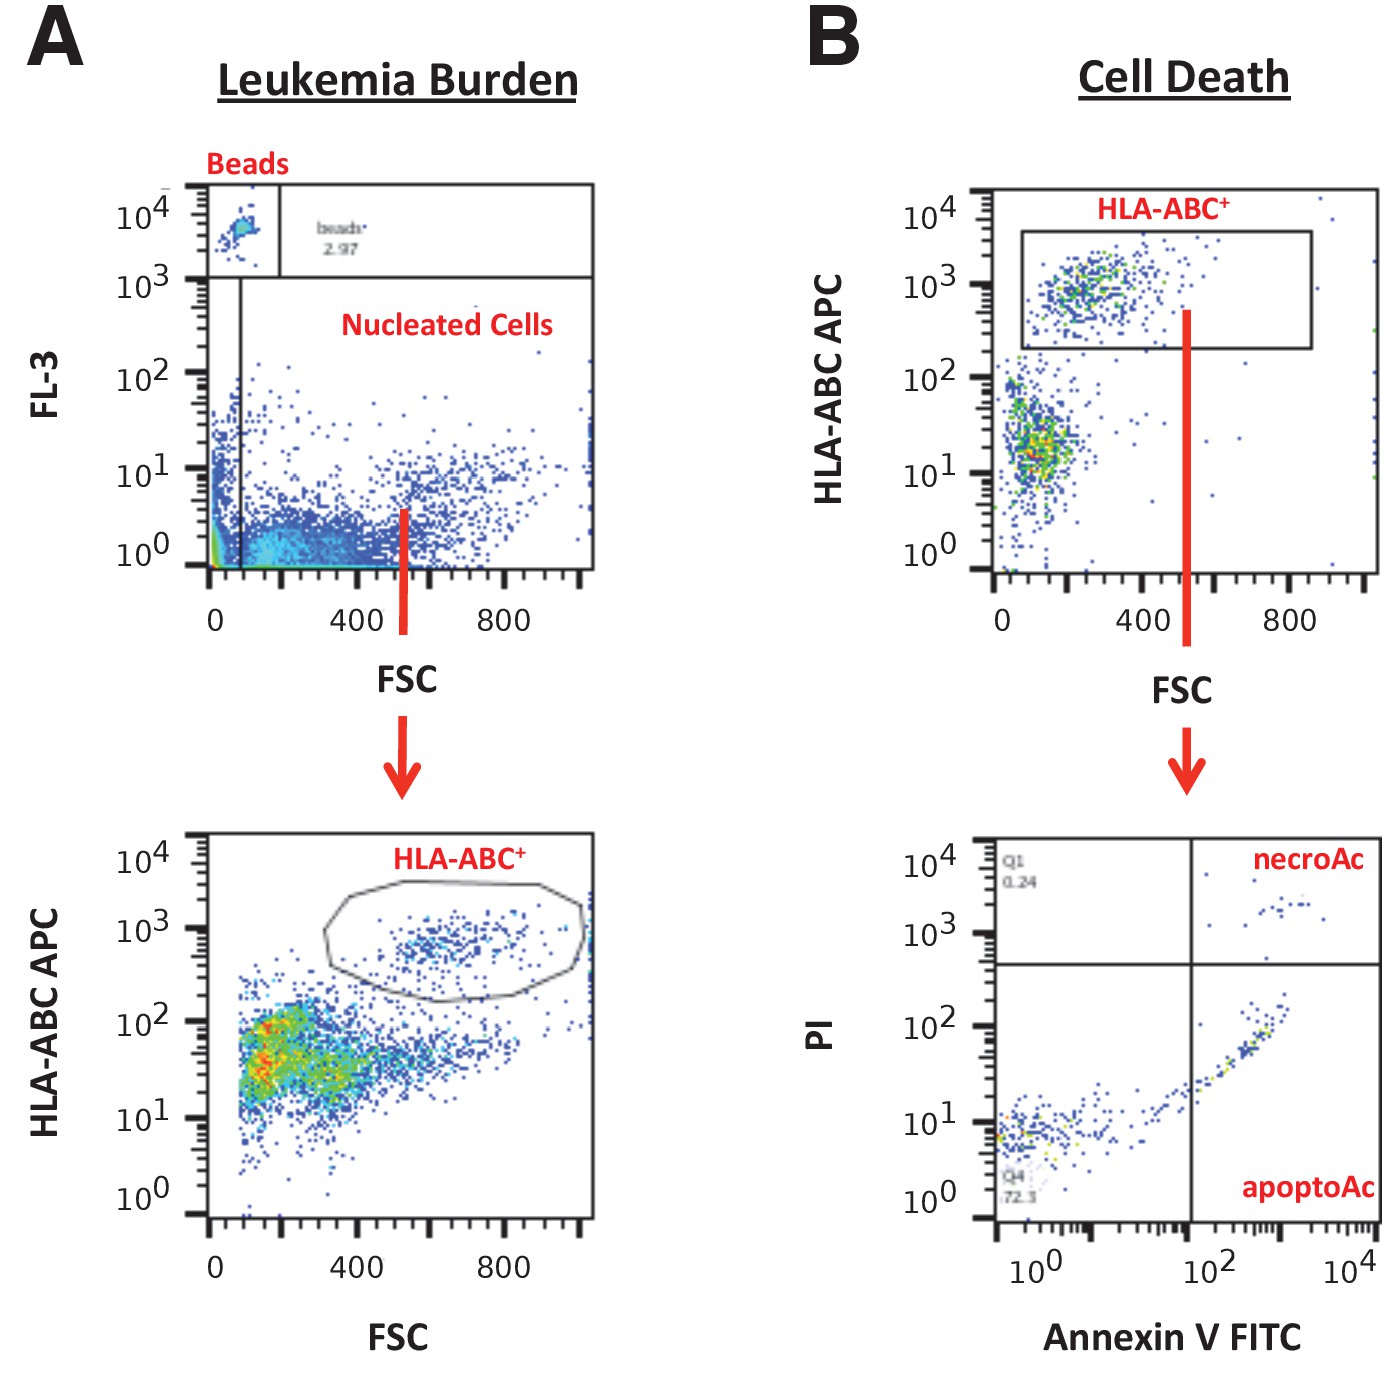
Flow cytometry gating strategies.
(A) Representative images of gating strategy to assess leukaemia burden in peripheral blood, spleen, and bone marrow cells. The FL-3 vs FSC plot was used to gate on CountBright absolute counting beads and total nucleated cells. From the total nucleated population, the HLA-A,B,C APC vs FSC plot was used to gate on HLA-A,B,C+ cells (human leukaemia cells). (B) Representative images of gating strategy to assess cell death in peripheral blood, spleen, and bone marrow cells. The HLA-A,B,C APC vs FSC plot was used to gate on human leukaemia cells. From the human leukaemia cell population, the PI vs Annexin V FITC plot was used to gate on apoptotic cells (Annexin V+PI− population) and necrotic cells (Annexin V+PI+ population).
Figure 5
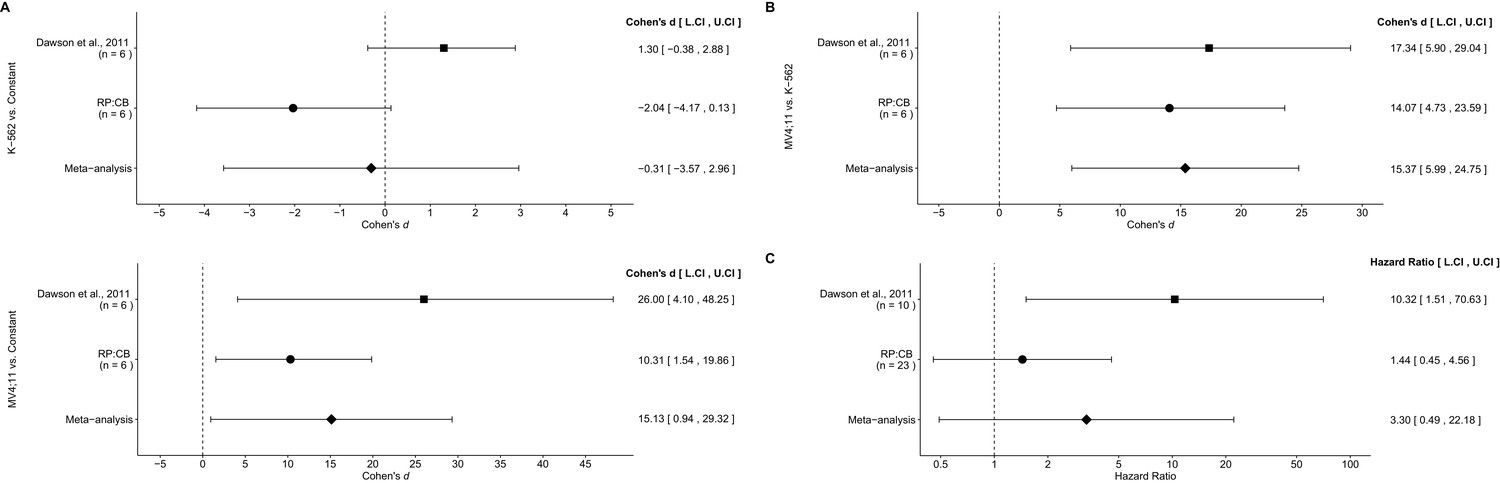
Meta-analyses of each effect.
Effect size and 95% confidence interval are presented for Dawson et al. (2011), this replication study (RP:CB), and a random effects meta-analysis of those two effects. Sample sizes used in Dawson et al. (2011) and this replication attempt are reported under the study name. (A) Fold BCL2 expression in K-562 cells compared to a constant of 1 (DMSO) (meta-analysis p=0.854), and fold BCL2 expression in MV4;11 cells compared to a constant of 1 (DMSO) (meta-analysis p=0.037). (B) Fold BCL2 expression in MV4;11 cells compared to the fold BCL2 expression in K-562 cells (meta-analysis p=0.001). (C) HR for mice treated daily with I-BET151 compared to vehicle control (meta-analysis p=0.220). Additional details for these meta-analyses can be found at https://osf.io/vfp47/.
Download links
A two-part list of links to download the article, or parts of the article, in various formats.
Downloads (link to download the article as PDF)
Open citations (links to open the citations from this article in various online reference manager services)
Cite this article (links to download the citations from this article in formats compatible with various reference manager tools)
Replication Study: Inhibition of BET recruitment to chromatin as an effective treatment for MLL-fusion leukaemia
eLife 6:e25306.
https://doi.org/10.7554/eLife.25306


