The laminar organization of the Drosophila ellipsoid body is semaphorin-dependent and prevents the formation of ectopic synaptic connections
- The Johns Hopkins University School of Medicine, United States
- Howard Hughes Medical Institute, The Johns Hopkins University School of Medicine, United States
Figures
Figure 1 with 1 supplement
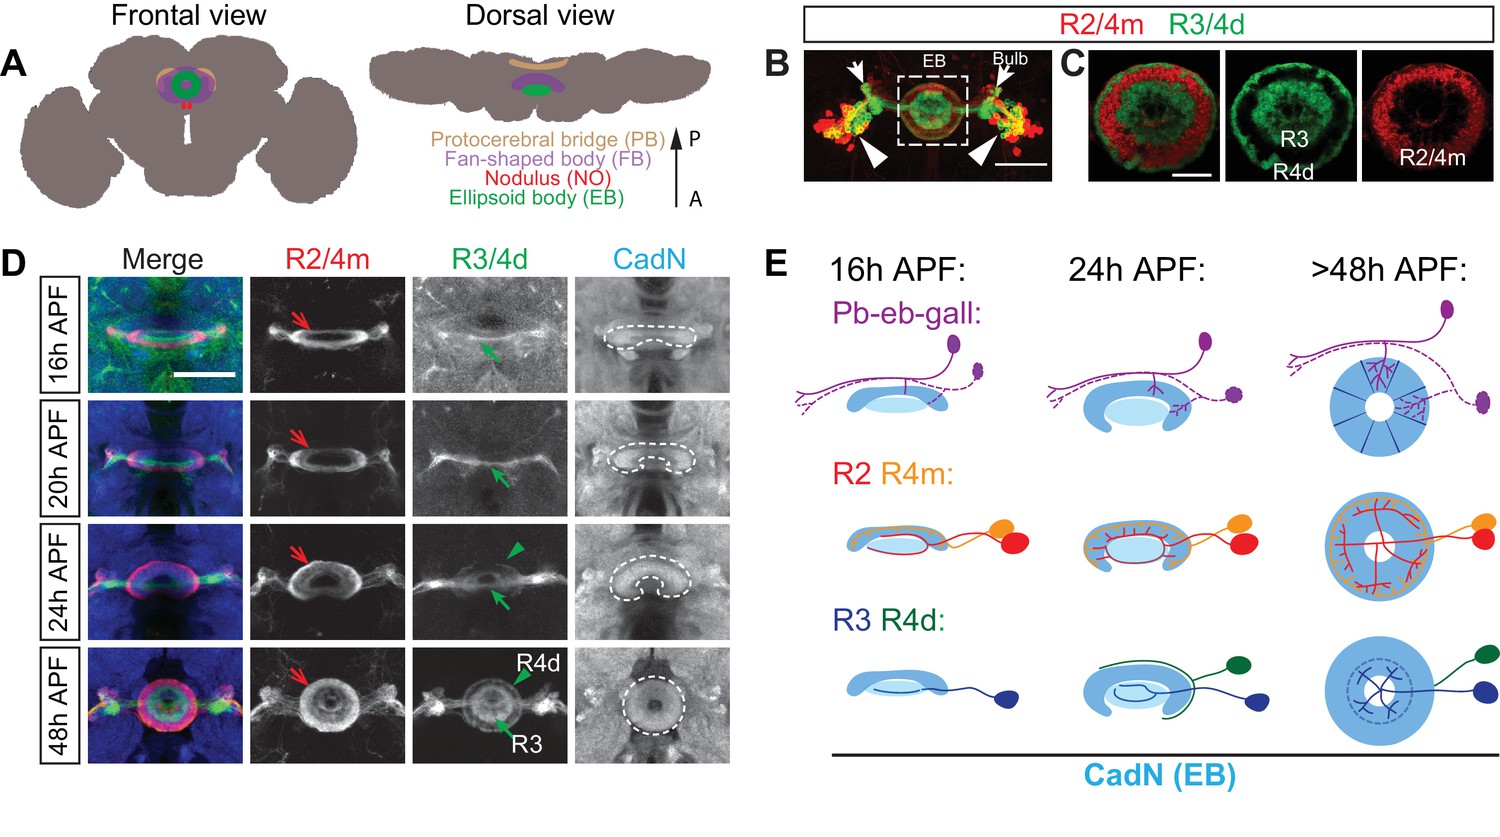
Large-field ring neuron axons sequentially innervate the ellipsoid body.
(A) Schematics showing frontal and dorsal views of the central complex (CX) in an adult Drosophila brain. The CX is composed of four substructures: from anterior (‘A’) to posterior (‘P’) the ellipsoid body (EB), the noduli (NO), the fan-shaped body (FB) and the protocerebral bridge (PB). (B–C) R15F02-GAL4 (expressed in R1/R3/R4d neurons) and R32H08-lexA (in R2/R4m neurons) driving GFP and mCherry reporters, respectively, label multiple ring neuron types in an adult fly brain. From laterally located cell bodies (arrowheads), ring neurons axons follow similar trajectories to innervate the bulb (arrows) and the ellipsoid body (dashed square) (B). Inside the EB, multiple concentric and adjacent rings are formed by dense axon projections from different R neurons (C). A smaller R1 ring is formed at more posterior EB regions and is covered by the R3 ring. (D) R32H08-lexA-driving mCherry and R15F02-GAL4-driving CD8-GFP allow for visualization of how R2/R4m and R3/R4d innervation takes place in the EB during pupal development. Strong CadN immunolabeling shows EB morphological changes (dashed lines) between 16 hr and 48 hr APF (hours after puparium formation). R2/R4m axons (red arrows) extend into the developing EB earlier than R3/R4d axons (green arrows and arrowheads), as can be observed between 16 and 24 hr APF since R2/R4m axons exhibit dense elaboration and co-localization with strong CadN staining prior to R3/R4d axons. R axon projections and elaborations appear complete between 40 and 48 hr APF, and the overall organization of R axons after 48 hr APF shows no difference when compared to the adult brain. (E) Schematics highlight changes in EB morphology (strong CadN staining in dark blue and weak CadN staining in light blue), sequential innervation of the EB by pb-eb-gall dendrites (immunostaining in Figure 1—figure supplement 1K and L), R2/R4m and R3/R4 axons during early pupal stages. Scale bars are 50 μm in panels B and D; 20 μm in panel C.
Figure 1—figure supplement 1

R neuron axons and pb-eb-gall dendrites have different morphologies and closely associate with each other in the developing and adult brain.
(A–F’) Single-cell MARCM clones show the diverse morphologies of ring neuron axons and pb-eb-gall neuron dendrites in the EB (frontal views in A–F, dorsal views in A’–F’). (G) Schematic depicting a dendritic arbor from a single pb-eb-gall neuron (red) overlapping with axons from multiple types of R neuron. Only axons from one R4m (yellow) and one R3 (blue) are shown here as examples. (H) R19G02-GAL4 was used to express pre-synaptic (Syt-GFP) and dendritic (DenMark) markers in small-field pb-eb-gall neurons. Syt-GFP, but not DenMark, was enriched in the gall, demonstrating that these gall projections are largely pre-synaptic. PB and EB projections were filled by both Syt-GFP and DenMark, suggesting that these projections include both pre- and post-synaptic terminals. (I–J) Native GFP fluorescence is reconstituted between pb-eb-gall dendrites and R neuron axons (R1/R3/R4d in panel I, R2/R4m in panel J) in GRASP (GFP reconstitution across synaptic partners) experiments. CD4-spGFP1-10 was expressed in R1/R3/R4d and R2/R4m neurons by R15B07-GAL4 and EB1-GAL4, respectively. CD4-spGFP11 and mCherry were expressed in pb-eb-gall neurons by R19G02-lexA in both cases. No GFP fluorescence was observed in control animals in which either GAL4 or lexA driver was not present (data not shown). (K and L) R19G02-GAL4-driving CD8-GFP and R19G02-lexA-driving mCherry label pb-eb-gall neuron projections in K and L (in green), respectively. At 24 hr APF, the pb-eb-gall neuron dendrites overlap with R2/R4m axons (labeled by R32H08-lexA-driving mCherry in panel K, red arrows), but not with R3/R4d axons (labeled by R15F02-GAL4-driving CD8-GFP in panel L, red arrow). At 48 hr APF, the pb-eb-gall dendrites have expanded toward the EB canal and overlap with both R2/R4m and R3/R4d axons. Scale bars are: 20 μm in panels A–F’; 50 μm in panels H–L.
Figure 2 with 1 supplement
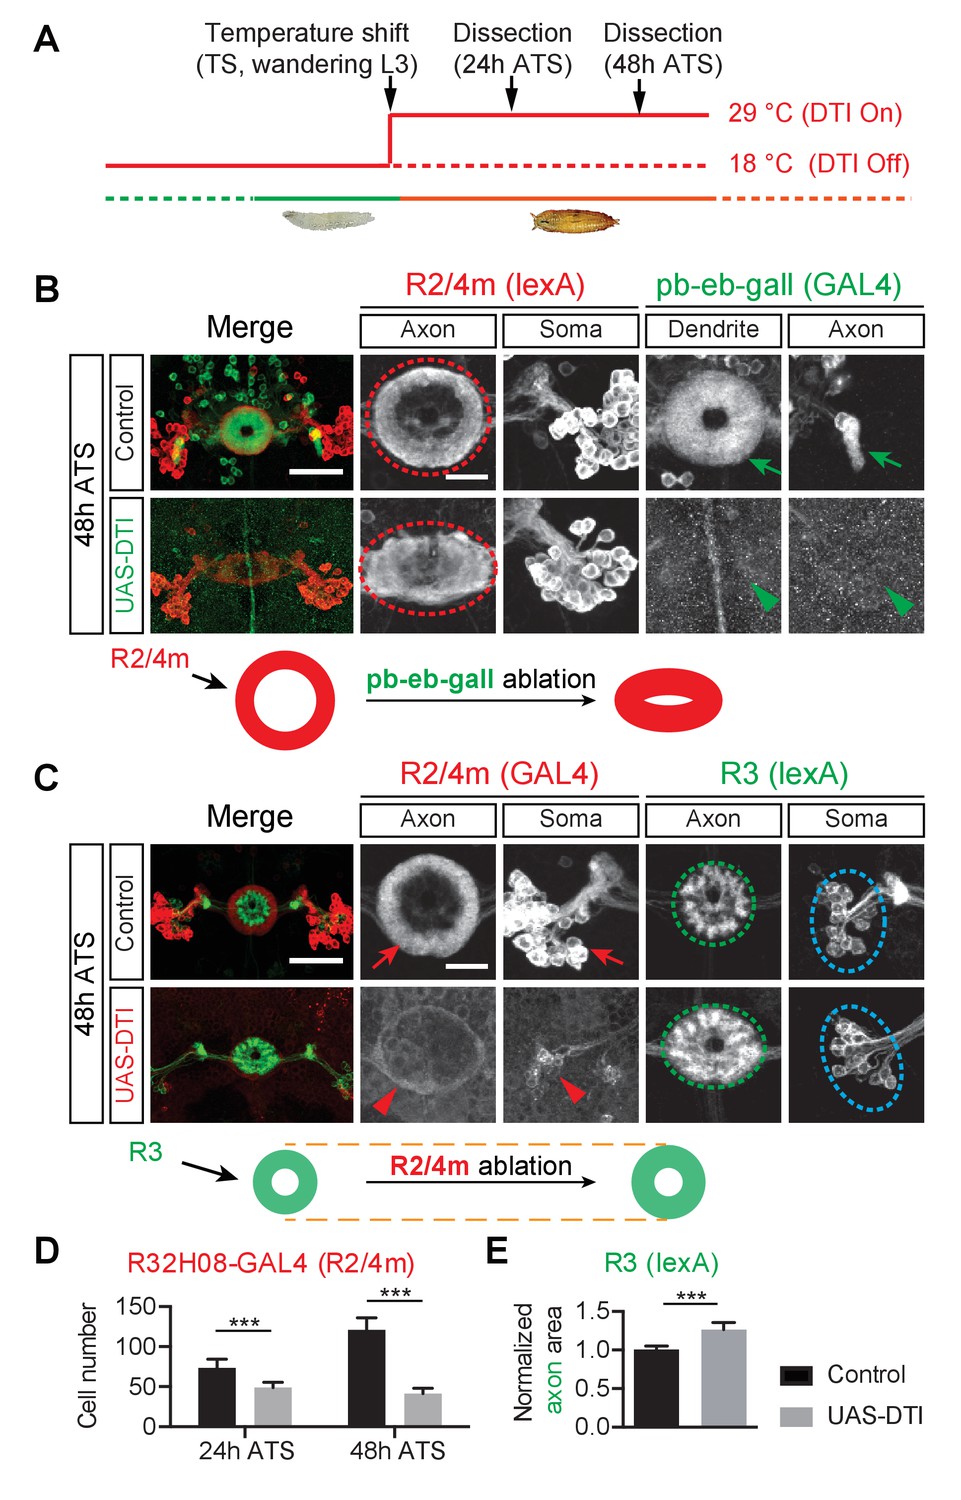
The pb-eb-gall and R2/R4m axons are required for EB patterning.
(A) Genetically encoded diphtheria toxin (DTI) was conditionally expressed by GAL4 drivers in targeted neurons upon a temperature shift (TS) from 18°C to 29°C, starting from wandering third instar stage (wL3). Pupae were dissected 24 or 48 hr after the temperature shift (ATS). (B) The pb-eb-gall neurons were labeled by R19G02-GAL4-driving CD8-GFP (green). R2/R4m neurons were labeled by R32H08-lexA-driving mtdT (red). In control animals (n = 8), pb-eb-gall neuron dendrites and R neuron axons (red circle) form circumferential innervation at 48 hr ATS. DTI expression by R19G02-GAL4 from wL3 stages ablated most pb-eb-gall neurons (arrowheads) and led to pronounced R2/R4m axon patterning defects in the EB (red oval) (n = 14 animals). (C–E) R54B05-lexA was used to drive myristoylated tdTomato (mtdT) in R3 neurons (green) while R32H08-GAL4-driving CD8-GFP was used for labeling R2/R4m neurons (red). In panel D, the CD8-GFP-labeled R2/R4m neuron cell bodies were counted at 24 hr ATS (73.4 ± 10.9 cells (n = 8 brains) for the control group and 49.0 ± 6.4 cells (n = 9 brains) for DTI expression group, p<0.0001) and 48 hr ATS (121.1 ± 15.0 cells (n = 7 brains) for the control group and 41.4 ± 6.9 cells (n = 10 brains) for DTI expression group, p<0.0001). In control animals, R2/R4m and R3 axons projected into different EB rings at 48 hr ATS (top panels in C). After DTI was expressed in R2/R4m neurons from wL3 stages, R3 axon arbors expanded outward in the EB (green oval in C). R3 axon arbor areas were measured and all measurements were normalized to the mean value of the control group shown in panel E: 1.000 ± 0.052 for controls (n = 8 brains) and 1.266 ± 0.090 for DTI-expressing group (n = 7 brains), p=0.0003. Scale bars are 50 μm in low-magnification images (‘Merge’ color panels) and 20 μm in high-magnification images (black and white panels). Bar graphs are presented as ‘mean’ plus ‘standard deviation (SD)’ here and in following figures unless specified. For the details of statistical methods please refer to Materials and methods and Figure 2—source data 1. Note that the confocal laser power used to image GFP (green in B and red in C) was 10x stronger for DTI-expressing brains (lower panels in B and C) compared to control brains (upper panels) here, and in all following ablation experiments.
-
Figure 2—source data 1
Statistical analysis of EB neuron ablation quantification.
- https://doi.org/10.7554/eLife.25328.006
Figure 2—figure supplement 1
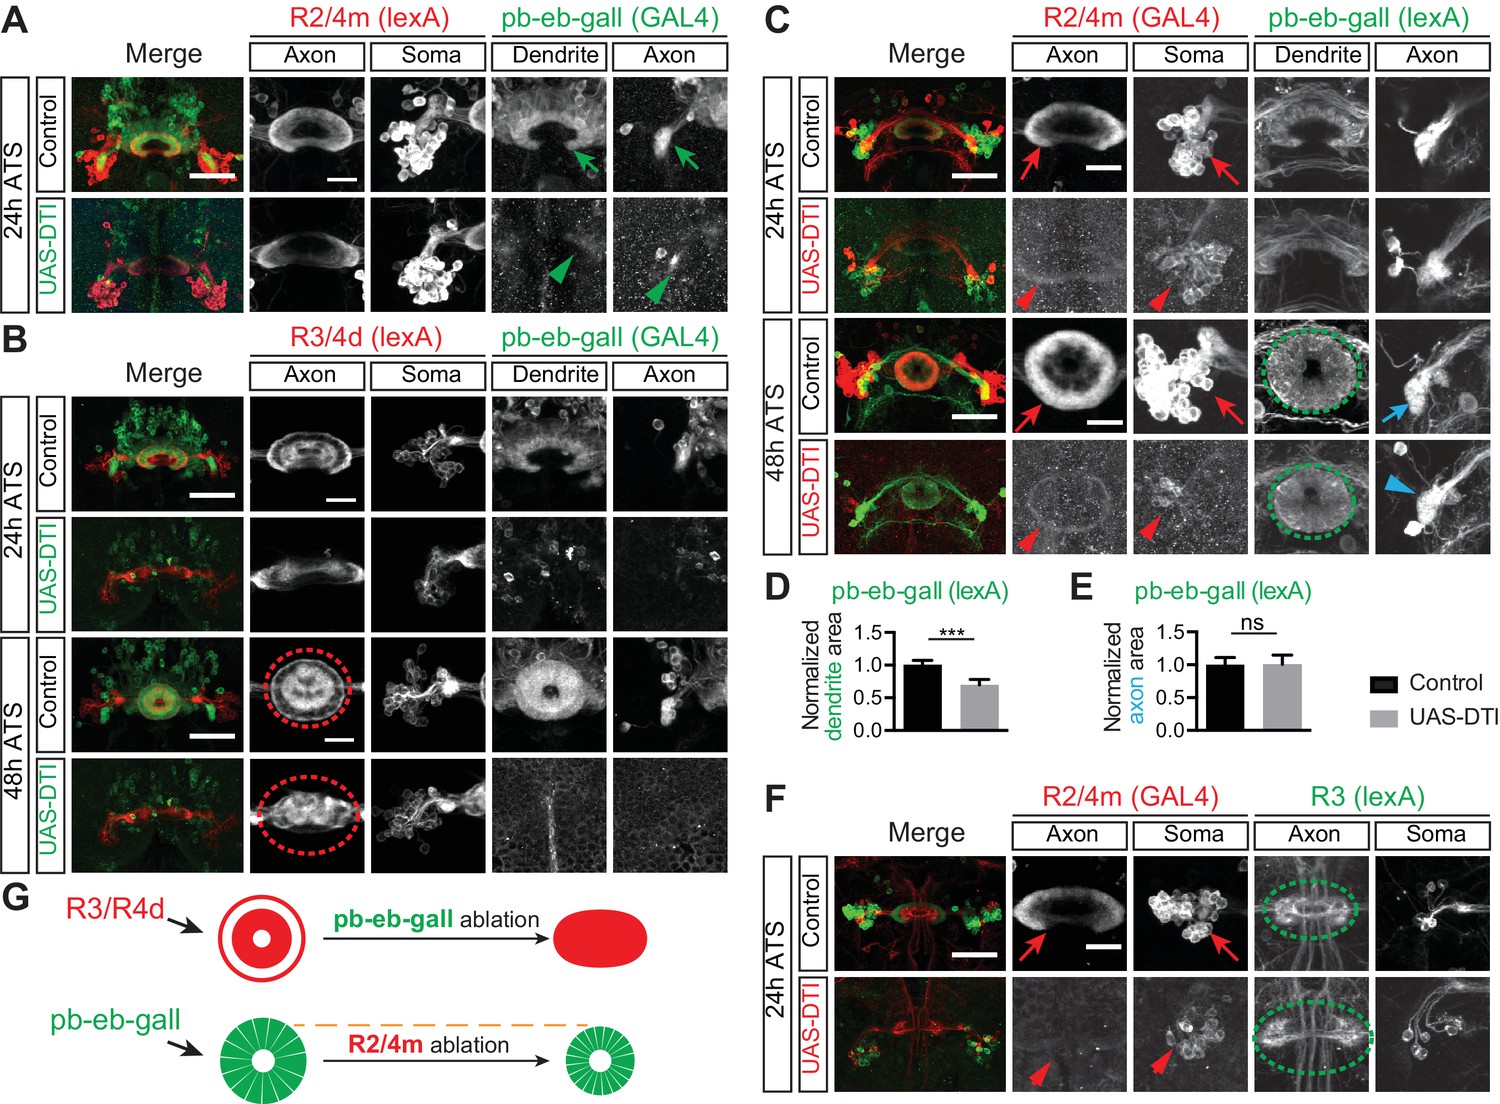
Ablation of pb-eb-gall and R2/R4m neurons lead to different defects.
(A) Images shown for the same experiments as in Figure 2B, except here for an earlier time point, 24 hr ATS. (B) pb-eb-gall neurons were labeled by R19G02-GAL4-driving CD8-GFP (green). R3/R4d neurons were labeled by R70B04-lexA-driving mtdT (red). Similar to R2/R4m axons, ablation of pb-eb-gall neurons resulted in gross changes in R3/R4d axon patterning in the EB (Controls: n = 8 brains at 24 hr ATS and n = 9 brains at 48 hr ATS; DTI expressing group: n = 7 brains at 24 hr ATS, n = 14 brains at 48 hr ATS). (C–E) R2/R4m and pb-eb-gall neurons were labeled by R32H08-GAL4-driving CD8-GFP (in red) and R19G02-lexA-driving mCherry (in green), respectively. Conditional expression of DTI in R2/R4m neurons from the wL3 stage led to a significant loss of GFP-labeled R2/R4m axon projections and somas (red arrows and arrowheads), and decreased mCherry-labeled pb-eb-gall dendrite elaboration at 48 hr ATS (quantification of pb-eb-gall dendrite areas was normalized to the mean pb-eb-gall dendritic area of the control group; 1 ± 0.073 for the controls and 0.696 ± 0.084 for DTI expression group, p<0.0001; n = 10 animals for each genotype). In panel E, pb-eb-gall axon elaboration in the gall remained similar (p=0.4359) between control (1 ± 0.112) and DTI-expressing animals (1.008 ± 0.141; quantified as the sum of left and right side pb-eb-gall neuron axon projection areas and normalized to the mean of the control group; n = 10 brains for each genotype). See Figure 2—source data 1 for details of statistical analyses. (F) Early time point (24 hr ATS) experiments for Figure 2C. (G) Schematics show R3/R4 axon changes before and after pb-eb-gall neuron ablation (upper panels), and pb-eb-gall dendrites before and after R2/R4m ablation (lower panels). Scale bars are 50 μm in low-magnification images (‘Merge’ color panels) and 20 μm in high-magnification images (black and white panels in A, (B, C and F).
Figure 3 with 1 supplement

Ellipsoid body ring neurons express Sema-1a.
(A and B) Antibody staining reveals that Sema-1a and PlexA are both expressed in the EB during early pupal stages (24 hr and 48 hr APF). Sema-1a is also detected in the bulb (arrows) at 48 hr APF. (C) Schematic (modified from: Pecot et al., 2013) shows our strategy for using cell-type-specific flipase (FLP) expression to conditionally tag endogenous Sema-1a with V5 epitopes, revealing Sema-1a expression while at the same time conditionally labeling these same neurons with CD2-GFP. (D–F) Both CD2-GFP and V5-tagged Sema-1a were conditionally expressed in R neurons using the strategy outlined in panel C when R neuron-specific R11F03-GAL4 was used to express FLP. Low-magnification images show that CD2-GFP and V5 were not detected in animals when R11F03-GAL4 was not present (D). High-magnification images reveal that V5-tagged Sema-1a is specifically enriched in R neuron axonal terminals within the EB at 24 hr APF (E) and at 48 hr APF, unlike CD2-GFP, which is uniformly localized in both R neuron soma and axons (F). Sema-1a-V5 exhibits strong expression throughout the EB, and it is also found in R neuron dendritic terminals in the bulb at 48 hr APF. (G) Schematic (modified from: Pecot et al., 2013) showing how Sema-1a-expressing R neurons are labeled by lexA-driving mCherry when FLP is expressed in these same R neurons using GAL4 drivers. (H–J) Using the strategy in panel G, multiple GAL4 drivers were used to label different groups of R neurons with CD8-GFP. Sema-1a-expressing R neurons, identified by mCherry expression, are shown at 48 hr APF. Scale bars are 50 μm.
Figure 3—figure supplement 1
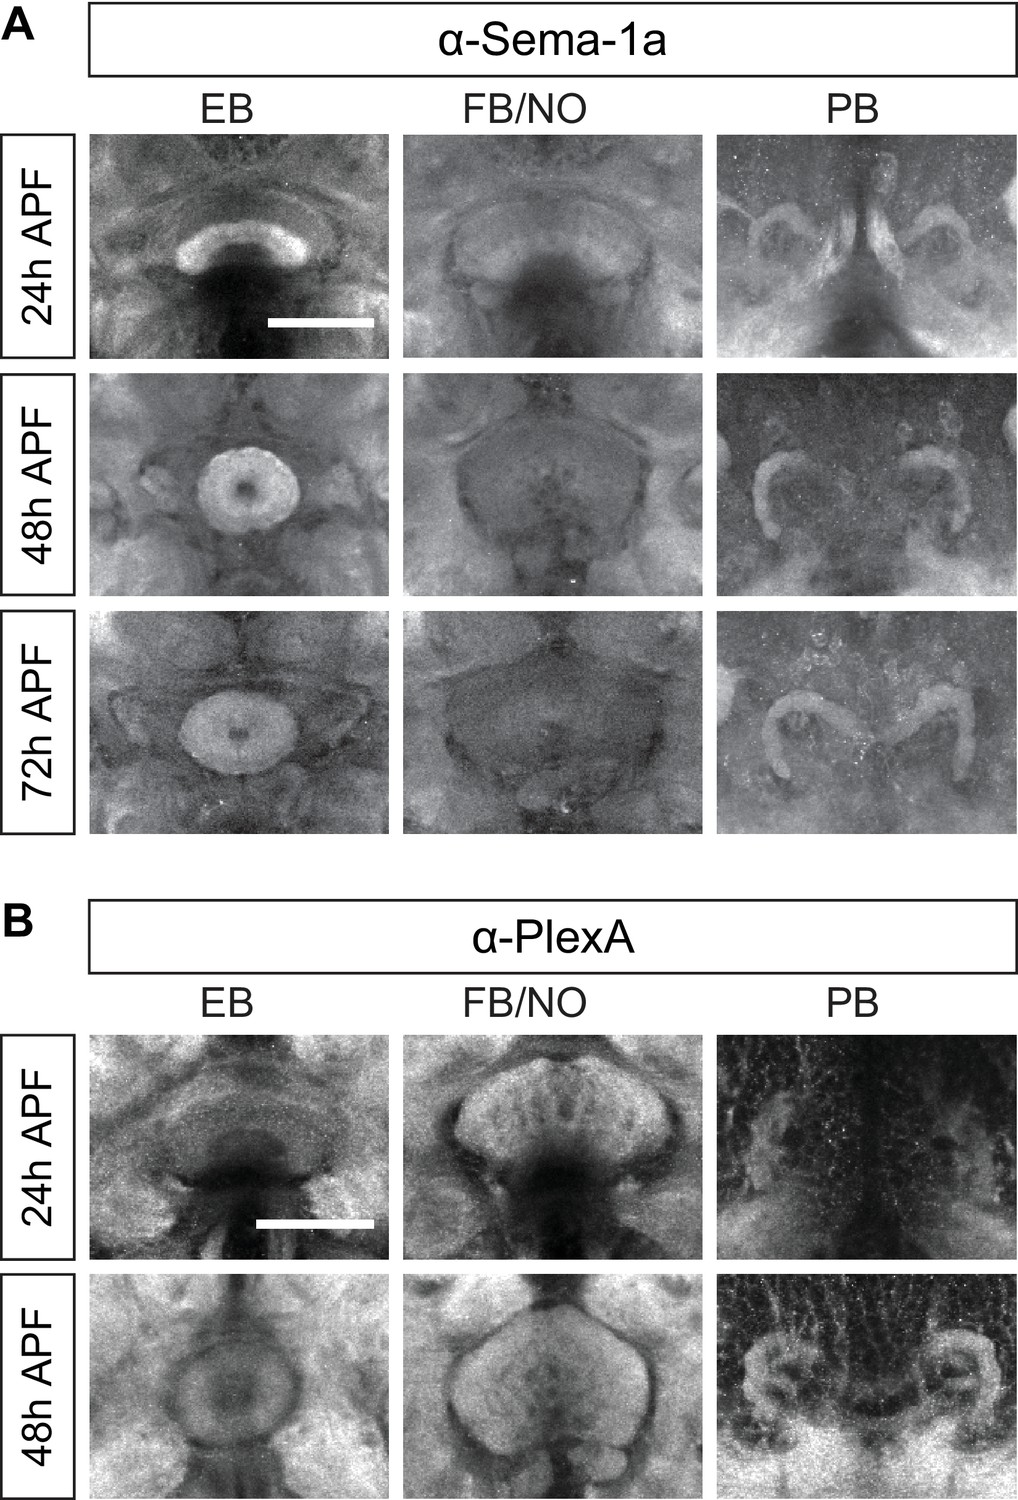
Sema-1a and PlexA are expressed in the central complex.
(A and B) Antibody staining reveals that Sema-1a (A) and PlexA (B) are expressed by different CX components at various levels. The ellipsoid body has high Sema-1a but relatively low PlexA expression; however, the fan-shaped body has low Sema-1a but high PlexA expression. The protocerebral bridge exhibits moderate Sema-1a and PlexA expression. Scale bars are 50 μm.
Figure 4 with 2 supplements
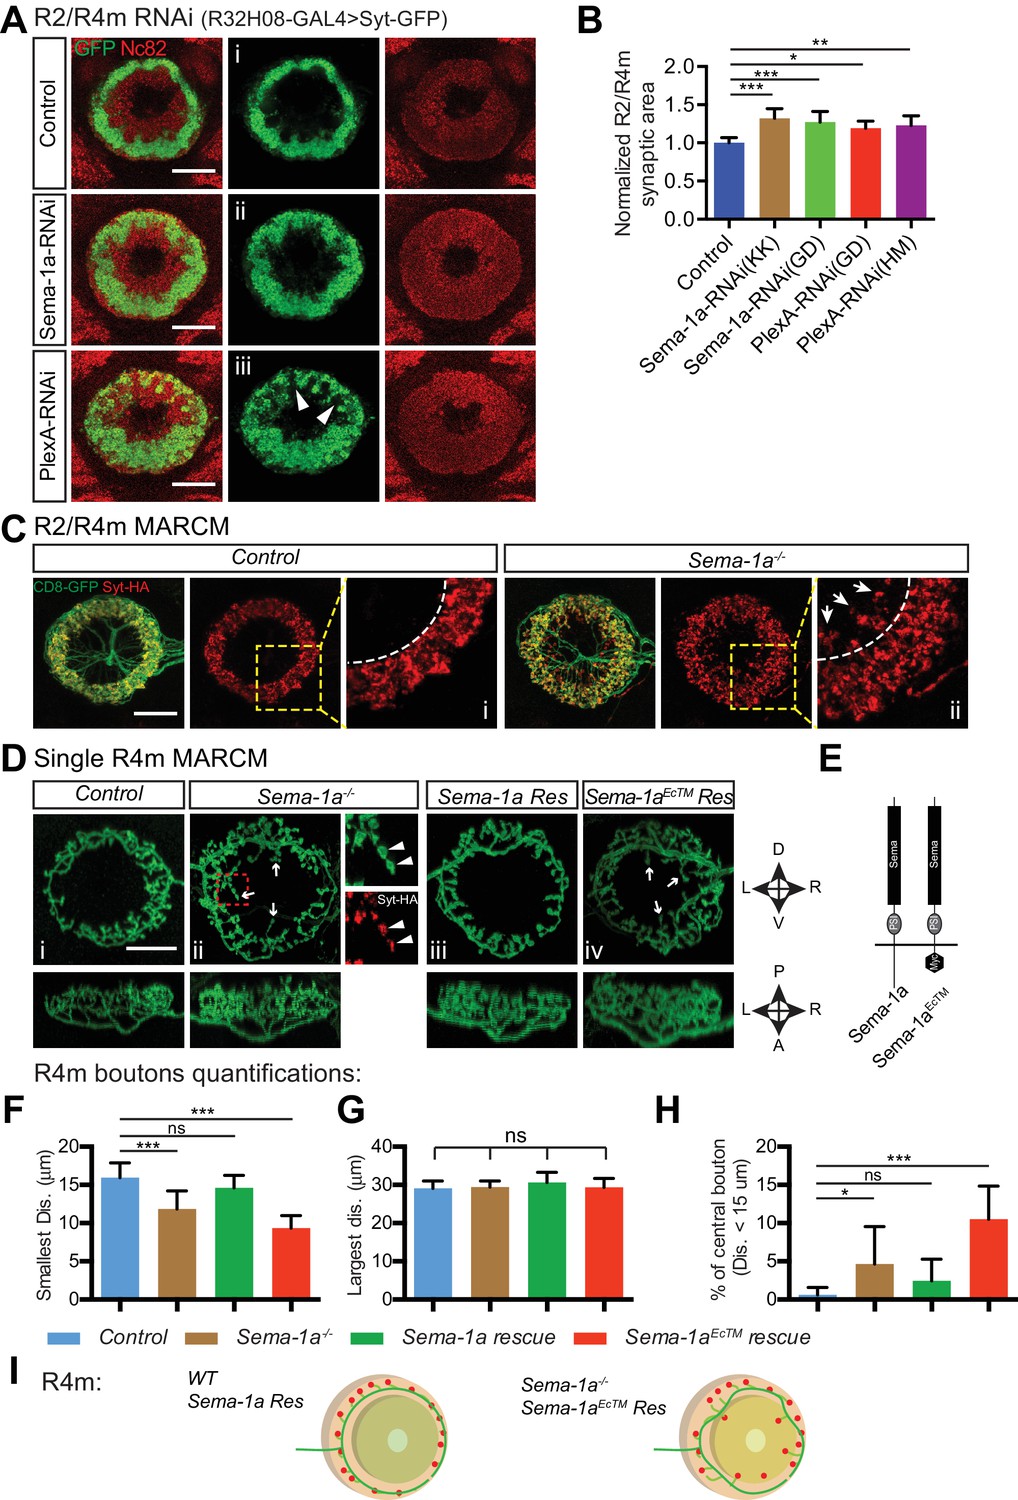
Sema-1a/PlexA signaling controls R2/R4m axon lamination and synapse localization in the ellipsoid body.
(A and B) Pre-synaptic R2/R4m axon compartments were specifically labeled using R32H08-GAL4-driving GFP-tagged Synaptotagmin (Syt-GFP) in adult fly brains. Knocking down Sema-1a or PlexA in R2/R4m neurons led to aberrant ring neuron axon morphology and inward expansion of the R2/R4m synaptic domain in the EB. Syt-GFP areas were measured on Z-projection images and normalized to the mean area of the control group. Normalized values are compared in panel B for controls (1.000 ± 0.069 [n = 6 brains]), the two Sema-1a-RNAi groups (1.321 ± 0.129 [p<0.001] and 1.271 ± 0.140 [p<0.001] [n = 10 brains for each group]), and for the two different PlexA-RNAi groups (1.193 ± 0.091 [p=0.022, n = 7 brains] and 1.228 ± 0.127 [p=0.002, n = 12 brains]). Resource data for statistical analyses are available in Figure 4—source data 1. (C) MARCM clones were generated using hsFLP. R2/R4m GAL4 drivers were used to label R2/R4m neurons with CD8-GFP in adult flies. HA-tagged synatotagmin (Syt-HA) was co-expressed to label pre-synaptic specializations in WT and Sema-1a-/- clones. In a Sema-1a-/- clone containing multiple R2 and R4m cells, Syt-HA-labeled axon terminals expanded inwardly within the EB, recapitulating the Sema-1a-RNAi phenotype in panel A. (D–E) Frontal- (upper panels) and dorsal- (lower panels) view images of axon arbors of single R4m MARCM clones reveal that R4m axons become more complex and some R4m boutons are located closer to the EB center in Sema-1a-/- and Sema-1aEcTM rescue clones than in control and Sema-1a rescue clones. Schematics to the right show the brain coordinates and domain organization of WT Sema-1a and Sema-1aEcTM proteins (E). For rescue experiments, full length Sema-1a or truncated Sema-1a lacking its cytoplasmic domain (Sema-1aEcTM) were expressed in Sema-1a-/- clones consisting of R4m neurons. (F–H) The pre-synaptic boutons of R4m neurons in the EB were manually determined based on their enlarged morphologies as observed in the reconstructed 3D images of GFP-labeled R4m axon arbor (see Figure 4—figure supplement 1C). The distances between each bouton and the center of EB canal were measured. The smallest and largest distances were plotted and compared to controls in panels F and G, respectively. The percentage of R4m boutons that were no more than 15 μm away from the EB center is shown in panel H. n = 12 Single Cell Clones (SSCs) for controls; n = 16 SSCs for Sema-1a-/- group; n = 9 SSCs for Sema-1a rescue; n = 10 SSCs for Sema-1aEcTM rescue. Detailed statistical analyses are available in Figure 4—source data 2. (I) Schematics highlight R4m axon arbor changes shown in panel D. ‘ns’ p>0.1234; *p<0.0332; **p<0.0021; ***p<0.0002. Scale bars are 20 μm.
-
Figure 4—source data 1
Statistical analysis of R2/R4m syt-GFP quantification.
- https://doi.org/10.7554/eLife.25328.011
-
Figure 4—source data 2
Statistical analysis of single R4m MARCM.
- https://doi.org/10.7554/eLife.25328.012
Figure 4—figure supplement 1
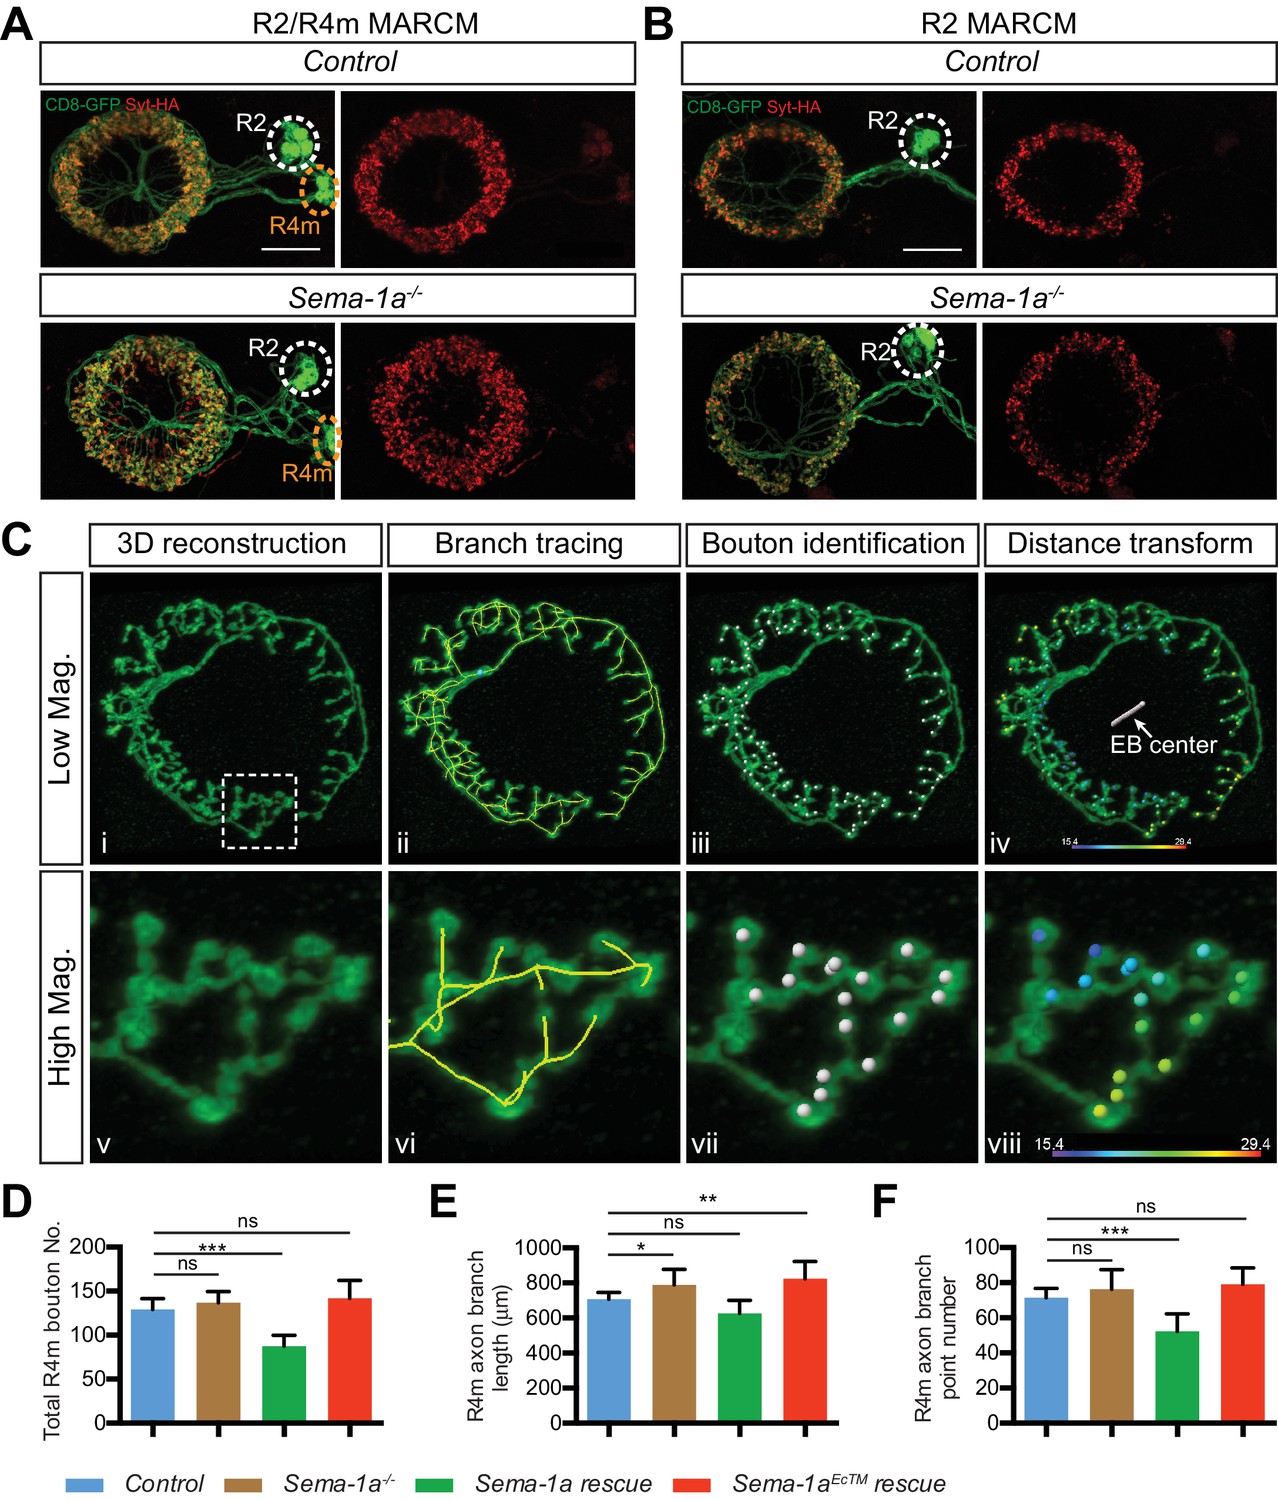
Sema-1a is required cell-autonomously for R4m, but not R2, axon arbor and synapse development.
(A–B) R2 and R4m neurons have different dendrite locations in the bulb white and yellow circles). Syt-HA-labeled R2/R4m synapse ring (red) was disrupted in multiple-cell MARCM clones containing both R2 and R4m neurons (A), but remained largely normal in multiple-cell MARCM clones containing only R2 neurons (B). Scale bars are 20 μm. (C) High-magnification stack images were processed in Imaris. See details in the Materials and methods. (D–E) The total bouton number, axonal branch length and branch point numbers in each single R4m axon arbors in the EB are plotted. n = 12 SSCs for the control; n = 16 SSCs for Sema-1a-/- group; n = 9 SSCs for Sema-1a rescue; n = 10 SSCs for Sema-1aEcTM rescue; ‘ns’ p>0.1234; *p<0.0332; **p<0.0021; ***p<0.0002. Statistical analyses are included in Figure 4—source data 2. Scale bars are 20 μm in A and B.
Figure 4—figure supplement 2

PlexA and Sema-1a are differentially required in R1–3 neurons for EB morphogenesis and R axon lamination.
(A–B) R4m (green in A) and R3 (red in B) axons were labeled by R34D03-lexA and R54B05-lexA-driving mtdT in adult fruitfly brains, respectively. Knocking down Sema-1a or PlexA in R1–3 neurons using R40G10-GAL4 leads to distinct changes in EB morphology and R axon elaboration. Top panels are projections of low-magnification Z-stack images and lower panels are high-magnification images of single optic sections. (G) Schematics showing R2m and R3 axon trajectory alterations following Sema-1a-RNAi and PlexA-RNAi expression in R1–3 neurons. Scale bars are 50 μm in low-magnification images (top panels) and 20 μm in high-magnification images (other lower panels in A and B).
Figure 5 with 2 supplements

Sema-1a and PlexA are required in R2/R4m neurons to constrain R axon growth within the ellipsoid body.
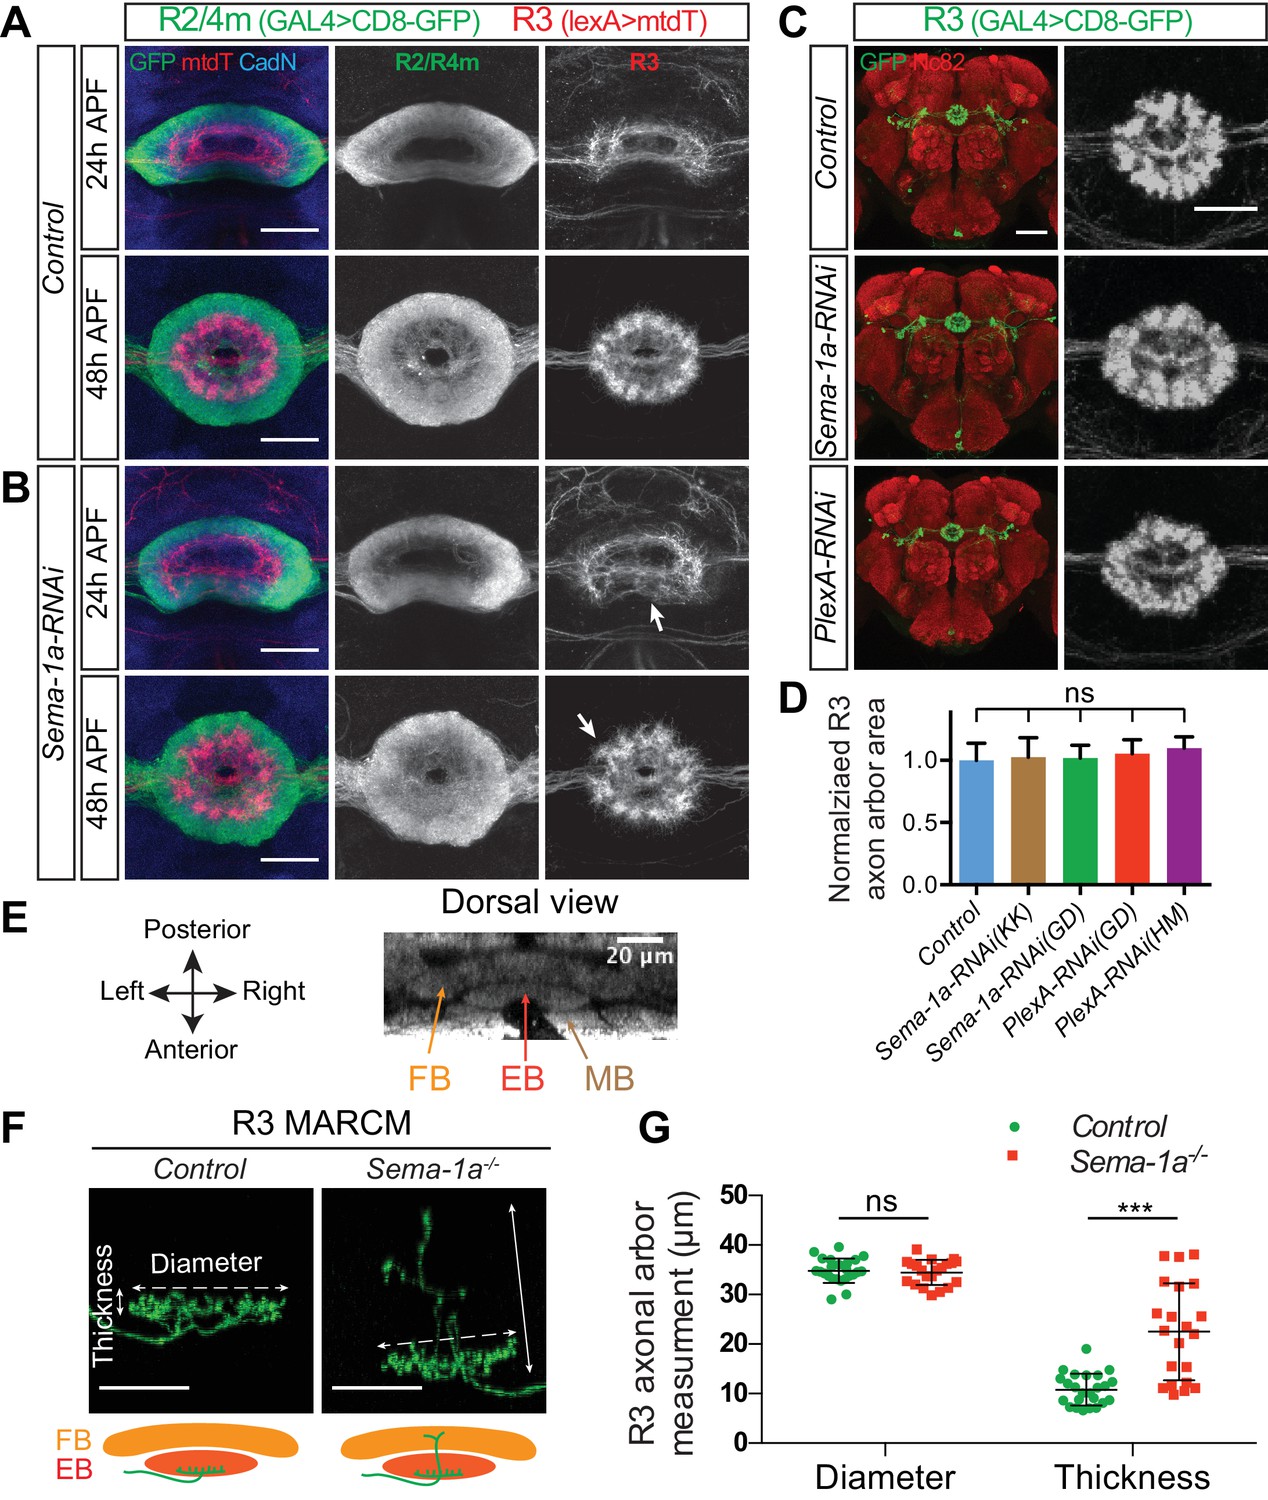
(A–D) R2/R4m neurons were labeled by R32H08-GAL4-driving CD8-GFP, while R3 axons were labeled using R54B05-lexA-driving mtdTomato (mtdT) in adult fly brains. Knocking down Sema-1a or PlexA in R2/R4m neurons did not change axon trajectory or cell numbers of either R3 or R2/R4m (panels C and D), but resulted in non-cell autonomous R3 axon arbor expansion in the EB (panel B). Seven to eight brains for each genotype were used for quantification. ‘ns’ p>0.1234; *p<0.0332; **p<0.0021; ***p<0.0002. See Figure 5—source data 1 for detailed statistical analyses. (E) Schematics showing that both R3 (red) and R2/R4m (green) axons expand when Sema-1a or PlexA is down-regulated in R2/R4m, leading to intermingled R3 and R2/R4m axons. Scale bars are 50 μm in low-magnification images in top panels and 20 μm in high-magnification images in other panels.
-
Figure 5—source data 1
Statistical analysis of R3 axon quantification in R2/4m RNAi.
- https://doi.org/10.7554/eLife.25328.016
-
Figure 5—source data 2
Statistical analysis of R3 RNAi quantification.
- https://doi.org/10.7554/eLife.25328.017
-
Figure 5—source data 3
Statistical analysis of single R3 MARCM quantification.
- https://doi.org/10.7554/eLife.25328.018
Figure 5—figure supplement 1
R2/R4m Sema-1a, but not R3 Sema-1a/PlexA, is required for R axon lamination.
(A–B) R2/R4m and R3 axons were differentially labeled by R32H08-GAL4-driving CD8-GFP (green) and R54B05-lexA-driving mtdT (red), respectively. Knocking down Sema-1a in R2/R4m neurons led to gradual changes in R axon elaboration during early pupal stages. (C–D) R46D01-GAL4 was used to express CD8-GFP (green) and UAS-RNAi in a group of R3 neurons. Knockdown of either Sema-1a or PlexA did not change R3 axon elaborations. The R3 axonal arbor area was measured and compared to controls in panel D. Eight to ten animals were used for quantification of each genotype. All p-values are > 0.21. Detailed statistical analyses are available in Figure 5—source data 2. (E) The mushroom body (MB), the ellipsoid body (EB) and the fan-shaped body (FB) are adjacent to one another along the anterior-posterior axis in the adult Drosophila brain, shown here using Nc82 immunostaining. (F–G) R84H09-GAL4 was used to express CD8-GFP in R3 neurons in MARCM clones. In Sema-1a-/- single-cell MARCM clones, the radial elaboration of R3 axons within the EB is generally normal as indicated by no change of R3 axon ‘Diameter’ compared to control clones (34.83 ± 2.46 μm for the control (n = 24 SSCs) and 34.49 ± 2.53 μm for the Sema-1a-/- (n = 21 SSCs), p=0.826). However, some Sema-1a-/- R3 neurons extended a few axon branches posteriorly into the FB, which was quantified by assessing the increase in axon arbor ‘Thickness’ as observed in dorsal view images (10.83 ± 3.17 μm for the control (n = 24 SSCs) and 22.51 ± 9.78 μm for the Sema-1a-/- (n = 21 SSCs), p<0.001). See Figure 5—source data 3 for details of statistical analyses. Scale bars are 20 μm in panels A, B and F, and in right high-magnification images in panel C (black and white panels); 50 μm in left low-magnification images (color panels) in panel C.
Figure 5—figure supplement 2

Sema-1a and PlexA are not required for pb-eb-gall dendrite elaboration and synaptogenesis in the EB.
(A) R2/R4m and pb-eb-gall neurons were differentially labeled using R32H08-GAL4-driving CD8-GFP (green) and R19G02-lexA-driving mtdT (red), respectively. Knocking down Sema-1a or PlexA in R2/R4m neurons led to changes in R2/R4m axon lamination, but no changes in pb-eb-gall dendrite elaboration in the EB. (B) R32H08-GAL4 and R19G02-lexA were used to express nSyb-spGFP1-10 and CD4-spGFP11 in R2/R4m and pb-eb-gall neurons, respectively. Sema-1a-RNAi was co-expressed in R2/R4m neurons in experimental conditions. And mtdT was co-expressed to labeled pb-eb-gall projections in all animals. (C–D) pb-eb-gall neurons were labeled by R19G02-GAL4-driving CD8-GFP (green). R2/R4m (red in C) and R3/R4d (red in D) neurons were labeled by R32H08-lexA and R70B04-lexA, respectively, driving mtdT. Knocking down Sema-1a or PlexA in pb-eb-gall neurons alters pb-eb-gall axon projections, but does not change pb-eb-gall dendrite elaboration and R axon lamination in the EB. Scale bars are 50 μm in low-magnification images in all panels; 20 μm in high-magnification images in panel A (i–vi) and B (i–iv).
Figure 6 with 1 supplement
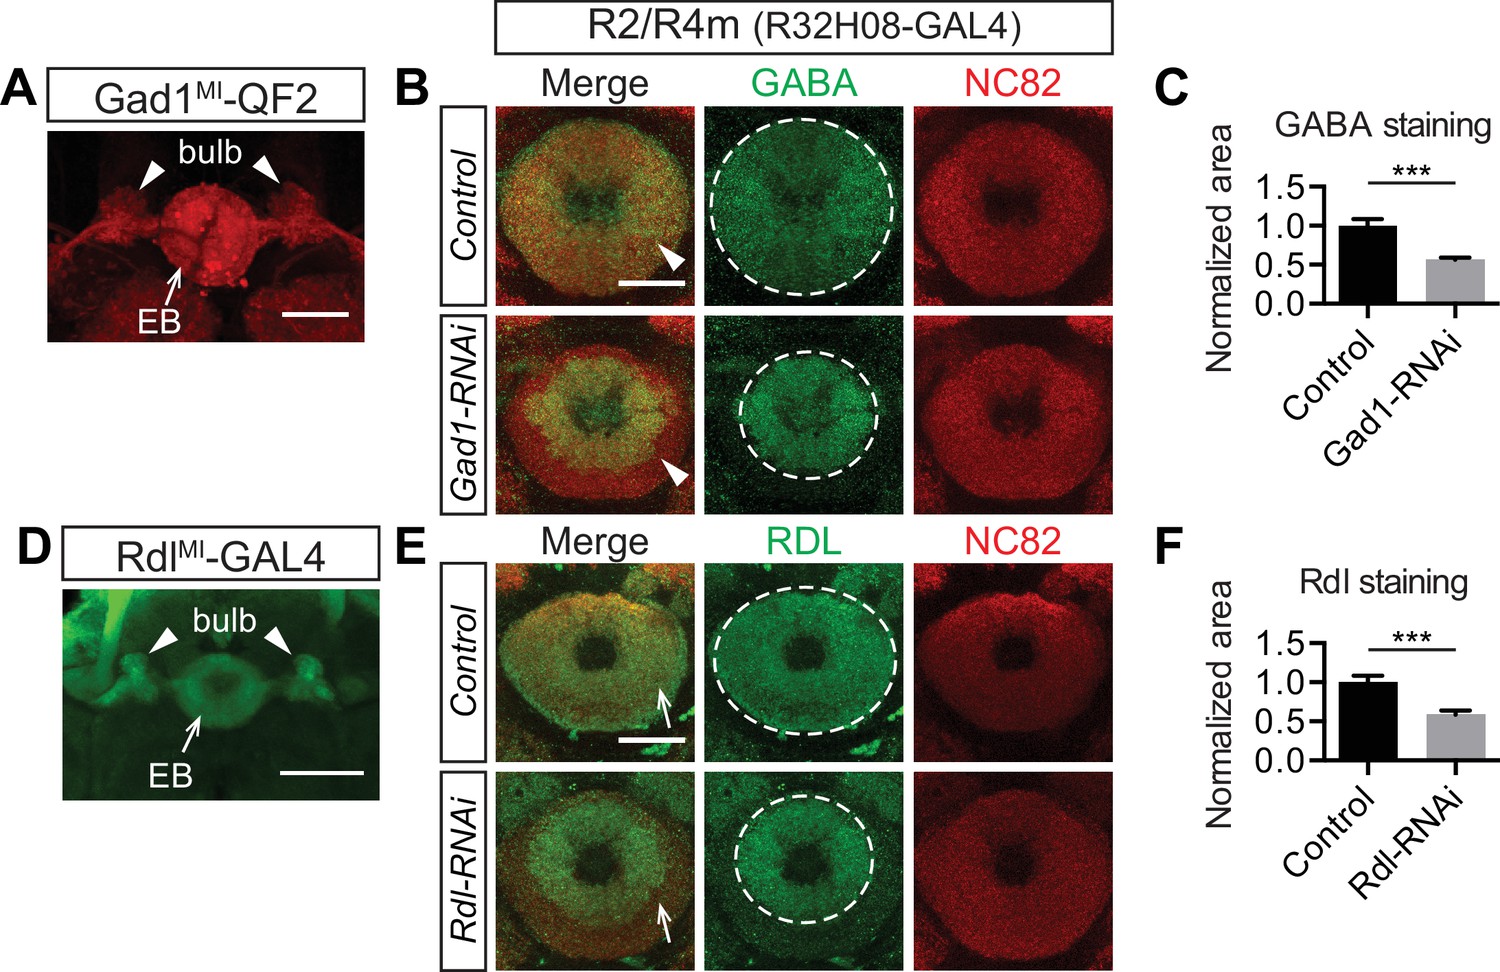
Ring neurons transport GABA and GABA-A receptors to their axonal terminals in the ellipsoid body.
(A and D) MiMic-based GAL4 and QF2 drivers (Diao et al., 2015) were used to express fluorescent reporters and to access Gad1(A) and Rdl (D) expression in adult fruitfly brains. Both drivers clearly express in a large group of ring neurons, which project from the lateral regions into the bulb (arrowheads) and EB (arrows). (B, C, E, F) GABA and Rdl immunostaining is enriched in the EB in adult fruitfly brains. Knocking down Gad1 and Rdl in R2/R4m neurons using R32H08-GAL4 significantly decreased GABA (arrowheads in panel B) and Rdl (arrows in panel E) immunostaining in the peripheral regions of the EB. The area covered by strong GABA and Rdl immunostaining in the EB was measured using maximal intensity Z-projection images. All measurements were normalized to the mean of the control groups, and they were compared between control and RNAi groups as shown in panels C and F. For GABA staining in the control group, normalized area was 1.000 ± 0.083 (n = 5), and for the RNAi group the normalized area was 0.563 ± 0.028 (n = 5) and significantly reduced, compared to the control (p=0.0079). For Rdl staining, the normalized area was 1.000 ± 0.087 (n = 5) and for the RNAi group the normalized area was 0.587 ± 0.052 (n = 5), again, significantly reduced compared to the control (p=0.0079). Detailed statistical analyses are available in Figure 6—source data 1. Scale bars are 50 μm in panels A and D, and 20 μm in panels B and E.
-
Figure 6—source data 1
Statistical analysis of Gad1 and Rdl RNAi in R2/R4m quantification.
- https://doi.org/10.7554/eLife.25328.022
Figure 6—figure supplement 1
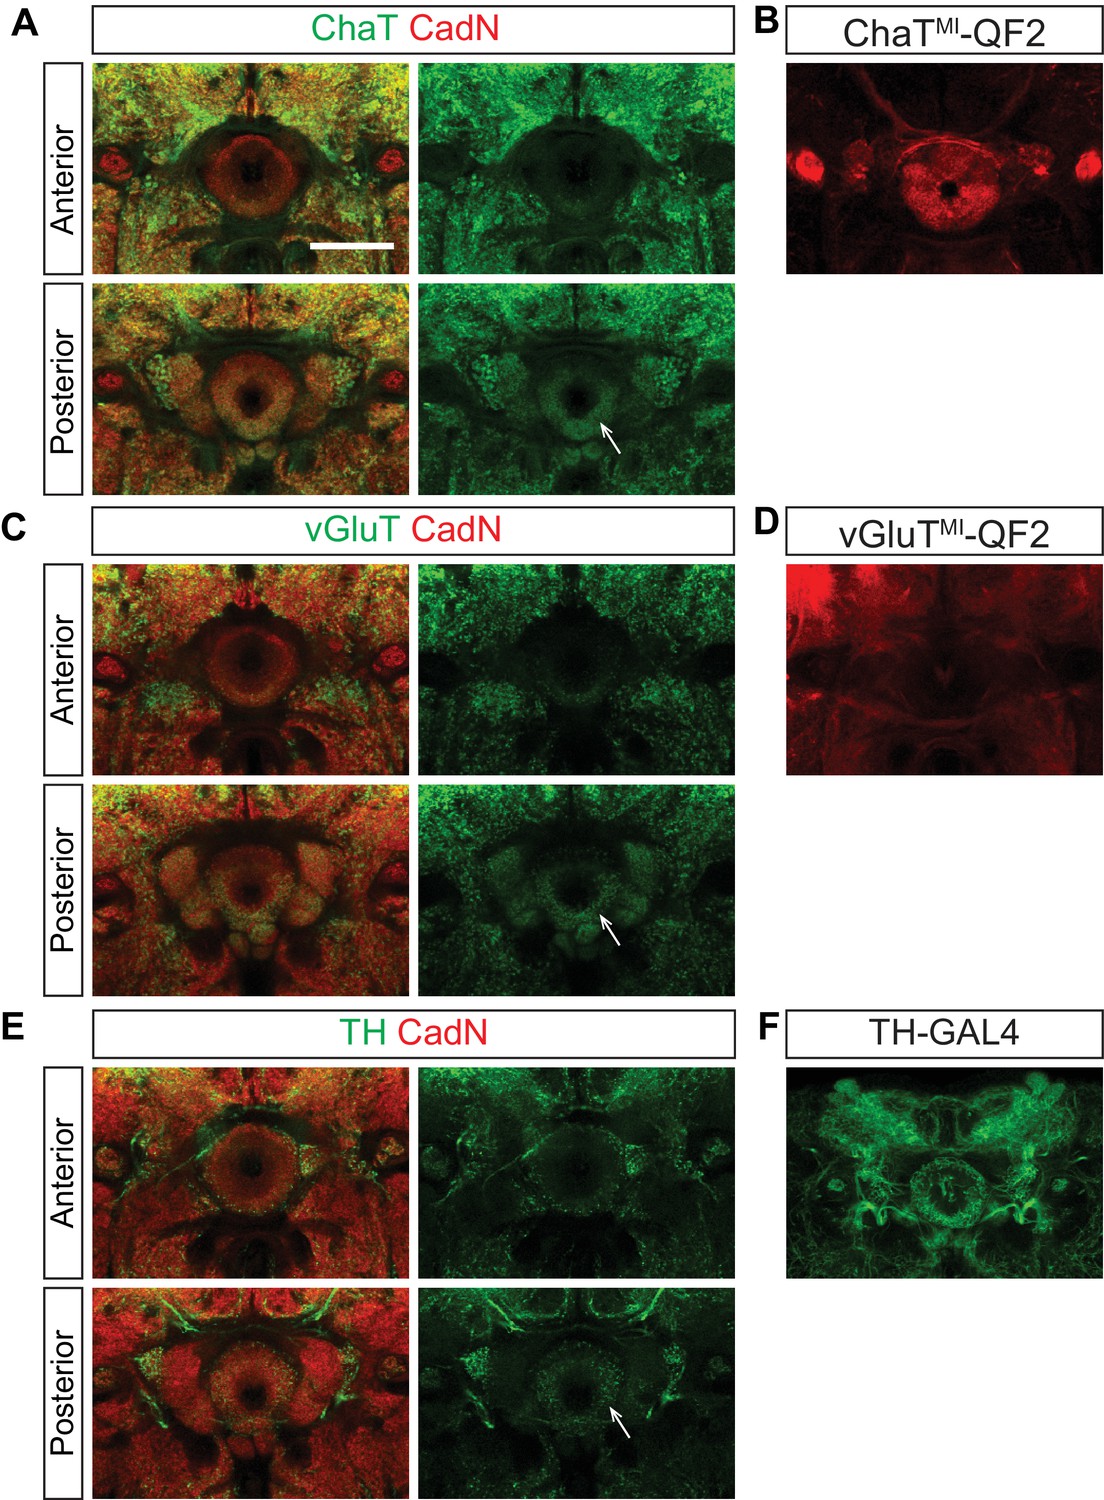
Ellipsoid body ring neurons are not cholinergic, glutamatergic or dopaminergic.
The neurochemical identities of EB projection neurons were analyzed using either antibody staining or fluorescent reporter proteins (CD8-GFP and mTdt) driven by GAL4 and QF2 drivers. All drivers, except for TH-GAL4, are MiMic (MI)-based protein trap lines (Diao et al., 2015). ChaT (A), vGluT (C) and TH (E) stainings show that cholinergic, glutamatergic and dopaminergic neurons preferentially innervate the EB posterior shell, but not the anterior shell where ring neuron axons elaborate. ChaTMI-QF2 (B), vGluTMI-QF2 (D) and TH-GAL4 (F) are expressed in small-field EB neurons and extrinsic ring neurons. Scale bar is 50 μm.
Figure 7 with 1 supplement
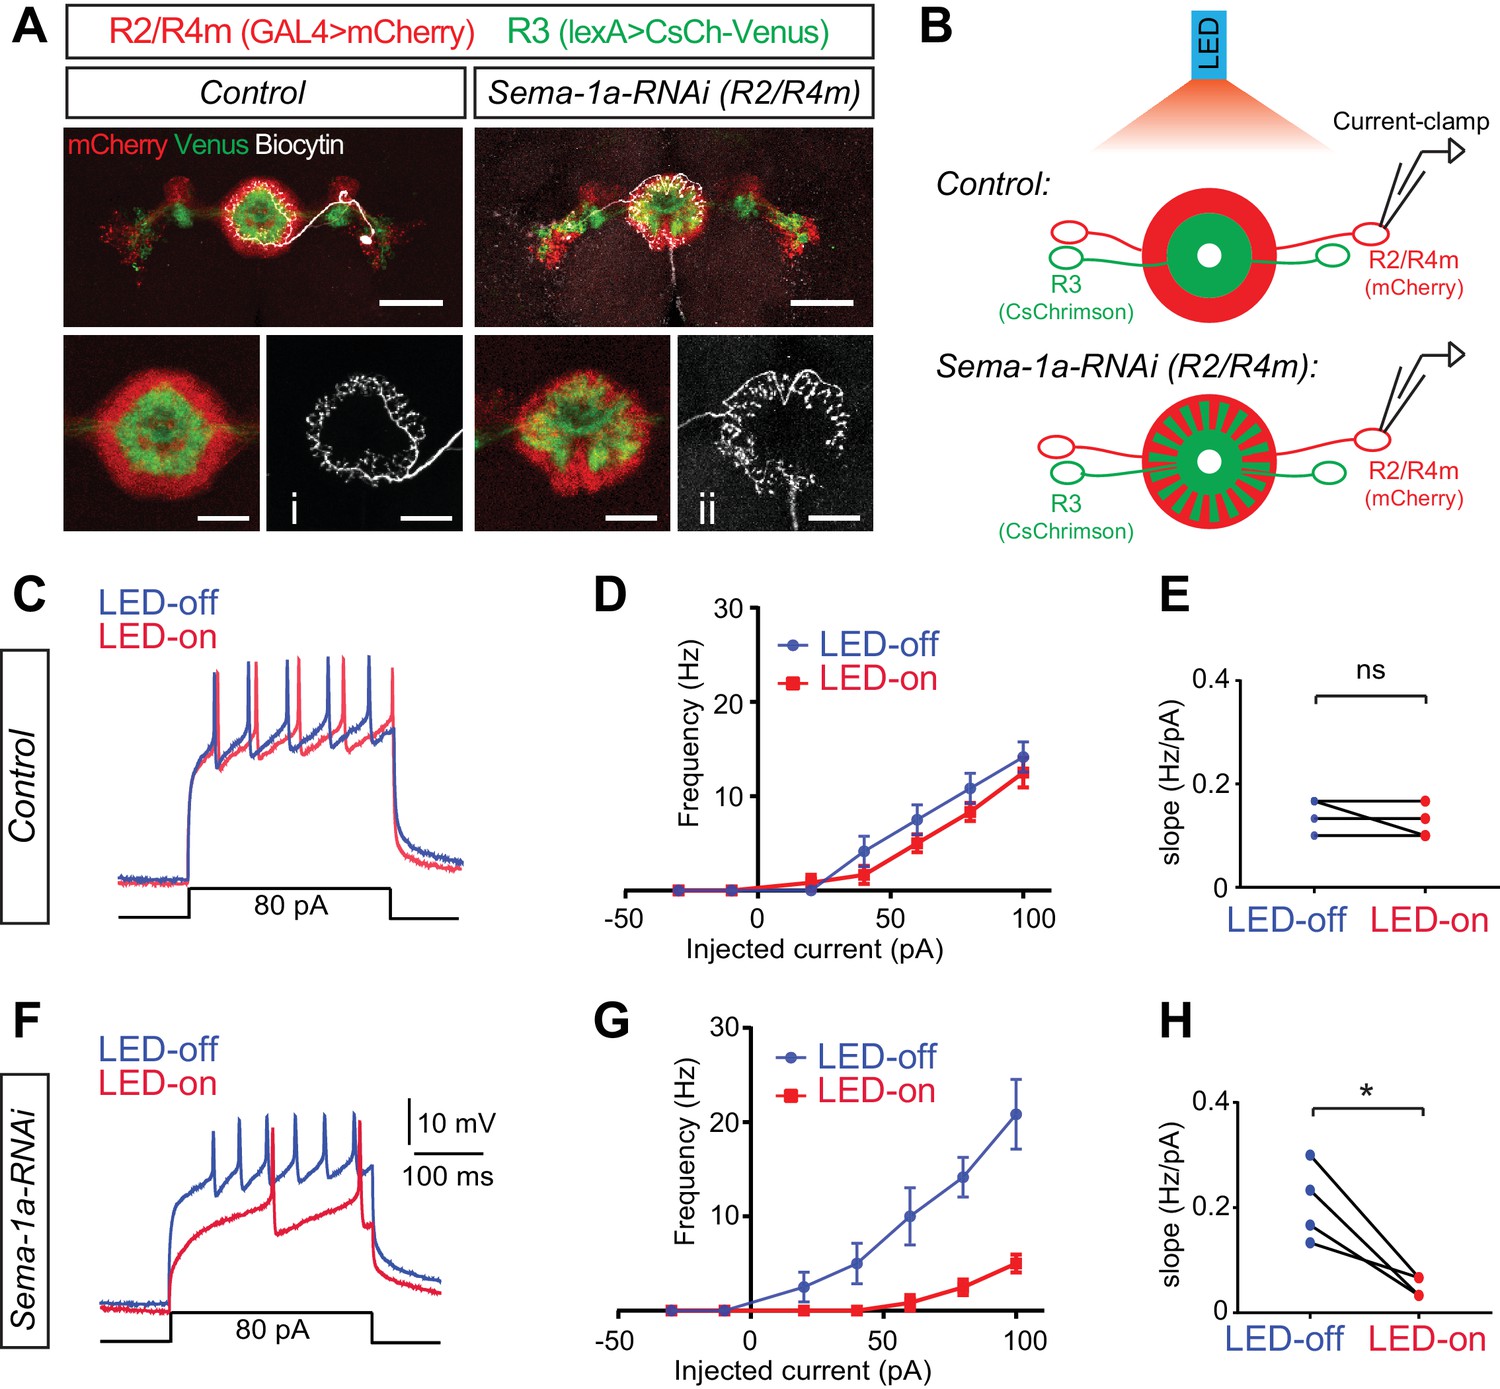
Loss of Sema-1a in R2/R4m neurons increases R2/R4m inhibition in response to R3 neuron activation.
(A) In the photo-stimulation and recording experiments, R2/R4m neurons were labeled by R32H08-GAL4-driving mCherry (red) and R3 neurons expressed CsChrimson-Venus (green) driven by R46D01-LexA in adult fly brains. Note the separation of R3 and R2/R4m rings in the control brain (left) and intermingling of R3 and R2/R4m rings in the R32H08-GAL4-driving Sema-1a-RNAi brain (right). Injection of Biocytin after recording and Alexa647-Streptavidin staining revealed the morphology and identify of recorded R2 and R4m neurons. Scale bars are 50 μm in large panels and 20 μm in small panels. (B) Diagrams highlight the experimental design of photostimulation of R3 neurons and patch-clamp recording of single R2 or R4m neurons in ex vivo cultured adult fruitfly brains. Control and RNAi flies share all the transgenes for R3 neuron optogenetic manipulation and R2/R4m neuron labeling, except that Sema-1a-RNAi was expressed in R2/R4m neurons in RNAi flies. (C) Example traces show that current injections evoked neuronal spiking in R2/R4m neurons in a control fruitfly brain. Blue lines indicate voltage trace without LED light and red lines indicate voltage trace with LED light. (D) F-I curve of the R2/R4m cells from control R2/R4m cells with (red) or without (blue) LED light stimulation of R3 neurons (n = 4 cells from 4 animals). Data are shown as mean±SEM. (E) Comparisons of F-I slopes in D. Each symbol represents one cell (n = 4). LED-off: 0.142 ± 0.032 Hz/pA; LED-on: 0.125 ± 0.032 Hz/pA; p=0.391. (F–H) Similar to C-E for Sema-1a-RNAi expressing R2/R4m cells (n = 4). In panel H, LED-off: 0.208 ± 0.074 Hz/pA; LED-on: 0.050 ± 0.019 Hz/pA; p=0.0234. Raw recording data and statistical analyses are available in the Zip file for Figure 7—source data 1.
-
Figure 7—source data 1
Raw data and statistical analysis of electrophysiological recording.
- https://doi.org/10.7554/eLife.25328.025
Figure 7—figure supplement 1
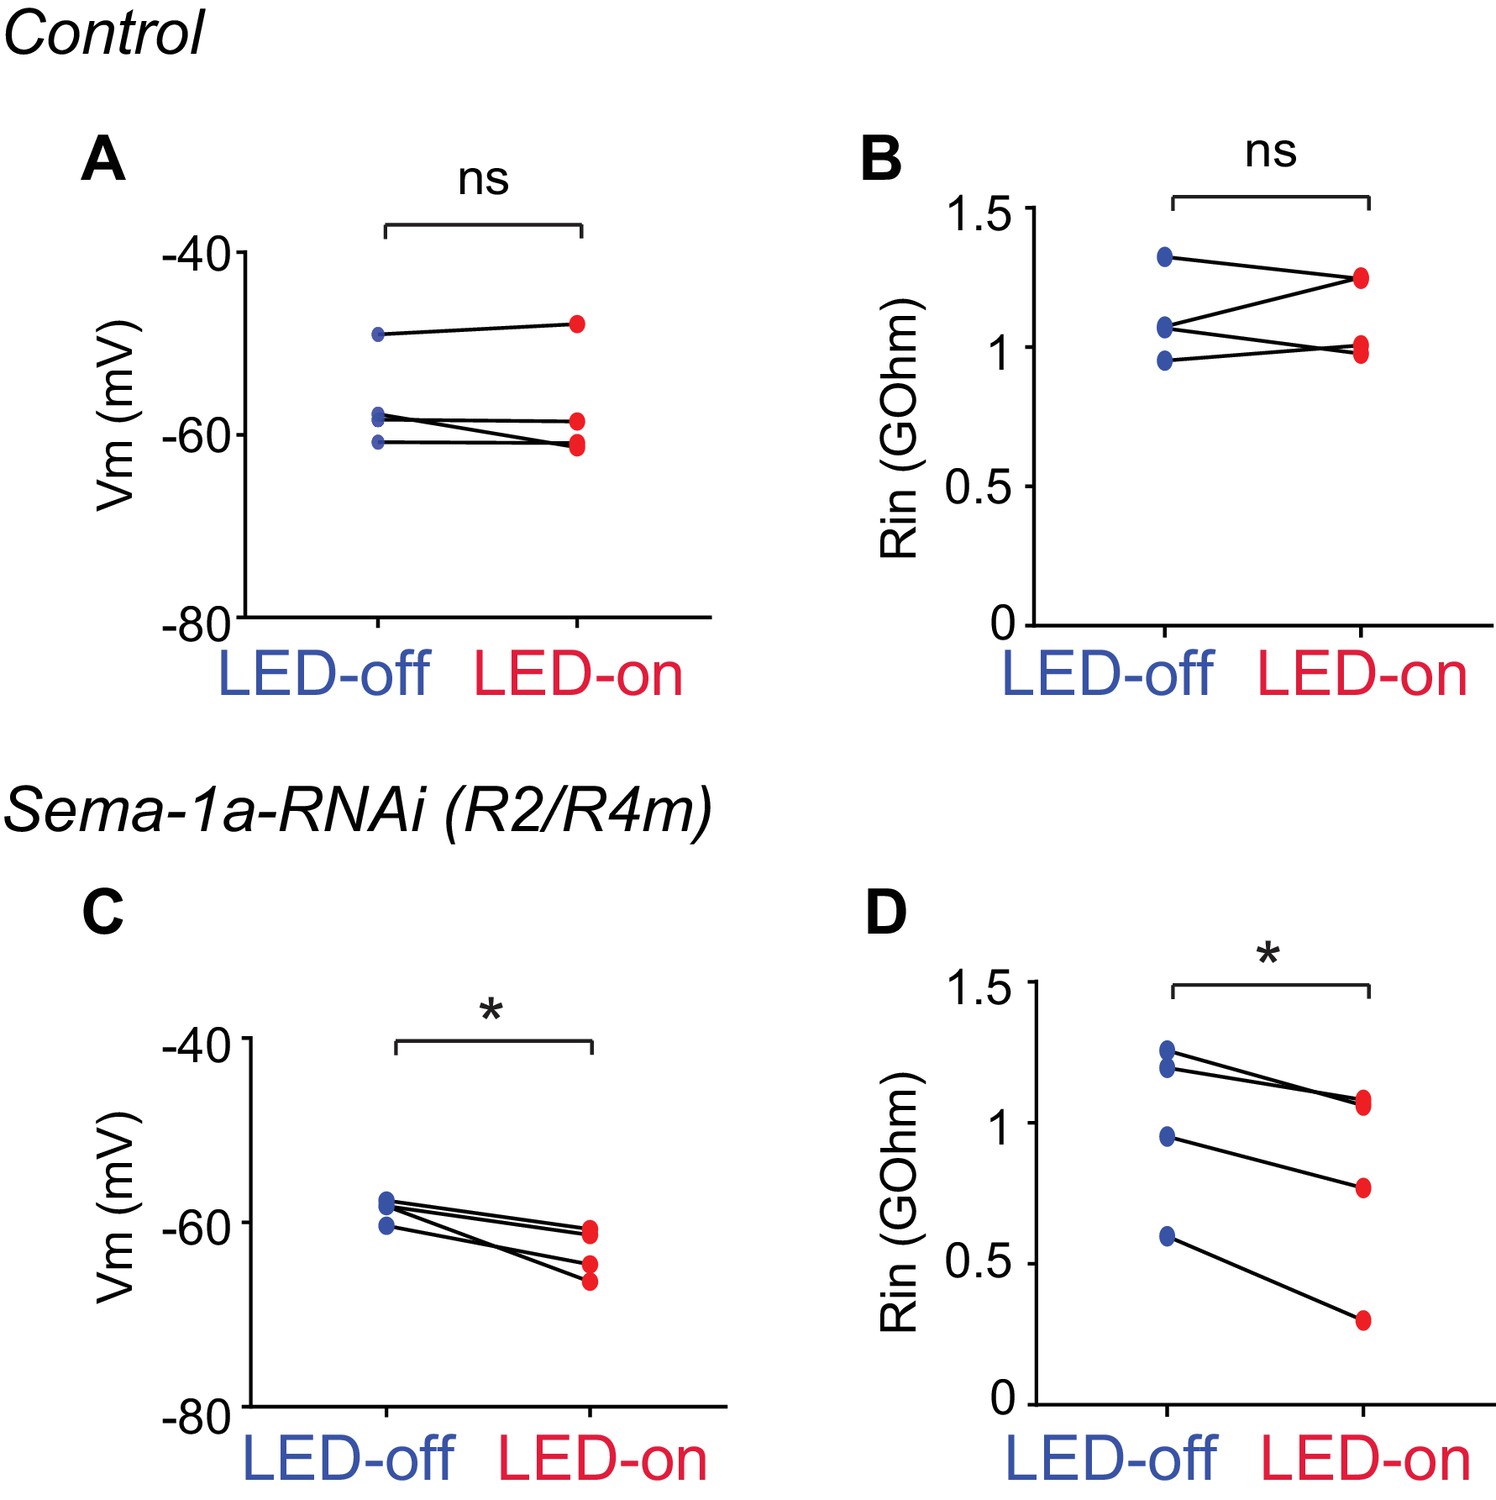
Electrophysiological characterization of R3 and R2/R4m axon-axon inhibition.
(A and C) Comparisons among the resting membrane potentials (Vm) of control (A) and Sema-1a-RNAi (C) R2/R4m cells with (red) or without (blue) LED light stimulation of R3 neurons. In panel A, LED-off: −56.45 ± 5.16 mV; LED-on: −57.14 ± 6.33 mV; p=0.546. In panel C, LED-off: −58.60 ± 1.20 mV; LED-on: −63.26 ± 2.68 mV; p=0.0307. (B and D) Comparisons among the input resistence (Rin) of control (B) and Sema-1a-RNAi (D) R2/R4m cells with (red) or without (blue) LED light stimulation of R3 neurons. In panel B, LED-off: 1.105 ± 0.157 GOhm; LED-on: 1.120 ± 0.148 GOhm; p=0.822. In panel D, LED-off: 1.001 ± 0.299 GOhm; LED-on: 0.803 ± 0.365 GOhm; p=0.0139. Statistical analyses are included in the Zip file Figure 7—source data 1.
Additional files
-
Source code 1
Electrophysiology MATLAB code.
- https://doi.org/10.7554/eLife.25328.027
Download links
A two-part list of links to download the article, or parts of the article, in various formats.
Downloads (link to download the article as PDF)
Open citations (links to open the citations from this article in various online reference manager services)
Cite this article (links to download the citations from this article in formats compatible with various reference manager tools)
The laminar organization of the Drosophila ellipsoid body is semaphorin-dependent and prevents the formation of ectopic synaptic connections
eLife 6:e25328.
https://doi.org/10.7554/eLife.25328


