Neural mechanisms of social learning in the female mouse
- Boston University, United States
- Program in Neuroscience and Behavior, Mount Holyoke College, United States
Figures
Figure 1 with 1 supplement

AOB MCs express robust, slowly emerging self-inhibition.
(A) Schematic of dendrodendritic self-inhibition pathway in MCs. (B) Left, dye-filled MC imaged after recording. S, soma; d, dendritic tufts that integrate sensory inputs; p, recording pipette. Right, brief, high-frequency spike trains trigger modest self-inhibition (gray, standard ACSF; black, after blocking inhibition with 15 µM BMI; IPSP, inhibitory postsynaptic potential). (C) Pharmacologically isolated self-inhibition in AOB MCs. Colored traces show individual cells; black trace, average; mean Vinh = −1.4 ± 0.27 mV (n = 8 cells in 5 mice). (D,E) Prolonged firing elicits robust MC self-inhibition in AOB but not MOB (black and purple respectively). Boxes show expanded view of barrages of IPSPs in AOB MCs, indicated by arrowheads, which only emerge after several seconds of firing. (F) Self-inhibition contributes to stronger decay of MC firing rates in AOB during extended stimuli (n = 9 and 9 cells in 5 and 5 mice for AOB and MOB respectively). (G) Initial and final firing rates during MC spike trains in MOB and AOB (purple and gray respectively).
-
Figure 1—source data 1
This spreadsheet contains the initial and final firing rates for the individual neurons shown in Figure 1G.
These data can be opened with Microsoft Excel or with open-source alternatives such as OpenOffice.
- https://doi.org/10.7554/eLife.25421.004
Figure 1—figure supplement 1
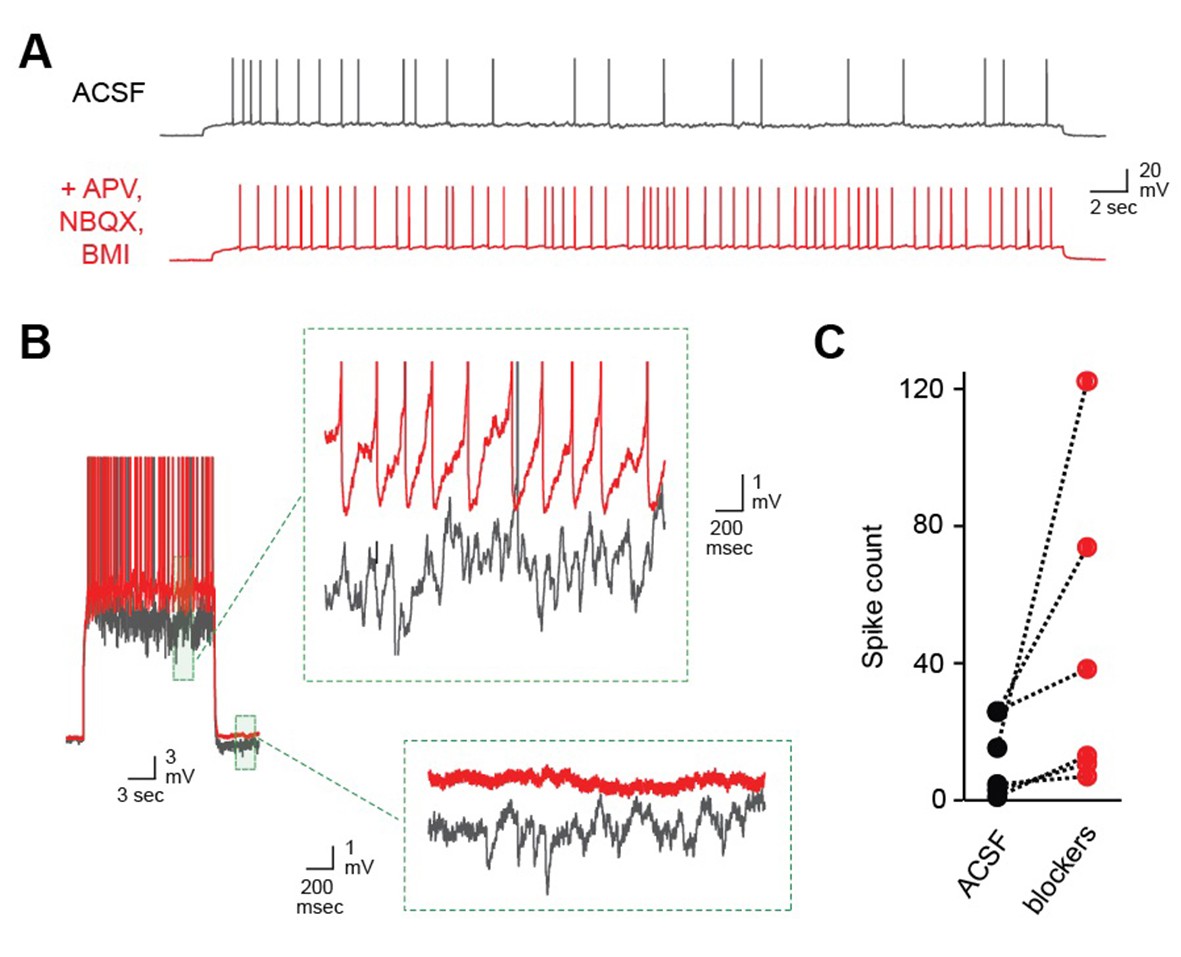
Robust self-inhibition regulates spiking of AOB MCs.
(A) Eliminating self-inhibition by blocking fast synaptic transmission increased the overall firing rate of MCs. (B) Blocking synaptic inhibition also eliminated the barrages of IPSPs that emerged later in train and persisted after the offset of spiking. (C) Firing of AOB MCs is consistently enhanced after blocking inhibition (p=0.06; t-test; n = 6 MCs in 6 mice).
Figure 2 with 3 supplements
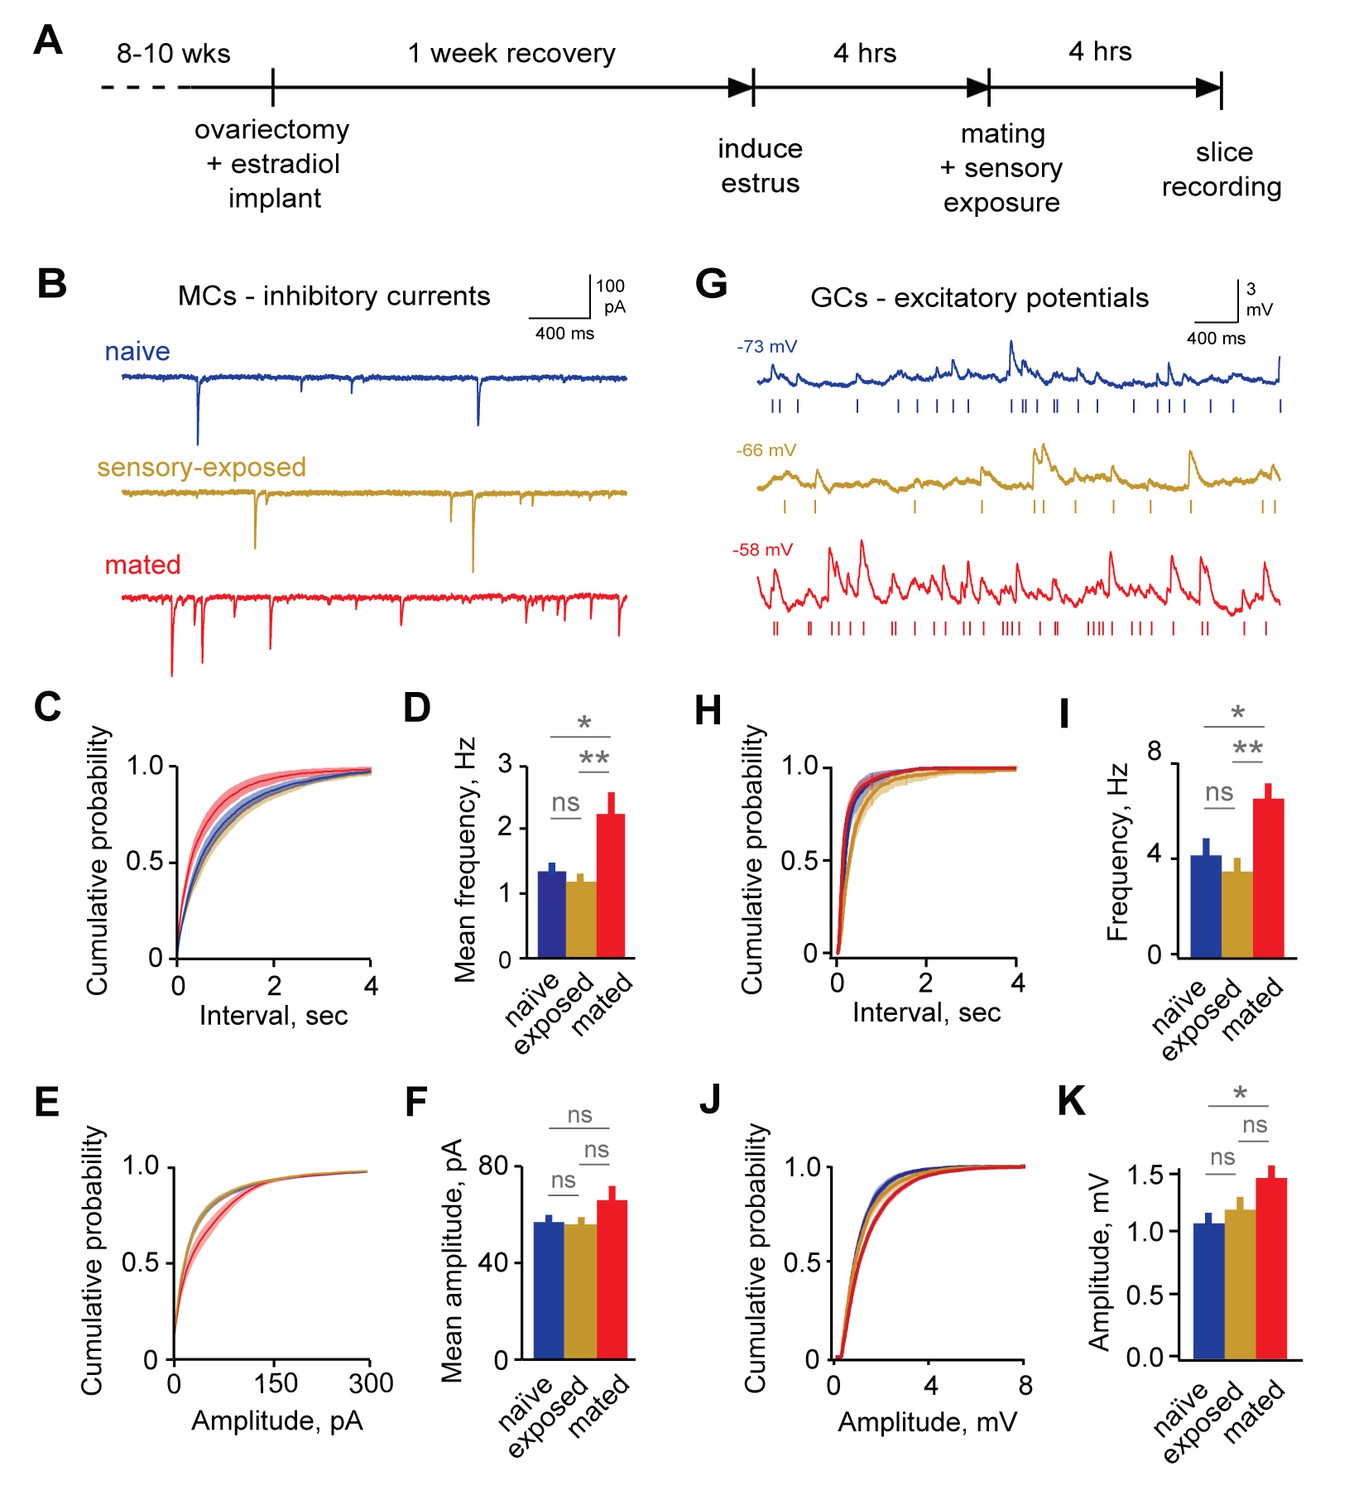
Imprinting drives synaptic plasticity in both MCs and GCs.
(A) Schematic of timeline for mating, sensory experience, and recording. (B) Inhibitory synaptic inputs recorded in voltage-clamped MCs from naïve, sensory-exposed, and mated mice. (C,D) Mating substantially increases mIPSC frequency. Left, cumulative interval distributions; mated < naïve and exposed groups, p=0.002 and 0.001 respectively. Right, mean frequency (F = 5.88; Fc = 3.20; p=0.005 for mated vs. naïve; ANOVA with post-hoc Tukey test; n = 18, 17, and 15 cells in 5, 5, and 6 mice respectively). (E,F) The mean amplitude of mIPSCs was not significantly changed by imprinting (F = 1.74; Fc = 3.20; p=0.19; ANOVA with post-hoc Tukey test), although distributions were significantly shifted towards smaller values in the mated vs. naïve and sensory-exposed groups (p=0.00007 and 3 × 10⁻⁷ respectively. (G) Example traces showing spontaneous EPSPs in GCs from naïve, sensory-exposed and mated mice. Rasters indicate synaptic events used for analysis. (H,I) Mating increased mean sEPSP frequency relative to both naïve and sensory-exposed animals (F = 6.64; Fc = 3.14; p=0.00037 and 0.038 for mated vs. exposed and naïve mice respectively; ANOVA with post hoc Tukey test; n = 17, 19, and 30 cells in 5, 9, and 12 mice). Interval distributions were significantly smaller for mated vs. exposed and naïve animals (p=1×10⁻¹¹ and 0.0008 respectively). (J,K) Mating also increased mean sEPSP amplitude in mated vs. naïve animals. Left, cumulative distribution; right, mean amplitude (F = 3.56; Fc = 3.14; p=0.037 for naïve vs. mated, ANOVA with post hoc Tukey test). Amplitude distributions were larger for mated vs. naïve mice (p=0.04). NS, not significant; *p<0.05; **p<0.001.
-
Figure 2—source data 1
This spreadsheet contains the mean frequency and amplitude data for the individual neurons used to generate the bar plots shown in Figure 2D and F (mitral cell mIPSCs) and 2I and 2K (granule cell mEPSCs).
These data can be opened with Microsoft Excel or with open-source alternatives such as OpenOffice.
- https://doi.org/10.7554/eLife.25421.007
Figure 2—figure supplement 1
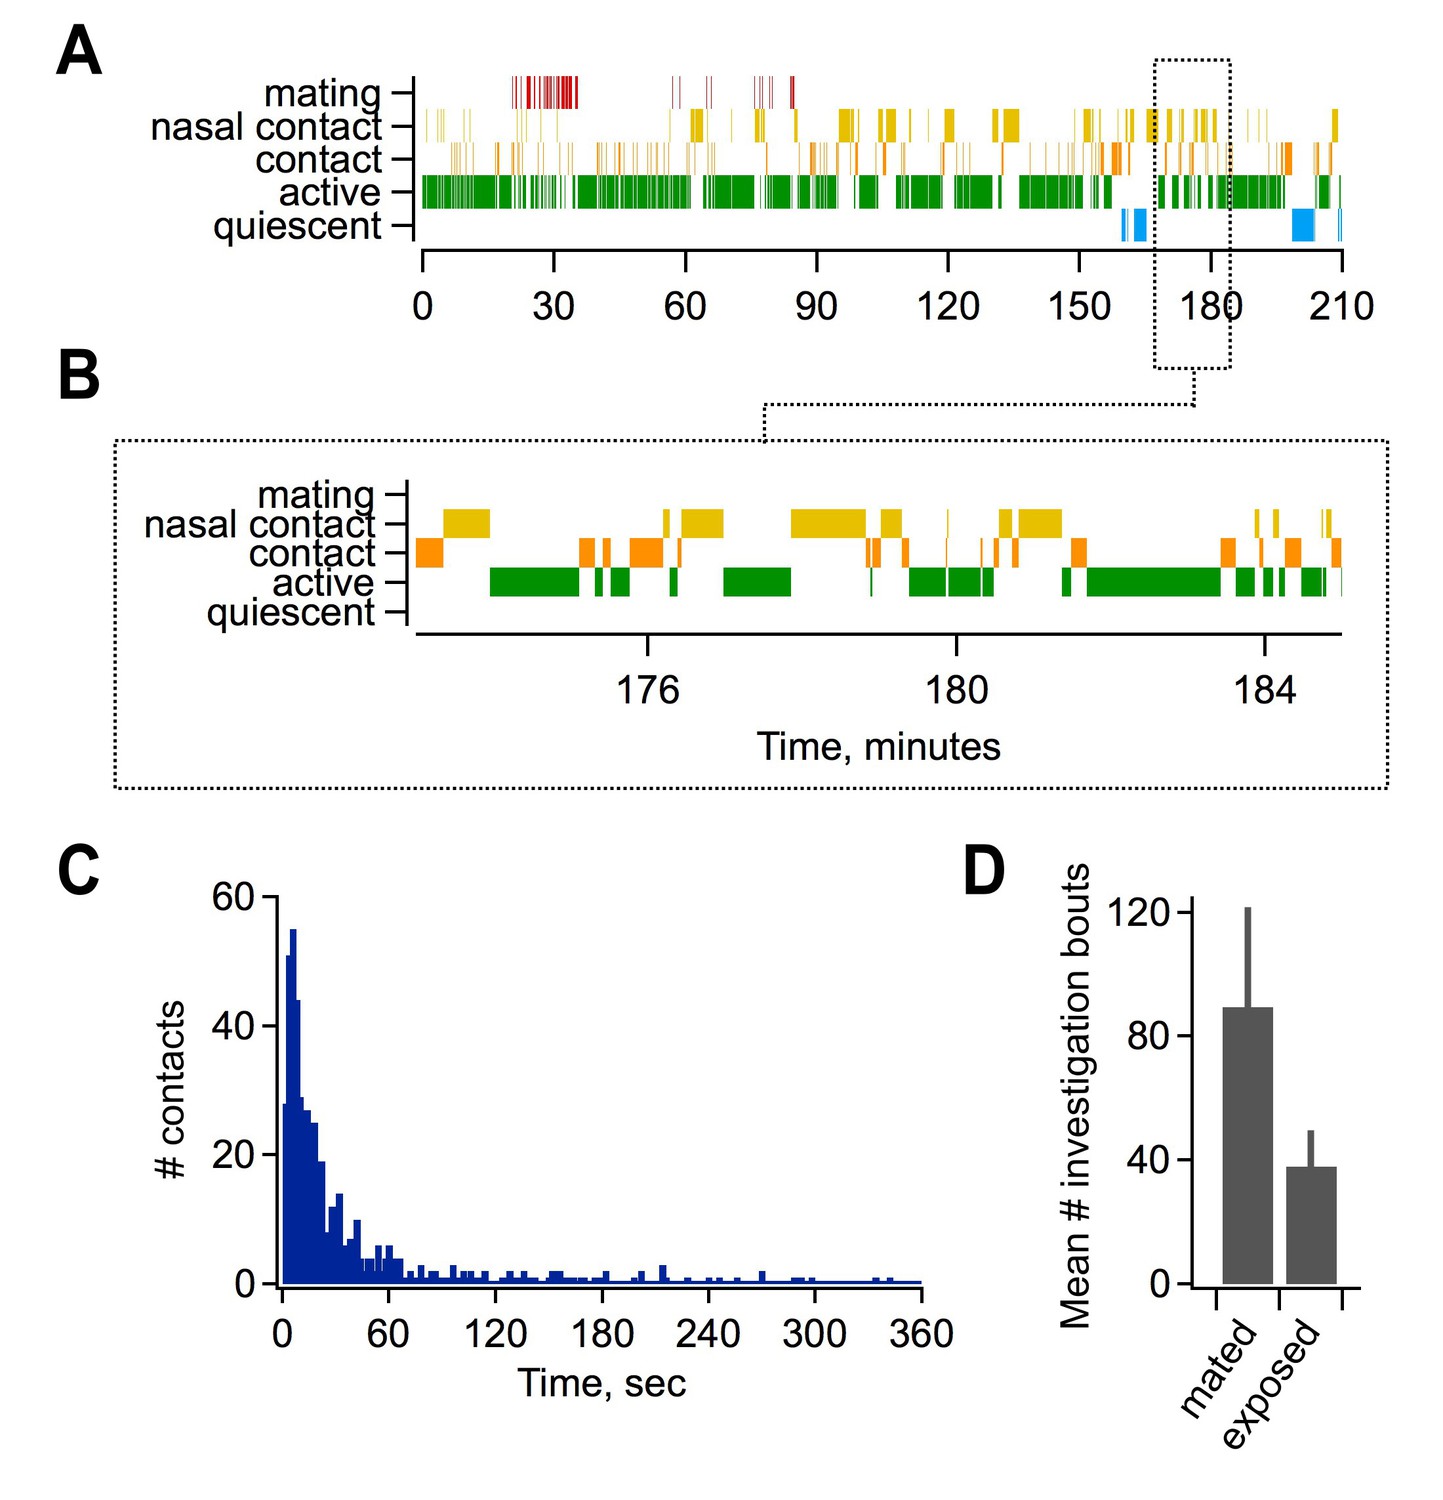
Mating and sensory interactions during pairing.
(A) Video analysis of characteristic post-mating behavior between females and males. Top, mating typically occurred early during the pairing period (red), followed by extensive and repetitive behavioral encounters including direct nasal contact required for vomeronasal activation (yellow). Bottom, expanded view of approximately 10 min of female-male interactions. (B) Distribution of intervals between investigatory bouts in the mated group (mean, 62.1 ± 7.99 s; median, 15.9 s; n = 554 bouts in 7 animals). (C) Investigatory behavior is elevated in mated relative to sensory-exposed groups (mean bouts per female, 89.5 ± 32.1 vs. 38 ± 11.6 respectively; n = 7 animals per group).
Figure 2—figure supplement 2
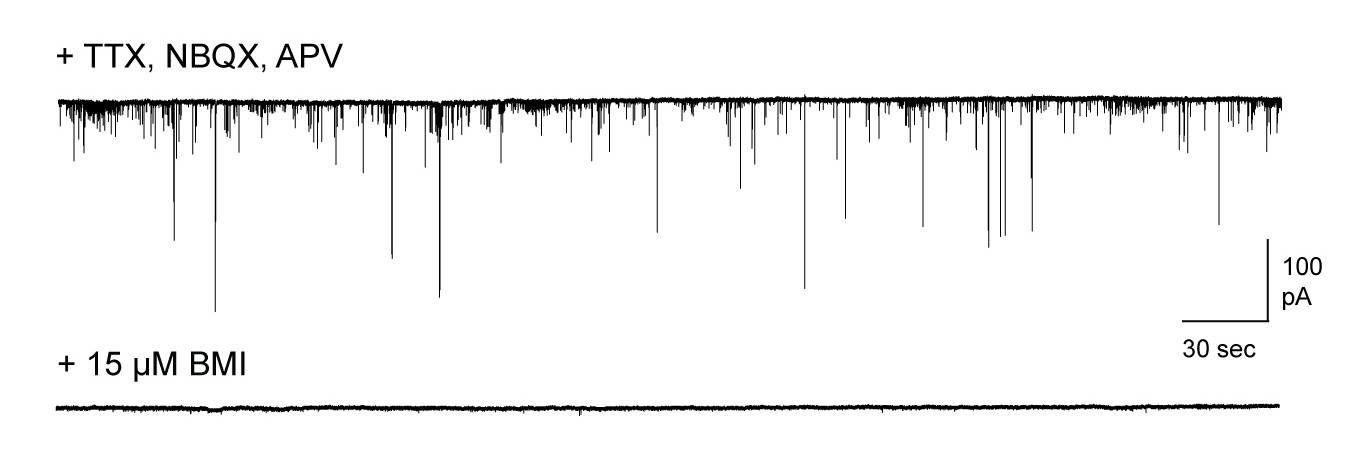
Pharmacologically isolated inhibitory synaptic currents in MCs.
Top, inward currents recorded from voltage-clamped MCs using high-chloride pipette solution, measured in the presence of TTX, NBQX, and APV. Bottom, miniature currents were completely blocked by addition of 15 µM bicuculline.
Figure 2—figure supplement 3
Synaptic effects in GCs are independent of event detection criteria.
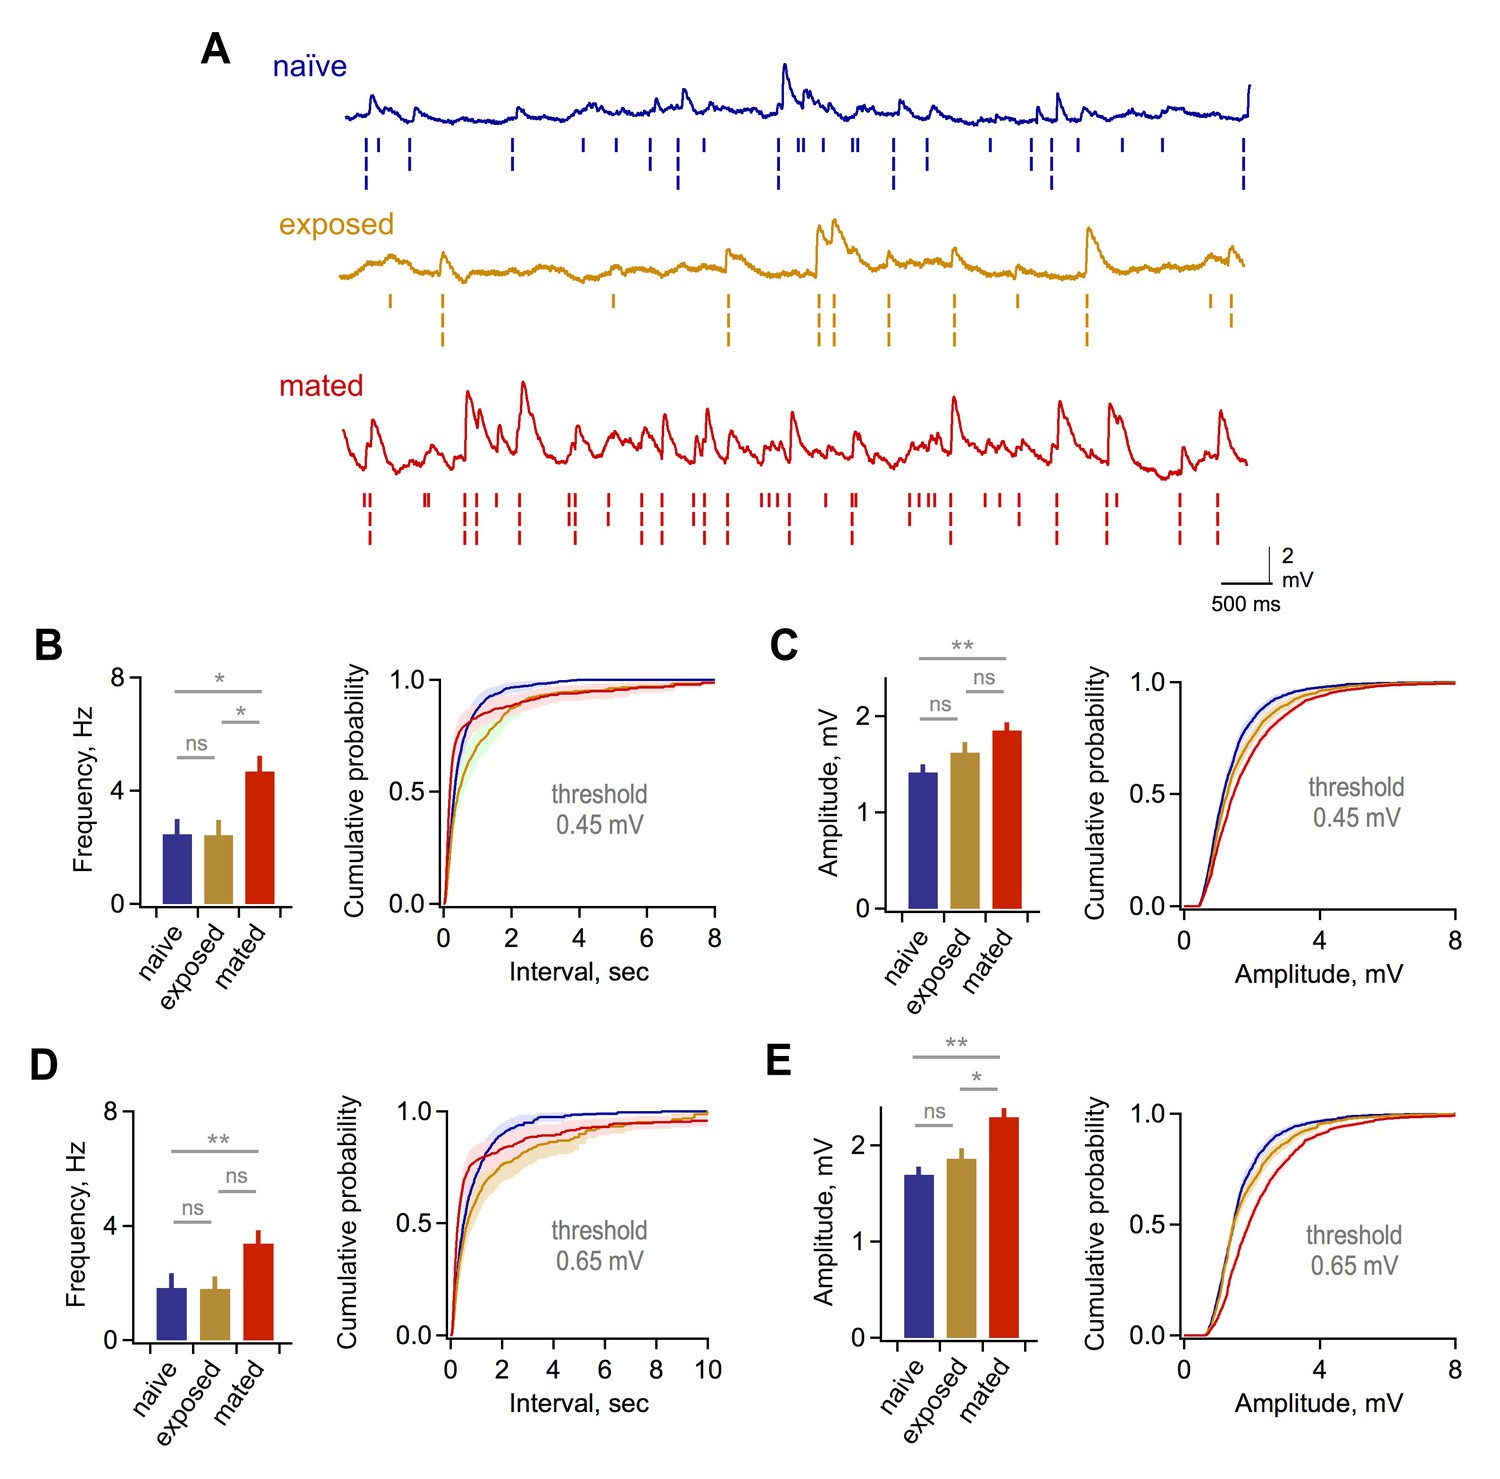
(A) Raw data traces with rasters showing synaptic events detected using thresholds of 0.25, 0.45, and 0.65 mV. (B) Mean frequency (left) and cumulative distribution of interevent interval (right) for excitatory synaptic input using a detection threshold of 0.45 mV. Mean frequency, 2.47 ± 0.53, 2.43 ± 0.53, and 4.69 ± 0.55 Hz; F = 5.93; Fc = 3.14; p=0.012 and 0.038 for mated vs exposed and naïve groups respectively. (C) Mean and cumulative distribution of EPSP amplitudes for the same criteria. Mean amplitudes, 1.42 ± 0.08, 1.62 ± 0.11, and 1.85 ± 0.08 mV for naïve, exposed, and mated groups respectively. F = 5.58; Fc = 3.14; p=0.0047 for mated vs. naïve groups. (D,E) Corresponding plots using a threshold of 0.65 mV. Mean frequency, 1.84 ± 0.51, 1.80 ± 0.42, and 3.38 ± 0.46 Hz; F = 3.89; Fc = 3.14; p=0.048 for mated vs naïve groups. Mean amplitude, 1.70 ± 0.08, 1.86 ± 0.11, and 2.29 ± 0.09 mV for naïve, exposed, and mated groups respectively. F = 10.52; Fc = 3.14; p=0.0021 and 0.0062 for mated vs. naïve and exposed groups respectively. *p<0.05; **p<0.005; all p values calculated using ANOVA with post-hoc Tukey test.
Figure 3 with 1 supplement

Synaptic plasticity is uncorrelated with activation during mating.
(A) Arc-GFP labeling of AOB GCs activated by the stud male, visualized with live-tissue 2-photon imaging. Left, naïve control animal; right, mated female. (B) Fluorescence-targeted recordings of both unlabeled and labeled populations of GCs. (C,D) Mean amplitude and frequency of sEPSPs are similar for GFP(-) and GFP(+) GCs in mated mice (amplitude: p=0.82; frequency, p=0.58; t-test; n = 9 and 13 cells in 10 mice, GFP(+) and (-) groups subdivided from data in Figure 3—figure supplement 1). (E,F) GFP labeling is uncorrelated with either amplitude or frequency of spontaneous excitatory input to GCs (regression slope not different from zero; amplitude: p=0.70 and 0.22 for sensory-exposed and mated groups respectively; frequency: p=0.50 and 0.92; linear regression t-test; n = 17, 19 and 30 neurons in 5, 9, and 12 mice for naïve, exposure and mated groups). (G) Fos-GFP labeling reveals a subpopulation of mating-activated MCs (arrowheads). (H) Targeted recordings of stud-activated MCs. (I,J) Mean amplitude and frequency of mIPSCs are not significantly different between GFP(-) and GFP(+) MC populations (p=0.33 and 0.38 respectively; t-test; n = 8 and 5 cells in 5 mice; groups subdivided from data in Figure 2). (K,L) Amplitude and frequency of mIPSCs show no correlation with Fos-GFP intensity in MCs (regression slope not different from zero; p=0.64 and 0.97 respectively; linear regression t-test; n = 16 neurons from 5 mice). Dashed lines show 95% confidence intervals.
-
Figure 3—source data 1
This spreadsheet contains the mean frequency and amplitude data for the individual neurons used to generate the bar plots shown in Figures 3C, D, I and J, comparing synaptic inputs to GFP(-) and GFP(+) neurons.
These data can be opened with Microsoft Excel or with open-source alternatives such as OpenOffice.
- https://doi.org/10.7554/eLife.25421.012
Figure 3—figure supplement 1
Mating increases fluorescent labeling in AOB and increases inhibitory synaptic input onto MCs.
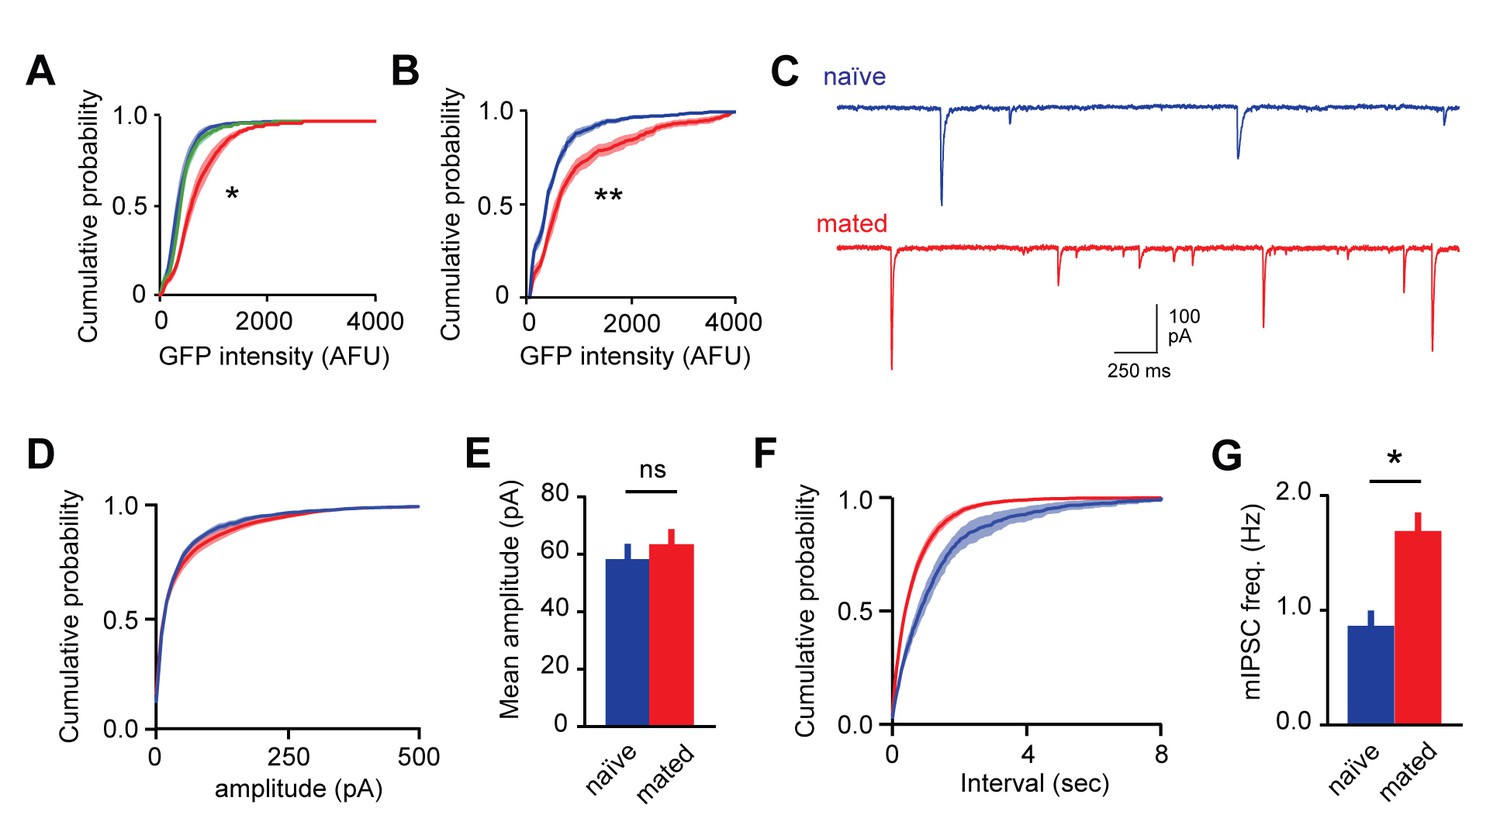
(A) Cumulative histogram of Arc-GFP intensity. Mating, but not sensory exposure alone, increases labeling in GCs (p<10−45, Kolmogorov–Smirnov test; n = 14, 9, and 18 slices for naïve, sensory-exposed, and mated groups respectively). (B) Mating produces robust increases in Fos-GFP labeling of MCs (p=0.0004, Kolmogorov–Smirnov test; n = 8 and 7 slices from 4 and 5 mice for naïve and mated groups respectively). (C) Representative synaptic currents measured from naïve and mated females. Currents are inward due to a high chloride recording solution. (D) Cumulative distribution of event amplitude (p<0.001; Kolmogorov–Smirnov test; n = 6 and 16 cells in 3 and 5 mice). (E) The mean amplitude of inhibitory currents is unchanged in MCs from naïve and mated (red) animals (p=0.29; t-test). (F,G) Mating increased the frequency of inhibitory input to MCs, reflected in both the leftward shift in the distribution of event intervals and increase in mean frequency (p=0.001; t-test).
Figure 4
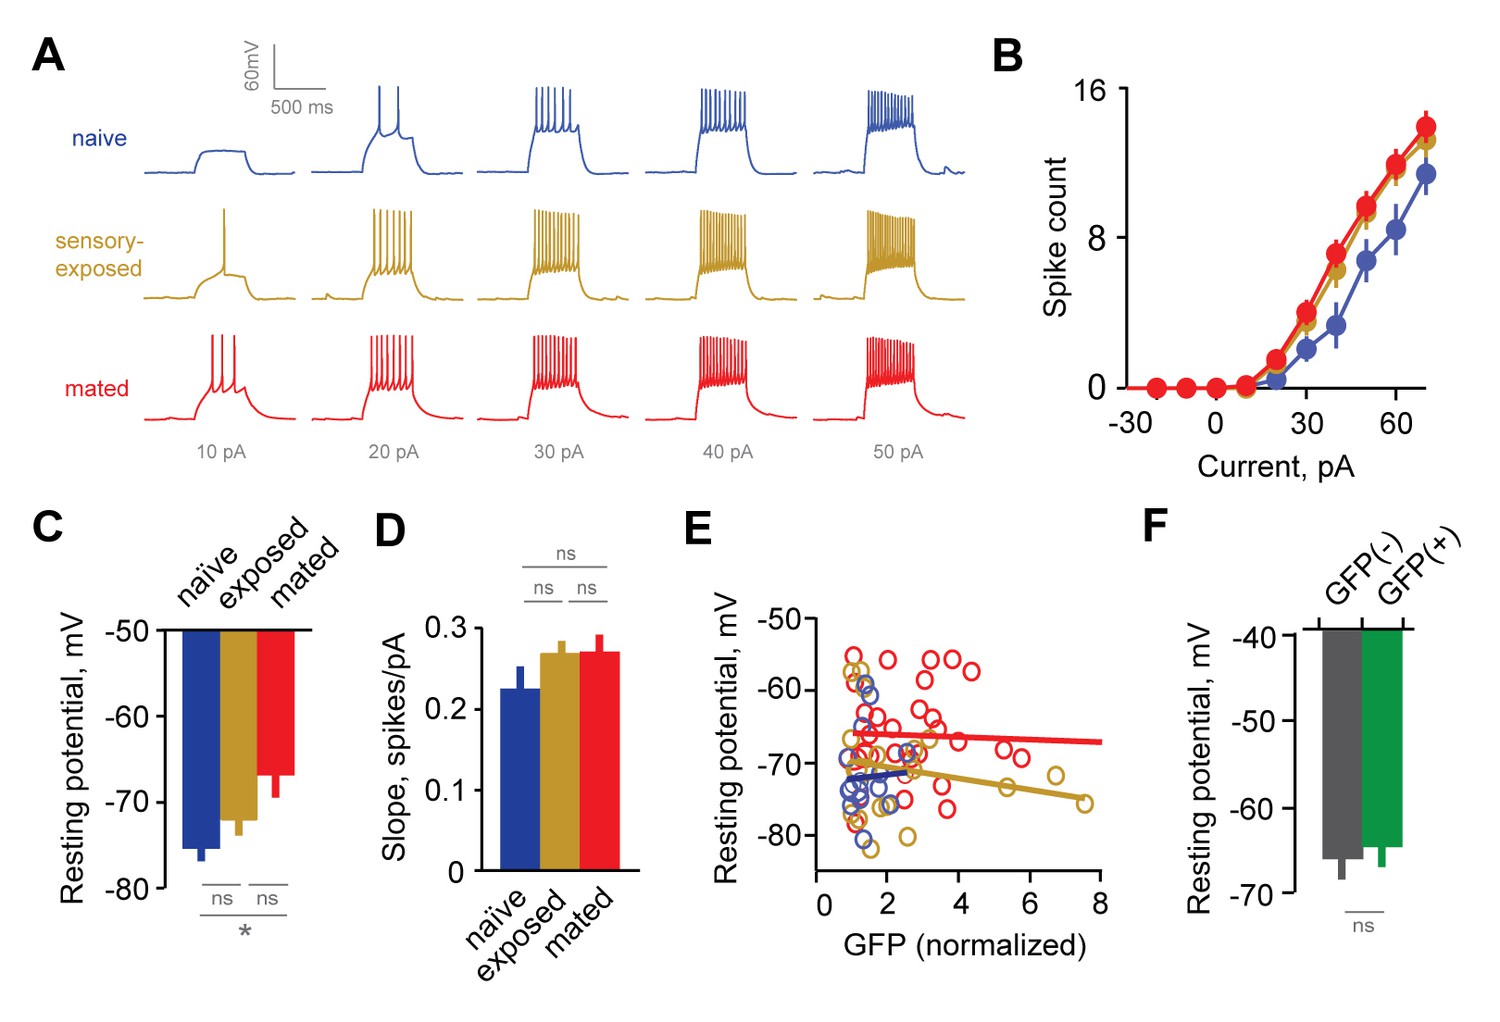
Experience alters intrinsic excitability of interneurons.
(A) Representative responses to graded current injection for GCs from naïve, sensory-exposed and mated mice. (B) Current-firing plot shows a shift towards increased excitability of GCs from both mated and sensory-exposed females. (C) GC resting membrane potential was significantly hyperpolarized after mating (p=0.008 for mated vs. naïve; ANOVA with post-hoc Tukey test; F = 5.18; Fc = 3.14; n = 17, 19, and 31 cells from 5, 9, and 12 mice for naïve, sensory-exposed, and mated groups respectively). (D) The slope of the current-firing function was similar across groups (0.28 ± 0.01, 0.27 ± 0.02, and 0.28 ± 0.01; F = 0.14; Fc = 3.15; p=0.87; ANOVA with post-hoc Tukey test). (E) GC resting potential was uncorrelated with intensity of Arc-GFP labeling in both sensory-exposed and mated animals (slope not significantly different from zero; p=0.87, 0.37 and 0.81 for naïve, sensory-exposed and mated groups respectively; linear regression test; n = 17, 19 and 31 cells in 5, 9 and 12 mice). (F) In mated females, resting potential was indistinguishable between GFP(-) and GFP(+) GCs (−66.8 ± 2.19 vs. −65.4 ± 1.85 mV respectively; p=0.62, t-test; n = 10 and 13 cells in 10 mice, subdivided from the mated group in panel E). NS, not significant; *p<0.01.
-
Figure 4—source data 1
This spreadsheet contains the resting membrane potential and firing rate data for the individual neurons used to generate the bar plots shown in Figures 4C, D and F.
These data can be opened with Microsoft Excel or with open-source alternatives such as OpenOffice.
- https://doi.org/10.7554/eLife.25421.015
Figure 5
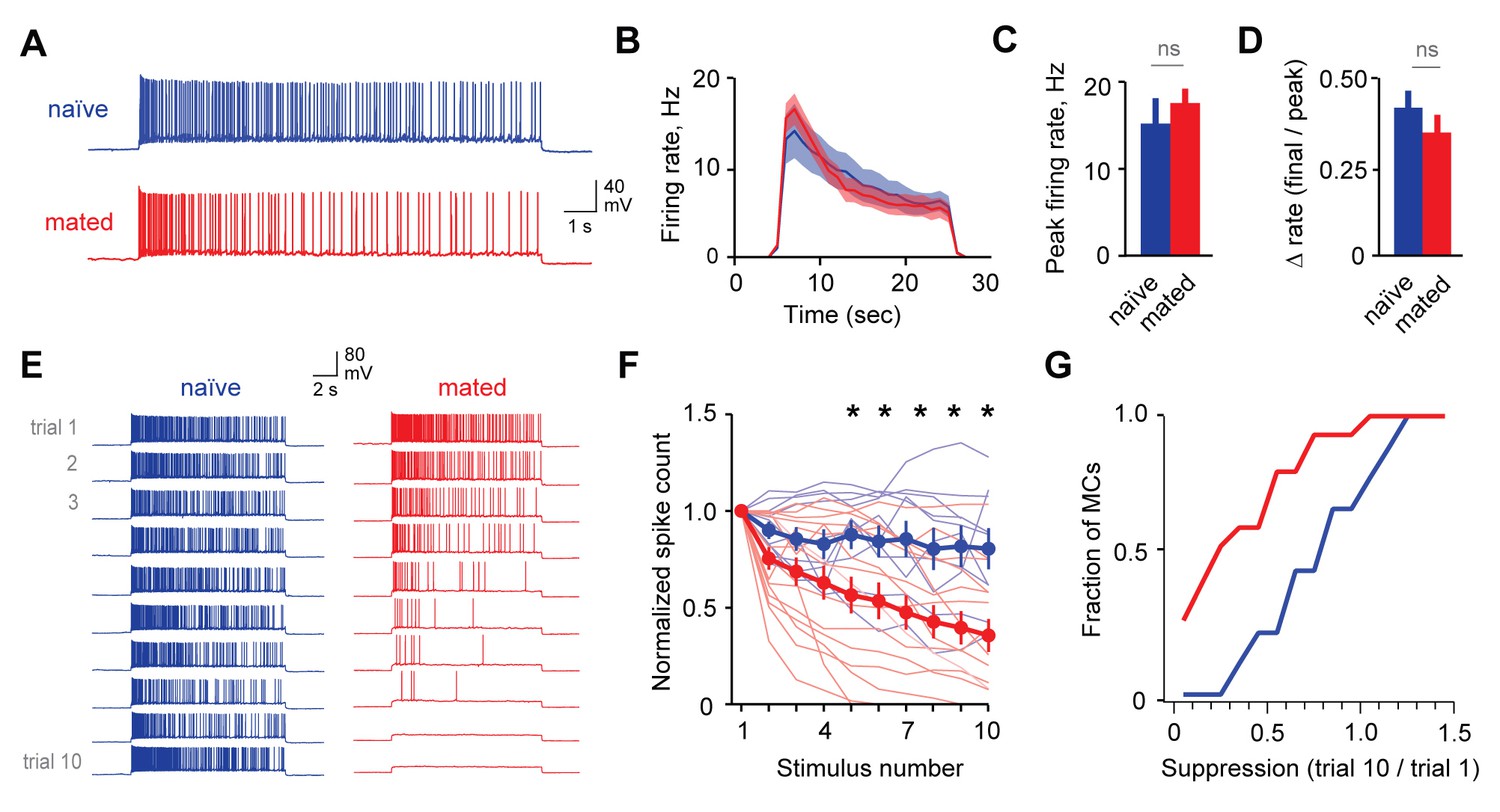
Mating reduces the responsiveness of MCs to repetitive inputs.
(A) MC firing to an initial current stimulus is similar for naïve and mated females. (B) Firing rate profile averaged across all MCs from naïve and mated animals. (C, D) Mating has no effect initial MC output (peak firing rate: p=0.51; change in firing rate: p=0.55; t-test; n = 10 and 15 cells from 5 and 7 mice for naïve and mated groups respectively). (E) Example MC responses to repetitive stimulation. Firing is stable over time in naïve females, but drops dramatically over time after mating. (F) Average MC output across successive stimuli for naïve (blue) and mated females (red). Firing on 10th trial is 80 ± 11% (naïve) vs. 36 ± 8% of 1st trial (mated); F = 10.01, Fc = 4.30, p=0.003; ANOVA with post-hoc Tukey test. Light colors show individual neurons; dark traces show mean ± SEM. (G) Cumulative histogram showing increased attenuation in MCs from mated animals (p=0.027; Kolmogorov-Smirnov test; n = 9 and 15 neurons from 5 and 7 mice respectively). NS, not significant. *p<0.05; **p<0.01.
-
Figure 5—source data 1
This spreadsheet contains the firing rate and spike count data for mitral cells used to generate the bar plots and average data shown in Figures 5C, D and F.
These data can be opened with Microsoft Excel or with open-source alternatives such as OpenOffice.
- https://doi.org/10.7554/eLife.25421.017
Figure 6 with 2 supplements
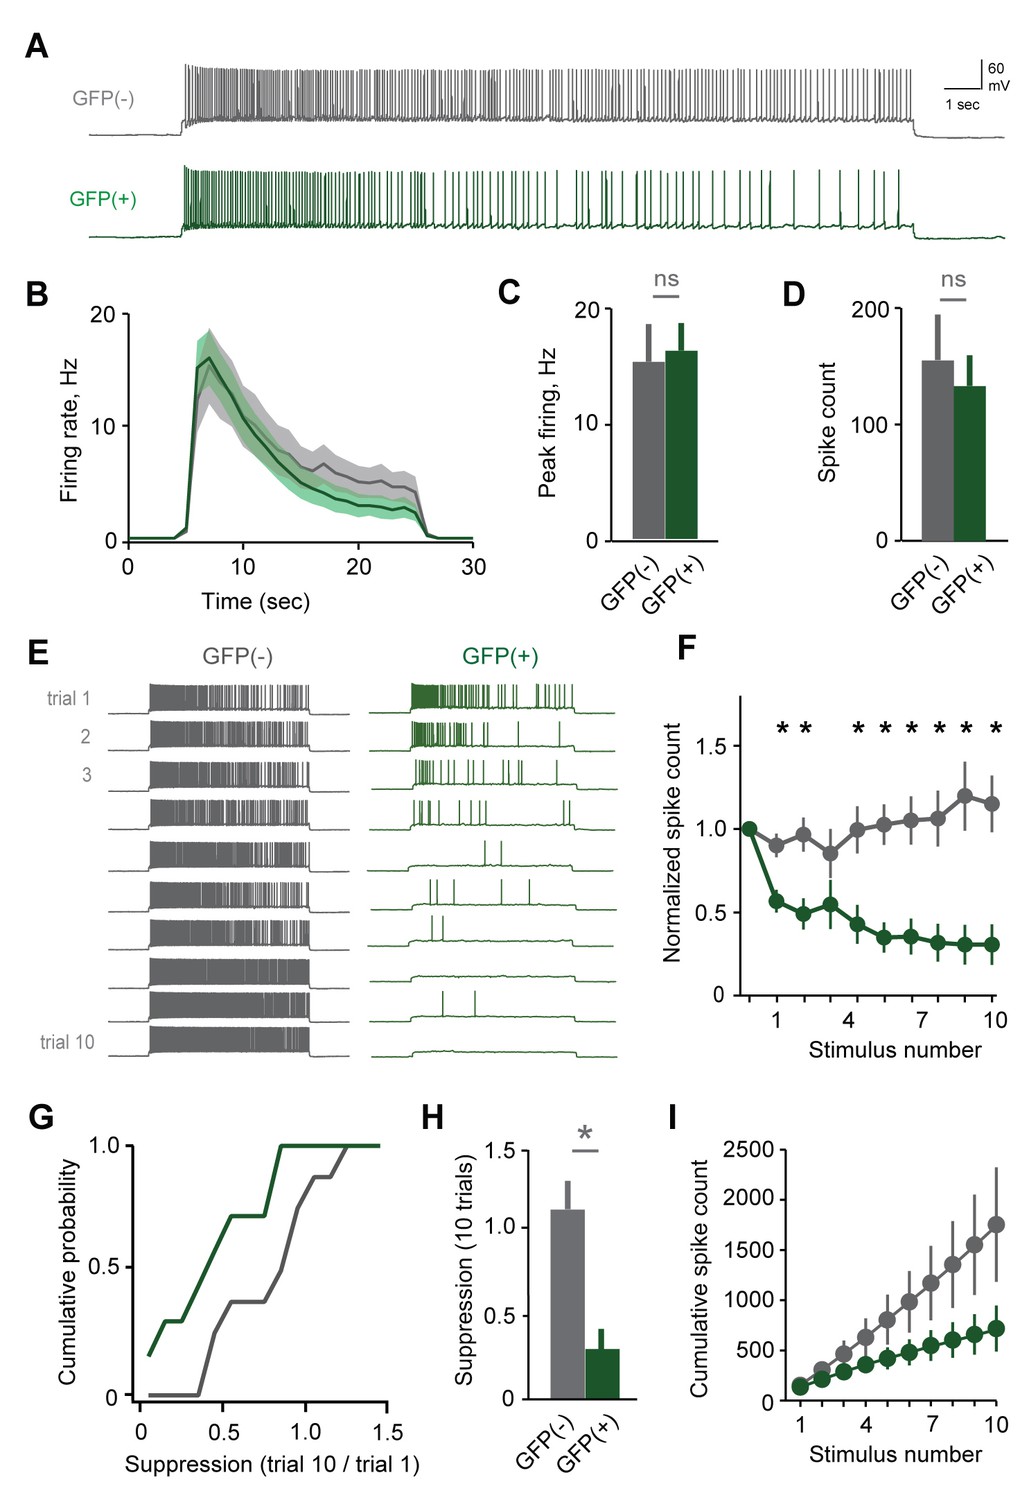
Plasticity in MC responsiveness is specific to mating-activated neurons.
(A) Both GFP(-) and GFP(+) MCs show similar initial responses to current stimuli. (B) Mean firing rate profiles for GFP(+) and GFP(-) MCs in Fos-GFP females after mating (mean ± SEM; n = 7 and 11 cells in 5 and 7 mice). (C, D) Initial MC output is similar between GFP(-) and GFP(+) groups (firing rate, p=0.81; spike count, p=0.63; t-test). (E) Representative MC responses to repetitive stimulation in mated females. (F) After mating, GFP(-) MCs maintain consistent firing, but the output of stud-activated GFP(+) neurons is dramatically attenuated over time (mean ± SEM; n = 7 and 11 cells in 7 mice). (G) Cumulative histograms indicate a shift towards greater suppression in the MCs activated during mating (p=0.18; Kolmogorov-Smirnov test). (H) Mean suppression after 10 trials for GFP(-) and GFP(+) neurons (spike count on 10th vs. 1st trial: unlabeled, 115 ± 17%, p=0.41; labeled, 30.7 ± 12.3%; p=0.0017; t-test). (I) Cumulative action potential output of GFP(-) and GFP(+) MCs, averaged across all recorded neurons.
-
Figure 6—source data 1
This spreadsheet contains the firing rate and spike count data for mitral cells used to generate the bar plots and average data shown in Figures 6C, D, F and H.
These data can be opened with Microsoft Excel or with open-source alternatives such as OpenOffice.
- https://doi.org/10.7554/eLife.25421.019
Figure 6—figure supplement 1
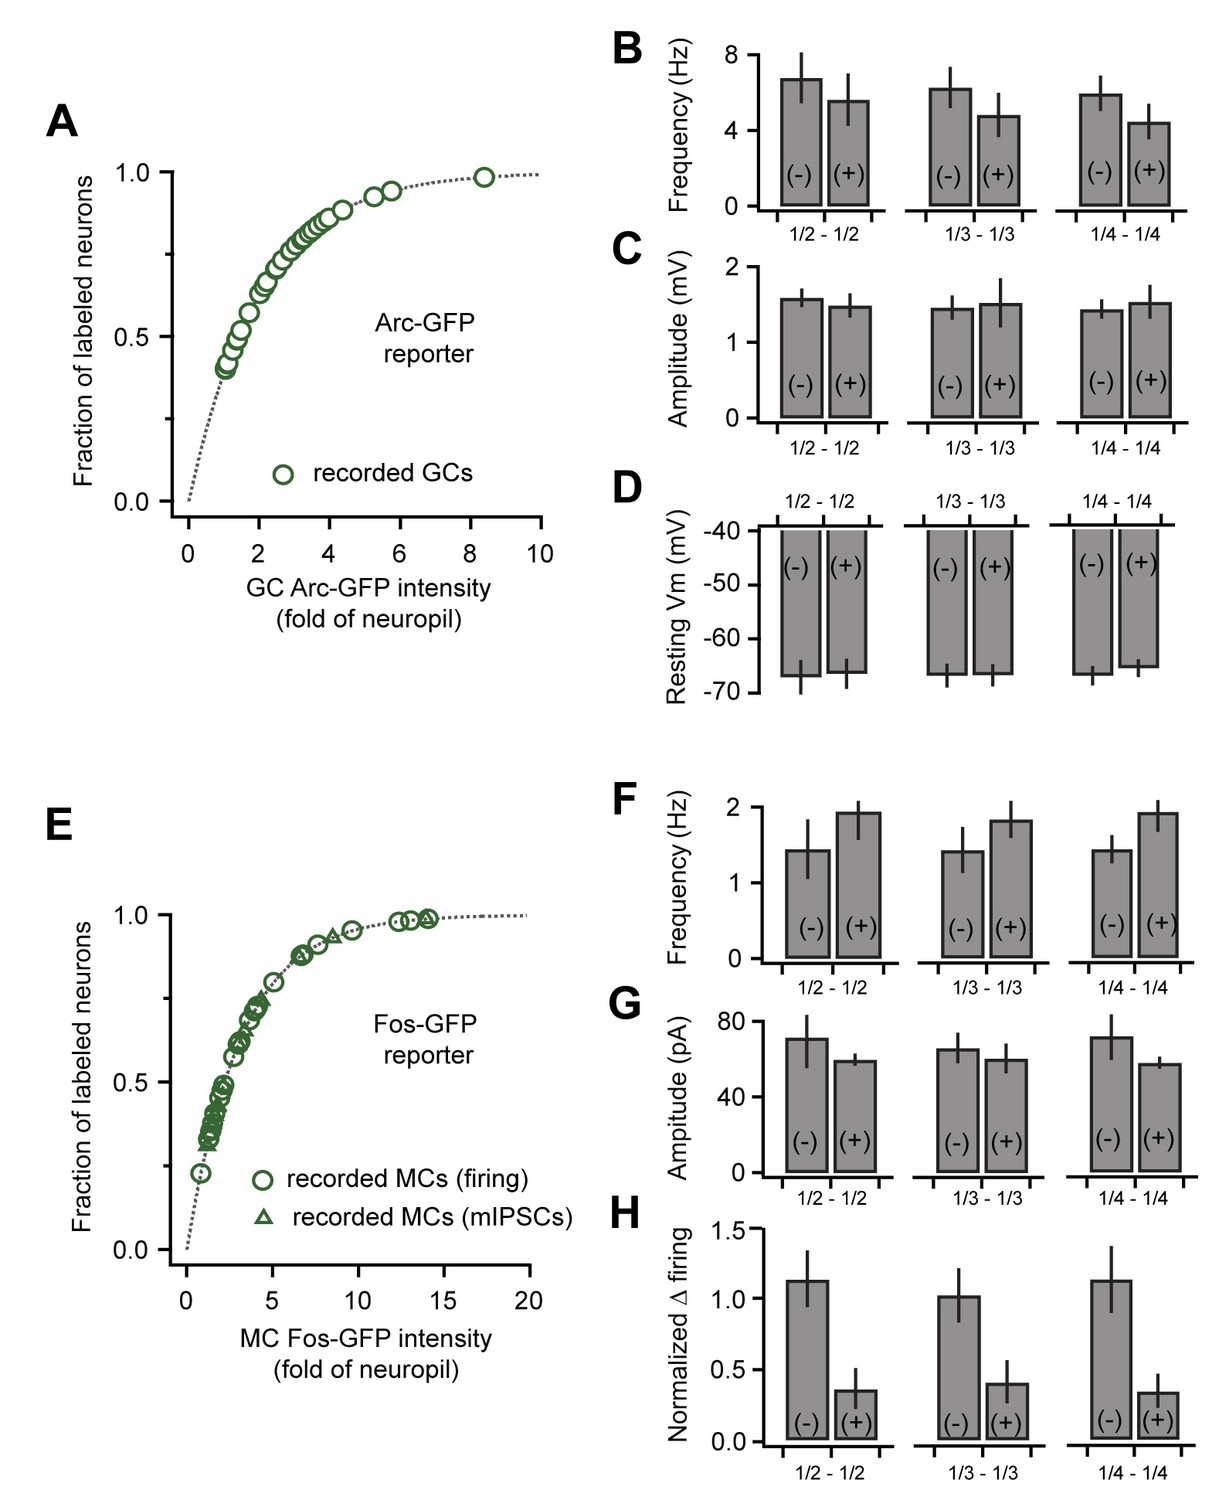
Correlated plasticity and GFP labeling are independent of selection criteria.
(A) Arc-GFP labeling intensity for the GCs in our recording sample (green markers) superimposed on the distribution for all detectable GCs (gray line, normalized exponential fit to imaging data). Our dataset spans the majority of intensity values. (B, C, D) Frequency and amplitude of sEPSPs and resting membrane potential of GCs, respectively. Results comparing GFP(+) and GFP(-) populations are consistent across various selection criteria (upper vs. lower 1/2, 1/3, and 1/4 of the recorded cells). (E) Fos-GFP labeling intensity for recorded MCs as in (A). Triangles indicate cells used to analyze synaptic inhibition; circles, cells used to analyze slow firing suppression. (F, G, H) mIPSC frequency, mIPSC amplitude, and firing rate suppression for repetitive stimuli, respectively. Results were again consistent across a range of selection criteria.
Figure 6—figure supplement 2
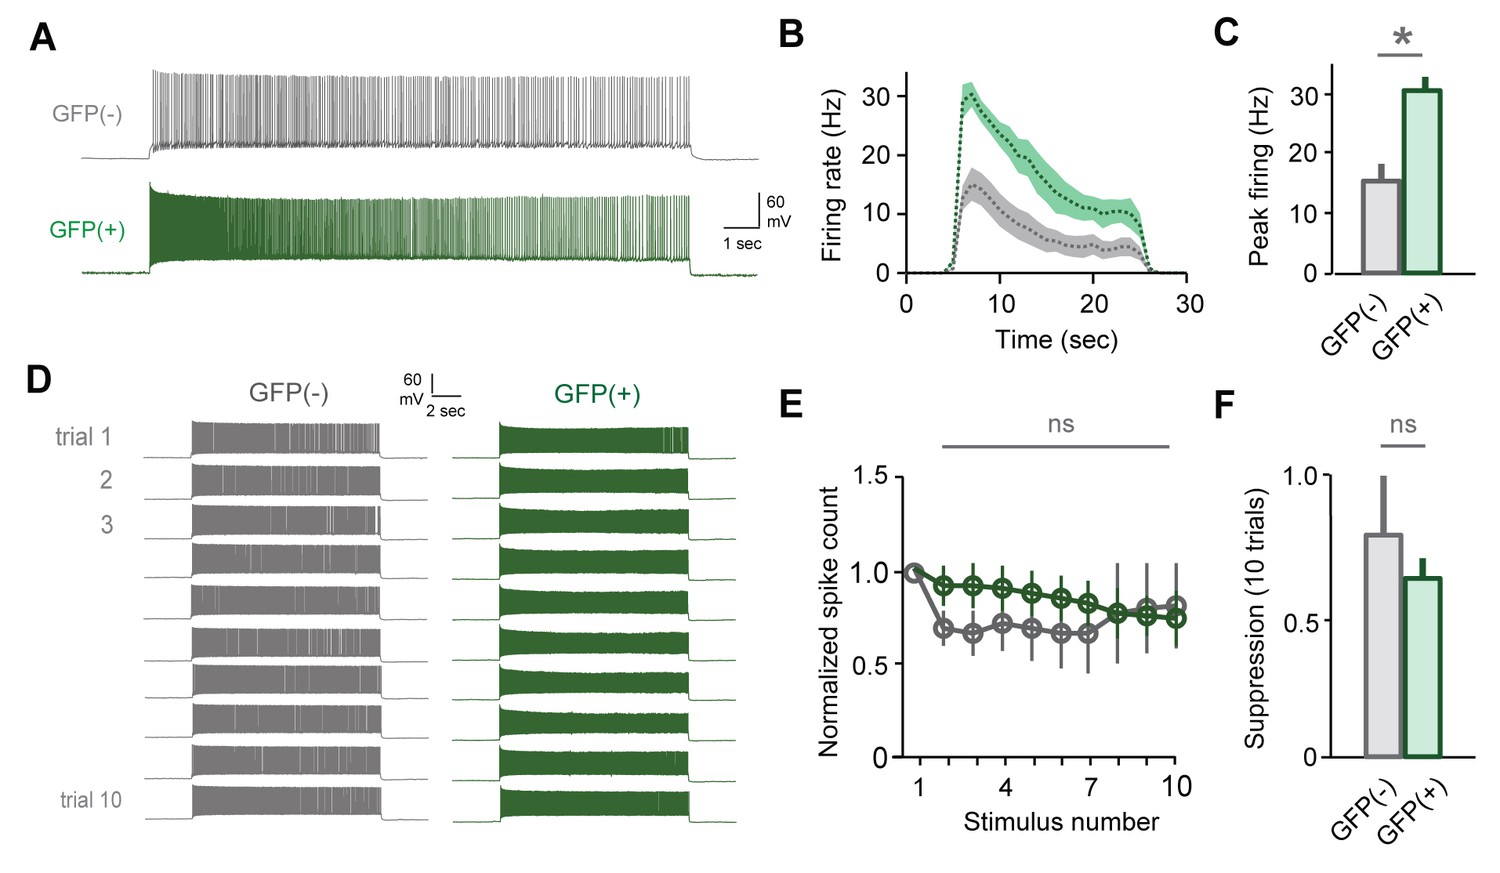
Slow attenuation is absent in GFP(+) MCs labeled by sensory exposure alone.
(A) Firing rates are elevated in GFP(+) MCs relative to unlabeled neurons. (B, C) Increased firing rates for initial stimuli in GFP(+) vs. GFP(-) MCs in the absence of mating. Peak rates, 30.5 ± 2.2 Hz vs. 15.5 ± 2.7 Hz respectively, mean ± SEM; p<0.05, t-test; n = 5 and 7 cells in 4 mice). (D) Example MC responses to repetitive current injection for both GFP(-) and GFP(+) neurons. (E) In the absence of mating, both MC groups maintain stable output (mean ± SEM; n = 5 and 7 cells in 4 mice). (F) GFP(+) and GFP(-) cells show similar levels of suppression on trial 10 (p=0.77; t-test).
Figure 7 with 1 supplement
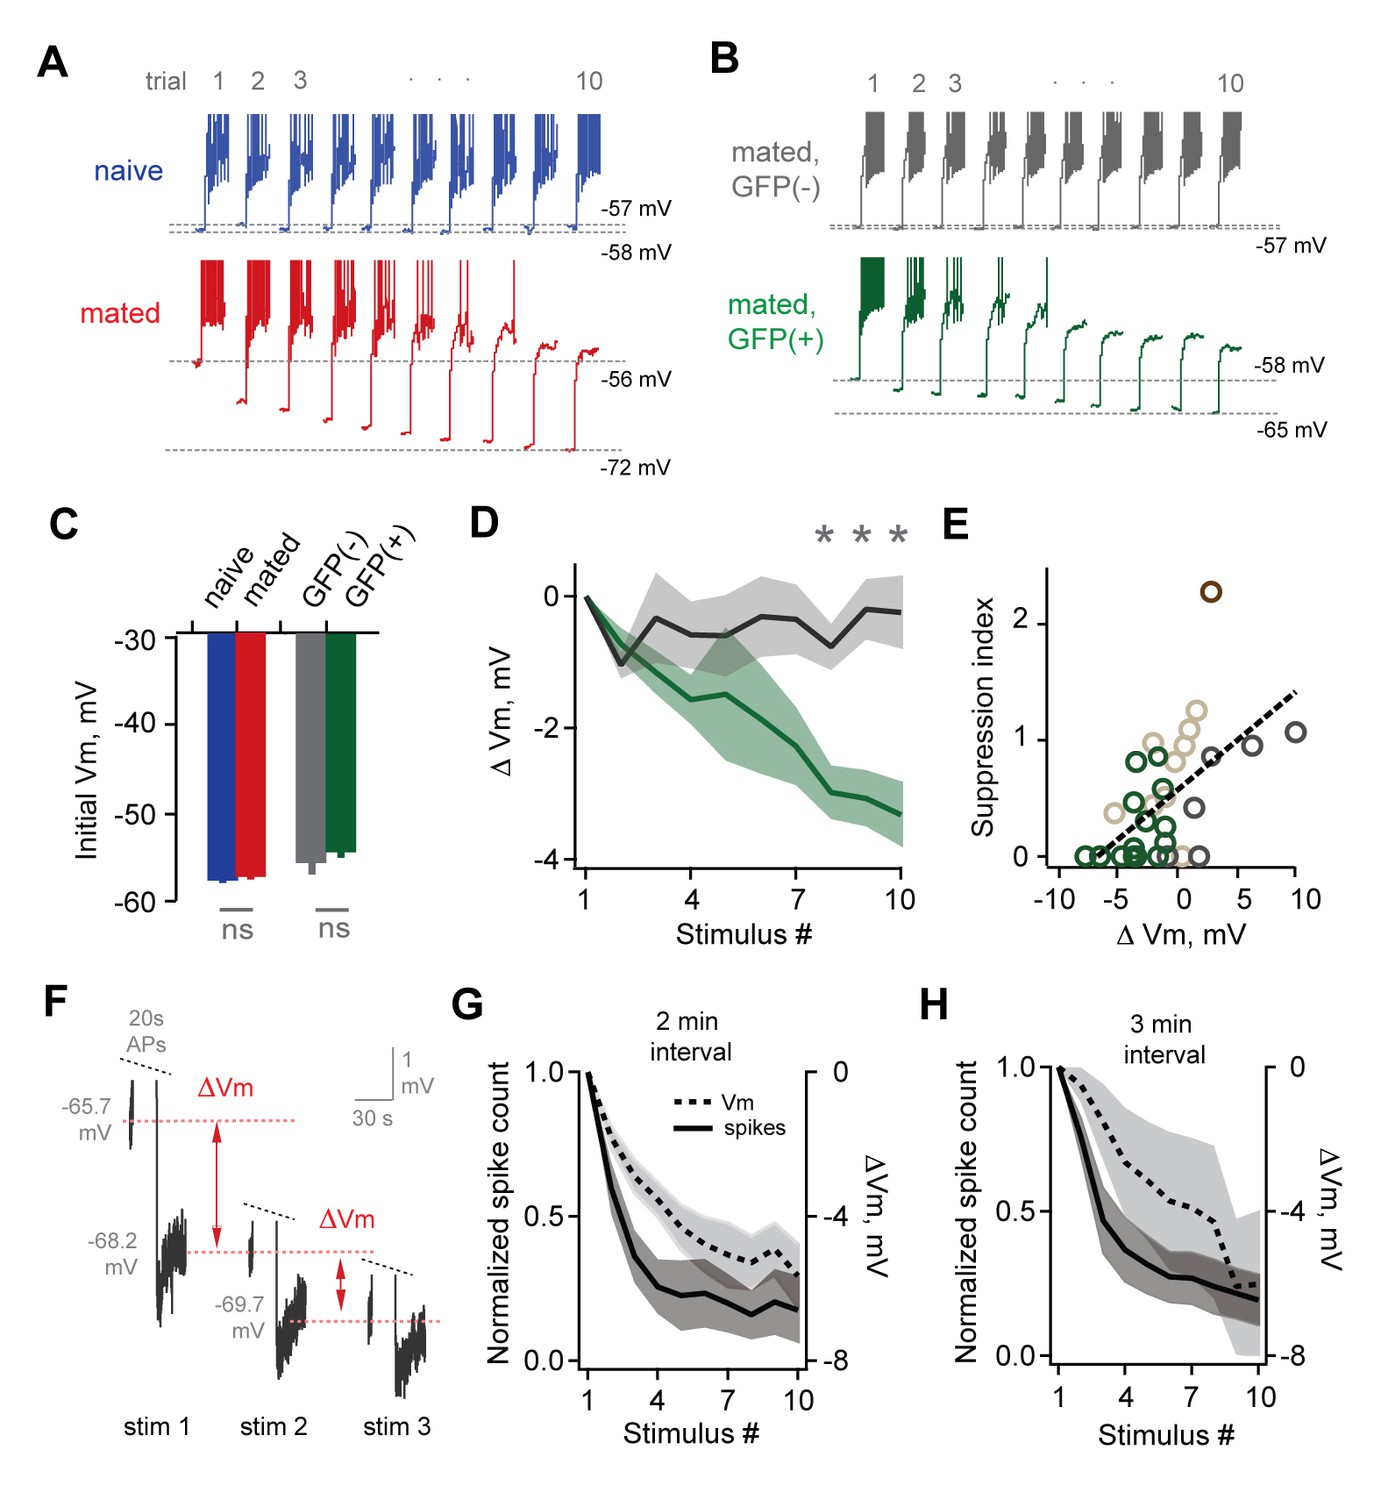
Loss of MC sensitivity results from progressive membrane potential hyperpolarization.
(A) Representative MC responses to repetitive stimulation, showing initial resting potential and onset of firing for each trial. Progressive hyperpolarization was greatly enhanced in mated vs. naïve mice (red and blue respectively). (B) Within the AOB of mated females, hyperpolarization was selectively expressed in mating-activated GFP(+) MC populations. (C) Initial resting membrane potential was similar for MCs from naïve vs. mated females (blue and red respectively; p=0.76; n = 9 and 15 cells in 5 and 7 mice), and for labeled and unlabeled MC populations in mated animals (gray and green; p=0.56; t-test; n = 7 and 11 neurons in 5 and 7 mice). (D) Mean hyperpolarization during repetitive stimulation for GFP(+) and GFP(-) MCs (green and gray; upper and lower 1/3 of the recorded population; *, p<0.05; t-test). (E) Progressive loss of MC responsiveness is correlated with membrane hyperpolarization. Green, GFP(+); dark gray, GFP(-); light gray, intermediate. (F) Membrane hyperpolarization persists for > 2.5 min between stimuli. Traces show Vm before and after three successive spike trains delivered 3 min apart. Red dashes show step-like hyperpolarization lasting until the next stimulus. (G,H) Mean hyperpolarization and normalized change in firing for MCs tested with stimuli 2 min and 3 min apart.
-
Figure 7—source data 1
This spreadsheet contains the membrane potential data for mitral cells used to generate the bar plots and average data shown in Figure 7C and D.
These data can be opened with Microsoft Excel or with open-source alternatives such as OpenOffice.
- https://doi.org/10.7554/eLife.25421.023
Figure 7—figure supplement 1
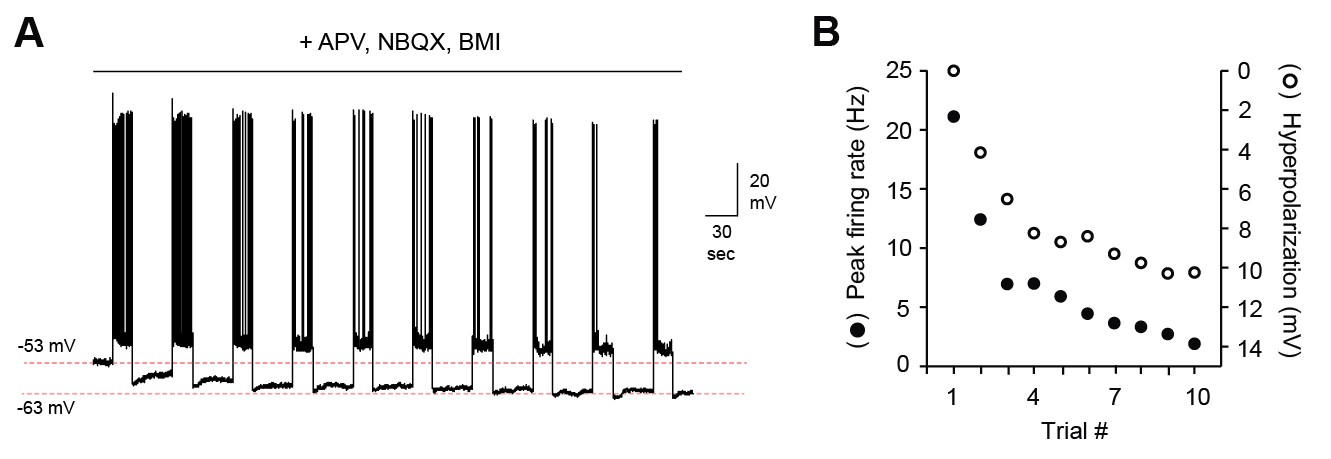
MC hyperpolarization and attenuation of firing does not depend on persistent synaptic inhibition.
(A) Representative MC membrane potential response after blocking fast synaptic transmission with NBQX, APV, and bicuculline (5, 50, and 10 µM respectively). (B) Decreased MC output over the course of 10 stimuli correlates strongly with membrane hyperpolarization.
Download links
A two-part list of links to download the article, or parts of the article, in various formats.
Downloads (link to download the article as PDF)
Open citations (links to open the citations from this article in various online reference manager services)
Cite this article (links to download the citations from this article in formats compatible with various reference manager tools)
Neural mechanisms of social learning in the female mouse
eLife 6:e25421.
https://doi.org/10.7554/eLife.25421


