Activation of the dopaminergic pathway from VTA to the medial olfactory tubercle generates odor-preference and reward
- Wuhan Institute of Physics and Mathematics, Chinese Academy of Sciences, China
- Wuhan National Laboratory for Optoelectronics, China
- Wuhan University, China
- CAS Center for Excellence in Brain Science, Shenzhen Institutes of Advanced Technology, Chinese Academy of Sciences, China
Figures
Figure 1
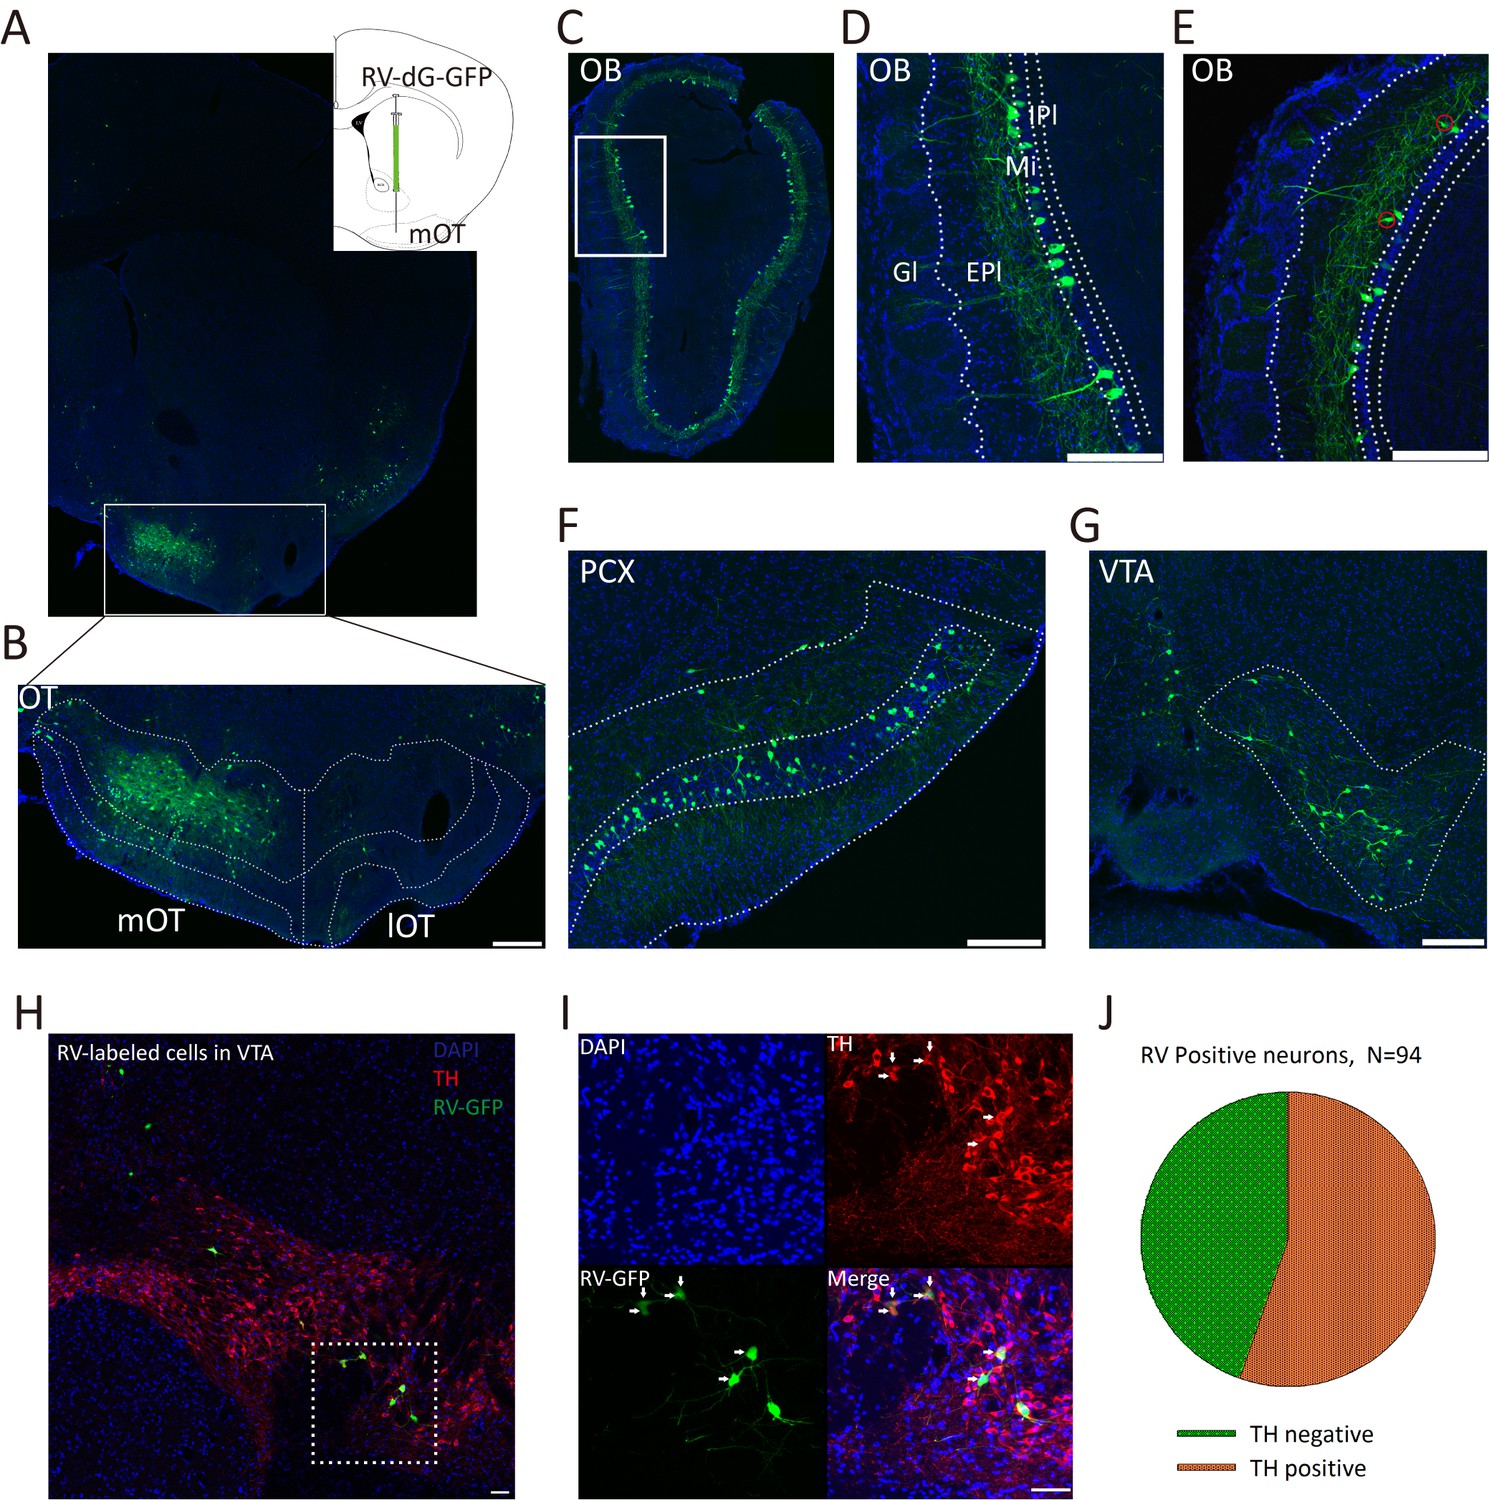
Inputs of the mOT.
(A) Schematic for the tracing experiment. RV-dG-GFP was unilaterally injected into the mOT of C57BL/6 mice. The representative coronal brain section showed the injection site in the mOT. (B) Magnification of RV-dG-GFP labeled neurons in the mOT. (C–G) GFP positive cells were widely distributed in the OB (C–E), PCX (F) and VTA (G) with RV retrograde tracing. In the OB, the labeled cells were mainly distributed in the mitral cell layers (D), while also sparsely located in the external plexiform layer (E, red circles). (H, I) TH was co-stained with RV-dG-GFP labeled neurons in the VTA, followed by mOT injection of RV-dG-GFP. (J) Statistical chart showed that more than half of the GFP + neurons co-express TH (n = 3). Nuclei of all the slices were stained blue with DAPI. Scale bar: 200 μm.
-
Figure 1—source data 1
Statistical result of RV infected neurons in the VTA that co-stained with tyrosine hydroxylase (TH).
- https://doi.org/10.7554/eLife.25423.003
Figure 2 with 2 supplements
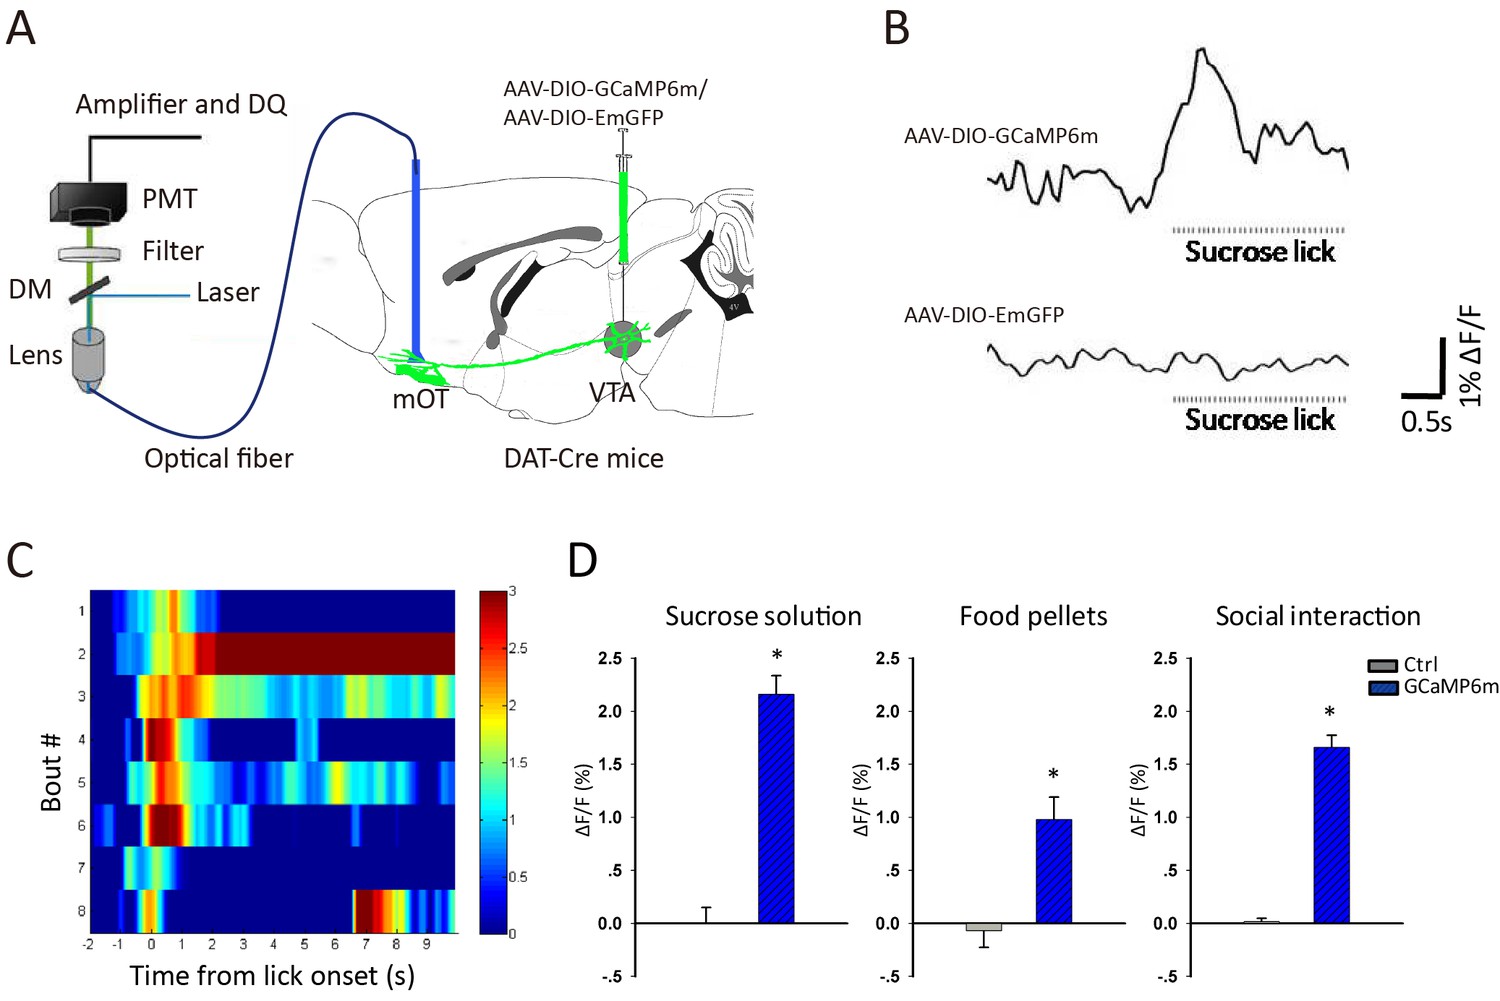
Reward increased Ca2+ signals of VTA-mOT DAergic projection.
(A) Schematic of the fiber photometry setup for recording of the VTA-mOT DAergic projection from DAT-Cre mice. (B) Raw traces of GCaMP and control GFP fluorescence as the mice lick sucrose solution. ΔF/F represents change in fluorescence from the mean level before task. (C) The heatmap illustrated Ca2+ signal responses of eight sucrose licking bouts from a representative mouse. Color bar: ΔF/F. (D) Responses to sucrose solution (left), food pellets (middle) and social interaction (right) for the control and GCaMP6m-expressing mice. *p<0.05.
-
Figure 2—source data 1
Fiber photometry recording ΔF/F value to sucrose solution, food pellets and social interaction for the control and GCaMP6m-expressing mice.
- https://doi.org/10.7554/eLife.25423.007
Figure 2—figure supplement 1
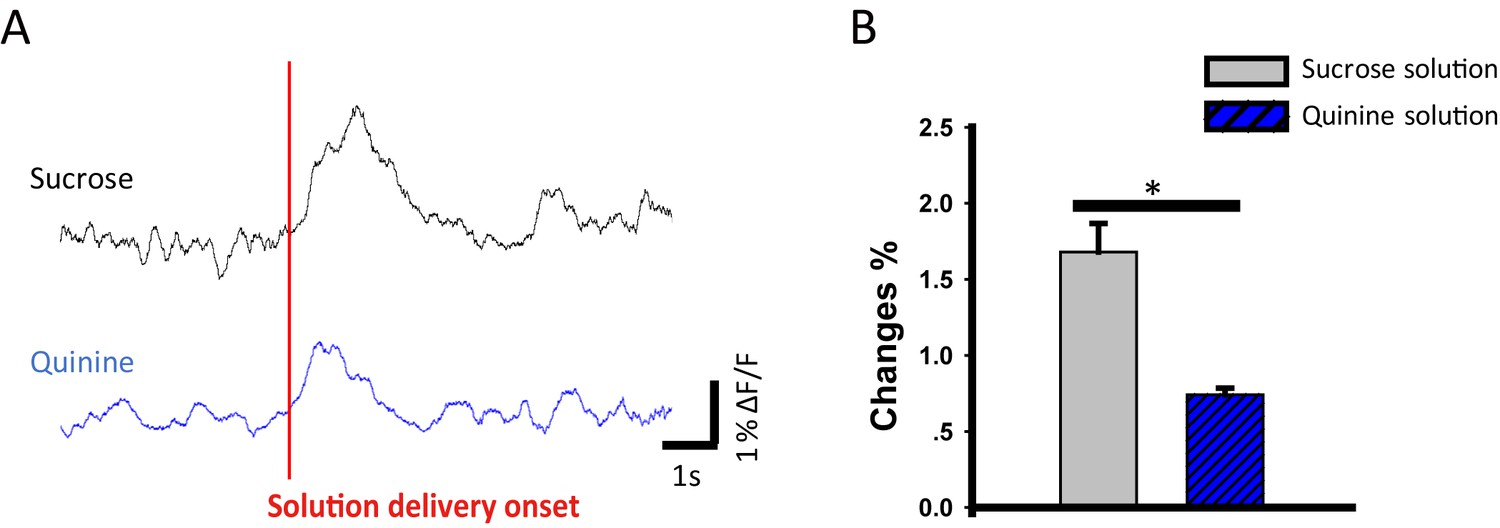
The VTA-mOT DAergic projection showed a higher response to sucrose reward than the bitter quinine solution.
(A) Raw fibre photometry recorded signals of VTA-mOT DAergic projection in response to sucrose or quinine solution stimuli. (B) Bitter quinine solution elicited weaker response than the reward one (sucrose) in DAT-Cre mice by using fibre photometry (1.68 ± 0.19% for sucrose solution; 0.74 ± 0.04% for quinine solution, p<0.001, n = 5).
Figure 2—figure supplement 2
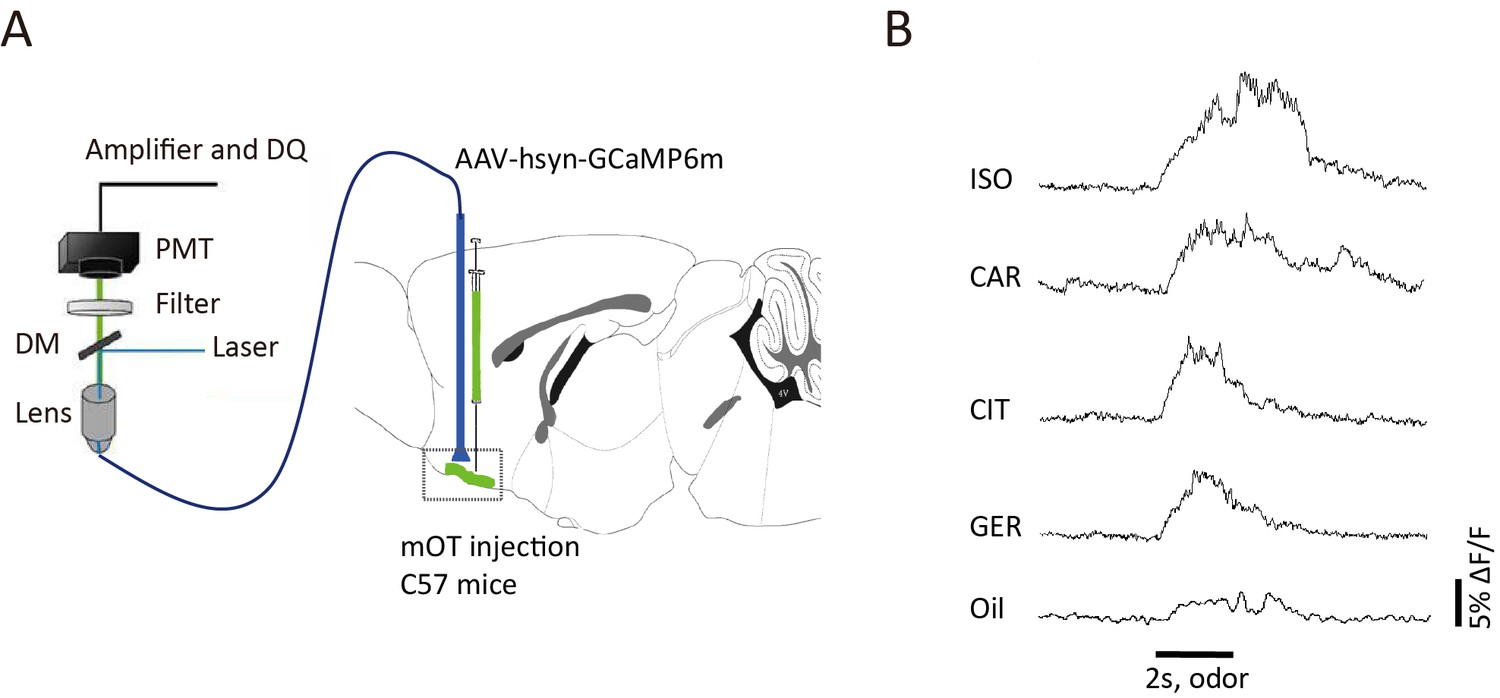
The mOT neurons were activated by different odor stimulations.
(A) Schematic of the fiber photometry recording from the mOT neurons. (B) Representative traces of GCaMP fluorescence in response to odor and mineral oil stimulations for the GCaMP6m-expressing C57BL/6 mice.
Figure 3 with 1 supplement
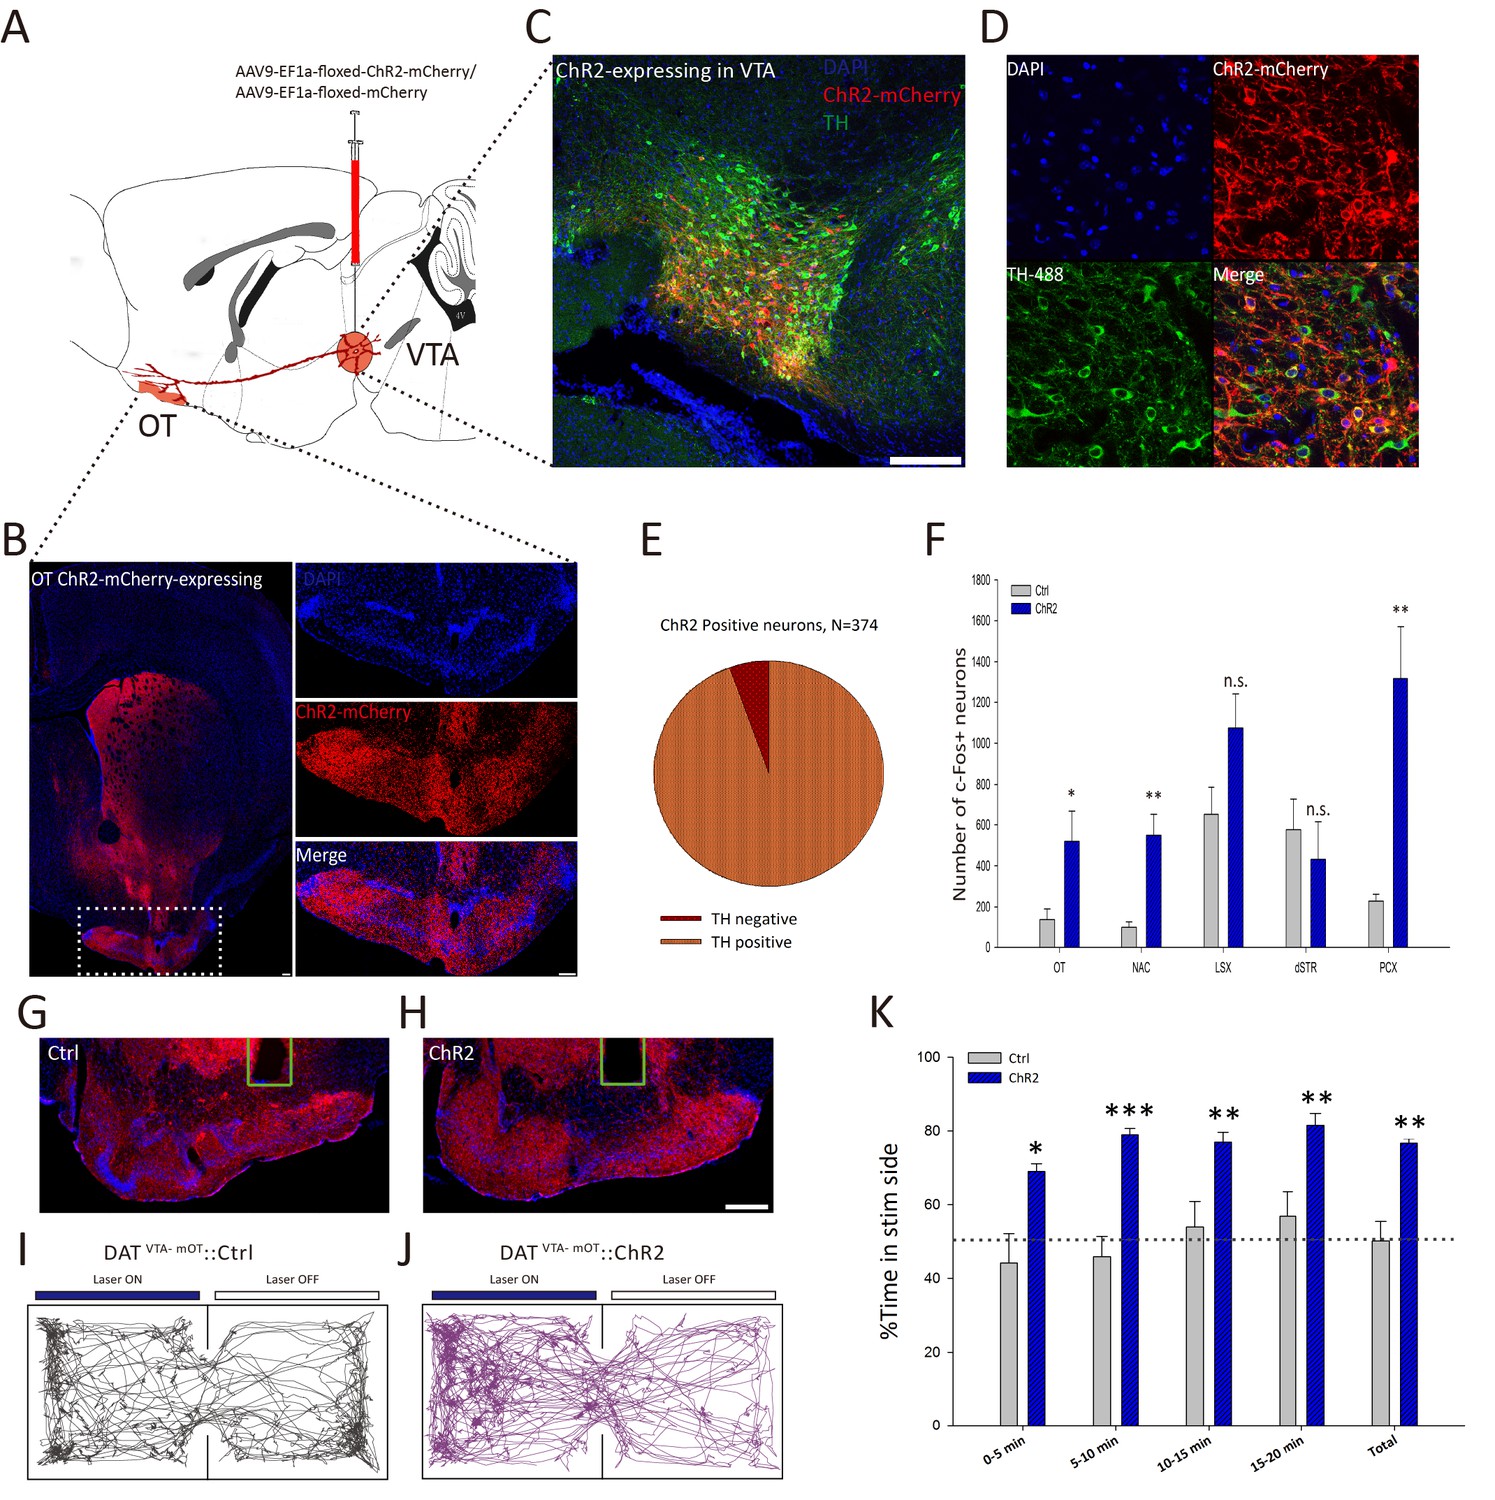
Activation of the VTA-mOT DAergic projection produced acute place preference.
(A) Schematic for virus injection to manipulate the VTA-mOT DAergic projections. AAV9-EF1a-floxed-ChR2-mCherry or the AAV9-EF1a-floxed-mCherry was unilaterally injected into the VTA of DAT-Cre mice. (B) ChR2-mCherry positive axons were densely distributed in the mOT. (C, D) Co-localization of the TH with ChR2-mCherry in the VTA neurons. (E) Statistical chart showed that ChR2-mCherry was relatively restricted to TH-positive neurons (n = 3). (F) Blue light stimulation of the VTA-mOT DAergic projections increased the c-fos expression levels in the OT, NAc, and PCX, while the c-fos expression levels in the LSX and dSTR had no significant changes (n.s., p>0.05). (G, H) Optical fibers were implanted in the mOT of control or ChR2-expressing mice. (I, J) Representative real-time place preference (RTPP) tracks illustrated light-evoked behavioral preference in ChR2-expressing mice (right, n = 7), but not in control mice (left, n = 7). (K) ChR2-expressing mice showed a significant preference for light stimulation chamber compared with control mice in the RTPP test. *p<0.05, **p<0.01, ***p<0.001. Scale bar: 200 μm.
-
Figure 3—source data 1
Statistical result of c-fos-positive cells in the OT, NAc, LSX, dSTR and PCX after blue light stimulation of the VTA-mOT DAergic projections.
- https://doi.org/10.7554/eLife.25423.010
Figure 3—figure supplement 1
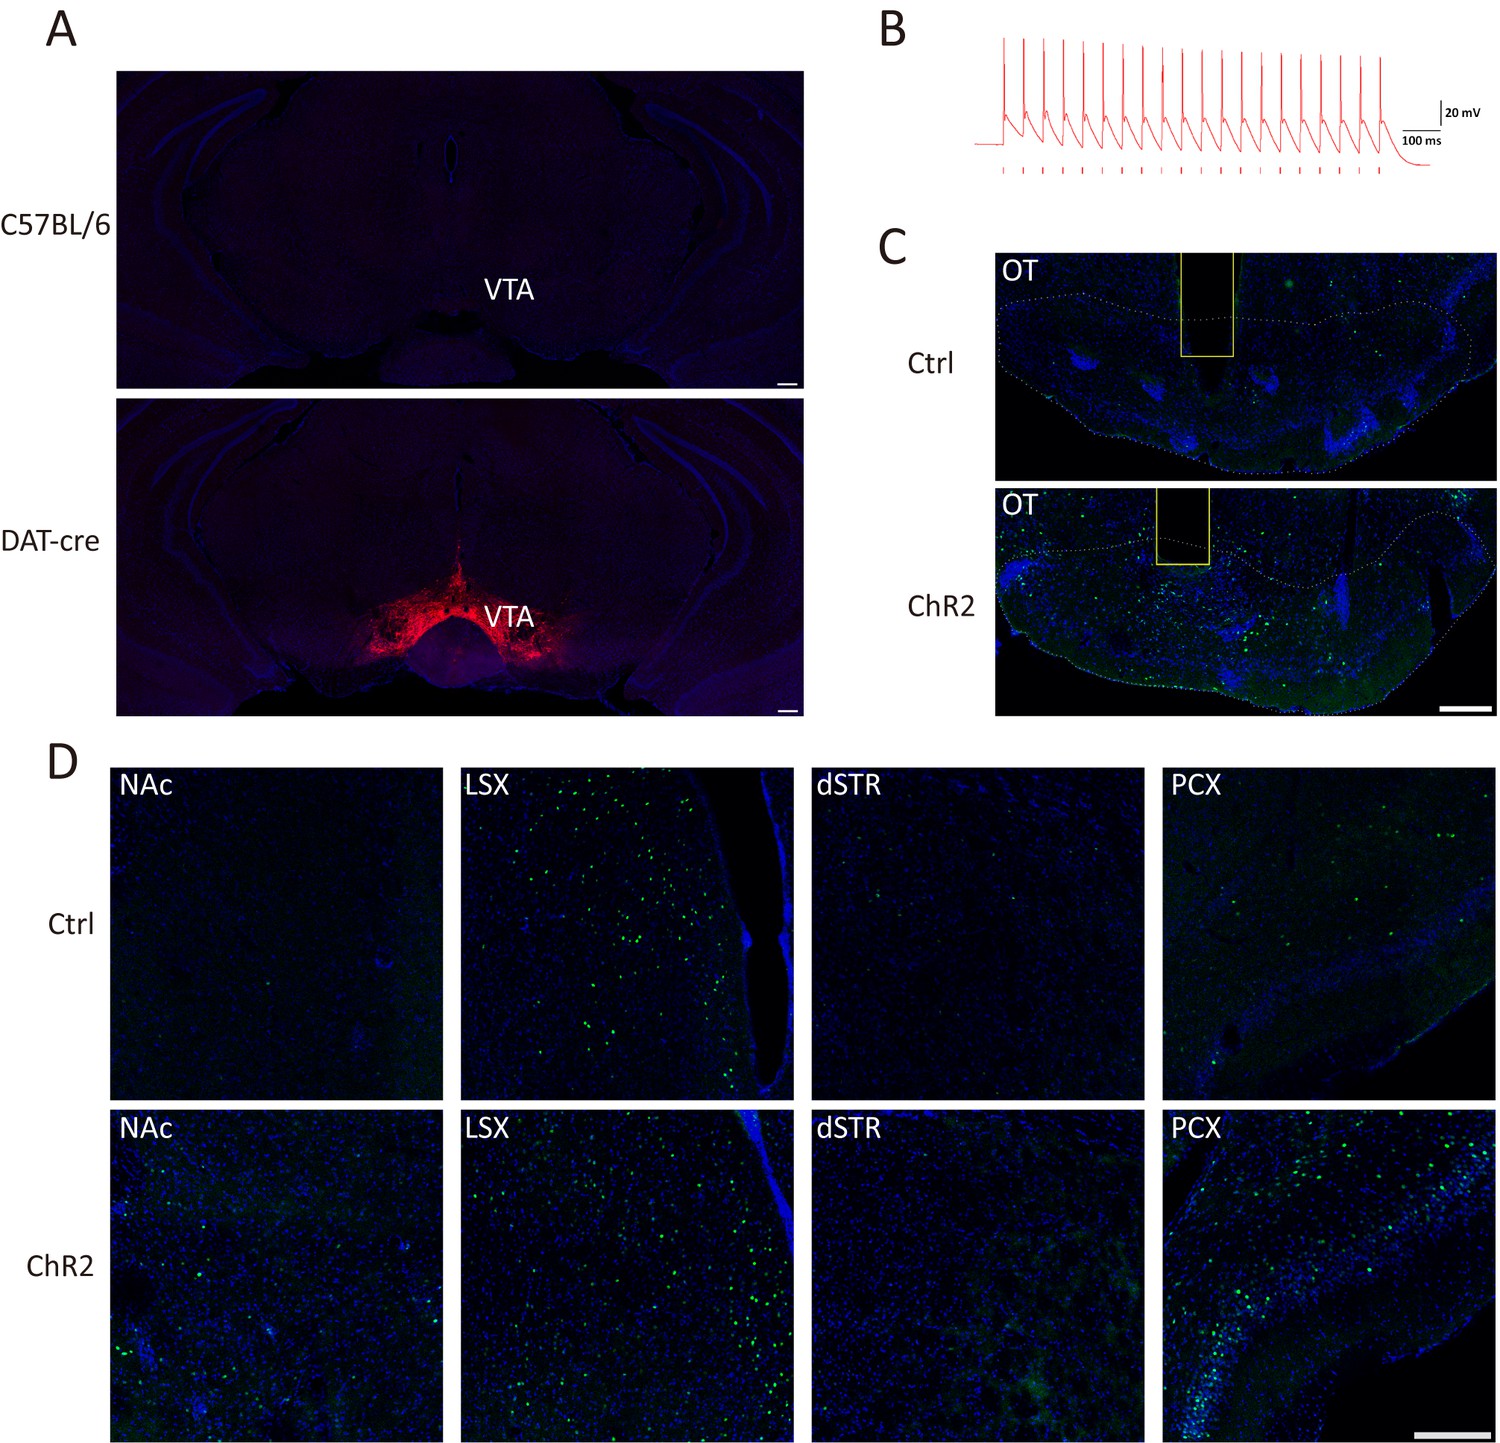
Optogenetic activation of the VTA-mOT DAergic projections.
(A) AAV9-EF1a-floxed-ChR2-mCherry was injected into the VTA of DAT-Cre or C57BL/6 mice. The mCherry was densely expressed in VTA neurons (bottom), but was negatively found in the VTA of C57BL/6 mice (top). (B) Blue light stimulation at 20 Hz reliably induced action potentials in ChR2-expressing neurons. (C) Representative coronal sections showed the c-fos expression in the OT in control (top) and the ChR2-mCherry-expressing mice (bottom). The yellow boxes represented the location of the optic fiber in the mOT. (D) Representative c-fos expression patterns in the dSTR, LSX, NAc and PCX in the control (top) and the ChR2-mCherry-expressing mice (bottom). Scale bar: 200 μm.
Figure 4

Activation of the VTA-mOT DAergic projection produced positive reinforcement.
(A) Schematics for iClass training. Mice explored in an open field containing a rectangle in the center, which is marked red and 1/10 of the total area, for 5 consecutive days. In the first day (Pre) and last day (Test) mice received no light stimulation. During the 3 consecutive training days (L1, L2, L3), light pulses (483 nm) at 20 Hz were delivered to activate the VTA-mOT DAergic projection when mice were in the rectangle (bottom), and terminated until they left the rectangle (Top). (B–D) ChR2-mCherry-expressing mice (n = 7) increased entry times (B) and retention (C, D) for central area when compared with control mice (n = 7). The dashed line represents the percentage of the marked rectangle to the total. *p<0.05, **p<0.01, ***p<0.001. The preference was turned up at the first training day, increased with the training sections, and maintained to the test day (B, C). Learning curves showed that mice took 3–6 min to overcome their instinctive avoidance for the central area in the first training day (D). The center preference increased with training time and days. (E, F) Representative iClass tracks illustrated light-evoked center preference in ChR2-expressing mice (bottom, (F) but not in the control mice (top, (E).
-
Figure 4—source data 1
Statistical result of the time percentage spent in the stimulated side in RTPP for the control and ChR2-expressing mice.
- https://doi.org/10.7554/eLife.25423.012
Figure 5
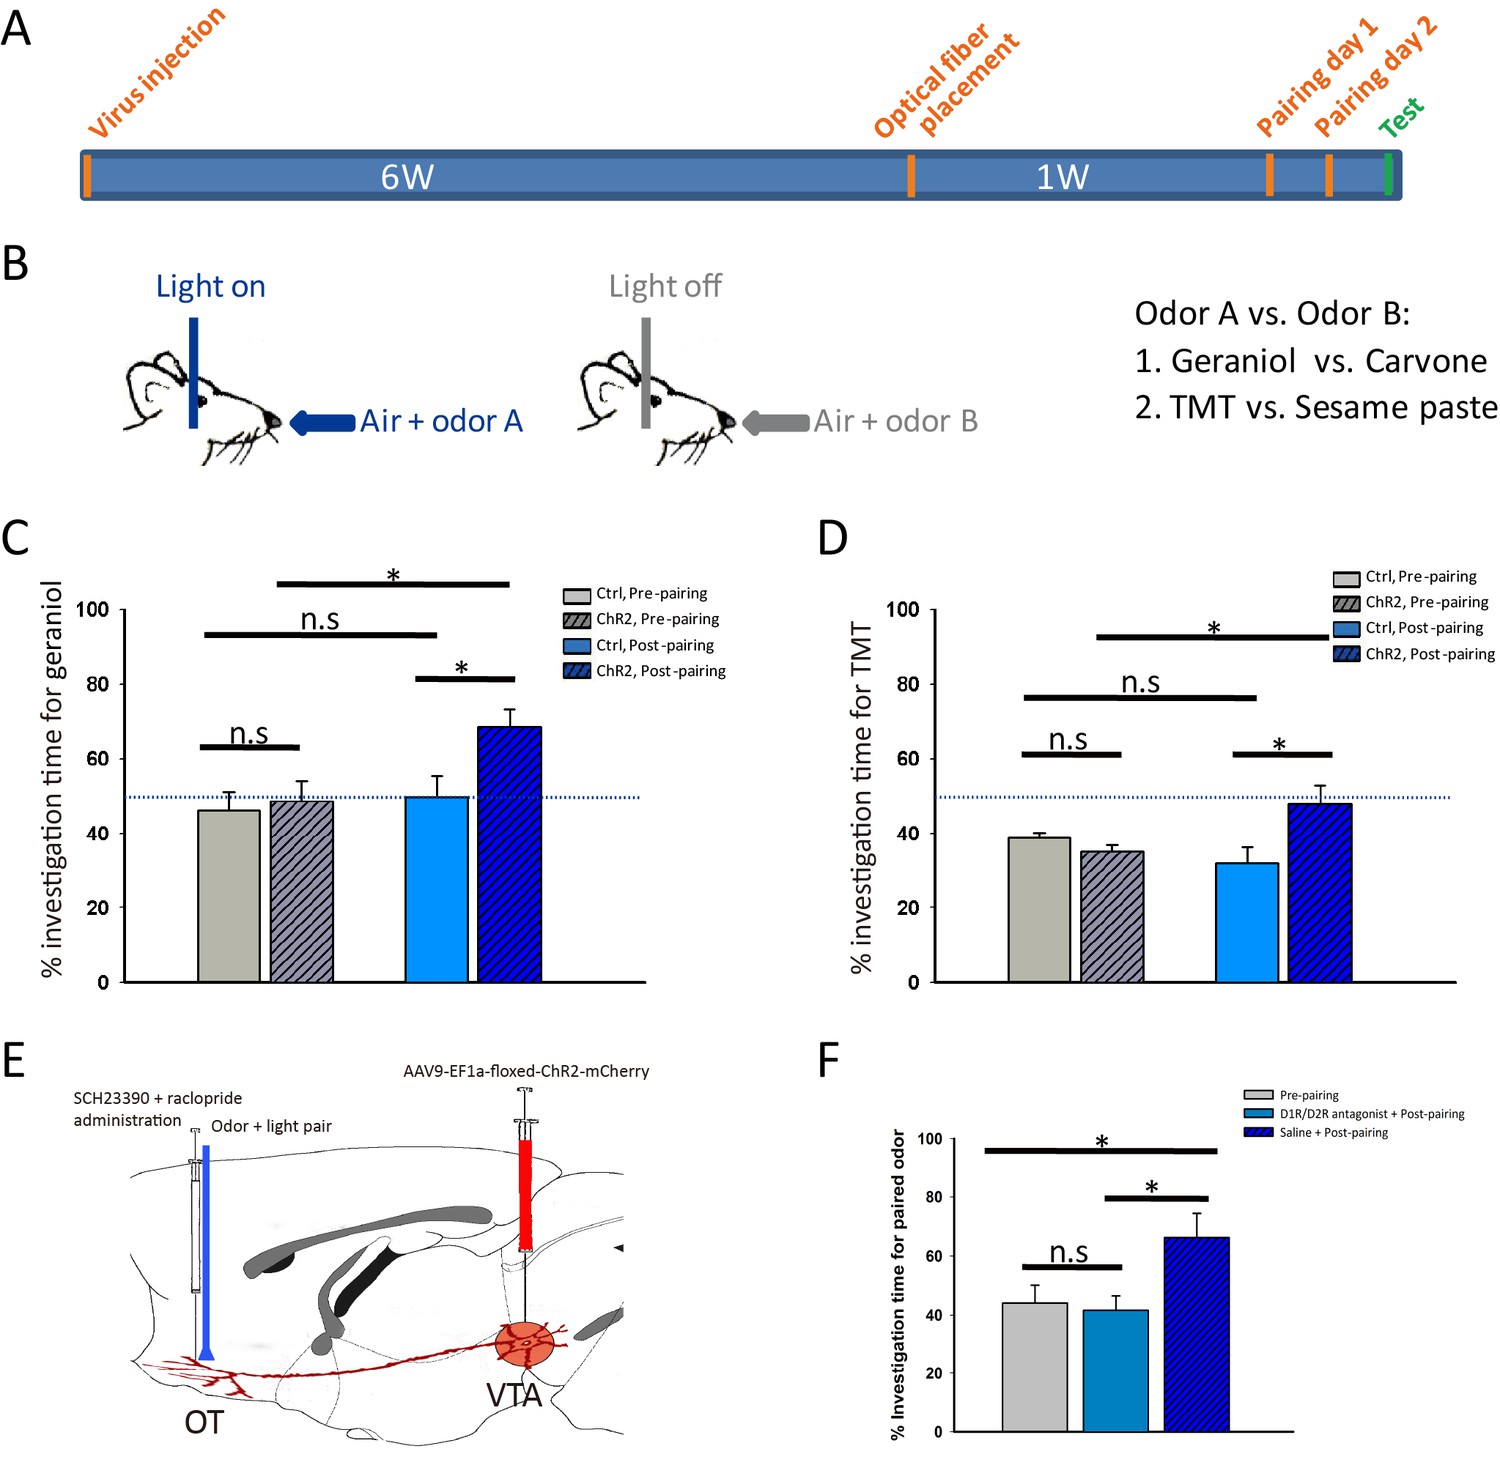
Activation of the VTA (DAergic)-mOT pathway elicited or altered odor-preference.
(A) The time-course for optogenetic activation of the VTA (DAergic)-mOT pathway paired with odor stimulations and test for odor-preference. (B) Schematic for the odor-light pairing training. (C) For a pair of neutral odors which are equivalently sampled by the naive mice, the percentage of investigation time for the paired odor, geraniol, was significantly higher than the non-paired one, carvone after pairing with activation of this pathway (*p<0.05, n = 8). (D) For an odor pair with one that is preferred and one that is aversive to the naive mice, the percentage of investigation time was significantly increased for the aversive odor, TMT, equivalent to the previous preferred odor, sesame butter after pairing with activation of this pathway (*p<0.05, n = 8). (E) Schematic for pre-treatment of the D1R and D2R antagonist (SCH-23390 and raclopride) before optogenetic activation of the VTA (DAergic)-mOT pathway paired with odor stimulation. (F) The percentage of investigation time for the paired odor, geraniol, was not significantly changed followed by the antagonist administration (p=0.757, n = 6). However, the mice that pretreated with normal saline still showed significant preference to the paired odor (*p<0.05, n = 6).
-
Figure 5—source data 1
Statistical result of center entries and percentage of center duration in iClass training for the control and ChR2-expressing mice.
- https://doi.org/10.7554/eLife.25423.019
Figure 6
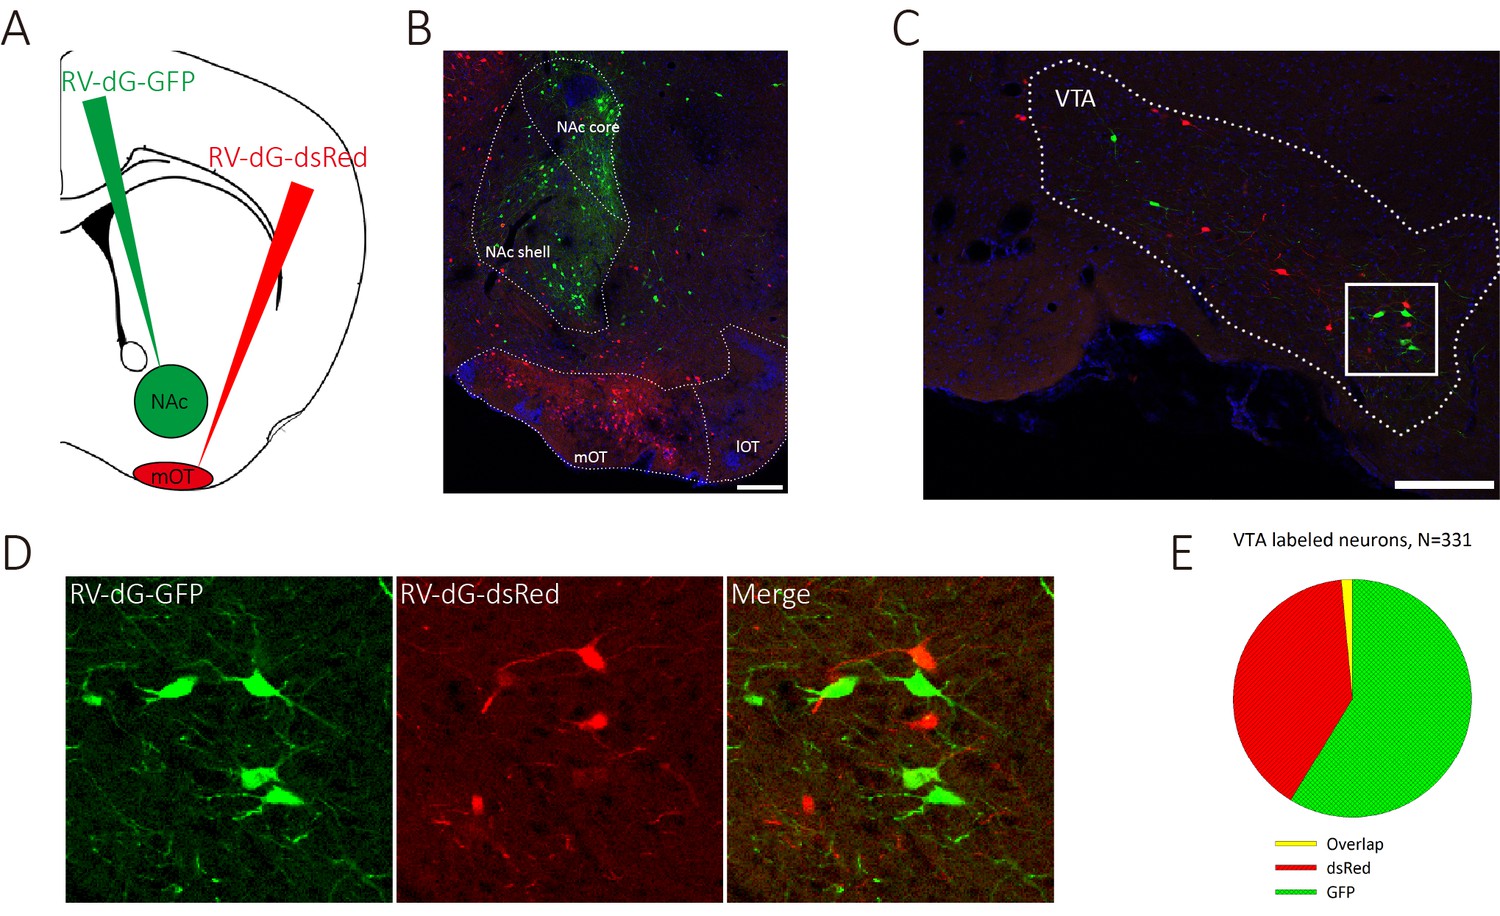
VTA DAergic neurons segregatedly innervate the NAc and the mOT.
(A) Schematic for labeling the mOT and NAc co-innervated VTA neurons by dual RV labeling. (B) RV-dG-DsRed and RV-dG-GFP was injected into the mOT and NAc, respectively. (C) The VTA neurons were labeled by both RV-dG-DsRed and RV-dG-GFP. (D) The magnification of VTA-labeled neurons in C. (E) The co-labeled rate (1.65%) of the VTA neurons by both GFP and dsRed were negligible, which implied that it may not be common for a VTA DAergic neuron to co-innervate the NAc and the mOT. Scale bar: 200 μm.
-
Figure 6—source data 1
Statistical result of percentage of investigation time for TMT after odor-light pairing for the ChR2-expressing mice and percentage of investigation time for geraniol after D1 and D2 dopamine receptor antagonist administration in the mOT.
- https://doi.org/10.7554/eLife.25423.022
Figure 7 with 1 supplement
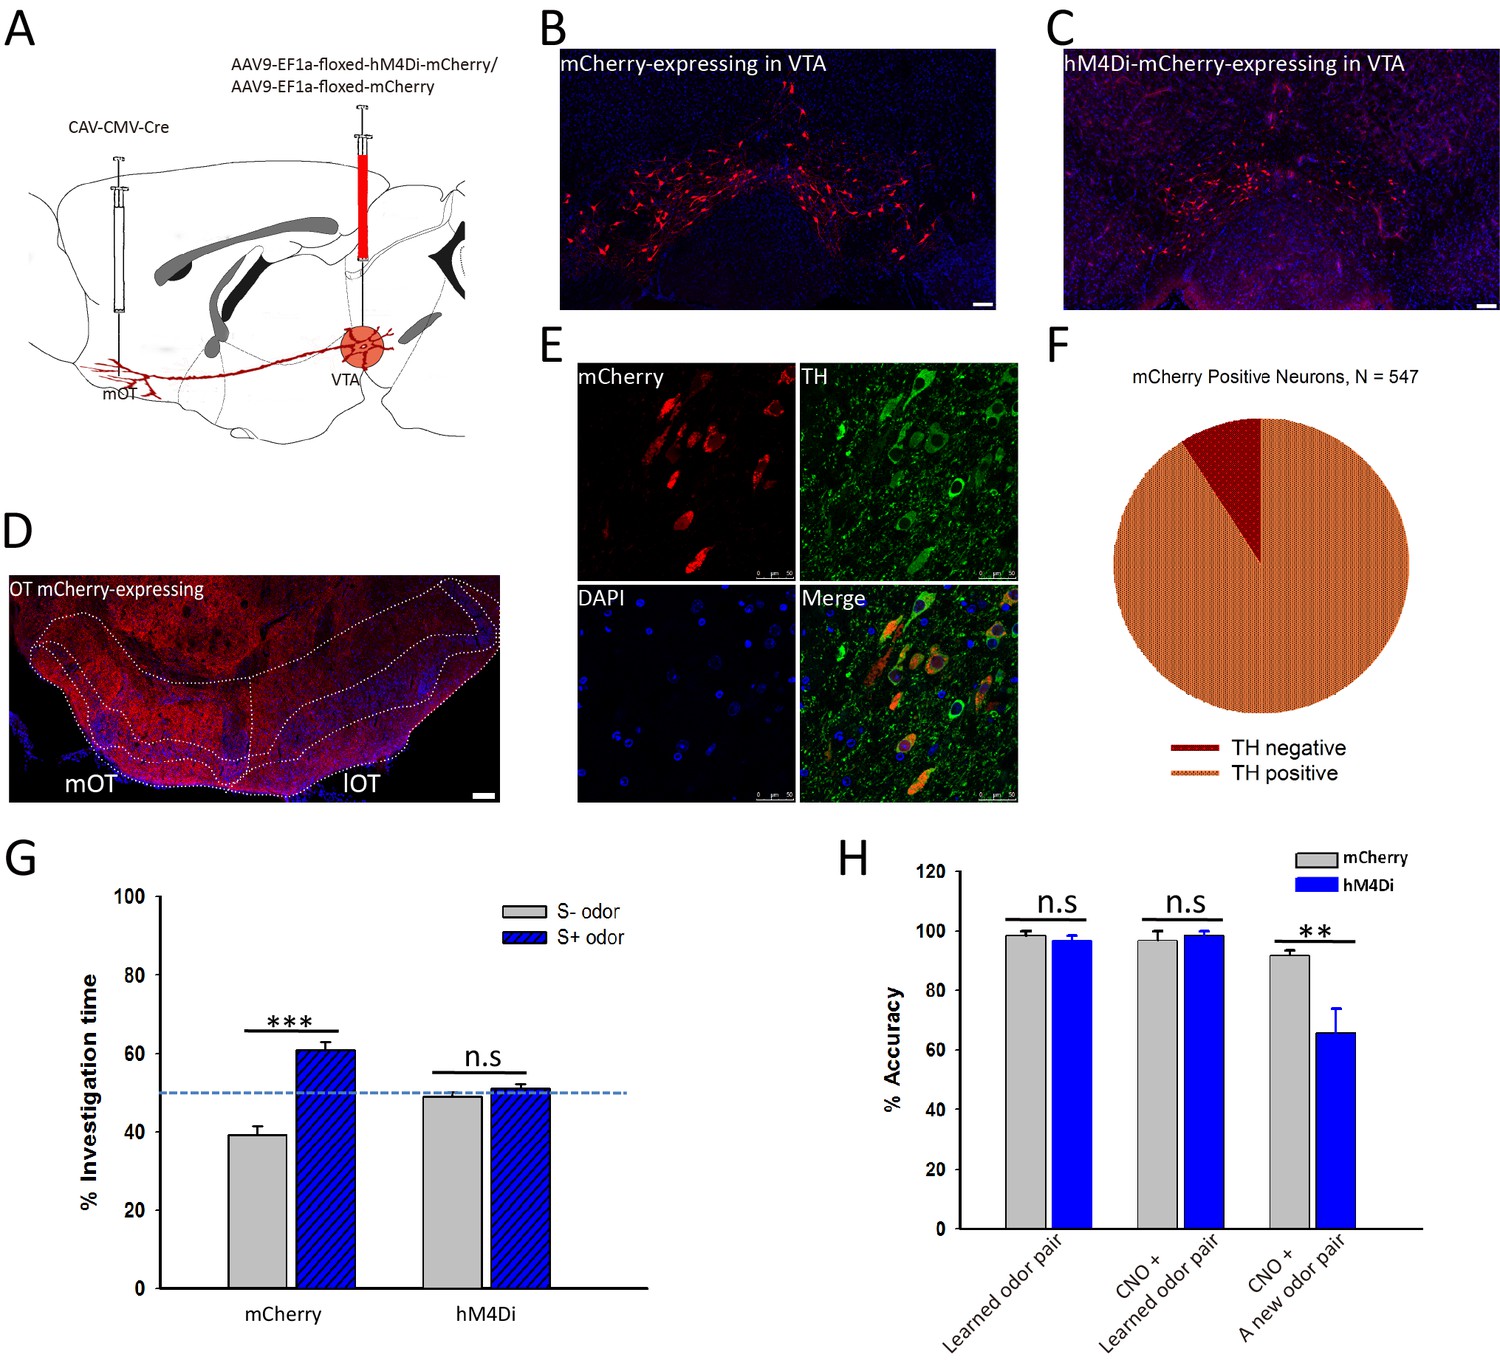
Inactivation of the mOT-projecting VTA DAergic neurons decreased the odor-cue based reward learning and learnt odor-preference.
(A) The schematic for specifically targeting the mOT-projecting VTA DAergic neurons by injecting CAV-CMV-Cre and AAV-EF1a-floxed-hM4Di-mCherry/AAV-EF1a-floxed-mCherry into the mOT and VTA, respectively. (B, C) The mCherry-labeled neurons in the VTA in control and hM4Di-expressing mice. (D) The projections from the VTA mCherry-labeled neurons to the OT were mainly found in the medial part of the OT. (E, F) Most of the mCherry-labeled neurons in the VTA were also co-expressing TH (90.86%). (G) After the odor-preference was established (left bar pair), inhibition of the mOT-projecting VTA DAergic neurons abolished the paired preference (p=0.214, n = 5 for mCherry and 6 for hM4Di group, respectively). (H) Inactivation of this pathway in well-trained mice (left bar pair) did not influence the learnt Go-no go task performance (middle bar pair; Control group, p=0.373; hM4Di group, p=0.312), but significantly decreased the performance in learning a new pair of odors with the same paradigm (right bar pair; p<0.01, n = 5 for mCherry and 6 for hM4Di group, respectively).
-
Figure 7—source data 1
Statistical result of odor-preference test after inhibition of the mOT-projecting VTA DAergic neurons, accuracy of Go-no go learning for hM4Di and control groups in well-trained mice.
- https://doi.org/10.7554/eLife.25423.025
Figure 7—figure supplement 1
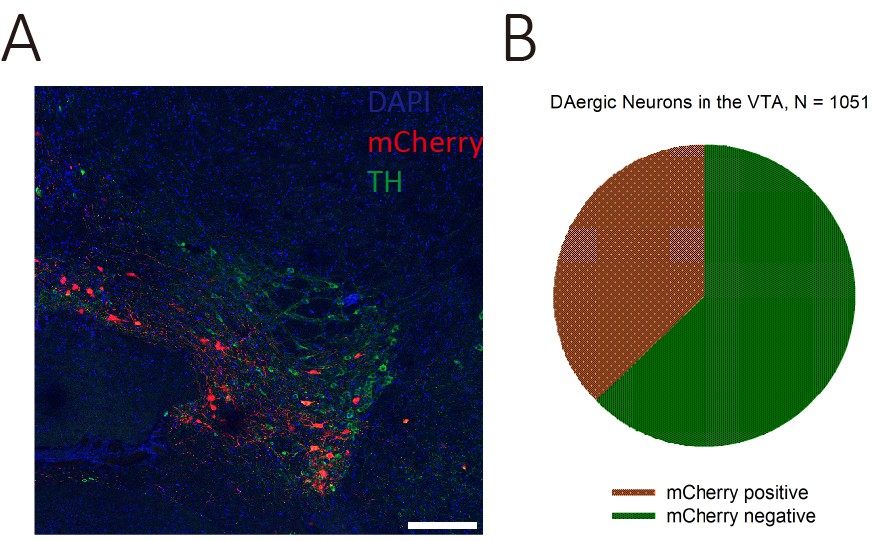
Only a small portion of the VTA DAergic neurons were labeled by CAV-CMV-Cre.
(A) The representative coronal brain section showed the TH and mCherry co-expression in the VTA neurons after CAV-CMV-Cre and AAV9-EF1a-floxed-mCherry injected into the mOT and VTA, respectively. (B) The mCherry-positive cells only account for a small portion (37.20%) of the whole population of VTA DAergic neurons. Scale bar: 200 μm.
Figure 8
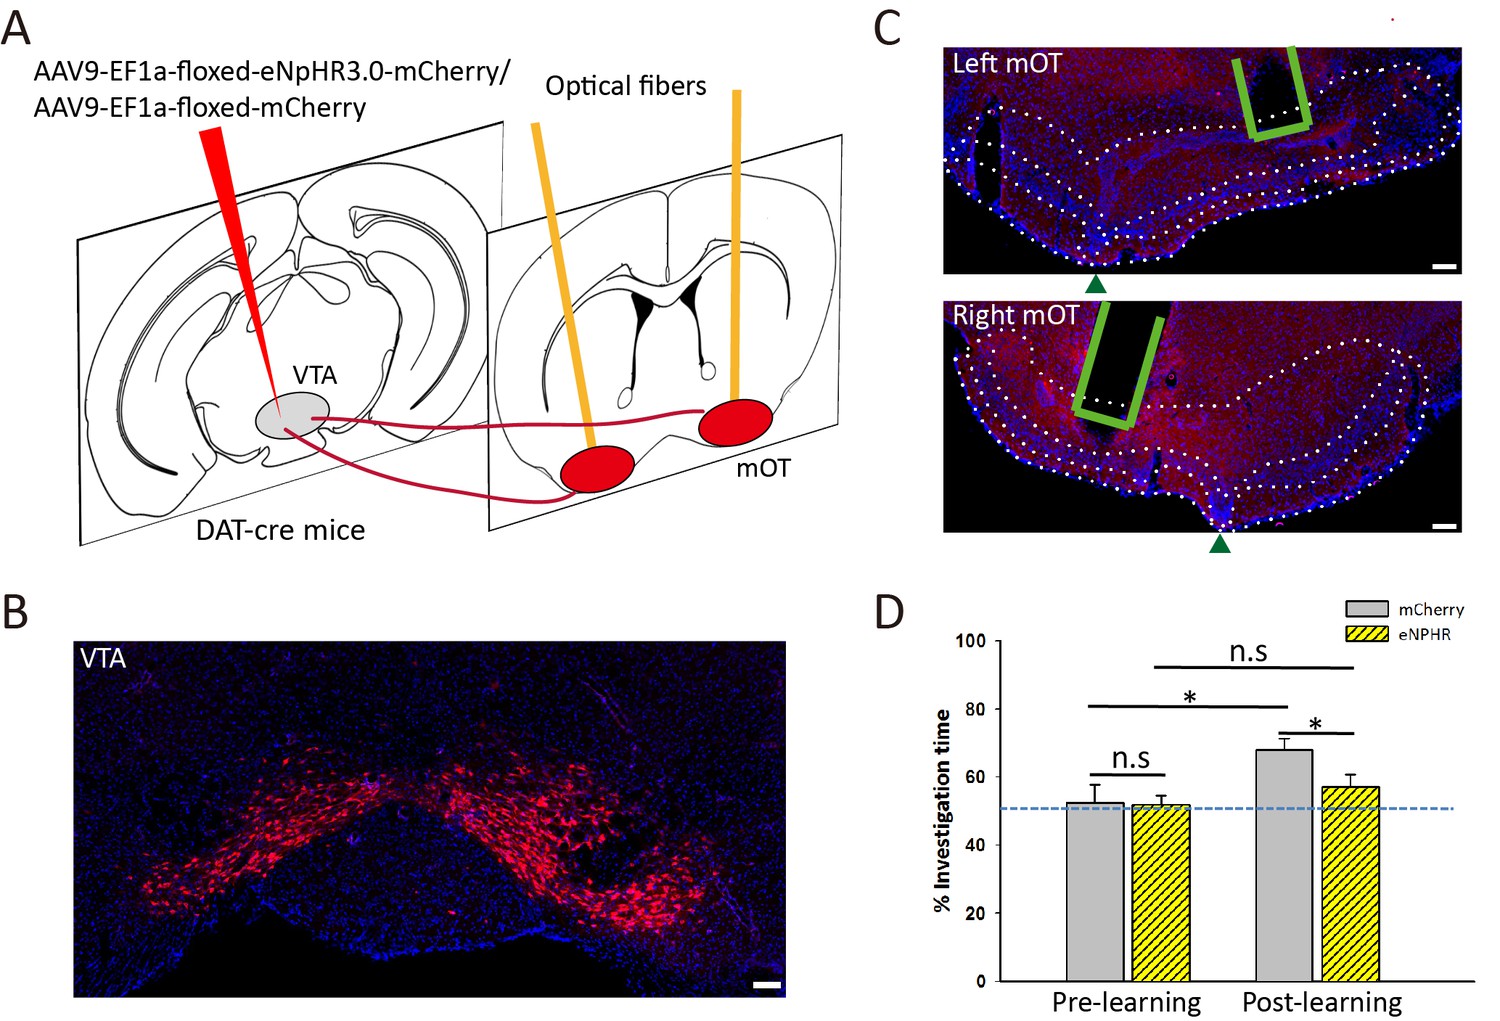
Optogenetic inactivation of VTA-mOT DAergic projections during odor-food associative learning abolished the establishment of S+ odor preference.
(A) The schematic for viral injection and optic fiber implants. (B) eNpHR3.0-mCherry was densely expressed in the VTA neurons. (C) Representative coronal sections showed terminal expression of eNpHR3.0-mCherry and optic fiber implants in the bilateral mOT. The borders for the mOT and lateral OT were indicated by dark green triangles. Scale bar: 100 μm. (D) The S+ odor preference can’t be established after odor-food associative learning by simultaneously light inhibition of the mOT DAergic projections from the VTA (each group n = 6). Scale bar: 100 μm. Figure supplement legends.
-
Figure 8—source data 1
Statistical result of the odor-preference test after light inhibition of the mOT DAergic projections from the VTA.
- https://doi.org/10.7554/eLife.25423.027
Videos
Video 1
Pre-phase (pre) of iClass task of a ChR2-expressing mouse.
The fiber patch cord was connected but no light was delivered.
Video 2
The first light-training session (L1) of iClass task of the ChR2-expressing mouse.
When the central of the animal was located within the marked central rectangular area, 10 mW blue light pulses at 20 Hz were constantly delivered into the mOT.
Video 3
The second light-training session (L2) of iClass task of the ChR2-expressing mouse.
When the central of the animal was located within the marked central rectangular area, 10 mW blue light pulses at 20 Hz were constantly delivered into the mOT.
Video 4
The third light-training session (L3) of iClass task of the ChR2-expressing mouse.
When the central of the animal was located within the marked central rectangular area, 10 mW blue light pulses at 20 Hz were constantly delivered into the mOT.
Video 5
The test day (test) of iClass task of the ChR2-expressing mouse.
The fiber patch cord was connected but no light was delivered.
Video 6
Odor-preference test after odor-light pairing of a ChR2 expressing mouse.
https://doi.org/10.7554/eLife.25423.020Additional files
-
Transparent reporting form
- https://doi.org/10.7554/eLife.25423.028
Download links
A two-part list of links to download the article, or parts of the article, in various formats.
Downloads (link to download the article as PDF)
Open citations (links to open the citations from this article in various online reference manager services)
Cite this article (links to download the citations from this article in formats compatible with various reference manager tools)
Activation of the dopaminergic pathway from VTA to the medial olfactory tubercle generates odor-preference and reward
eLife 6:e25423.
https://doi.org/10.7554/eLife.25423


