Synaptic plasticity through activation of GluA3-containing AMPA-receptors
- The Netherlands Institute for Neuroscience, Royal Netherlands Academy of Arts and Sciences, The Netherlands
Figures
Figure 1 with 2 supplements
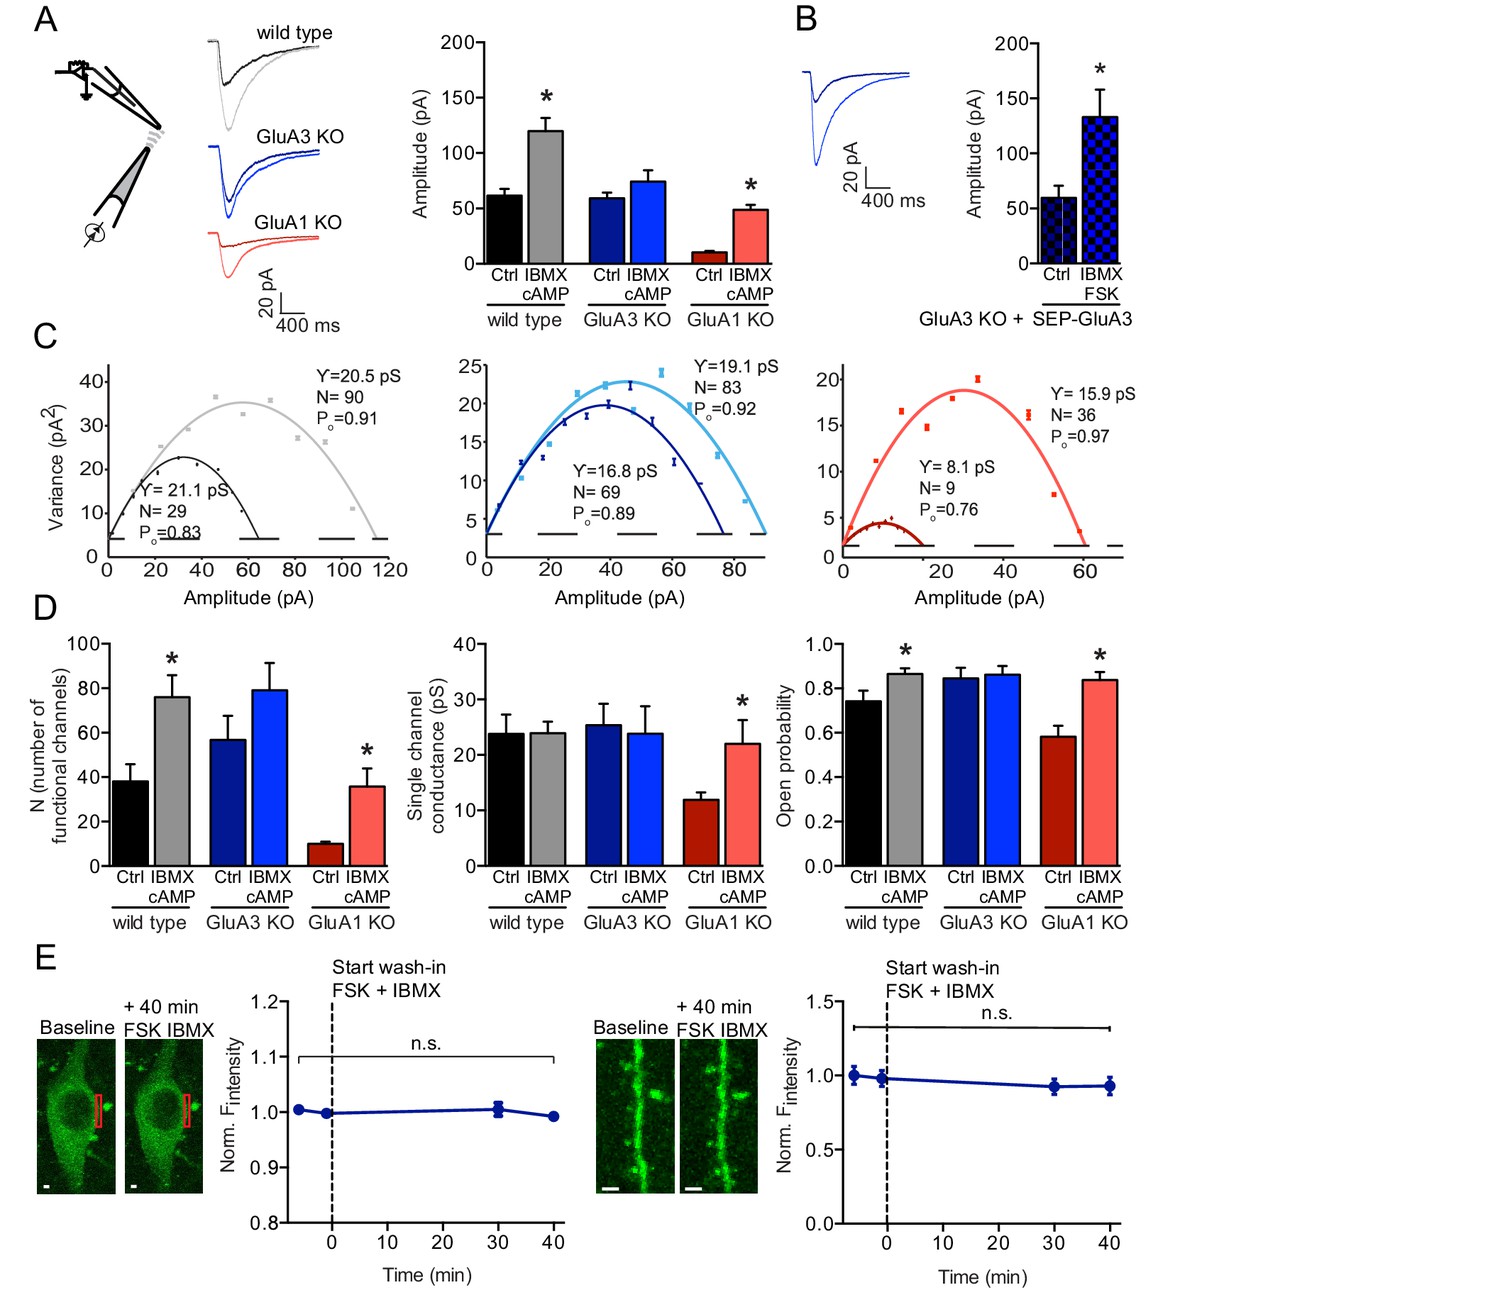
cAMP increases currents of extrasynaptic GluA3-containing AMPARs.
(A) Experimental setup, example traces and averages of AMPAR amplitudes in response to AMPA puffs onto outside-out patches from WT CA1 cell bodies without (black; n=15) or with (gray; n=24) cAMP in pipette, GluA3-KO without (dark blue; n=20) or with (light blue; n=20) cAMP, and GluA1-KO without (dark red; n=18) or with (light red; n=10) cAMP. Wild type and GluA1-deficient neurons showed an increased amplitude upon AMPA puffs in the presence of cAMP in the recording pipette, GluA3-deficient did not (t-test, WT: p=0.0009; t-test, 3KO: p=0.9; t-test, 1KO: p<0.0001). All recordings in the presence of desensitization blockers cyclothiazide and PEPA and cAMP condition in the presence of PDE inhibitor IBMX. (B) Outside-out patches from SEP-GluA3 infected GluA3-KO cell bodies, before (n=7) and after (n=8) wash-in of forskolin plus IBMX. Sindbis expression of SEP-GluA3 in GluA3-KO neurons rescues GluA3-dependent plasticity (t-test, p=0.03). (C) Example graphs of non-stationary noise analysis for WT, GluA3-KO and GluA1-KO outside-out recordings. (D) Average number of functional channels, single channel conductance and open probability extracted from non-stationary noise analysis of the outside-out recordings from WT (ctrl: n=14; FSK/IBMX: n=16), GluA3-KO (ctrl: n=10; FSK/IBMX: n=11), or GluA1-KO (ctrl: n=8; FSK/IBMX: n=7) CA1 neurons (see methods). Upon forskolin and IBMX GluA1-deficient neurons show an increased number of functional channels (t-test, p=0.0009), single channel conductance (t-test, p=0.04) and open probability (t-test, p=0.002). (E) Example images and average fluorescence intensity of GluA3-KO cell bodies (left; n=10) and dendrites (right; n=12) infected with SEP-GluA3 visualized with 2-photon laser scanning microscopy before and after wash-in of forskolin plus IBMX shows no change in SEP levels (dendrite: t-test, p=0.4; cell bodies: t-test, p=0.2). Scale bars indicate 5 μm. Error bars indicate SEM, * indicates p<0.05.
Figure 1—figure supplement 1
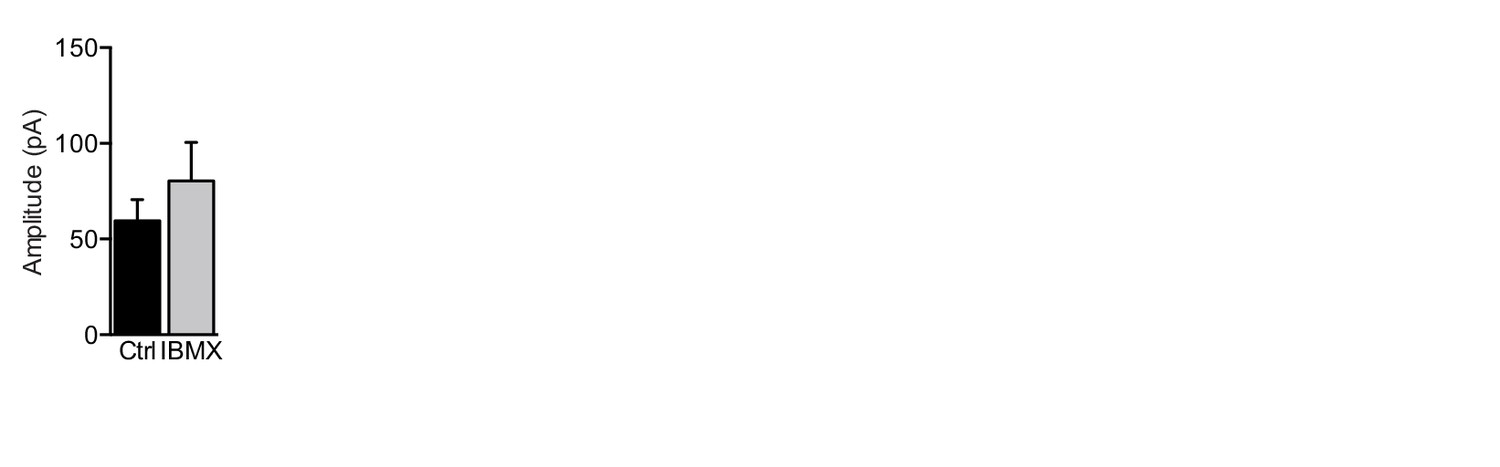
Blocking phosphodiesterase activity is not sufficient to induce significant AMPAR potentiation.
Amplitudes of outside-out evoked recordings (from SEP-GluA3-positive neurons) in response to AMPA puffs in control condition (n=7) or in the presence of IBMX (n=3) (t-test, p=0.4). Error bars indicate SEM.
Figure 1—figure supplement 2

SEP-GluA3 fluorescence is pH-sensitive.
Example images and average fluorescence intensity of SEP-infected GluA3-KO at the edge of cell bodies (top: n=3) or at apical dendrites (bottom: n=2) visualized with 2-photon laser scanning microscopy before and after wash-in of pH5-buffered ACSF. Scale bars indicate 5 μm.
Figure 2
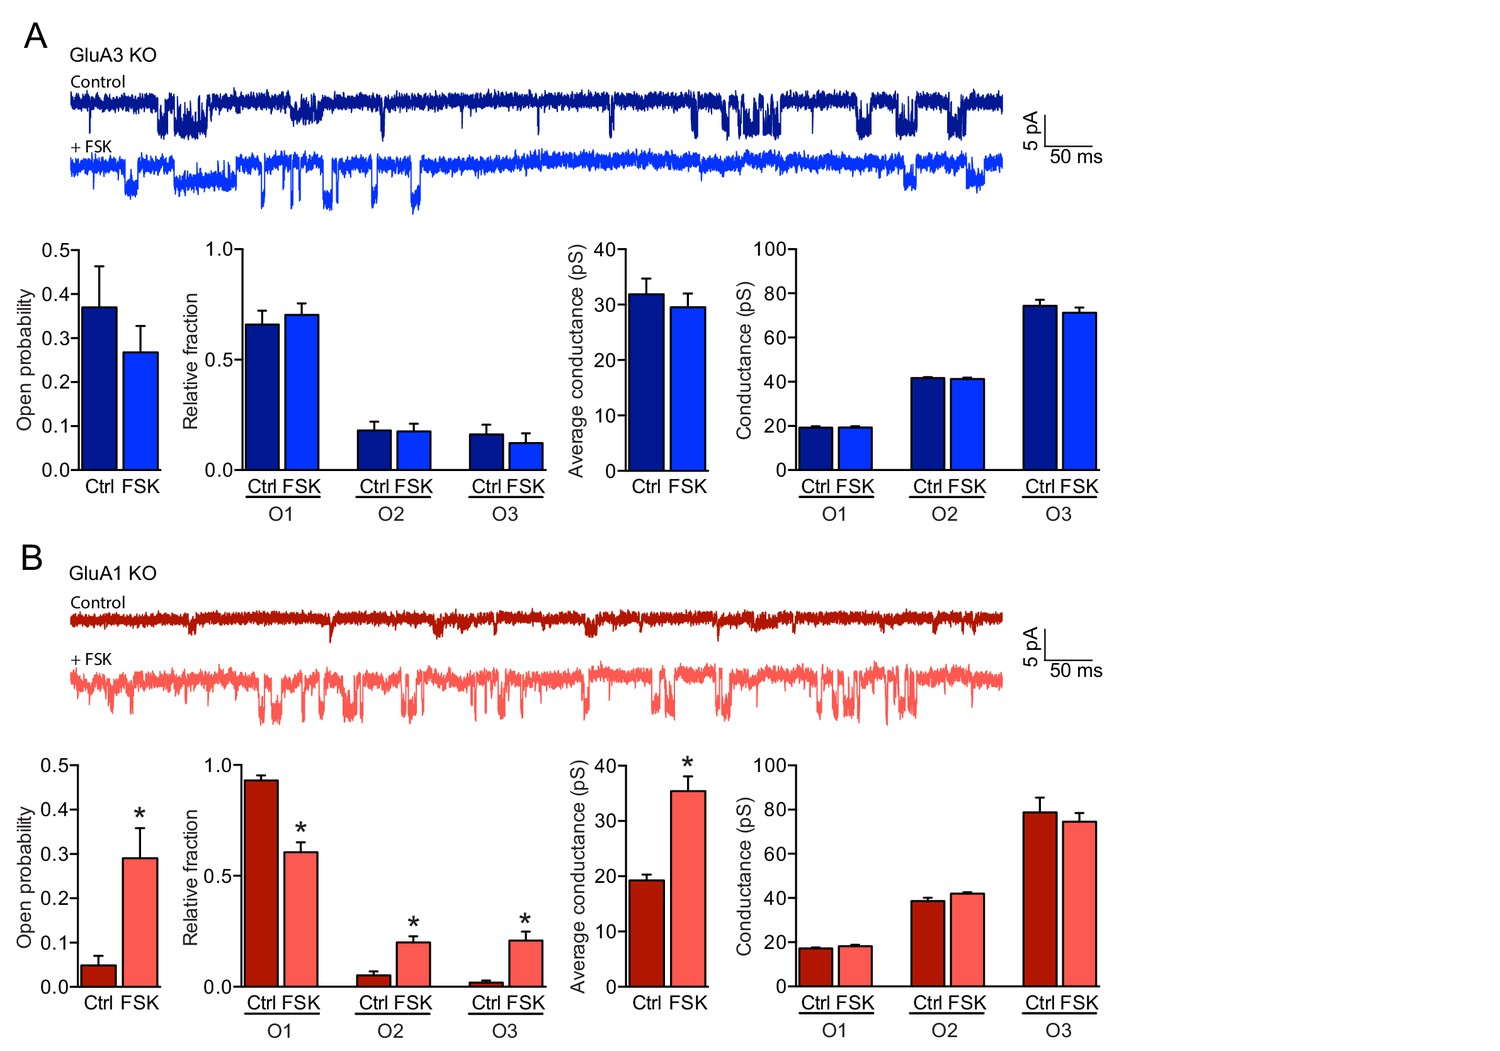
cAMP increases the open-channel probability of GluA3-containing AMPARs.
(A, B) Single channel recordings under cell-attached configuration showing example traces, open probability, fraction of time spent in each open state, average conductance and conductances of each open state. (A) GluA1-containing AMPARs on GluA3-KO neurons (blue) did not respond to forskolin (ctrl: n=15, FSK: n=14) (open-channel probability: t-test, p=0.9; single-channel conductance: t-test, p=0.5). (B) The open-probability (t-test, p=0.0001) and single-channel conductance (t-test: p<0.0001) increased of GluA3-containing AMPARs on GluA1-KO neurons (red) upon incubation with forskolin (ctrl: n=15, FSK n=14). Error bars indicate SEM, * indicates p<0.05.
Figure 3 with 3 supplements
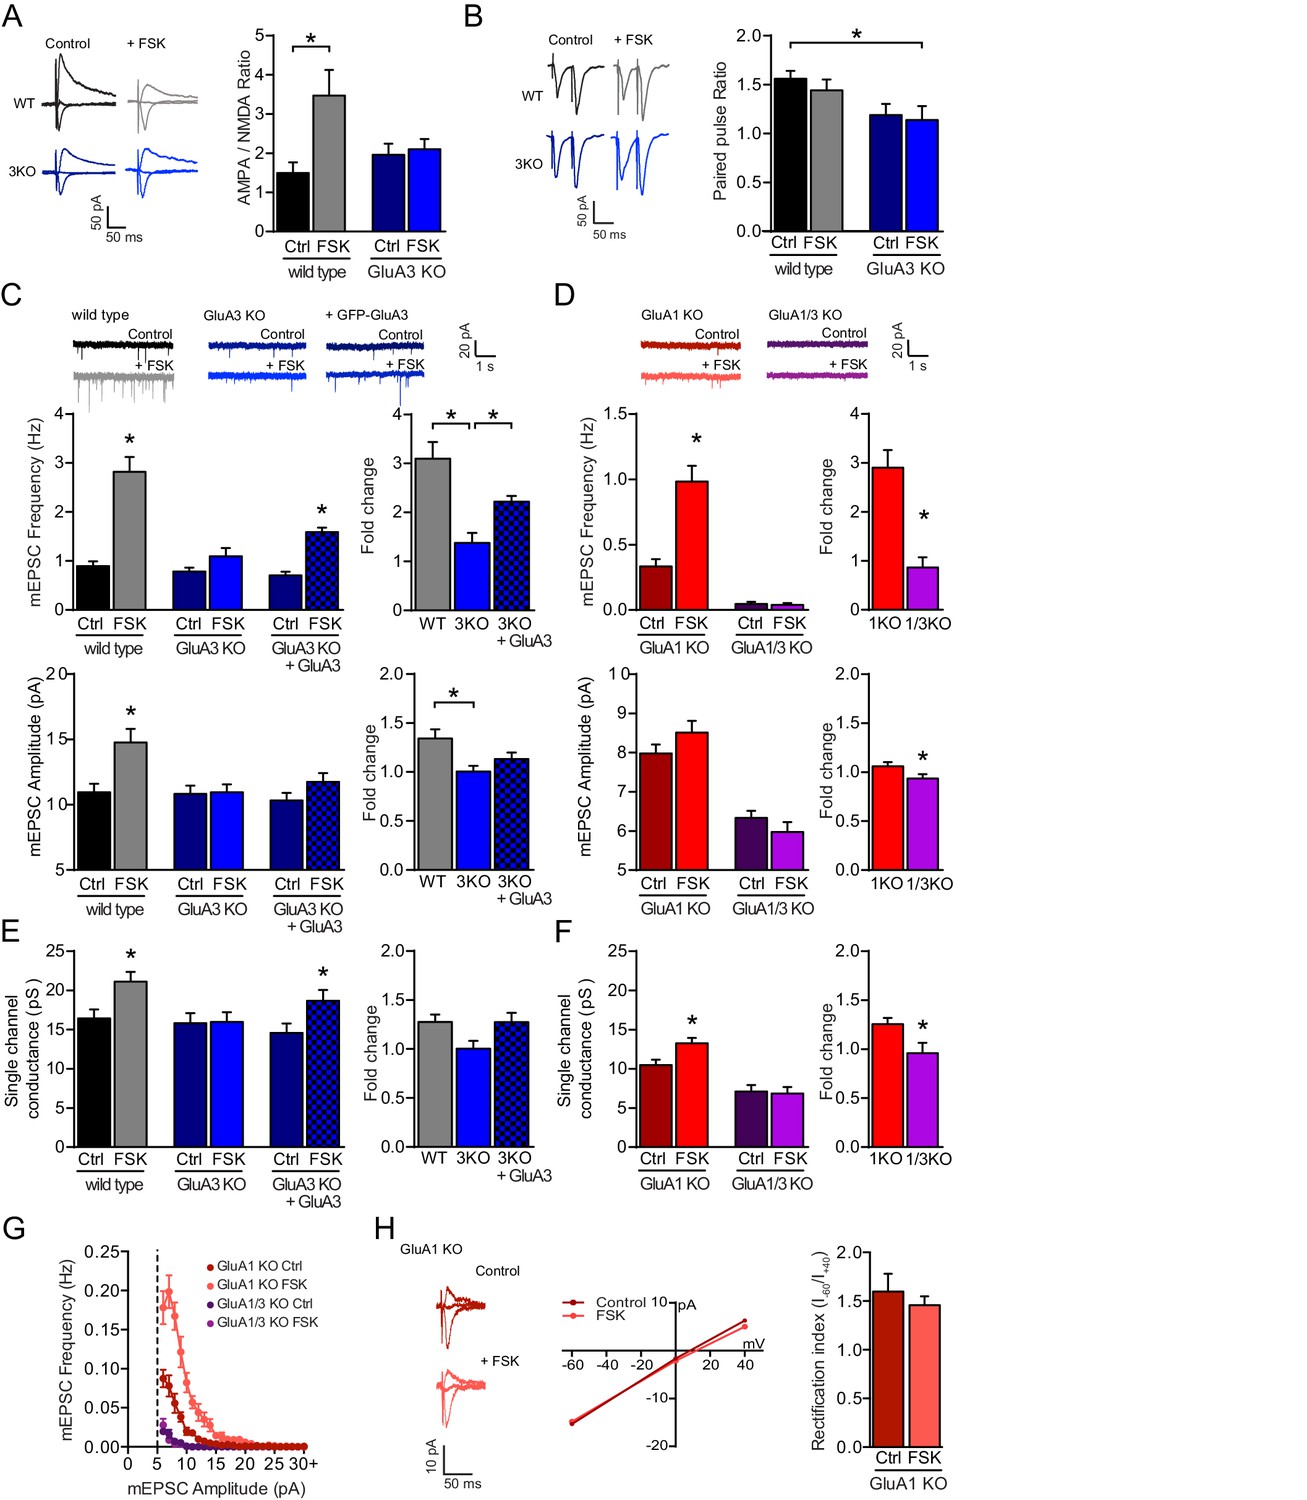
The cAMP-driven postsynaptic potentiation depends on GluA3.
(A) Example traces and average AMPA/NMDA EPSC ratios of WT neurons with (grey; n=13) or without (black; n=9) forskolin, and GluA3-KO neurons with (blue; n=8) or without (dark blue; n=8) forskolin. In WT neurons the AMPA/NMDA ratio increased upon forskolin incubation (ANOVA, p=0.02), but not in GluA3-KO neurons (ANOVA, p>0.9). (B) Example traces and average paired pulsed ratio, which were not different in WT CA1 neurons with (n=8) or without (n=8) forskolin (ANOVA: p=0.9), or of GluA3-KO neurons with (n=8) or without (n=8) forskolin (ANOVA: p>0.9). (C) In WT neurons mEPSC frequencies (t-test, p<0.0001) and amplitudes (t-test, p=0.001) were higher in presence (n=16) versus absence (n=15) of forskolin. In GluA3-KO CA1 the mEPSC frequency (t-test, p=0.15) and amplitude (t-test, p=0.9) were not different in presence (n=9) or absence (n=8) of forskolin. In Sindbis-infected GluA3-KO neurons expressing GFP-GluA3 (blocked bars) the mEPSC frequency (t-test, p<0.0001), but not amplitude (t-test, p=0.1), increased in presence (n=11) versus absence (n=8) of forskolin. The forskolin-driven fold increase in mEPSC frequency (ANOVA, p<0.0001) and amplitude (ANOVA, p=0.006) was higher in WT versus GluA3-KO neurons. This fold increase in GFP-GluA3 infected versus uninfected GluA3-KO neurons was larger in mEPSC frequency (ANOVA, p=0.007), but not amplitude (ANOVA, p=0.4). (D) Forskolin increased mEPSC frequencies (t-test, p<0.0001) and amplitudes (t-test, p=0.15) of GluA1-KO neurons (ctrl: dark red; n=11; FSK: light red; n=10), but not in GluA1/3-KO neurons (ctrl: dark purple; n=11; FSK: light purple; n=8). The forskolin-driven fold increase in mEPSC frequency (t-test, p<0.0001) and amplitude (t-test, p=0.03) was larger in GluA1-KO versus GluA1/3-KO. (E) Non-stationary noise analysis of scaled mEPSCs revealed single-channel conductance of WT neurons with (n=10) or without (n=13) forskolin (t-test, p=0.009), GluA3-KO neurons with (n=8) or without (n=8) forskolin (t-test, p=0.9), and GFP-GluA3-expressing GluA3-KO neurons with (n=11) or without (n=8) forskolin (t-test, p=0.03), and forskolin-driven fold increase in single-channel conductance (WT vs GluA3-KO: ANOVA, p=0.07; GluA3-KO uninf. vs GFP-GluA3-inf: ANOVA, p=0.07). (F) Non-stationary noise analysis of scaled mEPSCs revealed single-channel conductance of GluA1-KO neurons with (n=8) or without (n=12) forskolin (t-test, p=0.01) and GluA1/3-KO neurons with (n=6) or without (n=11) forskolin (t-test, p=0.9), and forskolin-driven fold increase in single-channel conductance (t-test, p=0.02). (G) mEPSC distribution per 1 pA binned amplitude of GluA1-KO neurons without (dark red; n=11) or with (light red; n=10) forskolin and GluA1/3-KO neurons without (dark purple; n=11) or with (light purple; n=8) forskolin. (H) GluA3 exists as GluA2/3 heteromeric AMPARs. Example traces with corresponding I-V curve and average rectification indices ((I-60mV – I0mV) / (I+40mV – I0mV)) were determined in GluA1-KO organotypic slices of CA1 neurons without (n=6) or with (n=6) forskolin treatment (t-test, p=0.7). Error bars indicate SEM, * indicates p<0.05.
Figure 3—figure supplement 1
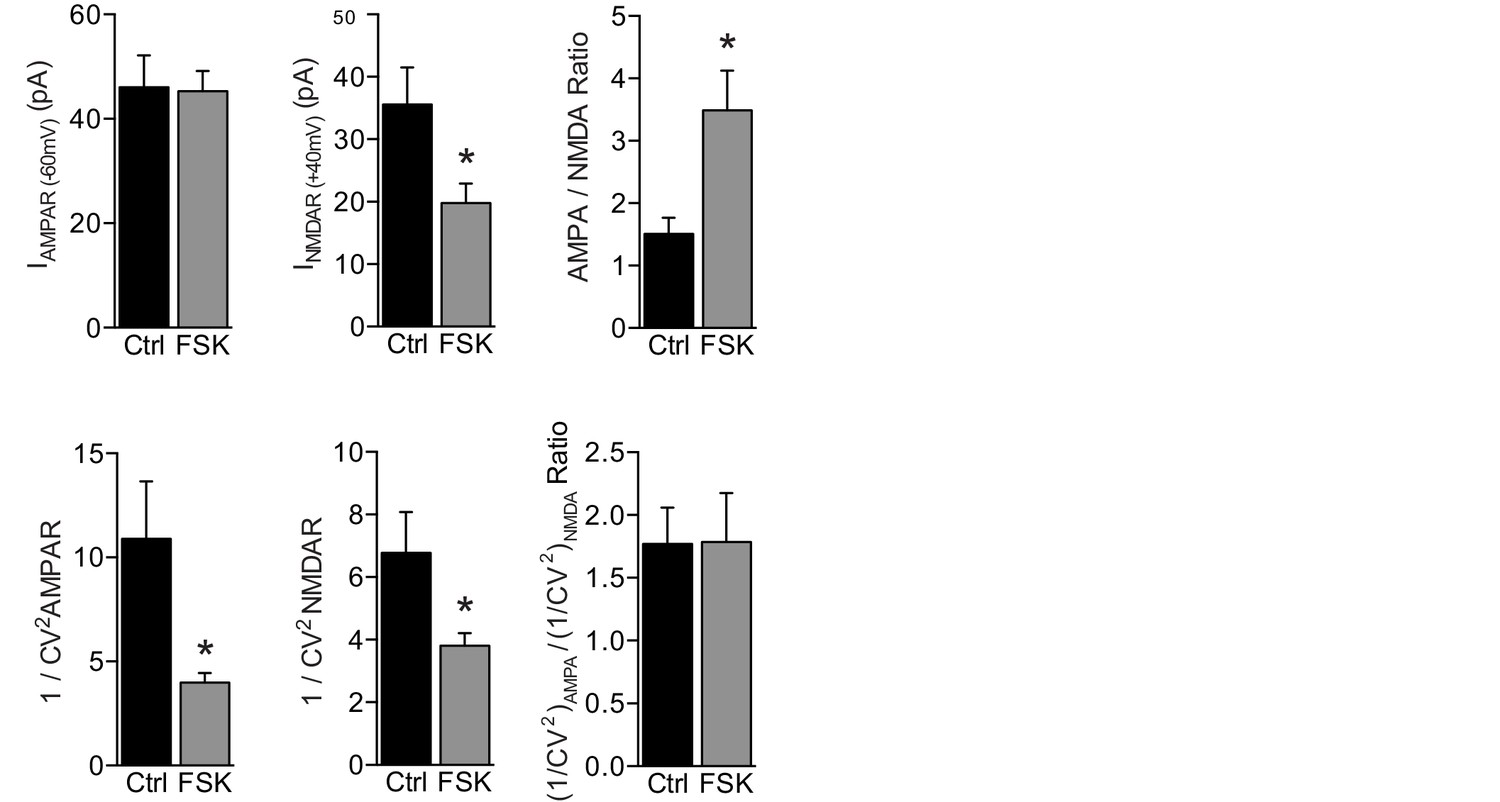
Forskolin increases postsynaptic AMPAR currents.
Evoked EPSC amplitude and quantal content (1/CV2) of AMPAR EPSCs, NMDAR EPSC, and AMPA/NMDA EPSC ratio upon stimulation of Schaffer collateral axons (as seen in Figure 3A) of WT CA1 neurons with (n=13) or without (n=9) forskolin. AMPAR responses of approximately 50 pA in amplitude were evoked while holding the CA1 neuron at −60 mV. The same stimulation intensity was maintained at +40 mV to measure NMDAR responses, which were significantly smaller in the presence of forskolin (t-test, p=0.03), leading to increased AMPA/NMDA ratios (t-test, p=0.01). By applying a variance analysis on these AMPAR and NMDAR responses, we quantified the average quantal content of glutamate release by determining the inverse square of the coefficient of variation (1/CV2). The 1/CV2 depends on the presynaptic release probability (Pr) and number of effective synapses (N), but not on postsynaptic quantal size, as: 1/CV2=N×Pr ⁄ (1 − Pr) (Kerchner and Nicoll, 2008). In the presence of forskolin the 1/CV2 of both AMPAR and NMDAR responses was significantly lower (AMPAR: t-test, p=0.001; NMDAR: t-test, p=0.04). Thus, a lower quantal content induced proportionally lower NMDAR responses but similarly sized AMPAR responses when forskolin was present. One explanation for this observation is that forskolin caused a decrease in Pr, which was reflected by lower NMDAR responses but not AMPAR responses, because it was accompanied by an increase in the postsynaptic AMPAR response to glutamate. However, a lower Pr does not match the increased mEPSC frequency in Figure 3C. A more plausible explanation therefore is that on average fewer synapses need to be stimulated in the forskolin condition to evoke synaptic AMPAR responses of the same amplitude, and this lower number of stimulated synapses led to correspondingly lower NMDA currents. In both scenarios, forskolin increased postsynaptic AMPAR currents without substantially changing NMDAR currents, and did not increase the presynaptic release probability. Forskolin incubation did not change the relative quantal content measured from AMPAR and NMDAR responses (t-test, p=0.7), which suggests that the activation of GluA2/3-plasticity in WT neurons did not involve the unsilencing of synapses. Error bars indicate SEM, * indicates p<0.05.
Figure 3—figure supplement 2
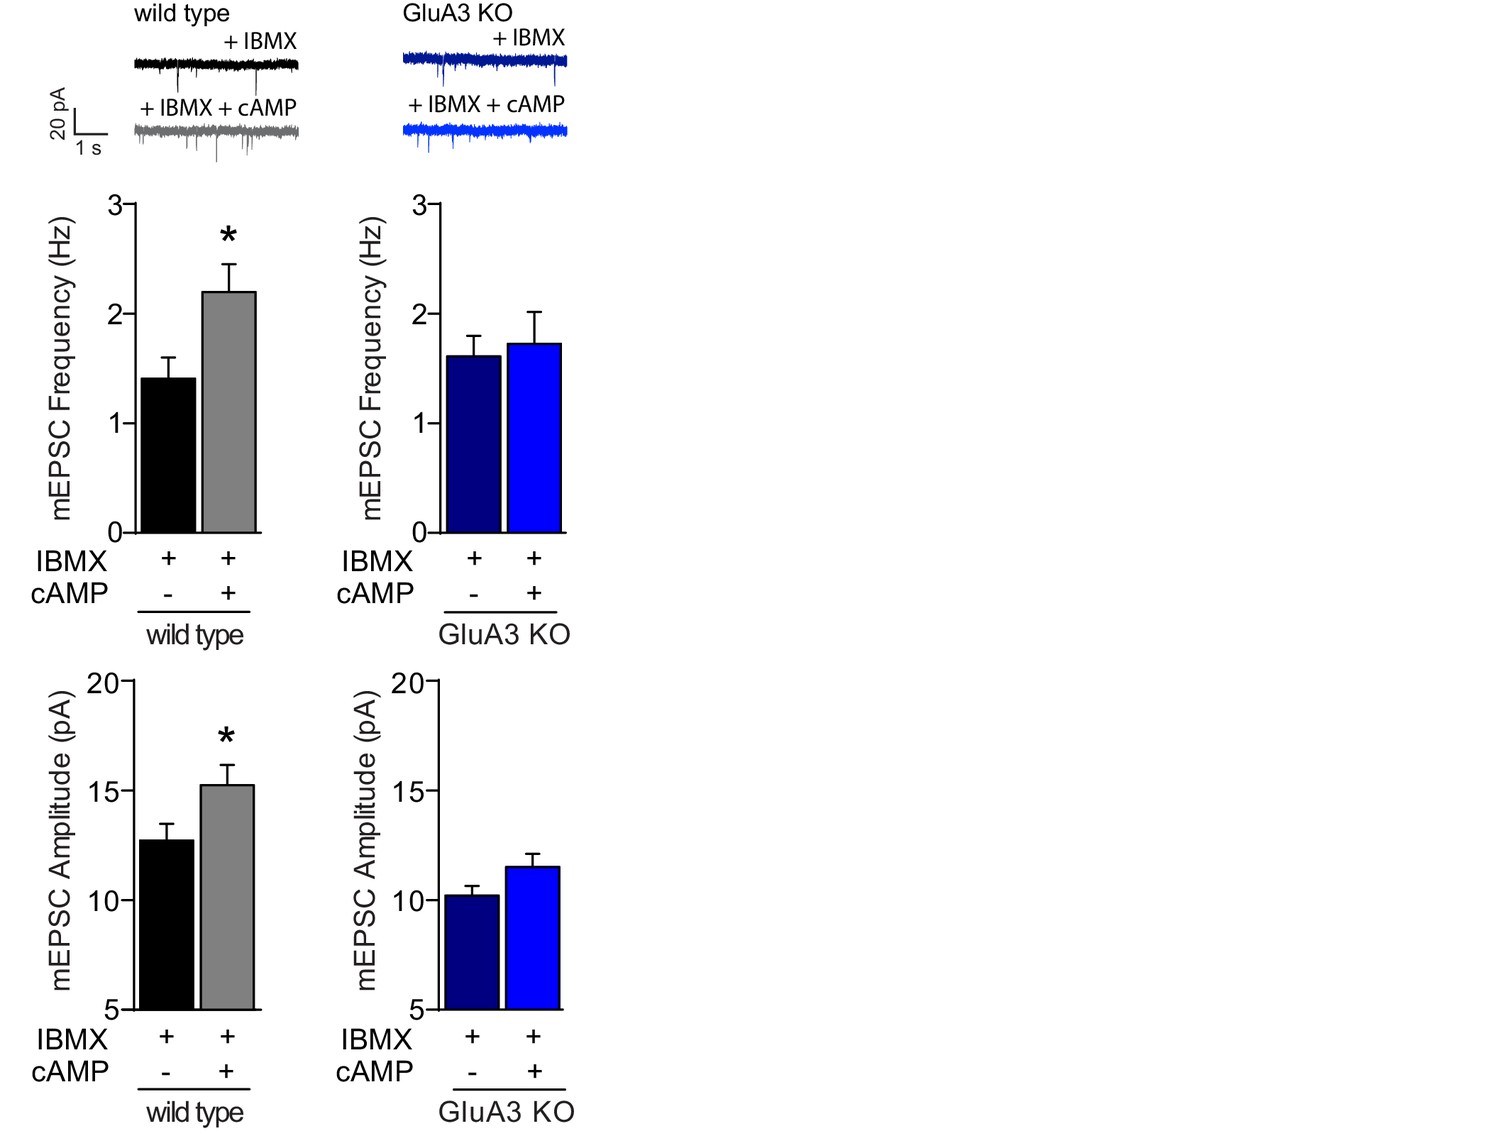
Postsynaptically applied cAMP causes a GluA3-dependent synaptic potentiation.
Example traces, mEPSC frequencies and mEPSC amplitudes in the presence of IBMX of WT neurons with (n=10) or without (n=11) cAMP and of GluA3-KO neurons with (n=8) or without (n=8) cAMP in recording pipette. In WT neurons cAMP/IBMX caused increased mEPSC frequency (t-test, p=0.02) and amplitude (t-test, p=0.04). In GluA3-KO neurons we observed no significant change in mEPSC frequency (t-test, p=0.8) or amplitude (t-test, p=0.8). Error bars indicate SEM, * indicates p<0.05.
Figure 3—figure supplement 3
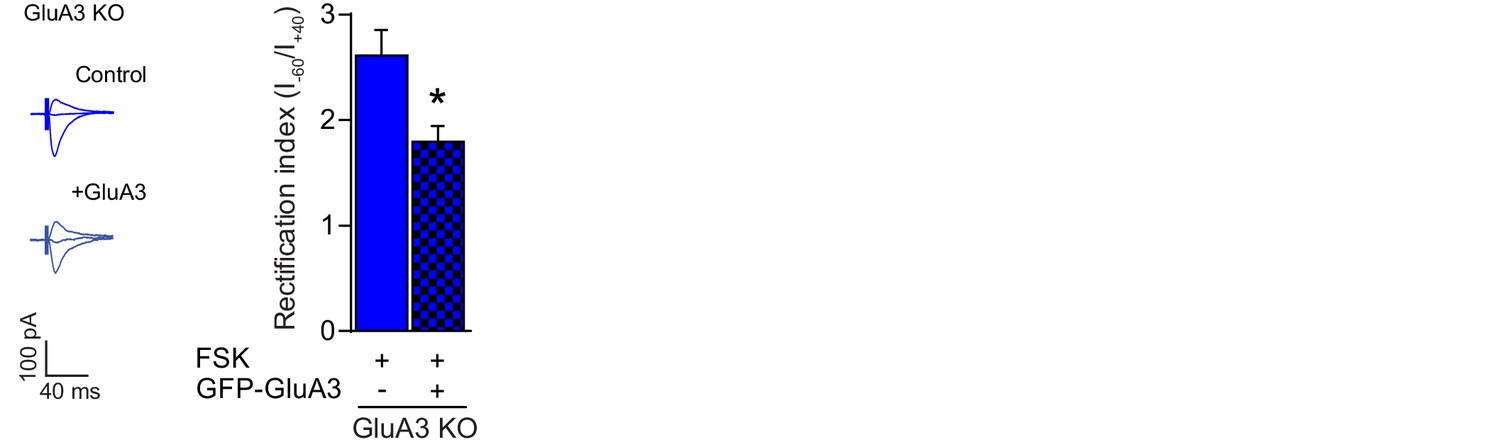
Sindbis viral GFP-GluA3 expression predominantly traffic into CA1 synapses in configuration of GluA2/3 heteromers.
Example traces and average rectification indices ([I-60mV – I0mV) / (I+40mV – I0mV]) were determined in uninfected (n=8) or GFP-GluA3 infected (n=8) CA1 neurons from GluA3-KO organotypic slices in the presence of forskolin (t-test, p=0.01). Error bars indicate SEM, * indicates p<0.05.
Figure 4 with 1 supplement
cAMP does not affect GluA2/3 mobility or trafficking to synapses.
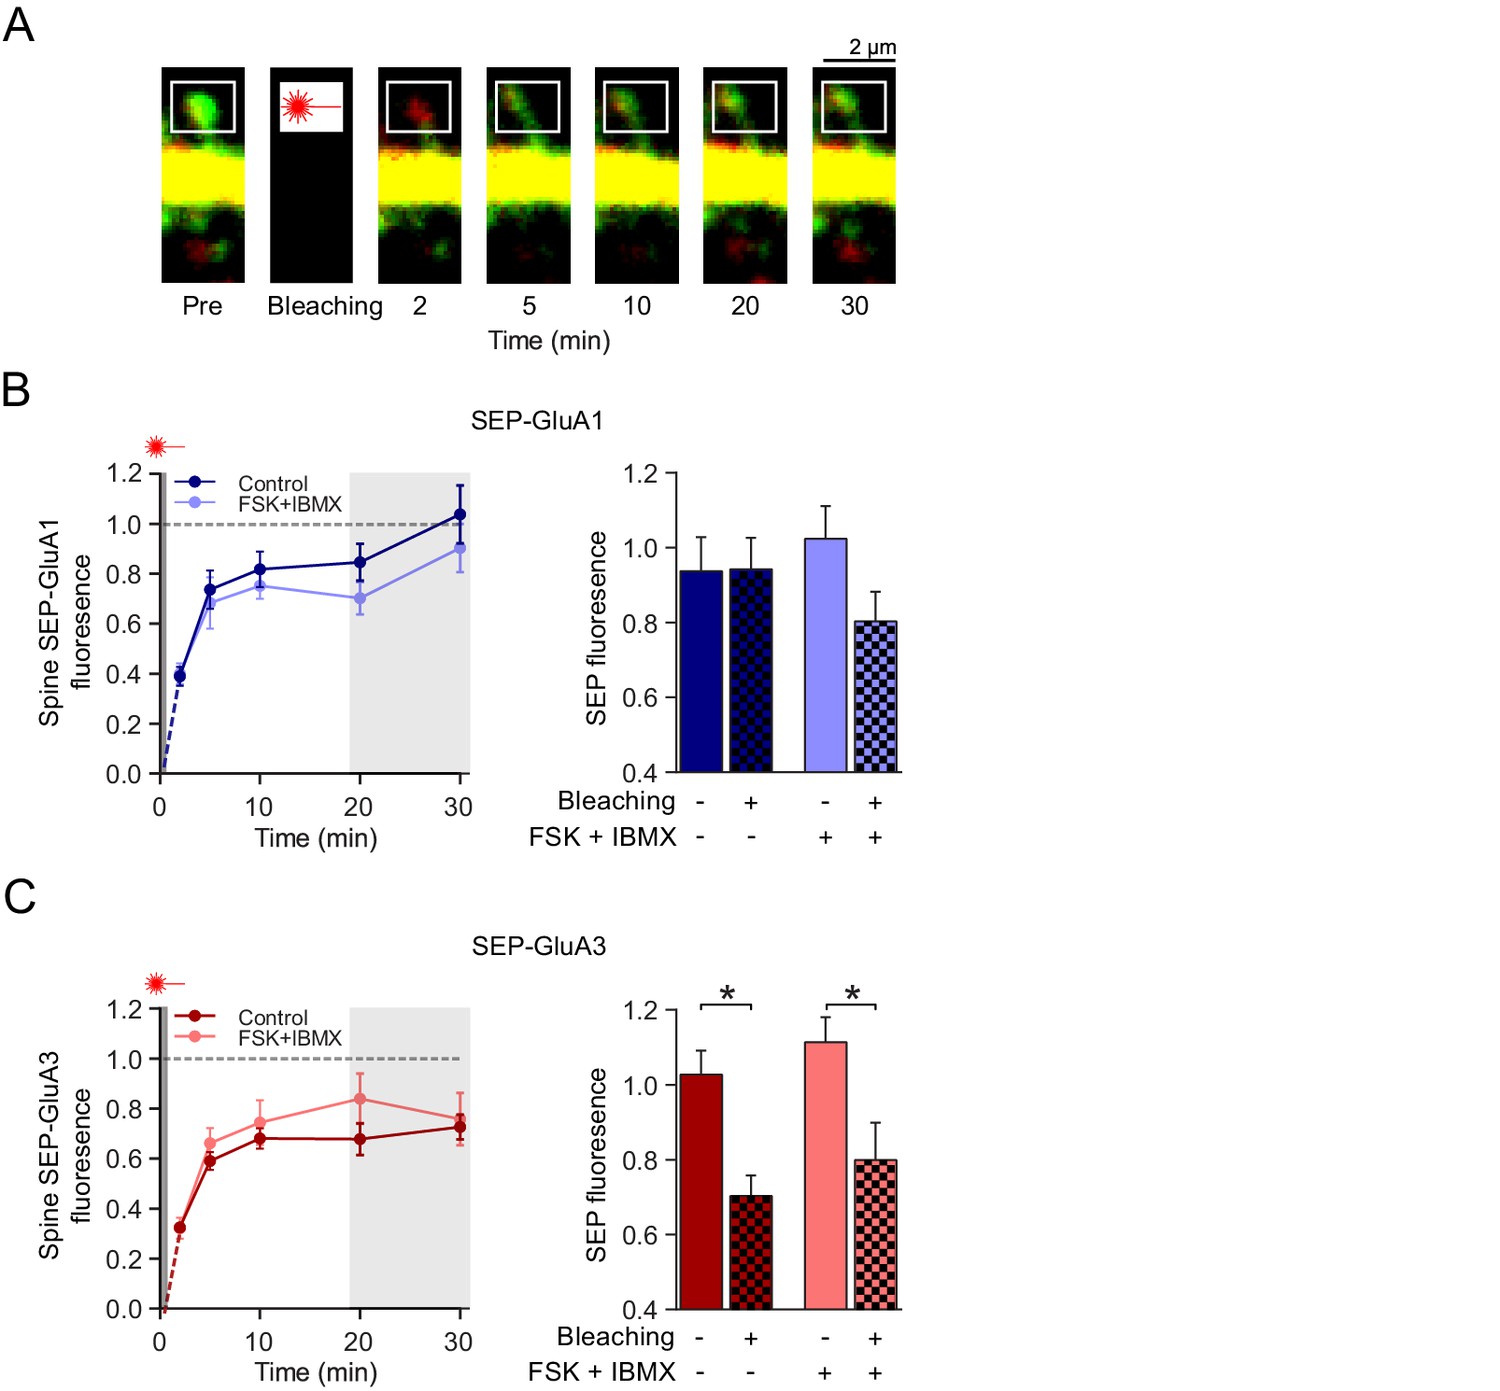
(A) Example image of a FRAP experiment: a spine from a CA1 neuron transfected with SEP-GluA3 + tdTomato obtained with two-photon microscopy immediately before, and 2, 5, 10, 20 and 30 min after photobleaching of the spine. (B) Left: Quantification of FRAP dynamics of spines transfected with SEP-GluA1 + tdTomato in the absence (dark blue; n=8) and the presence (light blue; n=6) of forskolin and IBMX. Right: Average fluorescence at time-points 20 min and 30 min after photobleaching of bleached spines (Ctrl: n=7, FSK/IBMX: n=8) in comparison to non-bleached neighboring spines (Ctrl: n=6, FSK/IBMX: n=6) in absence (ANOVA, p>0.9) or presence (ANOVA, p=0.3) of forskolin (see Figure 4—figure supplement 1). (C) Left: Quantification of FRAP dynamics of spines transfected with SEP-GluA3 + tdTomato in the absence (dark red; n=7) and the presence (light red; n=8) of forskolin and IBMX. Right: Average fluorescence at time-points 20 min and 30 min after photobleaching of bleached spines in comparison to unbleached neighboring spines (Ctrl: n=5, FSK/IBMX: n=5) in the absence (ANOVA, p=0.04) or presence (ANOVA, p=0.04) of forskolin (see Figure 4—figure supplement 1). Error bars indicate SEM, * indicates p<0.05.
Figure 4—figure supplement 1

Controls in FRAP experiment.
(A) Fast fluorescence recovery of cytoplasmic TdTomato signal in photobleached spines. Left: tdTomato signal of spines transfected with SEP-GluA1 + tdTomato in the absence (dark blue; n=8) and the presence (light blue; n=6) of forskolin and IBMX (RM-ANOVA, p=0.09). Right: tdTomato signal of spines transfected with SEP-GluA3 + tdTomato in the absence (dark red; n=7) and the presence (light red; n=7) of forskolin and IBMX (RM-ANOVA, p=0.3). (B) SEP signal in neighboring control spines were unaffected after photobleaching. SEP signals normalized to tdTomato signal of control non-bleached spines transfected with SEP-GluA1 (left: n=6; RM-ANOVA, p=0.3) or SEP-GluA3 (right: n=5; RM-ANOVA, p=0.06) in the absence (dark) and the presence (light) of forskolin and IBMX. Error bars indicate SEM.
Figure 5 with 3 supplements
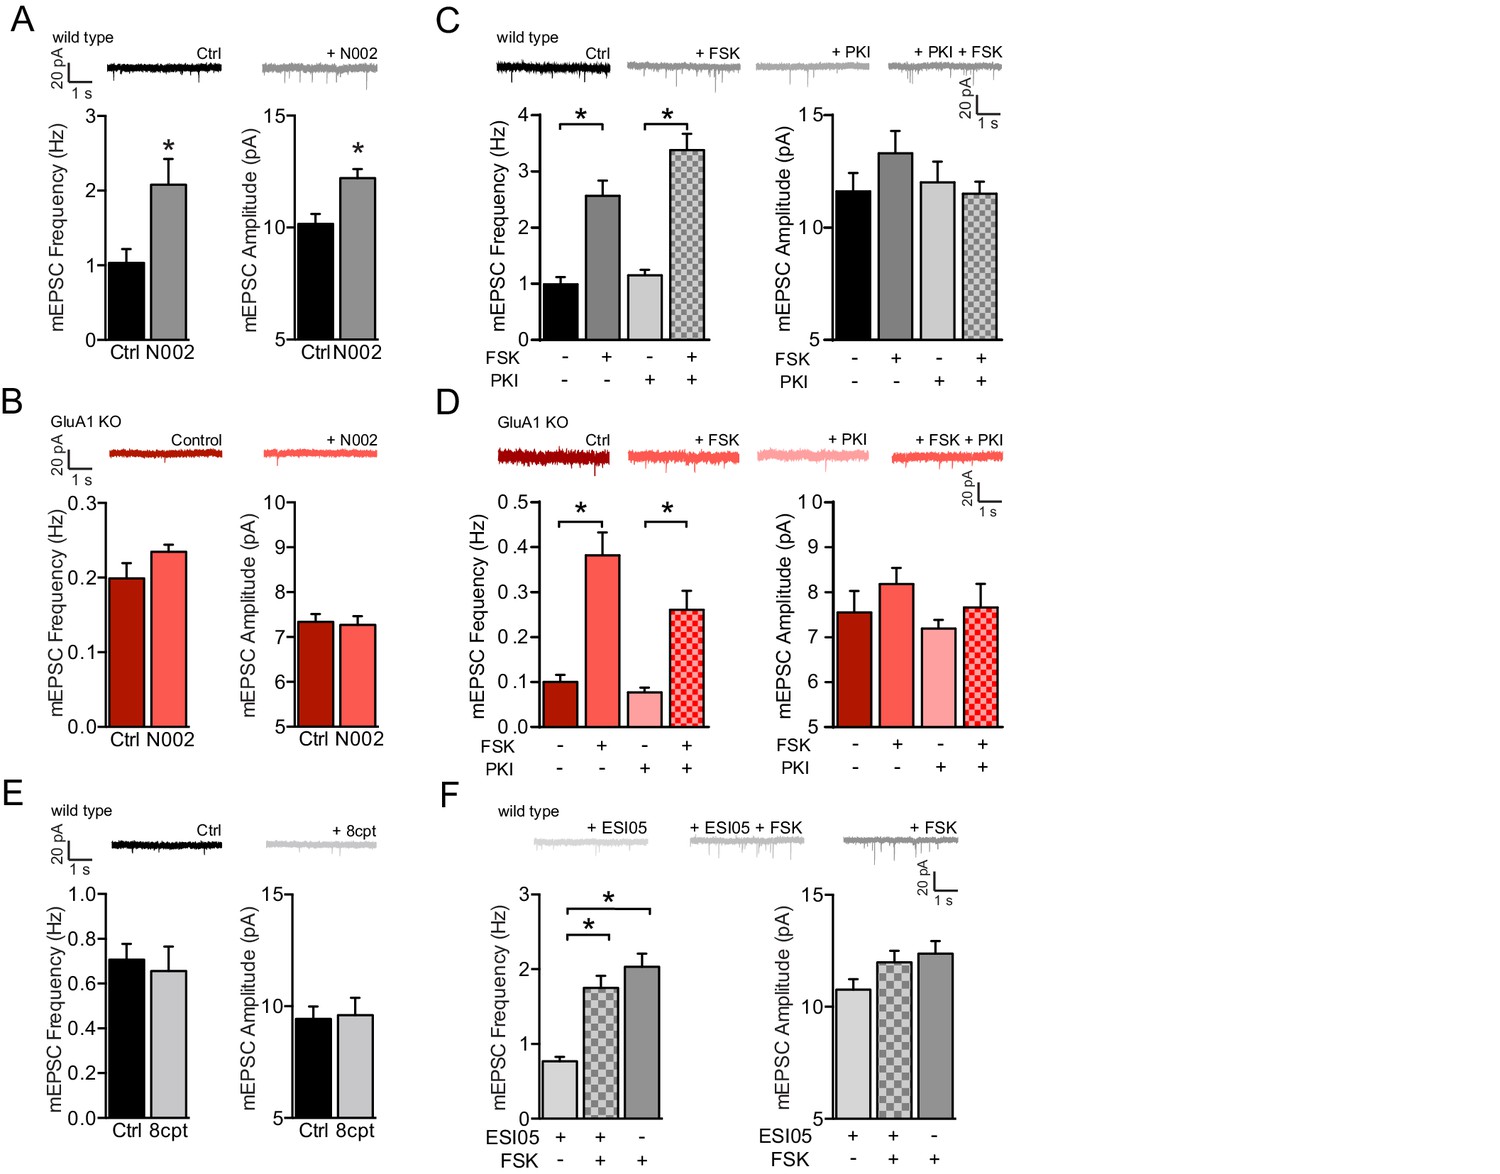
PKA and Epac activation are not sufficient to activate GluA2/3-plasticity.
(A) Example traces, mEPSC recordings of WT neurons with (n=12) or without (n=13) PKA agonist N002 in the recording pipette. N002 increased mEPSC frequency (t-test, p=0.004) and mEPSC amplitude (t-test, p=0.007). (B) Example traces, mEPSC recordings from GluA1-KO neurons with (n=13) or without (n=15) N002 in the recording pipette. N002 did not increase mEPSC frequency (t-test, p=0.06) and mEPSC amplitude (t-test, p=0.8) when GluA1 is not expressed. (C) Example traces, mEPSC frequencies and mEPSC amplitudes of untreated CA1 neurons (n=8), neurons incubated with forskolin (n=9), incubated with PKA inhibitor PKI (n=7), or preincubated with PKI prior to forskolin (n=10). PKI did not prevent the forskolin-driven increase in mEPSC frequency (ANOVA, ctrl vs FSK: p<0.0001, PKI vs FSK/PKI: p<0.0001). (D) Same as for (B) for GluA1-KO CA1 neurons either untreated (n=4), incubated with forskolin (n=5), incubated with PKI (n=5), or preincubated with PKI prior to forskolin (n=5) (ANOVA, ctrl vs FSK: p<0.0001, PKI vs FSK/PKI: p=0.0001). (E) mEPSC recordings from wildtype CA1 neurons with control intracellular solution (n=7) or with Epac activator 8-CPT-2Me-cAMP in the recording pipette (n=7). 8-CPT-2Me-cAMP did not increase average mEPSC frequency (t-test, p=0.5) or amplitude (t-test, p=0.9) (F) WT CA1 neurons incubated with Epac inhibitor ESI-05 (n=12), forskolin (n=10) or preincubated with ESI-05 prior to forskolin (n=15). ESI-05 did not prevent the forskolin-driven synaptic potentiation (ANOVA, ESI-05 vs ESI-05/FSK: p<0.0001; ESI-05 vs FSK: p<0.0001; ESI-05/FSK vs FSK: p=0.4). Error bars indicate SEM, * indicates p<0.05.
Figure 5—figure supplement 1
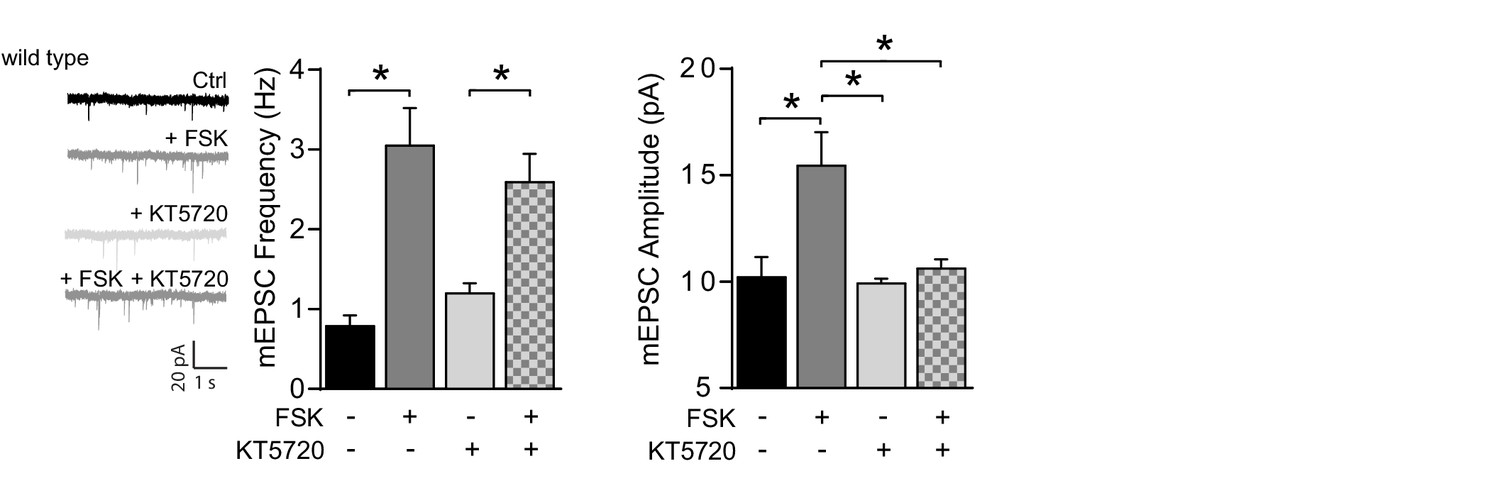
PKA-inhibitor KT5720 prevents the forskolin driven increase in mEPSC amplitude, but not frequency.
Untreated wild-type CA1 neurons (n=7), neurons incubated with forskolin (n=8), with PKA inhibitor KT5720 (n=10), preincubated with KT5720 prior to forskolin (n=10). KT5720 blocked the forskolin-driven increase in mEPSC amplitude (ANOVA, ctrl vs FSK: p=0.0002; KT5720 vs KT5720/FSK: p=0.8; FSK vs KT5720/FSK: p=0.005), but not mEPSC frequency (ANOVA, ctrl vs FSK: p<0.0001; KT5720 vs KT5720/FSK: p=0.005; FSK vs KT5720/FSK: p=0.9). Error bars indicate SEM, * indicates p<0.05.
Figure 5—figure supplement 2
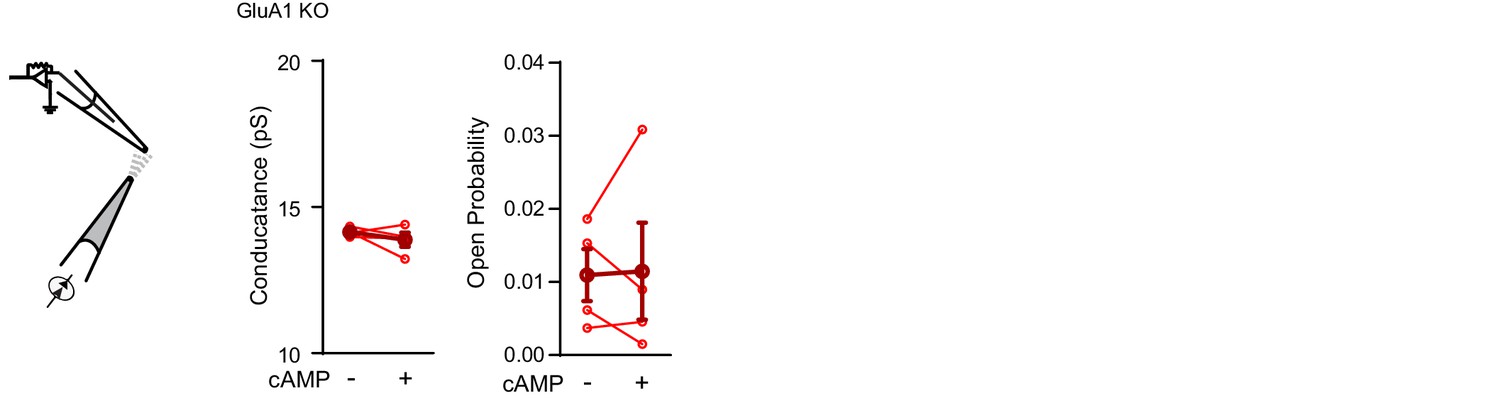
Cyclic AMP does not directly activate GluA2/3-receptor complexes.
Conductance (left; paired t-test, p=0.4) and open probability (right; paired t-test, p=0.5) of somatic inside-out recordings from GluA1-KO CA1 neurons with S-AMPA (100 μM) in the recording pipette (n=4), before and after puffing cAMP (100 μM) onto the patch. Error bars indicate SEM.
Figure 5—figure supplement 3
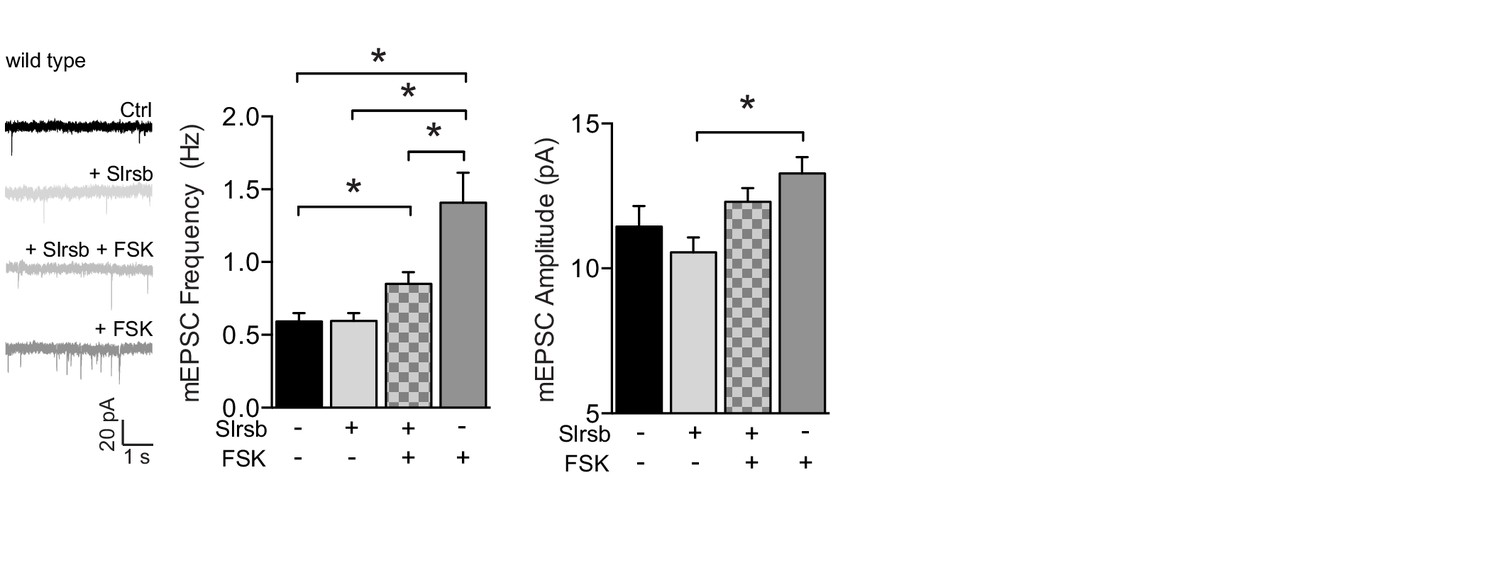
Farnesyltransferase antagonist Salirasib, a non-selective Ras inhibitor, partly blocks cAMP-driven synaptic potentiation.
Example traces, mEPSC frequencies and mEPSC amplitudes of untreated CA1 neurons (n=19), neurons incubated with forskolin (n=14), with Salirasib (n=18), preincubated with salirasib prior to forskolin (n=14). Salirasib partially blocked the forskolin-mediated increase in mEPSC frequency (ANOVA, ctrl vs Slrsb: p>0.9; ctrl vs Slrsb: p=0.04; ctrl vs FSK: p<0.0001; FSK vs Slrsb/FSK: p=0.04). Error bars indicate SEM, * indicates p<0.05.
Figure 6 with 2 supplements
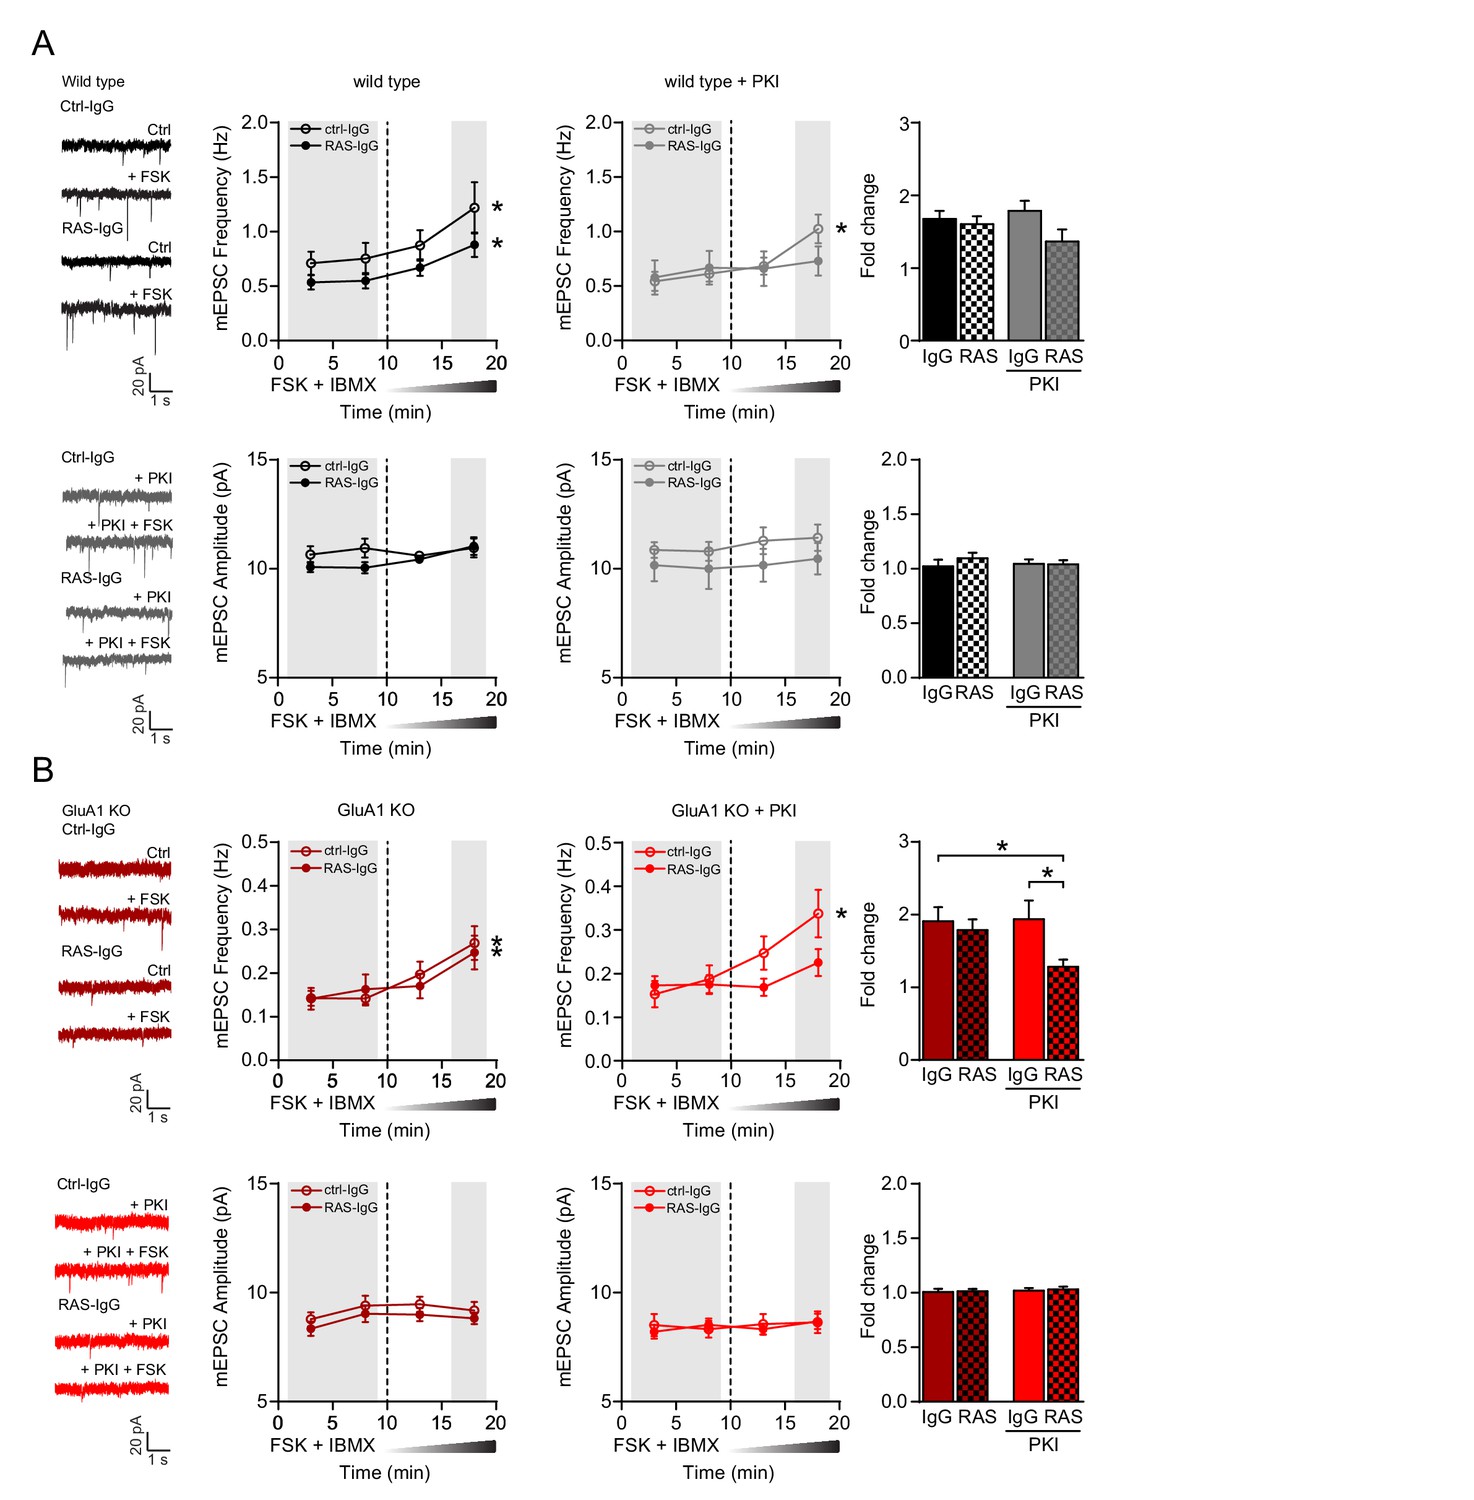
cAMP activates GluA2/3-plasticity through a PKA- and Ras-dependent signaling pathway.
(A–B) Miniature EPSC recordings with anti-Ras IgG or control IgG in recording pipette from CA1 neurons in brain slices acutely isolated from mature wild type and GluA1-KO mice. After ten minutes baseline recording to allow antibody to perfuse into the cell, forskolin and IBMX were washed in the extracellular solution. (A) Upon the wash-in of forskolin, WT neurons showed an increase in mEPSC frequency in the presence of control IgG (paired t-test, p<0.001) and anti-Ras IgG (paired t-test, p<0.001), but not in mEPSC amplitude (paired t-test, ctrl-IgG: p=0.7; RAS-IgG: p=0.055). Stars indicate a significant increase at 15–20 min compared to the 10 min baseline. In the presence of PKI, the wash-in of forskolin led to a significant increase in frequency in neurons perfused with control IgG (paired t-test, p=0.007), but not with Ras IgG (paired t-test: p=0.07). Comparisons between the fold changes did not yield significant results (ANOVA, p=0.12; IgG: n=7; Ras: n=9; IgG/PKI: n=10; Ras/PKI: n=9). (B) In GluA1-deficient neurons, the wash in of forskolin also increased mEPSC frequency regardless of the antibody (paired t-test, ctrl-IgG: p<0.001; Ras-IgG: p<0.0001). mEPSC amplitudes were not affected by forskolin (paired t-test, ctrl-IgG: p=0.7; Ras-IgG: p=0.3). In the presence of PKI neurons perfused with control IgG show a significant increase in frequency upon the wash in of forskolin (paired t-test, p=0.006). In neurons with Ras-IgG this potentiation was absent (paired t-test: p=0.15). The fold increase in mEPSC frequency is blocked by the anti-Ras antibody in the presence of PKI in GluA1-KO neurons (ANOVA, IgG/PKI vs Ras/PKI: p=0.03; IgG vs Ras/PKI: p=0.04; IgG: n=11; Ras-IgG: n=12; IgG/PKI: n=10; Ras-IgG/PKI: n=14). Error bars indicate SEM.
Figure 6—figure supplement 1
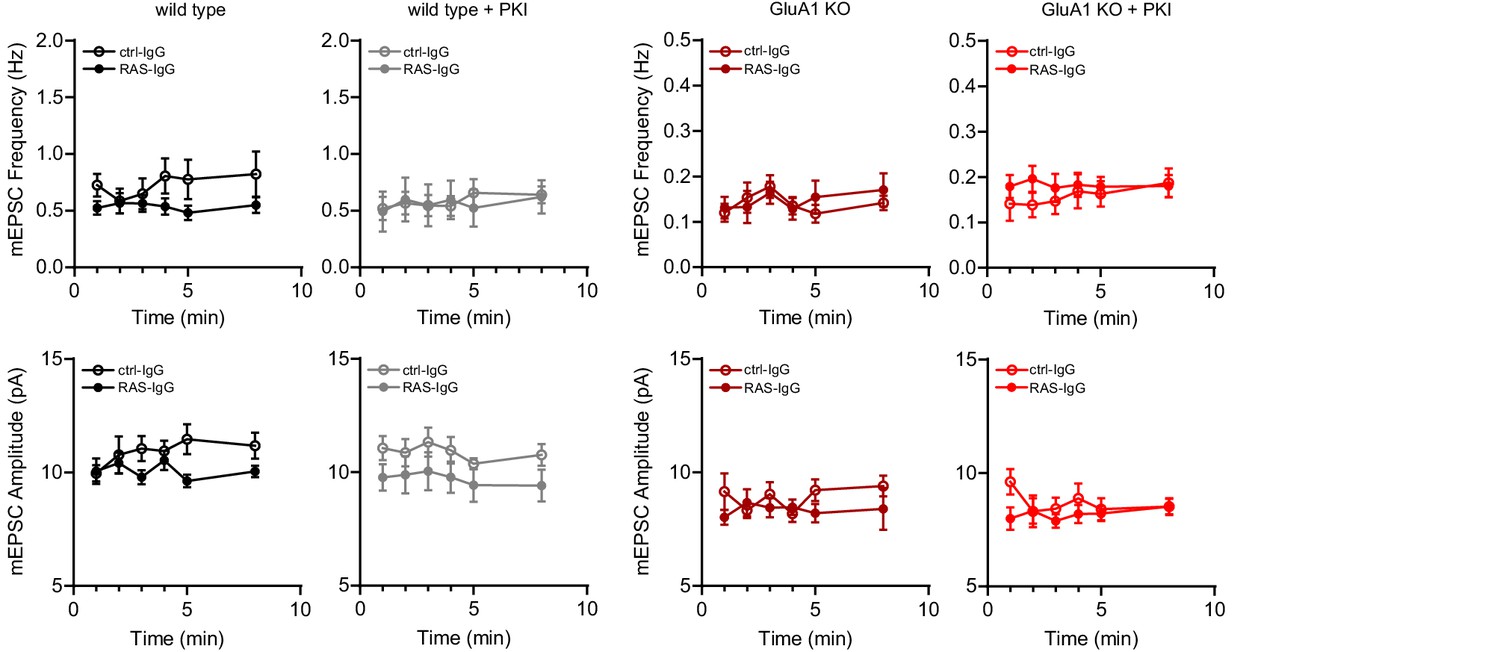
The infusion of anti-Ras IgG or control IgG did not affect basal mEPSC frequency or amplitude.
Recordings as shown in Figure 6 were made in acute slices from WT (IgG: n=7; RasIgG: n=9; IgG/PKI: n=9; RasIgG/PKI: n=7) or GluA1-KO mice (IgG: n=11; RasIgG: n=11; IgG/PKI: n=8; RasIgG/PKI: n=12) in the presence or absence of PKI and with the infusion of anti-Ras IgG or control IgG in the internal solution. Miniature EPSC recordings were started immediately after achieving whole-cell configuration and the average mEPSC frequency and amplitude were determined per minute. No significant changes over time were detected in both frequency and amplitude (RM-ANOVA, WT freq: p=0.09, ampl: p=0.6; WT/PKI freq: p=0.04, all post hoc p>0.05, ampl: p=0.4; GluA1-KO freq: p=0.1, ampl: p=0.9; GluA1-KO/PKI freq: p=0.5, ampl: p=0.3).
Figure 6—figure supplement 2
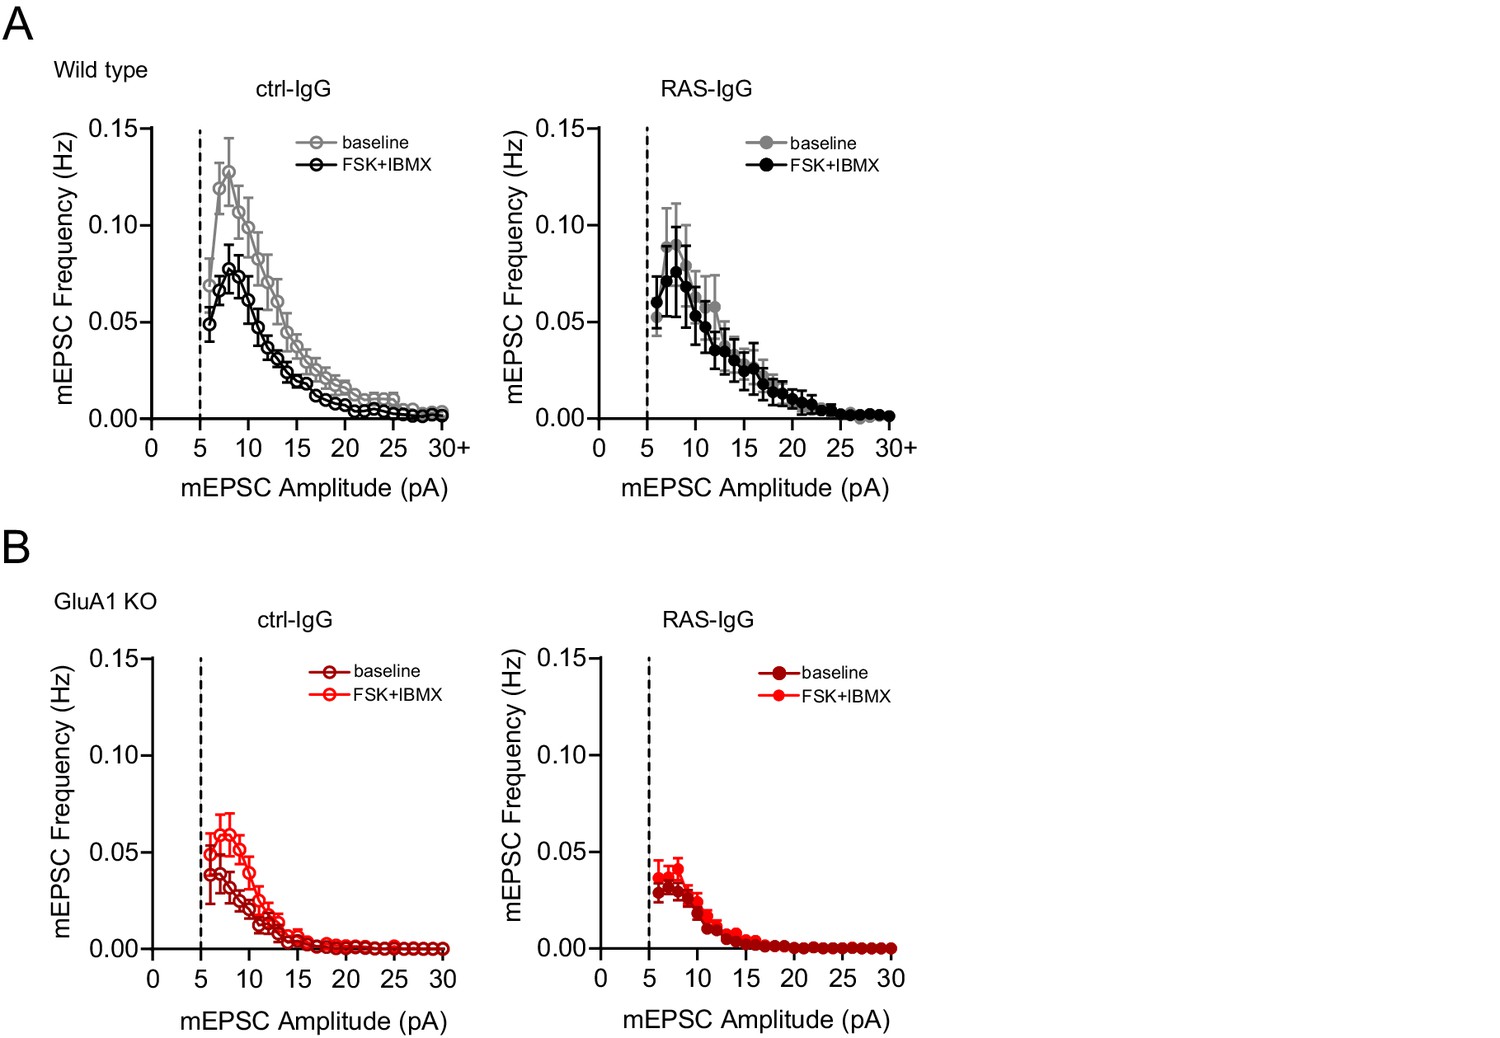
Frequency distribution of mEPSC events.
Distribution of mEPSCs per 1 pA binned amplitude of recordings shown in Figure 6 (+PKI condition) of (A) wild type neurons perfused with ctrl-IgG (left) or RAS-IgG (right) during baseline (black) and upon wash in of forskolin (grey). (B) GluA1-ko neurons perfused with ctrl-IgG (left) or RAS-IgG (right) during baseline (dark red) and upon wash in of forskolin (light red). Error bars indicate SEM.
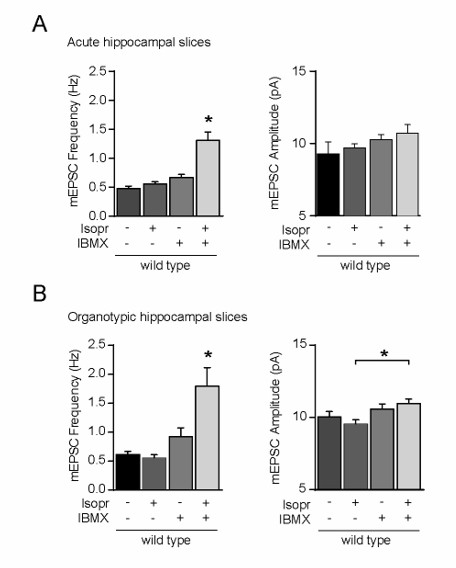
Figure 7
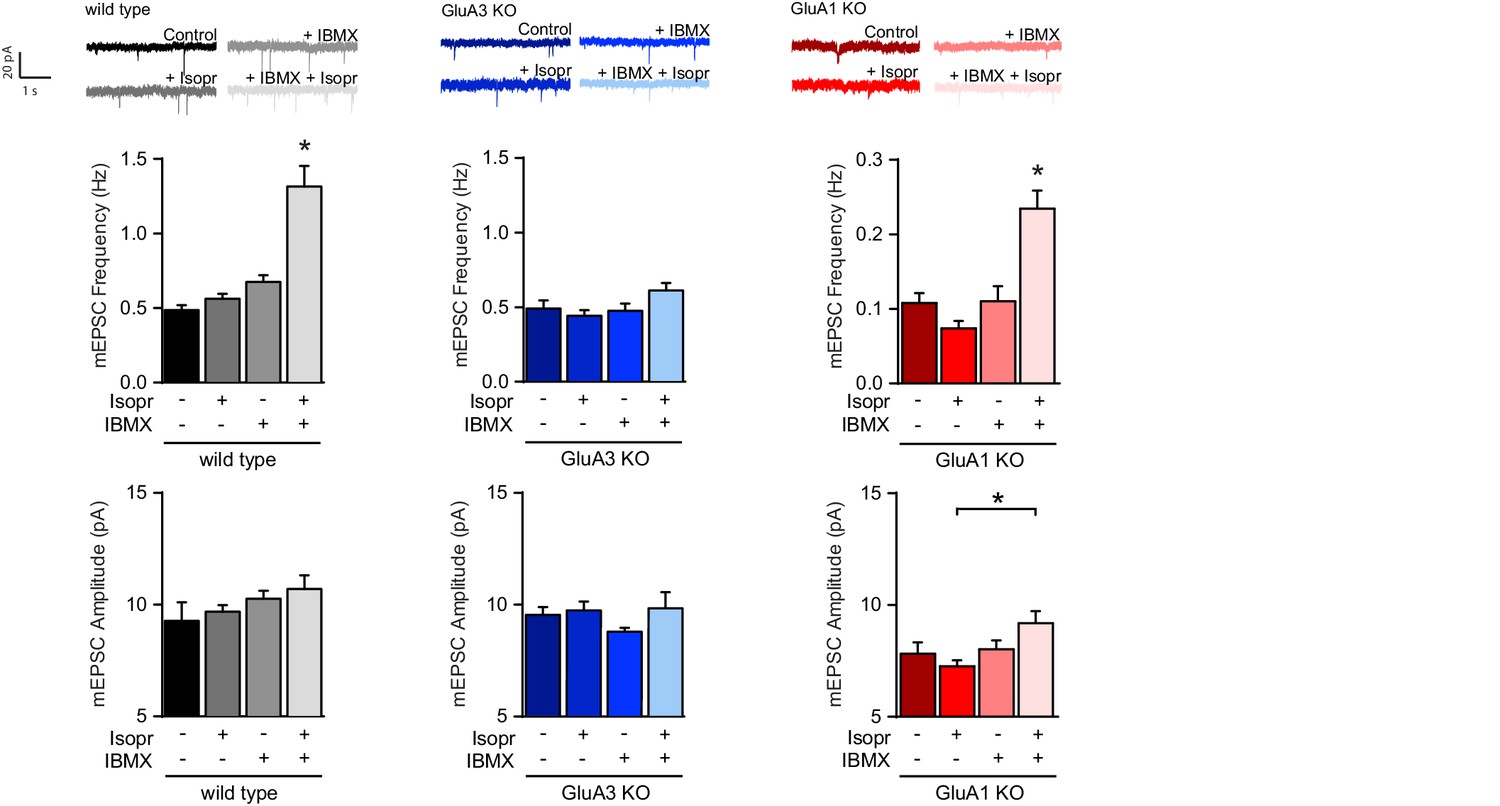
β–adrenergic activation induces GluA2/3–plasticity.
Brain slices were acutely isolated from mature WT and littermate GluA3-KO mice, or GluA1-KO mice. Example traces, average mEPSC frequencies and amplitudes from CA1 neurons incubated with no drugs, b-AR agonist isoproterenol, PDE blocker IBMX, or isoproterenol plus IBMX (WT: ctrl n=13, Iso n=11, IBMX n=7, Iso + IBMX n=9; GluA3-KO: ctrl n=15, Iso n=7, IBMX n=7, Iso+IBMX n=4; GluA1-KO: ctrl n=5, Iso n=4, IBMX n=8, Iso+IBMX n=6). Isoproterenol in presence of IBMX increases mEPSC frequency in WT (ANOVA, ctrl vs Isopr: p=0.8; IBMX vs Isopr/IBMX: p<0.0001), and GluA1-KO (ANOVA, ctrl vs Isopr: p=0.4; IBMX vs Isopr/IBMX: p=0.001), but not in GluA3-KO (ANOVA, ctrl vs Isopr: p=0.9; IBMX vs Isopr/IBMX: p=0.5). Isoproterenol/IBMX did not affect average mEPSC amplitude in WT (ANOVA, p=0.4), in GluA3-KO (ANOVA, p=0.4), or in GluA1-KO neurons (ANOVA, Isopr vs isopr/IBMX p=0.045). Error bars indicate SEM, * indicates p<0.05.
Figure 8
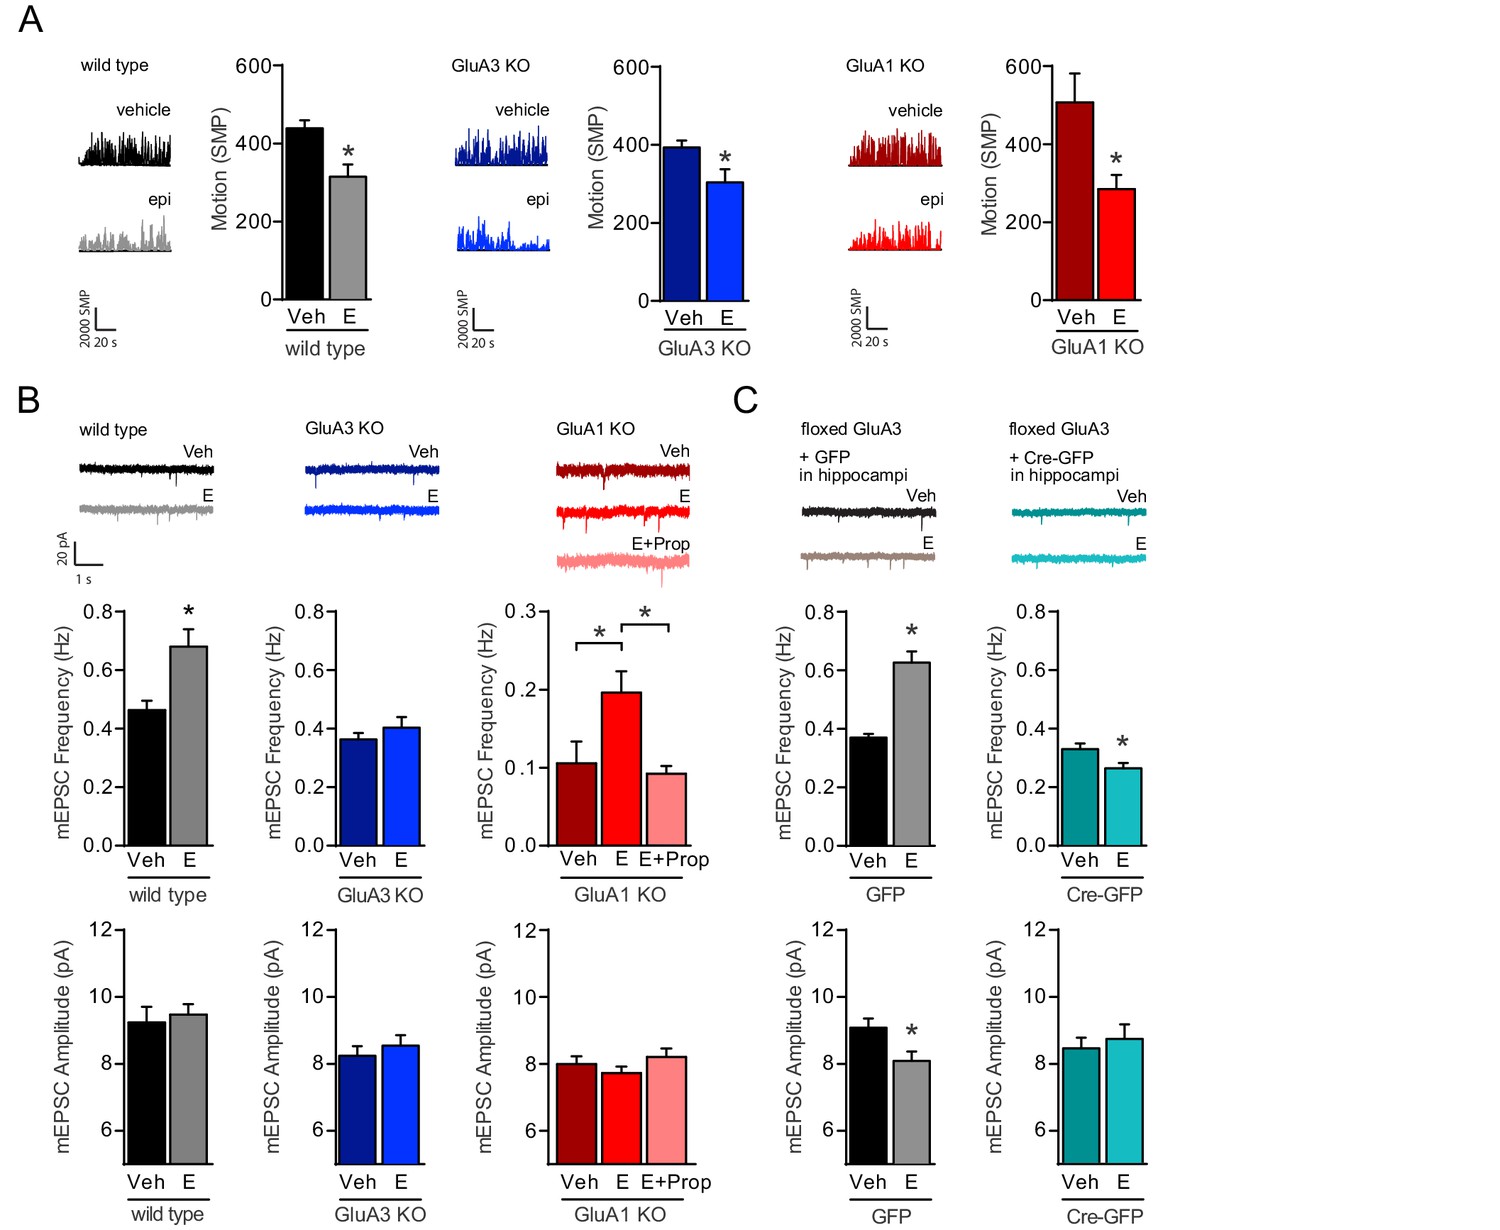
NE release triggers the activation of GluA2/3-plasticity.
(A) Example traces and average motion as a change in significant motion pixels (SMPs) (Kopec et al., 2007) of WT injected with saline (n=15) or E (n=15), GluA3-KO injected with saline (n=17) or E (n=16), and GluA1-KO injected with saline (n=10) or E (n=11). Epinephrine (E) injection decreases the motion of mice (t-test, WT: p=0.003; GluA3-KO: p=0.02; GluA1-KO: p=0.01). (B) Example traces, mEPSC frequencies and mEPSC amplitudes of CA1 hippocampal neurons from WT mice injected with saline (n=13) or E (n=15) (t-test, Freq: p=0.0003; Ampl: p=0.6); GluA3-KO mice injected with saline (n=16) or E (n=13) (t-test, Freq: p=0.4; Ampl: p=0.5); or GluA1-KO mice injected with saline (n=12), E (n=20) or propranolol 20 min prior to E (n=16) (Freq: ANOVA, veh vs E: p=0.008; E vs E + Prop: p=0.04; veh vs E + Prop: p>0.9) (Ampl: ANOVA, p=0.2). (C) AAV virus expressing GFP or GFP-Cre were stereotactically targeted at the CA1 of flGluA3 mice. Example traces, mEPSC frequencies and mEPSC amplitudes recorded from GFP-positive CA1 neurons after injection with epinephrine (GFP: n=11; GFP-Cre: n=9) or saline (GFP: n=11; GFP-Cre: n=11). In GFP-infected neurons E-injection caused an increased mEPSC frequency (t-test, p<0.0001) and decreased amplitude (t-test, p=0.02). In GFP-Cre infected neurons E-injection caused a decrease in mEPSC frequency (t-test, p=0.02) and no change in amplitude (t-test, p=0.6). Error bars indicate SEM, * indicates p<0.05.
Author response image 1

mEPSC frequency and amplitude of GluA3-deficient neurons, infected with GFP-GluA3 (blue) or GFP-GluA2Q (yellow) in the absence (even) or presence (blocked bar) of forskolin.
Author response image 2
Incubation of wild-type CA1 neurons with isoproterenol and IBMX increased the mEPSC frequency, but not amplitude.
Additional files
-
Source data 1
File containing datapoints of all figures.
- https://doi.org/10.7554/eLife.25462.021
Download links
A two-part list of links to download the article, or parts of the article, in various formats.
Downloads (link to download the article as PDF)
Open citations (links to open the citations from this article in various online reference manager services)
Cite this article (links to download the citations from this article in formats compatible with various reference manager tools)
Synaptic plasticity through activation of GluA3-containing AMPA-receptors
eLife 6:e25462.
https://doi.org/10.7554/eLife.25462


