A lectin receptor kinase as a potential sensor for extracellular nicotinamide adenine dinucleotide in Arabidopsis thaliana
- University of Florida, United States
- GlaxoSmithKline, United States
Figures
Figure 1
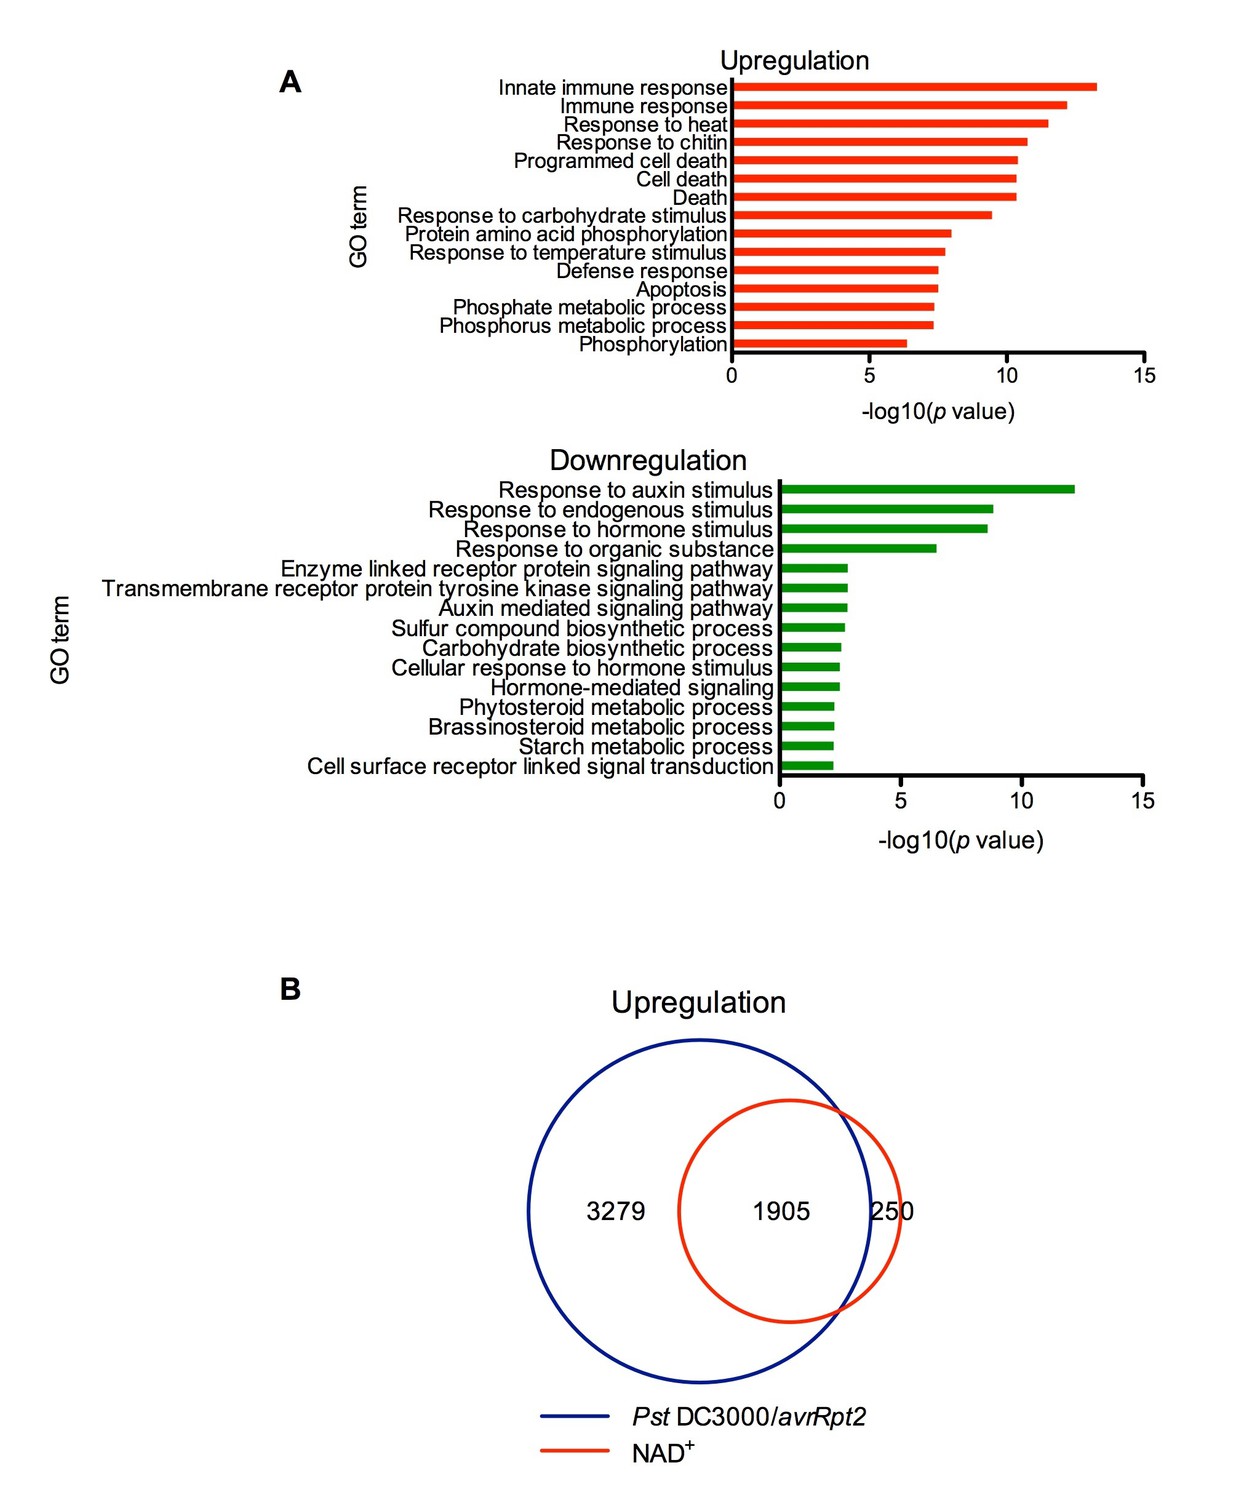
Exogenous NAD+-induced transcriptome changes.
(A) Gene Ontology (GO) term enrichment test of the genes that were upregulated and downregulated by NAD+ treatment at 4 hr showed that genes involved in plant defense such as innate immune response, immune response, and response to chitin were significantly enriched in the upregulated genes, whereas those associated with responses to hormone stimuli, such as auxin stimulus, were overrepresented in the downregulated genes. (B) Overlap between the genes that were upregulated by NAD+ treatment at 4 hr and that by Pst DC3000/avrRpt2 at least at one time point of 4, 8, and 12 hr post-inoculation (Wang et al., 2013).
Figure 2 with 2 supplements
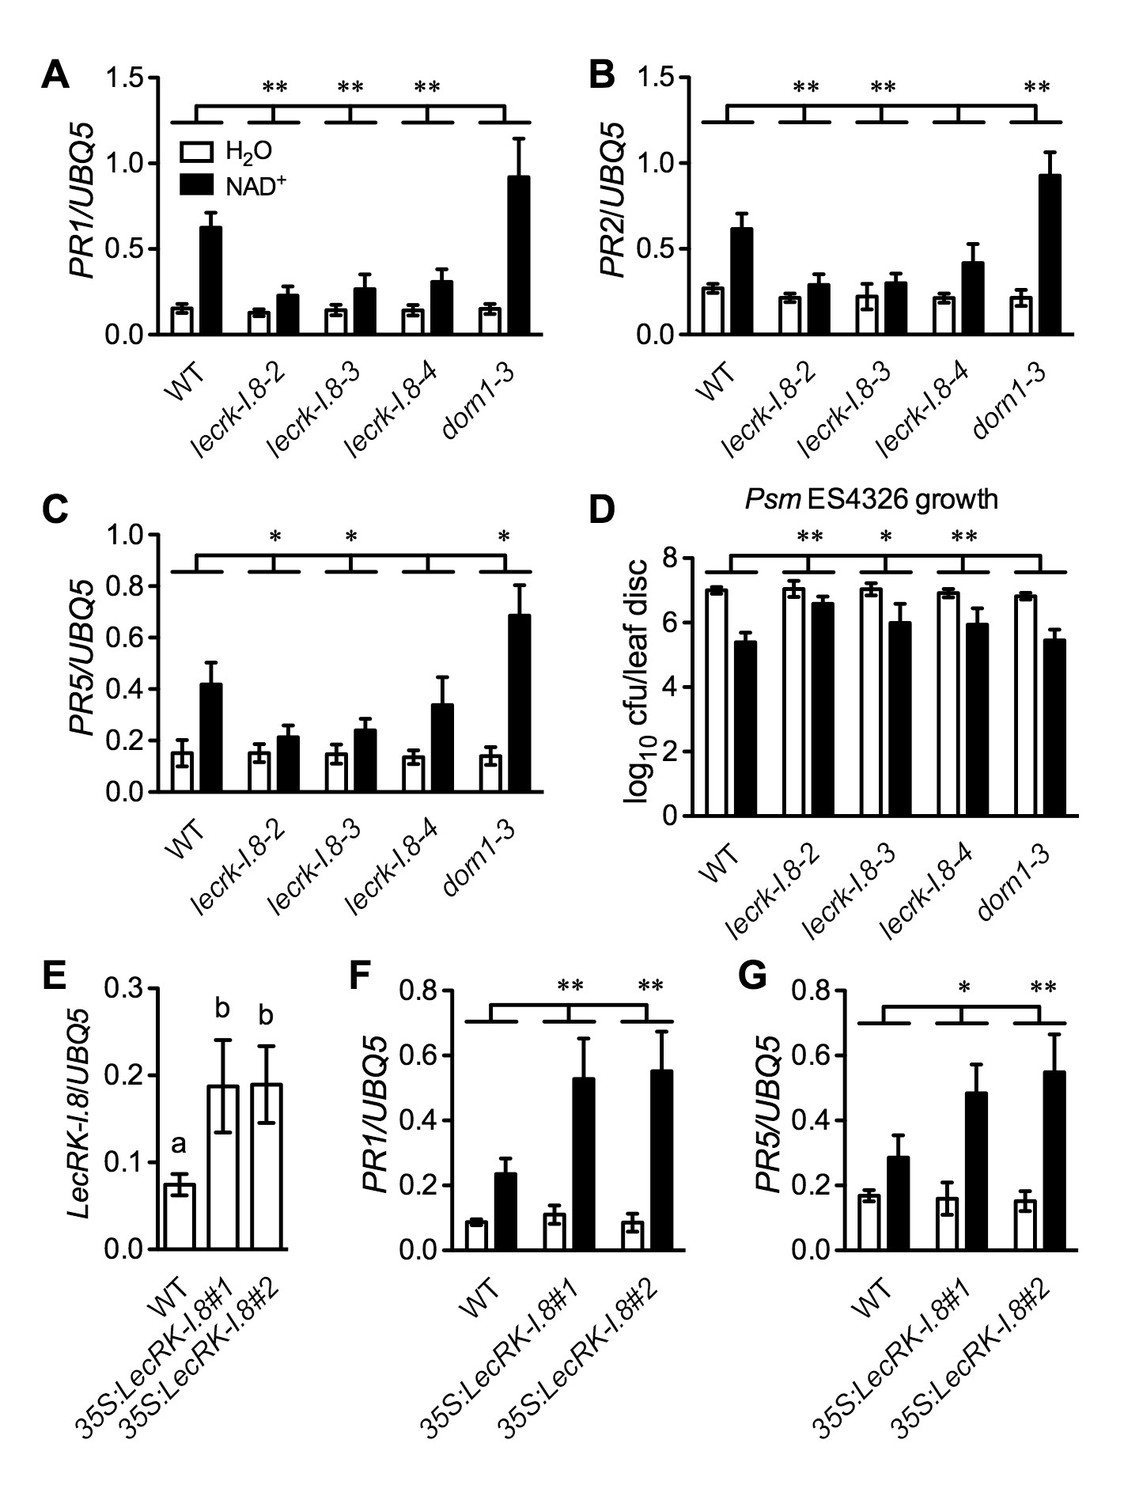
LecRK-I.8 functions in extracellular NAD+-triggered defense signaling pathway.
(A) to (C) NAD+-induced expression of PR1 (A), PR2 (B), and PR5 (C) was reduced in the lecrk-I.8 mutants. Plants were treated with 0.2 mM NAD+ solution or water. Leaf tissues were collected 20 hr later for qPCR analysis. Expression levels were normalized against UBQ5. Data represent the mean of three independent samples with standard deviation (SD). Asterisks indicate significant differences between the wild type (WT) and the mutants (*p<0.05, **p<0.01, two-way ANOVA). (D) NAD+-induced resistance to the bacterial pathogen Psm ES4326 was decreased in the lecrk-I.8 mutants. Plants were treated as in (A). Five h later, the plants were inoculated with a Psm ES4326 suspension (OD600 = 0.001). The bacterial titers were determined 3 d post-inoculation. Data represent the mean of eight independent samples with SD. Asterisks indicate significant differences between the wild type and the mutants (*p<0.05, **p<0.01, two-way ANOVA). Cfu: colony-forming units. (E) Expression levels of LecRK-I.8 were elevated in two 35S:LecRK-I.8 transgenic lines. Data represent the mean of three independent samples with SD. Different letters above the bars indicate significant differences (p<0.05, one-way ANOVA). (F) and (G) Induction of PR1 (F) and PR5 (G) by NAD+ was enhanced in the 35S:LecRK-I.8 lines. The experiments were performed as in (A) except that the plants were treated with 0.1 mM NAD+. All experiments were repeated three times with similar trends.
-
Figure 2—source data 1
LecRK-I.8 functions in extracellular NAD+-triggered defense signaling pathway.
- https://doi.org/10.7554/eLife.25474.005
Figure 2—figure supplement 1
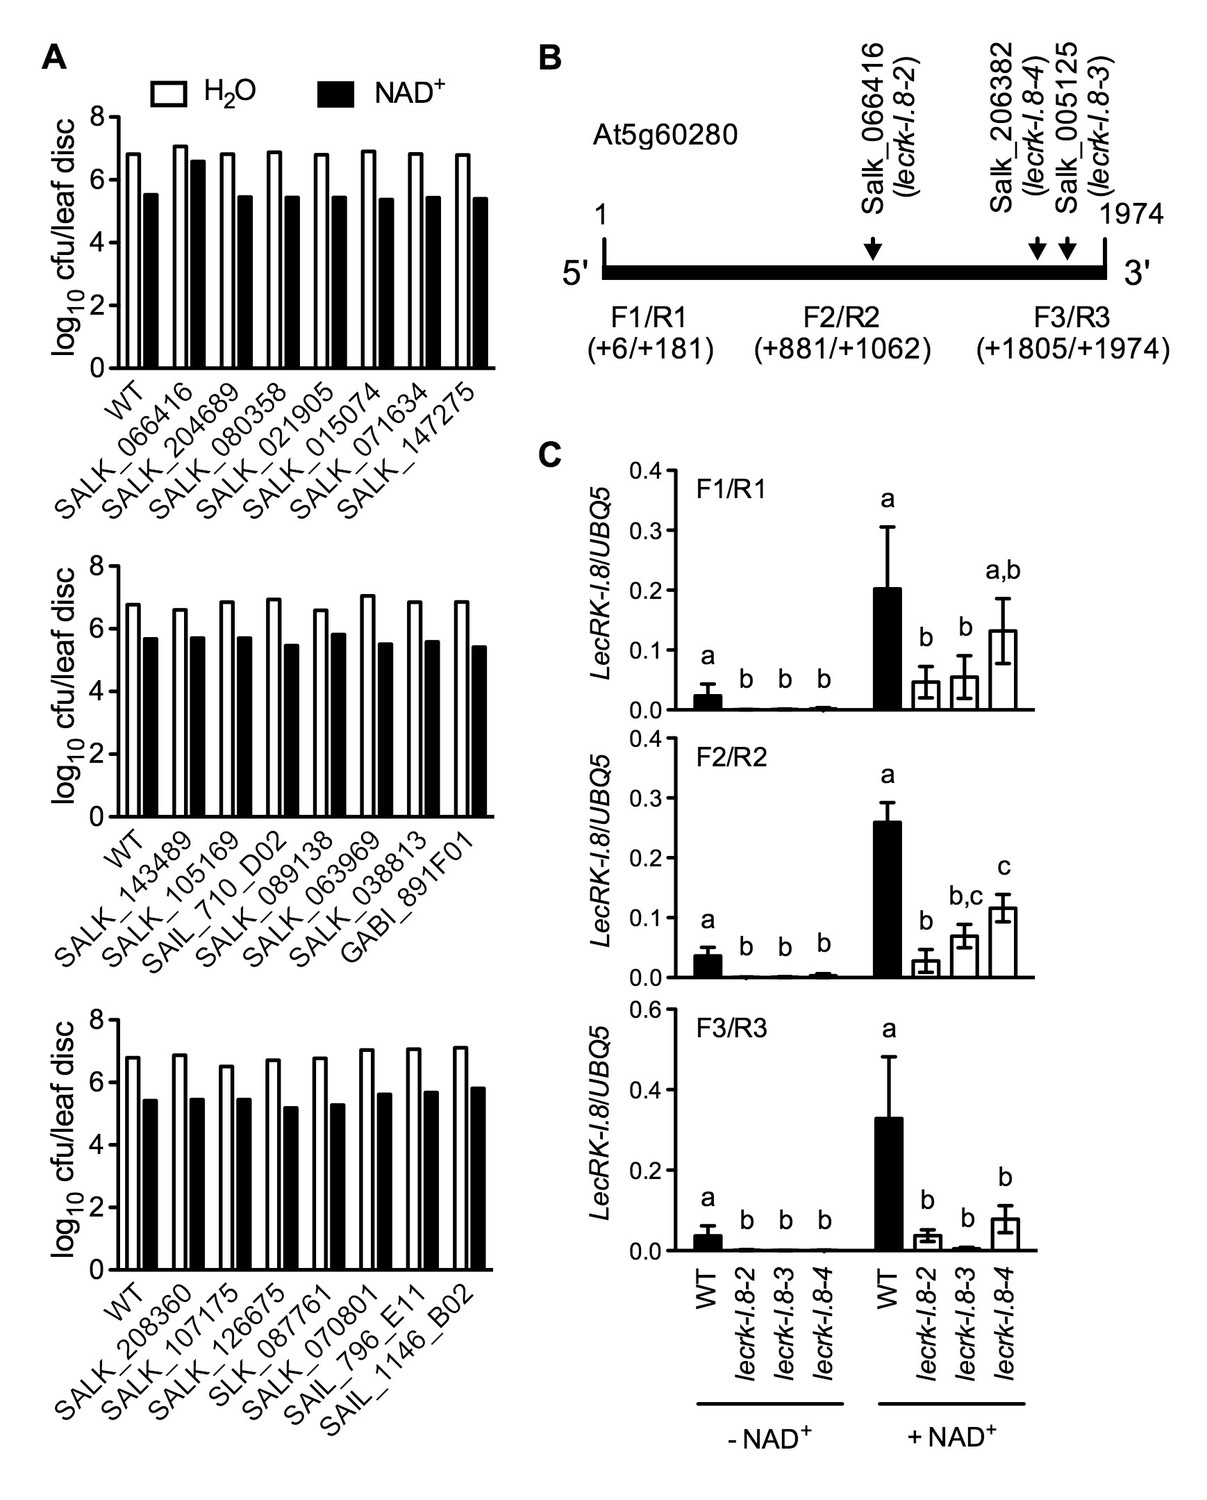
Exogenous NAD+-induced Psm ES4326 resistance in T-DNA insertion lines of 14 candidate genes and transcript levels of LecRK-I.8 in three T-DNA insertion lines.
(A) Leaves of 4-week-old soil-grown plants were infiltrated with 0.2 mM NAD+ or water. Five h later, the infiltrated leaves were inoculated with a Psm ES4326 suspension (OD600 = 0.001). Eight leaves per genotype per treatment were collected 3 d post-inoculation and pooled to examine the growth of the pathogen. WT: wild type. Cfu: colony-forming units. (B) The T-DNA insertion sites in Salk_066416 (lecrk-I.8–2), Salk_206382 (lecrk-I.8–3), and Salk_005125 (lecrk-I.8–4) and the positions of the three pairs of primers used for real-time qPCR analysis of LecRK-I.8 transcript levels. (C) Transcript levels of LecRK-I.8 in lecrk-I.8–2, lecrk-I.8–3, and lecrk-I.8–4 were significantly lower than those in the wild type (WT). Leaves of 4-week-old soil-grown plants were infiltrated with (+) or without (-) 0.2 mM NAD+ solution. Total RNA was extracted 4 hr later and subjected to real-time qPCR analysis. Expression levels were normalized against UBQ5. Data represent the mean of three independent samples with SD. Different letters above the bars indicate significant differences (p<0.05, one-way ANOVA of square-root transformed data). The comparison was made separately for each treatment. The experiment was repeated with similar trends.
Figure 2—figure supplement 2
Characterization of 35S:LecRK-I.8 transgenic lines.
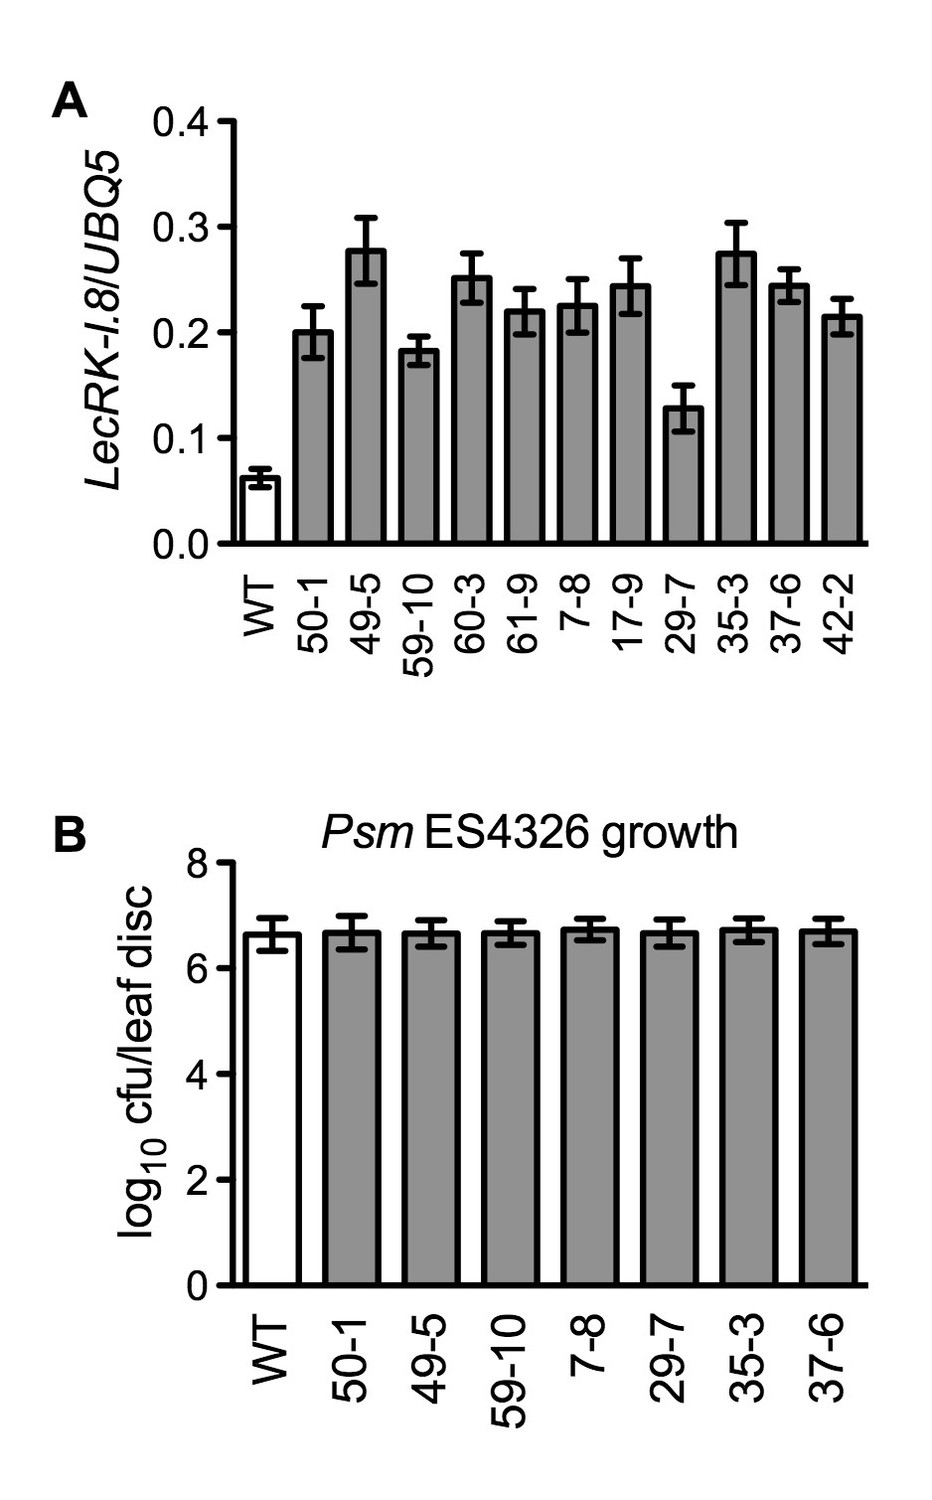
(A) Expression levels of LecRK-I.8 in 35S:LecRK-I.8-GFP transgenic lines. Total RNA was extracted from the wild type (WT) and 11 single T-DNA insertion homozygous 35S:LecRK-I.8 transgenic lines and subjected to qPCR analysis. Expression levels were normalized against UBQ5. Data represent the mean of three independent samples with SD. (B) Basal resistance of seven 35S:LecRK-I.8 transgenic lines expressing different levels of LecRK-I.8. Plants were inoculated with a Psm ES4326 suspension (OD600 = 0.001). The bacterial titers were determined 3 d post-inoculation. Data represent the mean of eight independent samples with SD. The experiments were repeated with similar trends.
Figure 3 with 2 supplements
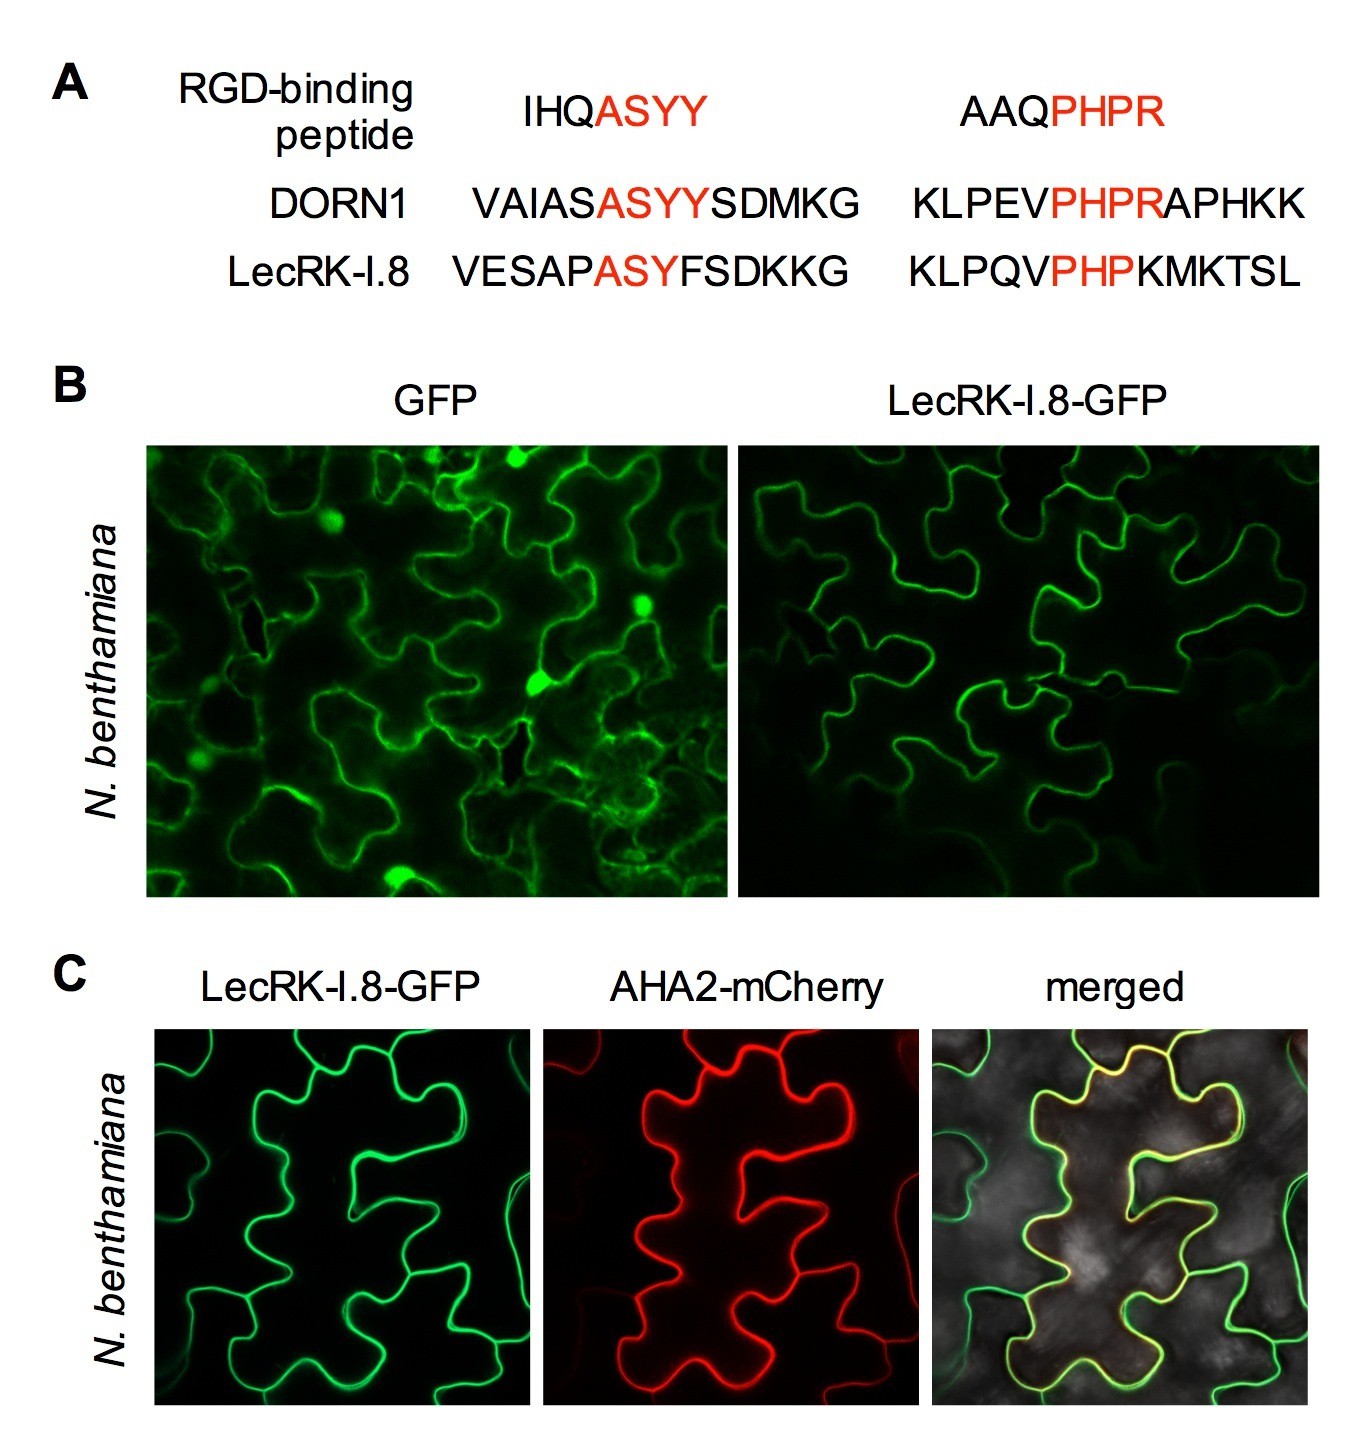
Subcellular localization of the LecRK-I.8-GFP fusion protein.
(A) Putative RGD-binding motifs in DORN1 and LecRK-I.8. (B) Confocal images of N. benthamiana epidermal cells transiently expressing GFP (Left) and LecRK-I.8-GFP (right). (C) Confocal images of N. benthamiana epidermal cells transiently co-expressing LecRK-I.8-GFP and AHA2-mCherry. Left: LecRK-I.8-GFP, middle: AHA2-mCherry, and right: merged image.
Figure 3—figure supplement 1
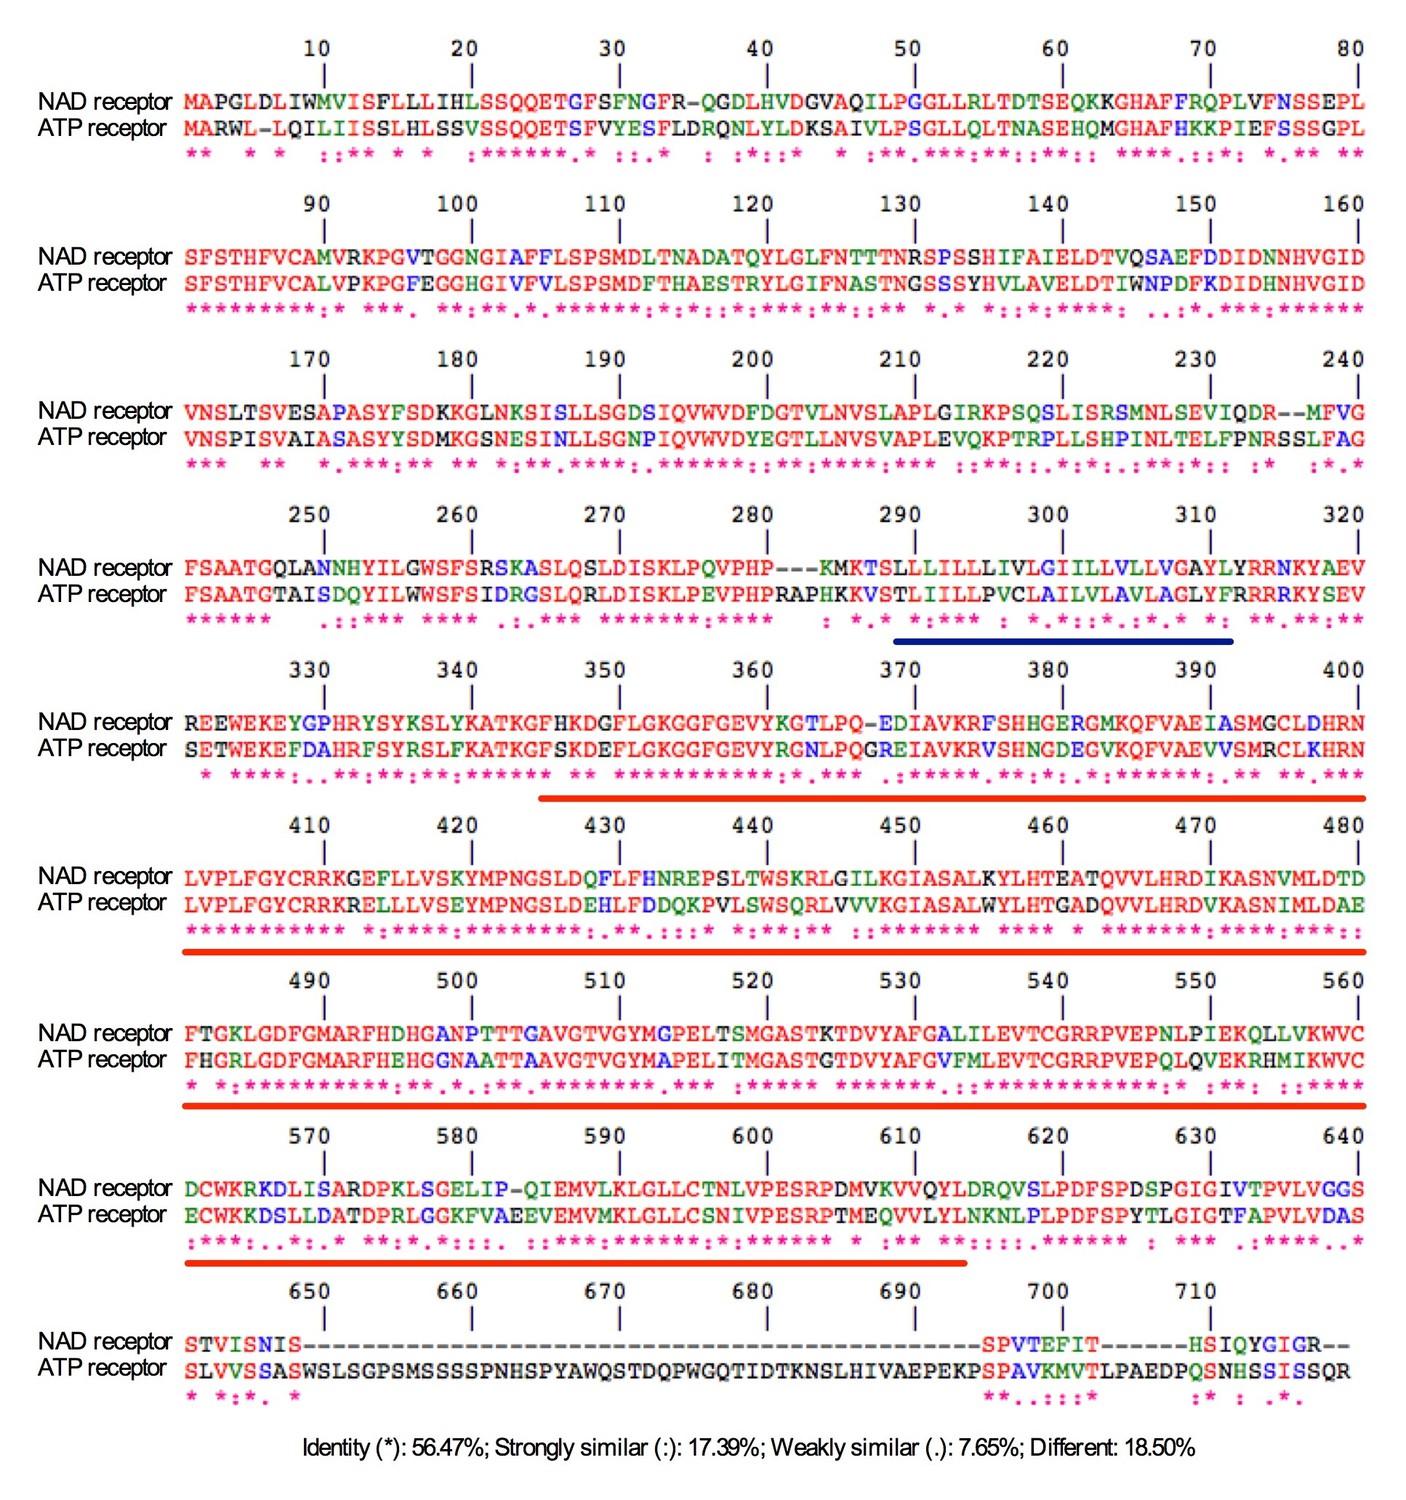
Alignment between the NAD receptor LecRK-I.8 and the ATP receptor DORN1.
The amino acid sequences of LecRK-I.8 and DORN1 were aligned using the CLUSTALW tool at the PBIL (Pôle Bioinformatique Lyonnais). LecRK-I.8 and DORN1 (LecRK-I.9) have approximately 81.5% amino acid sequence similarity. The transmembrane domain and the kinase domain (KD) were underlined in blue and red, respectively.
Figure 3—figure supplement 2
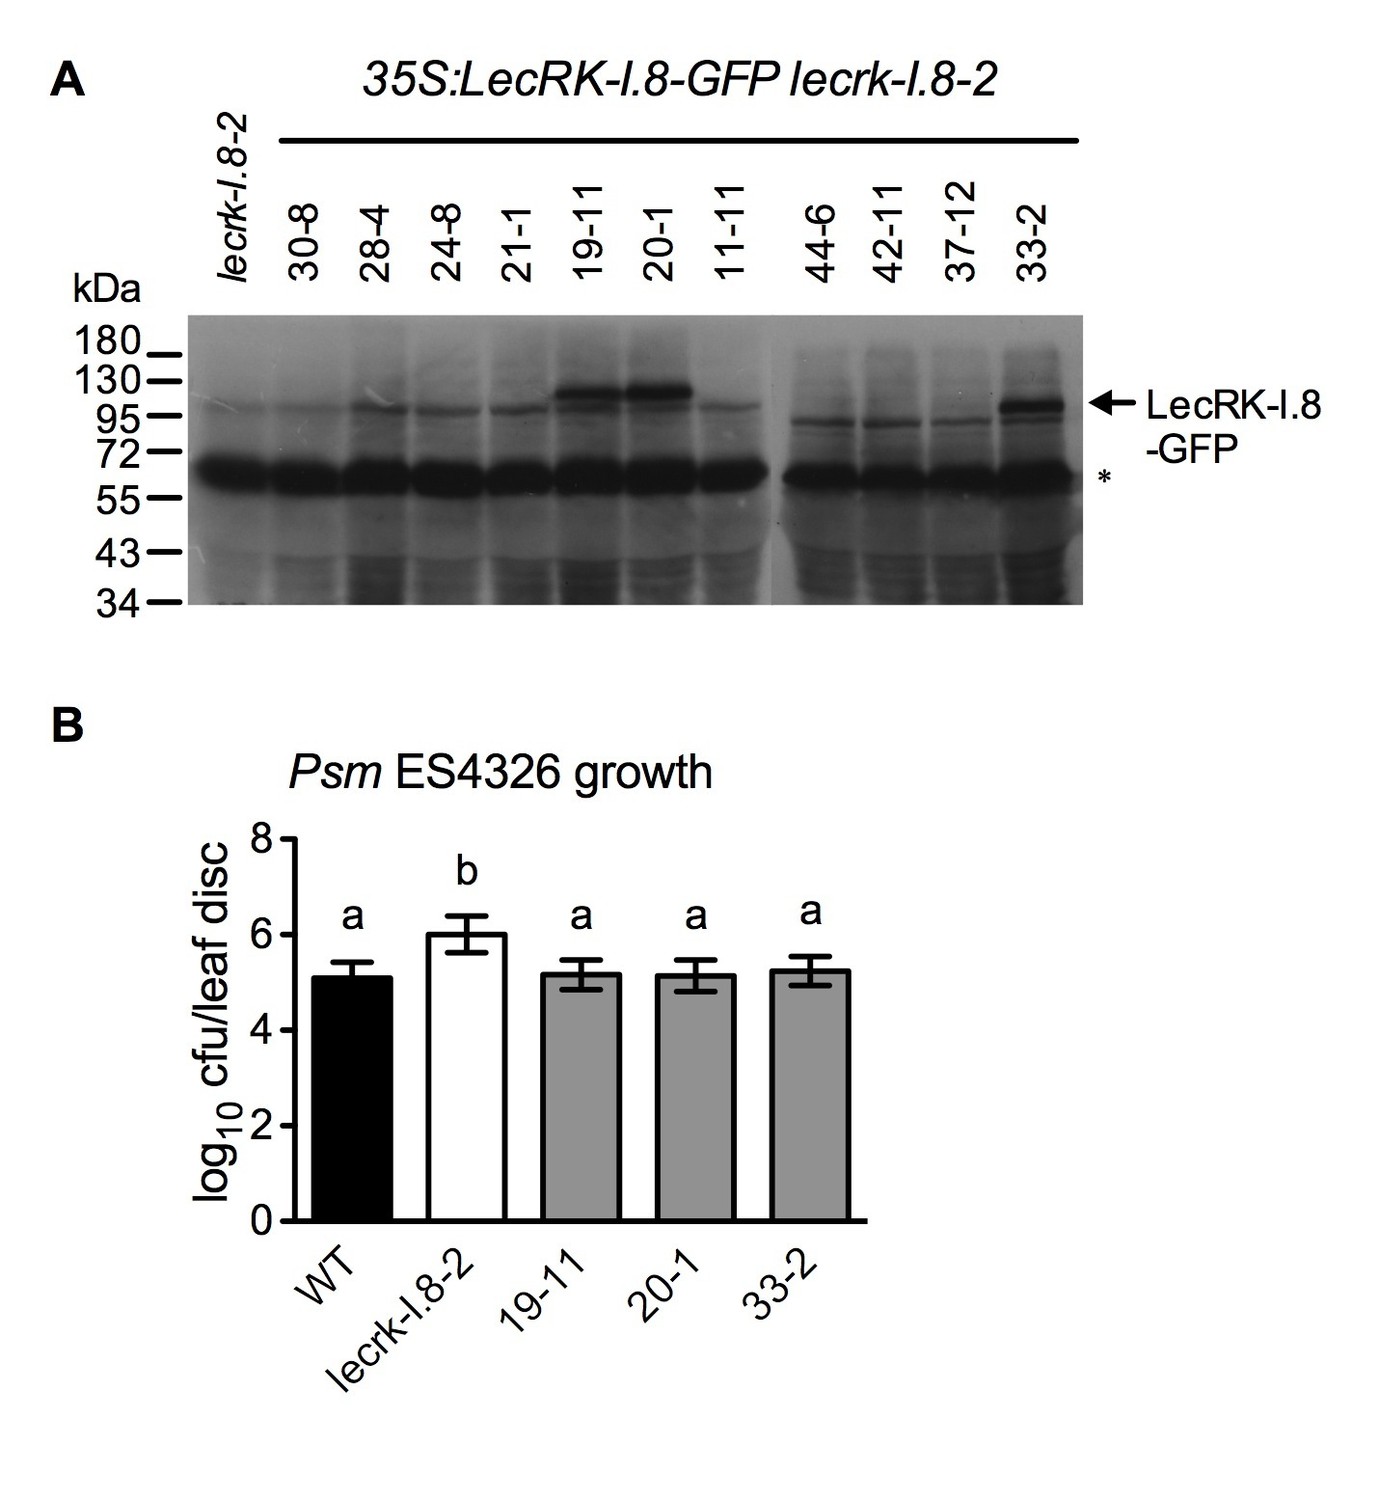
Characterization of 35S:LecRK-I.8-GFP lecrk-I.8–2 transgenic lines.
(A) LecRK-I.8-GFP protein levels in 35S:LecRK-I.8-GFP lecrk-I.8–2 transgenic lines. Total protein was extracted from the wild type (WT) and 11 single T-DNA insertion homozygous 35S:LecRK-I.8-GFP lecrkI.8–2 transgenic lines and subjected to SDS-PAGE and analyzed by immunoblot analysis using a monoclonal anti-GFP antibody. The Thermo Scientific SuperSignal West Femto Maximum Sensitivity Substrate and prolonged exposure (1 hr) of the x-ray film were employed to detect the LecRK-I.8-GFP band. The asterisk indicates an unspecific band, indicating equal loading.. (B) Basal resistance of the three 35S:LecRK-I.8-GFP lecrk-I.8–2 transgenic lines showing LecRK-I.8-GFP protein. Plants were inoculated with a Psm ES4326 suspension (OD600 = 0.0001). The bacterial titers were determined 3 d post-inoculation. Data represent the mean of eight independent samples with SD. Different letters above the bars indicate significant differences (p<0.05, one-way ANOVA). The experiment was repeated with similar trends.
Figure 4
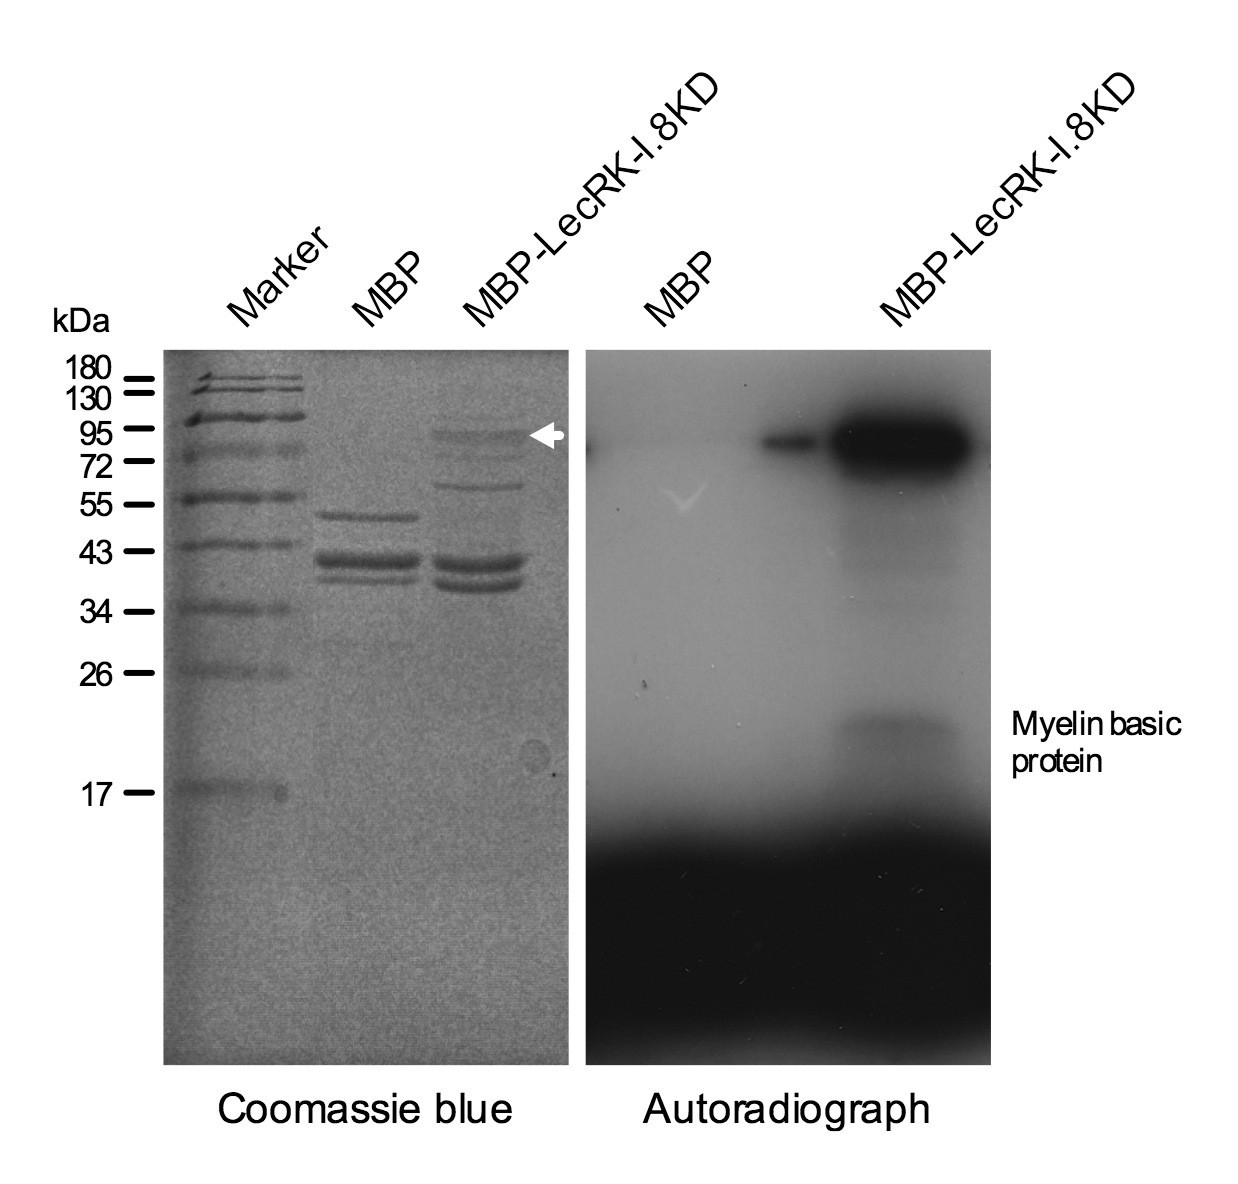
Kinase activity of the LecRK-I.8 kinase domain.
An autoradiograph (right panel) showing that the kinase domain (KD) of LecRK-I.8 is active based on autophosphorylation and phosphorylation of the myelin basic protein. The purified MBP and MBP-LecRK-I.8KD proteins used for kinase activity assays were separated in a different SDS-PAGE gel (left panel), and the white arrow in the left panel indicates the expected size of the MBP-LecRK-I.8KD protein band. The experiment was repeated with similar results.
Figure 5 with 3 supplements
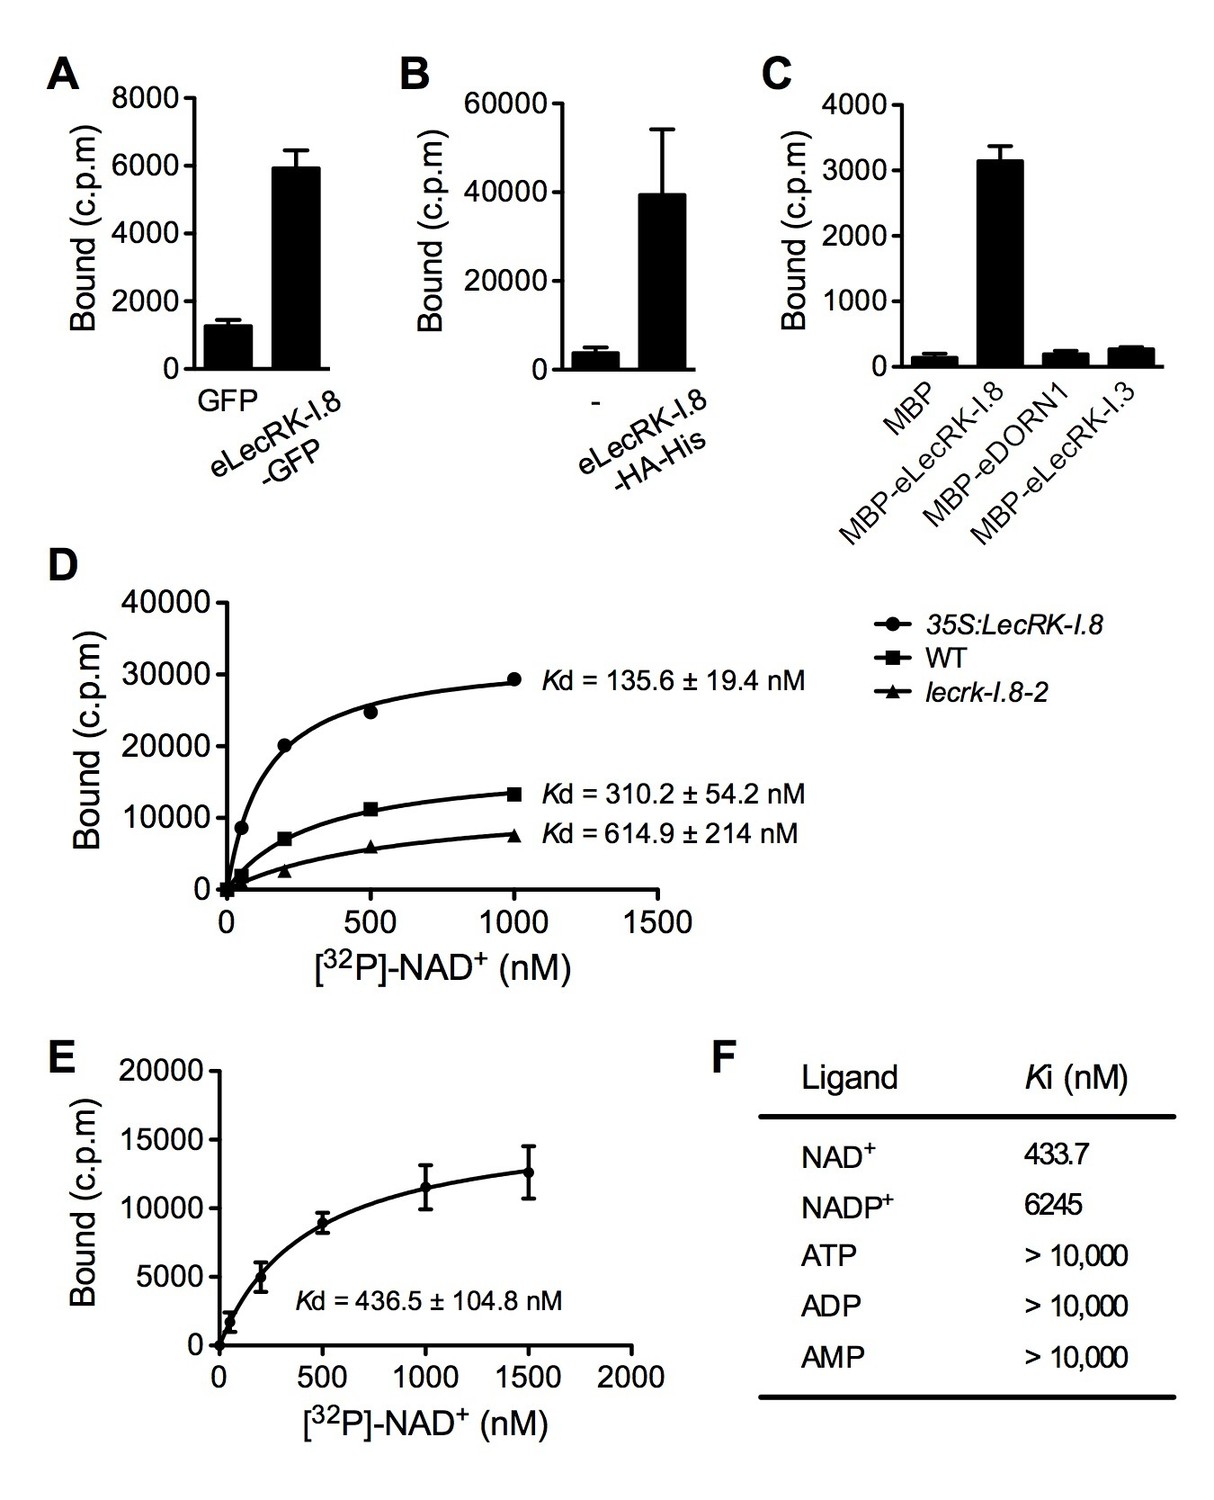
LecRK-I.8 binds NAD+.
(A) to (C), Binding of 32P-labeled NAD+ to immunoprecipitated GFP and eLecRK-I.8-GFP proteins (A), purified eLecRK-I.8-HA-His protein (B), and recombinant MBP, MBP-eLecRK-I.8, MBP-eDORN1, and MBP-eLecRK-I.3 proteins (C). (-) in (B) is an empty vector control. Approximately 0.5 g Arabidopsis leaf tissues, 1 g N. benthamiana leaf tissues, and ~5 μg recombinant proteins were used for each binding assay in (A), (B), and (C), respectively. (D) Binding of 32P-labeled NAD+ to the microsomal fractions of 35S:LecRK-I.8, wild-type (WT), and lecrk-I.8–2 plants. Specific binding was determined by subtracting the binding in the presence of 1000-fold unlabeled NAD+ from the total binding in the absence of cold competitor. (E) Saturation binding assay for LecRK-I.8. Immunoprecipitated eLecRK-I.8-GFP proteins were incubated with the indicated concentrations of 32P-labeled NAD+ for 30 min. Free NAD+ was removed by washing. Data were plotted as a specific binding with SD of three experiments. The dissociation constant (Kd) was calculated by one site specific binding saturation model using GraphPad Prism 5 (www.graphpad.com). (F) Competitive binding assay for LecRK-I.8. Samples containing 250 nM of 32P-labeled NAD+ in the presence of 100 nM to 1 mM of unlabeled nucleotides were assayed for specific binding of 32P-labeled NAD+. Inhibition constant (Ki) values were calculated in GraphPad Prism 5 using the one site Fit Ki competition model. In (A), (B), (C), and (E), results from three independent experiments were combined (error bars represent SD).
-
Figure 5—source data 1
LecRK-I.8 binds NAD+.
- https://doi.org/10.7554/eLife.25474.013
Figure 5—figure supplement 1

Purified eLecRK-I.8 proteins.
(A) Proteins immunoprecipitated from the wild-type (WT), 35S:GFP and 35S:eLecRK-I.8-GFP plants using the anti-GFP antibody. (B) Proteins purified from N. benthamiana leaves infiltrated with Agrobacteria carrying the pCAMBIA1300S-eLecRK-I.8-HA-His plasmid or the empty pCAMBIA1300S vector (-) using the HisPur Cobalt resin. The asterisk indicates an unspecific band.. (C) Proteins purified from E. coli cells expressing the recombinant MBP, MBP-eLecRKI.8, MBP-eDORN1, and MBP-eLecRK-I.3 fusion proteins using the amylose resin.
Figure 5—figure supplement 2

NAD+ binding assay of the recombinant MBP-eLecRK-I.6 protein.
(A) Proteins purified from E. coli cells expressing the recombinant MBP, MBP-eLecRKI.8, and MBP-eLecRK-I.6 fusion proteins using the amylose resin. (B) Binding of 32P-labeled NAD+ to recombinant MBP, MBP-eLecRK-I.8, and MBP-eLecRK-I.6 proteins. Approximately 5 μg recombinant proteins were used for the binding assay. Results from three independent experiments were combined (error bars represent SD).
Figure 5—figure supplement 3
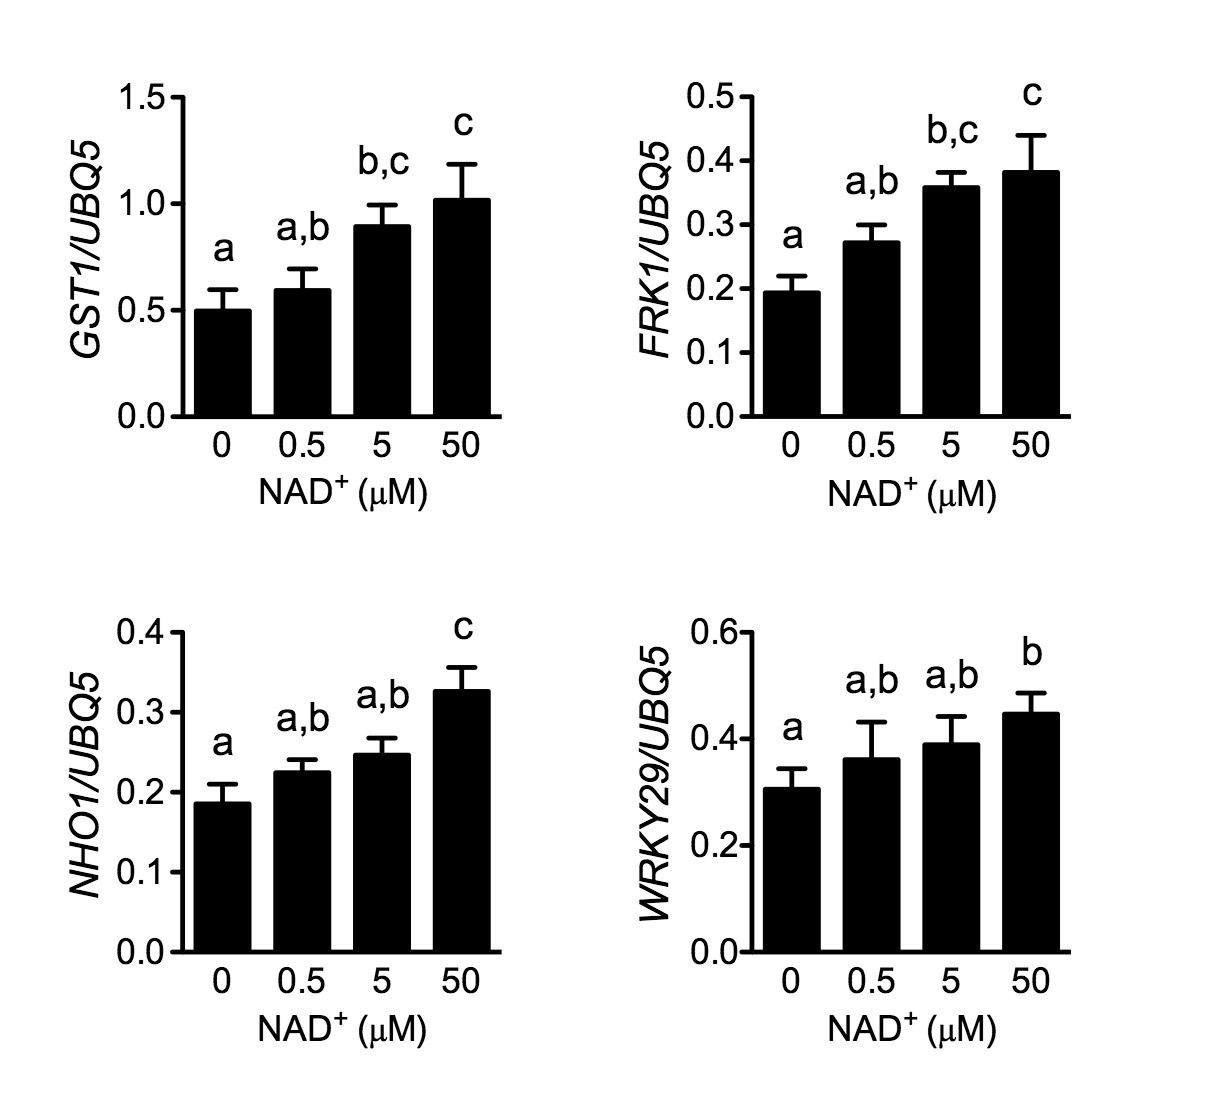
Induction of several early PAMP-responsive genes by low concentrations of NAD+.
Four-week-old soil-grown wild-type Col-0 plants were treated with the indicated concentration of NAD+ solution. Leaf tissues were collected 30 min later for qPCR analysis. Expression levels were normalized against UBQ5. Data represent the mean of three independent samples with SD. The experiment was repeated with similar trends.
Figure 6
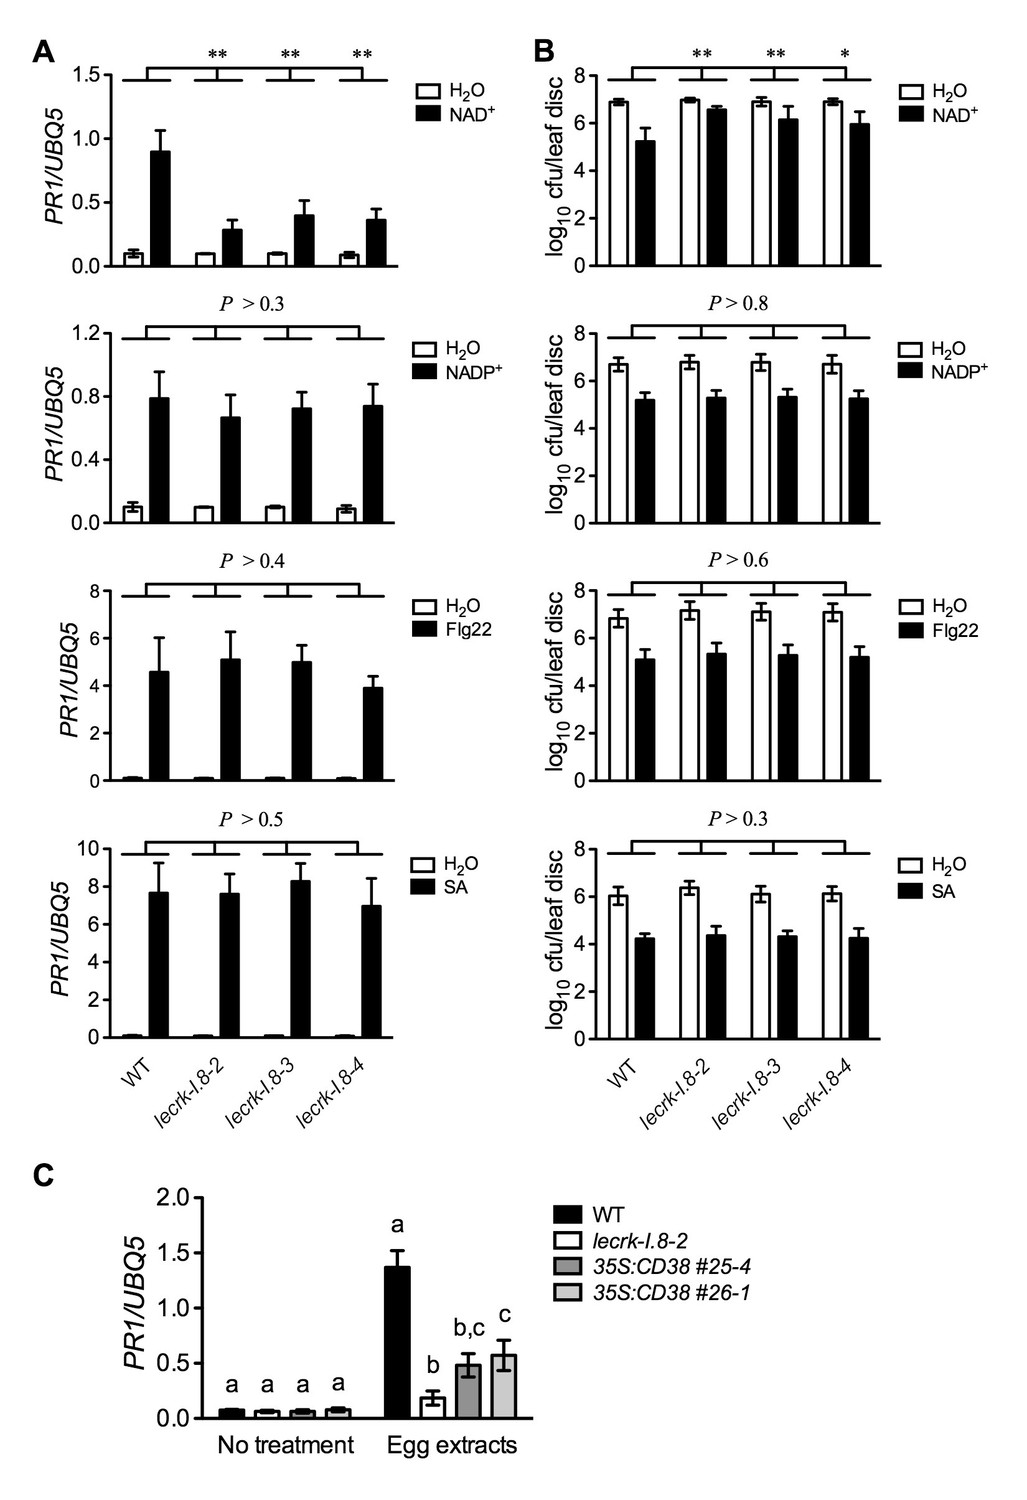
Extracellular NADP+-, flg22-, and SA-induced immune responses are not affected in the lecrk-I.8 mutants.
(A) NAD+-, NADP+-, flg22-, and SA-induced PR1 expression in the wild type (WT) and the lecrk-I.8 mutants. Plants were infiltrated with 0.2 mM NAD+, 0.2 mM NADP+, 1 μM flg22, or water. For SA treatment, plants were treated with soil drenches plus foliar sprays of 0.5 mM SA solution or water. Leaf tissues were collected 20 hr later for qPCR analysis. Expression levels were normalized against UBQ5. Data represent the mean of three independent samples with SD. Asterisks indicate significant differences between the wild type (WT) and the mutants (**p<0.01, two-way ANOVA). (B) NAD+-, NADP+-, flg22-, and SA-induced Psm ES4326 resistance in the wild type and the lecrk-I.8 mutants. Plants were treated as in (A). Five h after NAD+ or NADP+ treatment and 24 hr after flg22 or SA treatment, the plants were inoculated with a Psm ES4326 suspension (OD600 = 0.001). The bacterial titers were determined 3 d post-inoculation. Data represent the mean of eight independent samples with SD. Asterisks indicate significant differences between the wild type and the mutants (*p<0.05, **p<0.01, two-way ANOVA). (C) Insect egg extract-induced PR1 gene expression in 35S:CD38 transgenic plants. Two μL of T. ni egg extracts were dropped onto leaves of the WT, lecrk-I.8–2, and 35S:CD38 transgenic plants. The treated leaves without petiole were collected 3 d later for qPCR analysis. Leaf tissues from untreated plants were used as the control. Data represent the mean of three independent samples with SD. Different letters above the bars indicate significant differences (p<0.05, one-way ANOVA). The comparison was made separately for each treatment. All experiments were repeated three times with similar trends.
-
Figure 6—source data 1
Extracellular NADP+-, flg22-, and SA-induced immune responses are not affected in the lecrk-I.8 mutants.
- https://doi.org/10.7554/eLife.25474.018
Figure 7 with 1 supplement
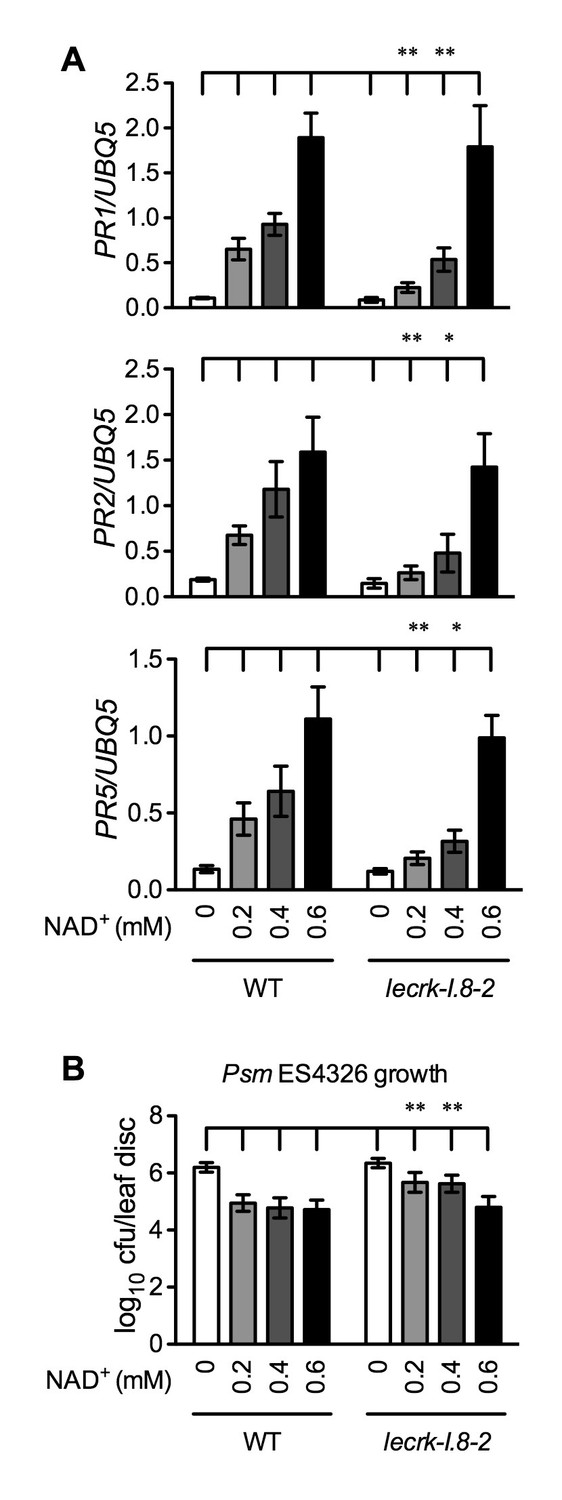
Immune responses induced by different concentrations of NAD+ in lecrk-I.8–2.
(A) Comparison of different concentrations of NAD+-induced expression of PR1, PR2, and PR5 in lecrk-I.8–2 and the wild type (WT). Leaves of 4-week-old soil-grown plants were infiltrated with the indicated concentrations of NAD+. Total RNA was extracted from the infiltrated leaves 20 hr later and subjected to real-time qPCR analysis. Expression was normalized against constitutively expressed UBQ5. Data represent the mean of three independent samples with SD. Asterisks indicate significant differences between lecrk-I.8–2 and the wild type (*p<0.05, **p<0.01, two-way ANOVA). (B) Comparison of different concentrations of NAD+-induced resistance to Psm ES4326 in lecrk-I.8–2 and the wild type. Leaves of 4-week-old soil-grown plants were infiltrated with the indicated concentrations of NAD+. Five h later, the infiltrated leaves were inoculated with a Psm ES4326 suspension (OD600 = 0.001). The in planta bacterial titers were determined 3 d post-inoculation. Data represent the mean of eight independent samples with SD. Asterisks indicate significant differences between lecrk-I.8–2 and the wild type (**p<0.01, two-way ANOVA). Experiments were repeated three times with similar trends.
-
Figure 7—source data 1
Immune responses induced by different concentrations of NAD+ in lecrk-I.8-2.
- https://doi.org/10.7554/eLife.25474.020
Figure 7—figure supplement 1
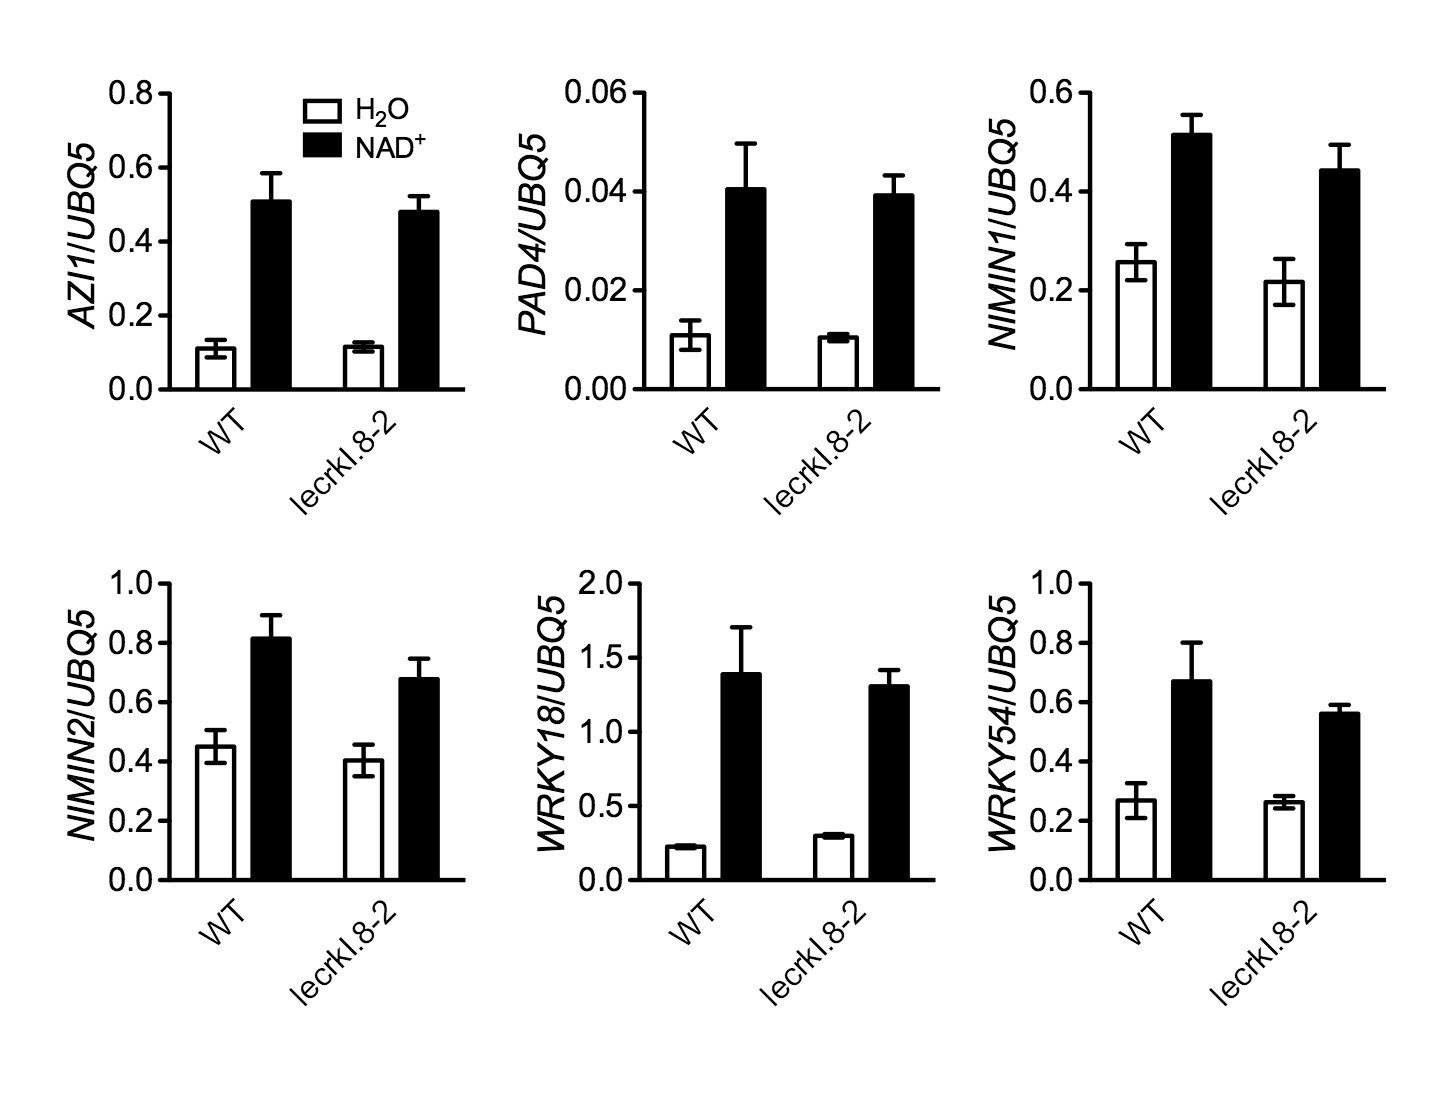
NAD+-induced expression of several early defense-responsive genes in the lecrk-I.8–2 mutant.
Four-week-old soil-grown wild-type (WT) and lecrk-I.8–2 plants were treated with 0.2 mM NAD+ solution or water. Leaf tissues were collected 4 hr later for qPCR analysis. Expression levels were normalized against UBQ5. Data represent the mean of three independent samples with SD. The experiment was repeated with similar trends.
Figure 8 with 1 supplement

Basal immunity is compromised in the lecrk-I.8 mutants.
(A) Psm ES4326-induced PR1 expression was inhibited in the lecrk-I.8 mutants. Plants were inoculated with (+) or without (−) a Psm ES4326 suspension (OD600 = 0.0001). Leaf tissues were collected 24 hr post-inoculation for qPCR analysis. Expression was normalized against constitutively expressed UBQ5. Data represent the mean of three independent samples with SD. Different letters above the bars indicate significant differences (p<0.05, one-way ANOVA). The comparison was made separately for each treatment. WT: wild type. (B) and (C), The lecrk-I.8 mutants were more susceptible to Psm ES4326 than the wild type. Plants were inoculated with a Psm ES4326 suspension (OD600 = 0.0001). The bacterial titers in (B) were determined immediately and 3 d post-inoculation. Data represent the mean of eight independent samples with SD. Different letters above the bars indicate significant differences (p<0.05, one-way ANOVA). The comparison was made separately for each time point. Photos showing the disease symptoms in (C) were taken 3 d post-inoculation. Experiments in (A) and (B) were repeated three times with similar trends.
-
Figure 8—source data 1
Basal immunity is compromised in the lecrk-I.8 mutants.
- https://doi.org/10.7554/eLife.25474.023
Figure 8—figure supplement 1
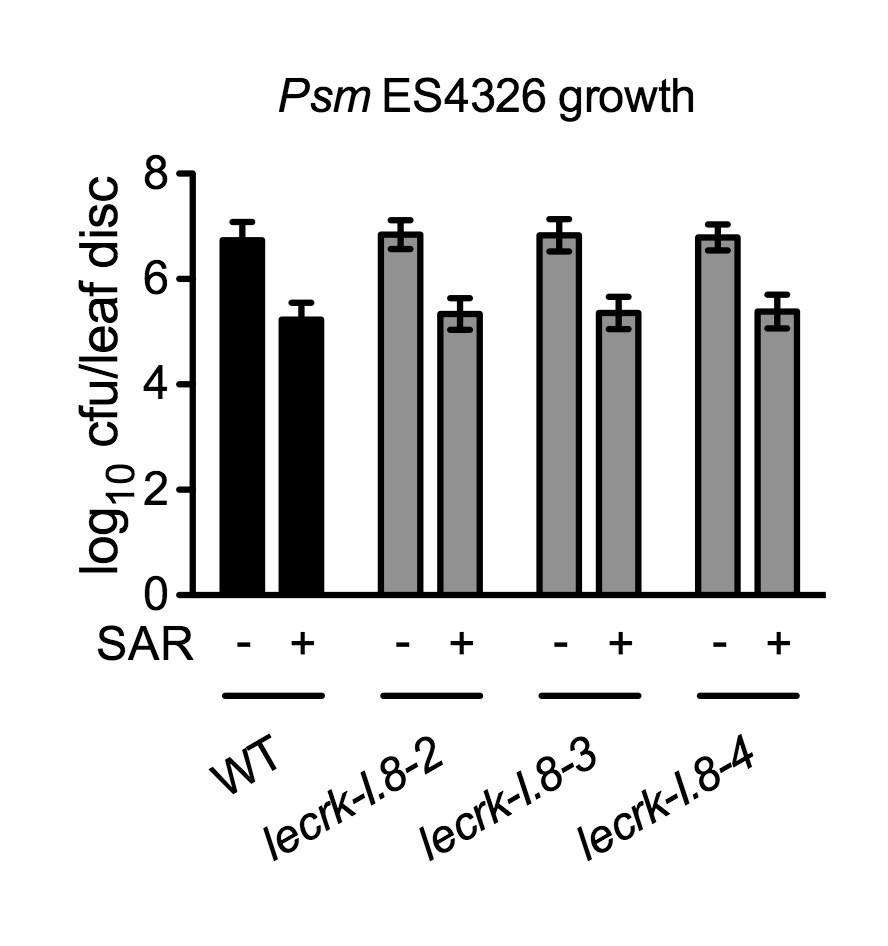
Biological induction of SAR in lecrk-I.8 mutants.
Three lower leaves on each plant were inoculated with Psm ES4326 (OD600 = 0.002) (+SAR) or mock-treated with 10 mM MgCl2 (-SAR). Two days later, two upper uninfected/untreated leaves were challenge-inoculated with Psm ES4326 (OD600 = 0.001). The in plants bacterial titers were determined 3 d after challenge inoculation. Data represent the mean of eight independent samples with SD. The experiment was repeated with similar trends.
Additional files
-
Supplementary file 1
(A) Well-known defense genes affected by NAD+ treatment.
(B) Receptor-like genes induced by NAD+ treatment. (C) Receptor-like kinase genes induced by P. brassicae oviposition and/or NAD+ treatment. (D) Primers used in this study.
- https://doi.org/10.7554/eLife.25474.025
Download links
A two-part list of links to download the article, or parts of the article, in various formats.
Downloads (link to download the article as PDF)
Open citations (links to open the citations from this article in various online reference manager services)
Cite this article (links to download the citations from this article in formats compatible with various reference manager tools)
A lectin receptor kinase as a potential sensor for extracellular nicotinamide adenine dinucleotide in Arabidopsis thaliana
eLife 6:e25474.
https://doi.org/10.7554/eLife.25474


