Epistatic mutations in PUMA BH3 drive an alternate binding mode to potently and selectively inhibit anti-apoptotic Bfl-1
- Massachusetts Institute of Technology, United States
- Dana-Farber Cancer Institute, United States
Figures
Figure 1 with 3 supplements
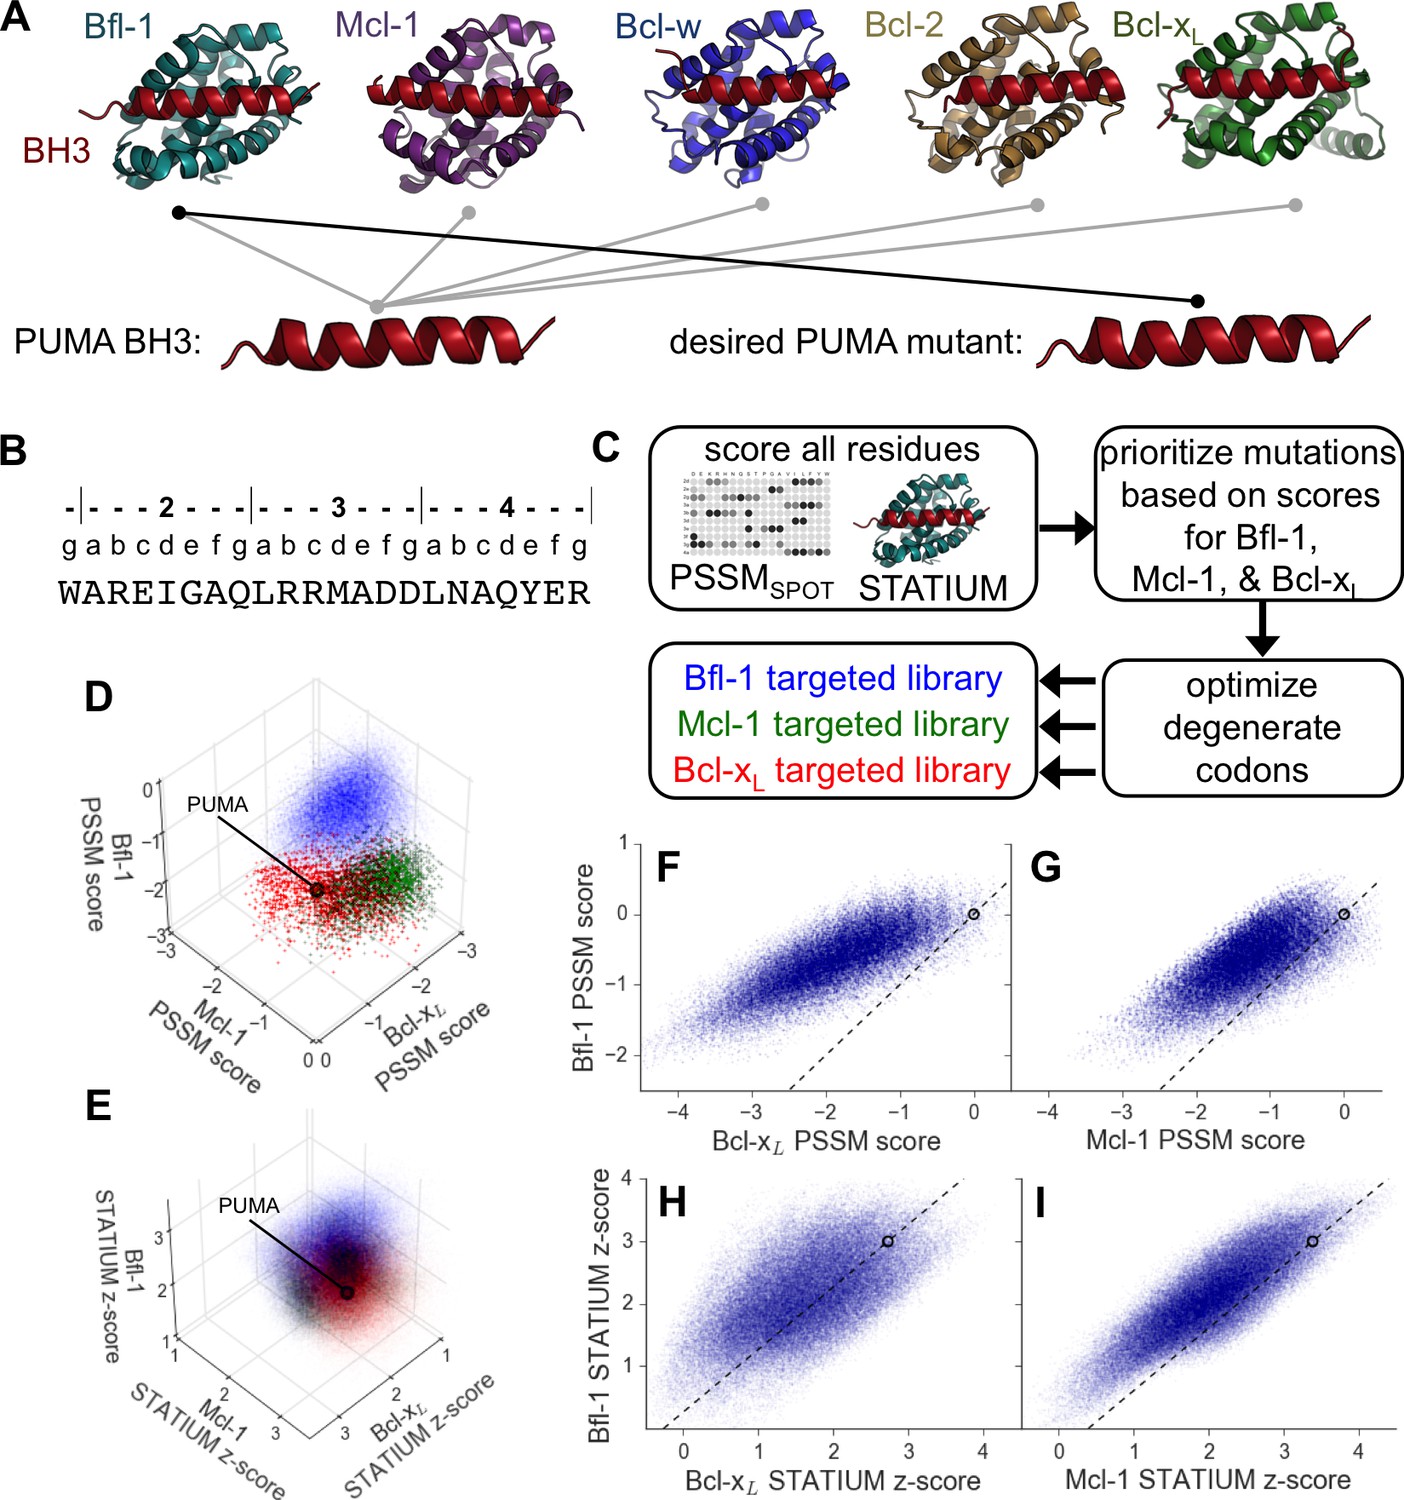
Computational design of a library of PUMA BH3 variants selective for Bfl-1.
(A) PUMA BH3 is pan-selective; the design objective was a peptide that binds tightly only to Bfl-1. (B) Sequence of PUMA BH3 showing the heptad numbering convention used in this paper. (C) Overview of the computational library design procedure. (D–E) Scores for members of three libraries designed to target Bfl-1 (blue), Mcl-1 (green) or Bcl-xL (red): (D) PSSMSPOT scores, (E) STATIUM z-scores. (F–I) The affinities of library peptides for different Bcl-2 proteins were predicted to be strongly correlated. (F) PSSMSPOT scores for binding to Bcl-xL versus Bfl-1, (G) PSSMSPOT scores for binding to Mcl-1 versus Bfl-1, (H) STATIUM z-scores for binding to Bcl-xL versus Bfl-1, (I) STATIUM z-scores for binding to Mcl-1 versus Bfl-1. For (D–I), each point represents one peptide sequence and higher scores correspond to higher predicted affinities for the indicated target. Points on the dashed line have the same low specificity as PUMA BH3 (which is shown with a black open circle).
Figure 1—figure supplement 1
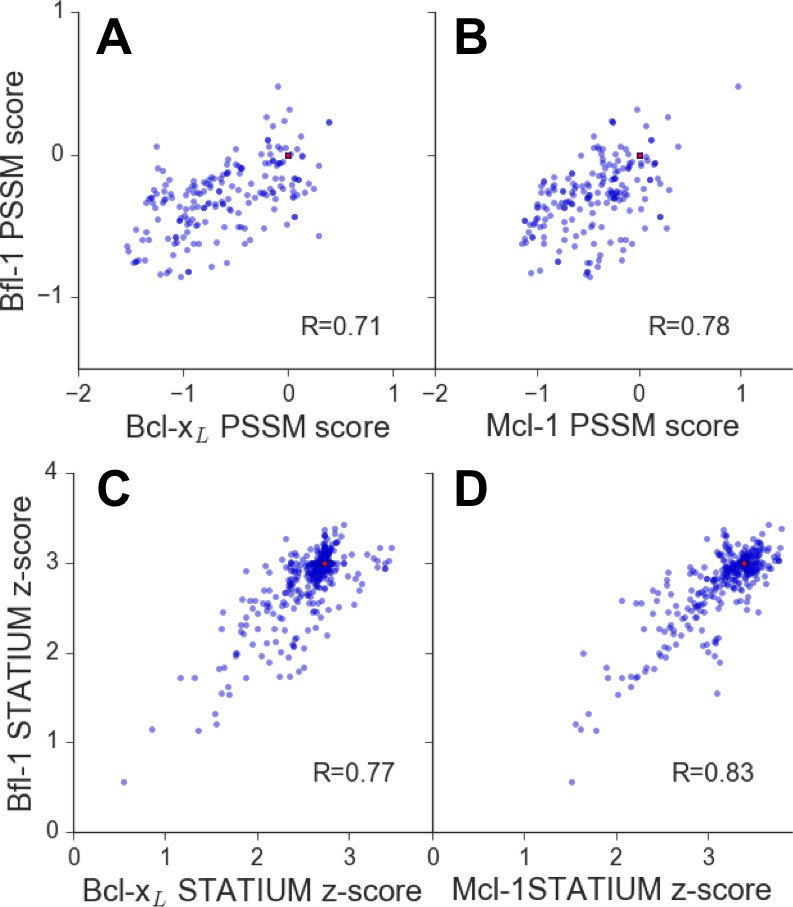
Affinities of BIM point mutants for different Bcl-2 proteins are predicted to be strongly correlated.
Larger scores predict tighter binding. Red points represent wt PUMA BH3. (A) PSSMSPOT scores for binding to Bcl-xL versus Bfl-1, (B) PSSMSPOT scores for binding to Mcl-1 versus Bfl-1, (C) STATIUM z-scores for binding to Bcl-xL versus Bfl-1, (D) STATIUM z-scores for binding to Mcl-1 versus Bfl-1. Single point mutations to all residues other than cysteine and methionine were measured at positions 2d, 2e, 2g-3b and 3d-4a for PSSMSPOT (A, B). Single point mutations to all residues were calculated for positions 1g, 2a, 2c-2e, 2g-3b, 3d-3f, 4a, 4b, 4e and 4f for STATIUM (C, D). Pearson correlation coefficients are indicated.
Figure 1—figure supplement 2
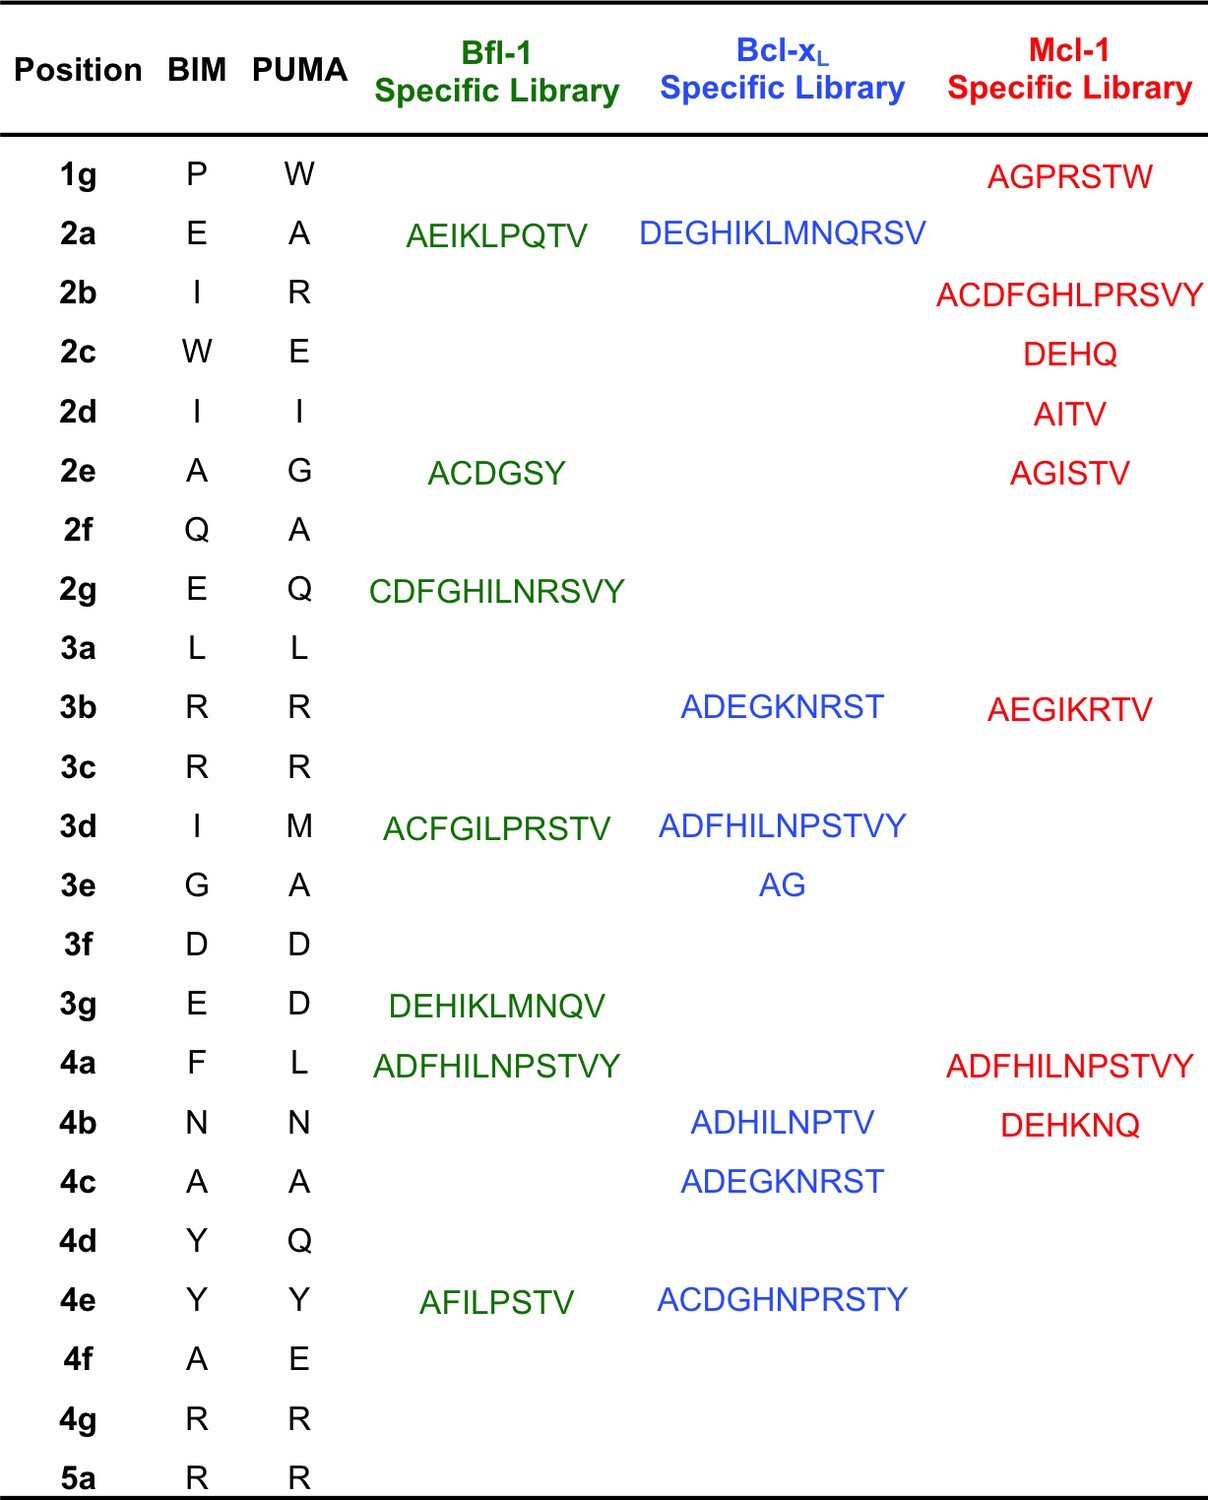
Composition of the Bcl-xL, Mcl-1 and Bfl-1-targeted libraries.
https://doi.org/10.7554/eLife.25541.004
Figure 1—figure supplement 3
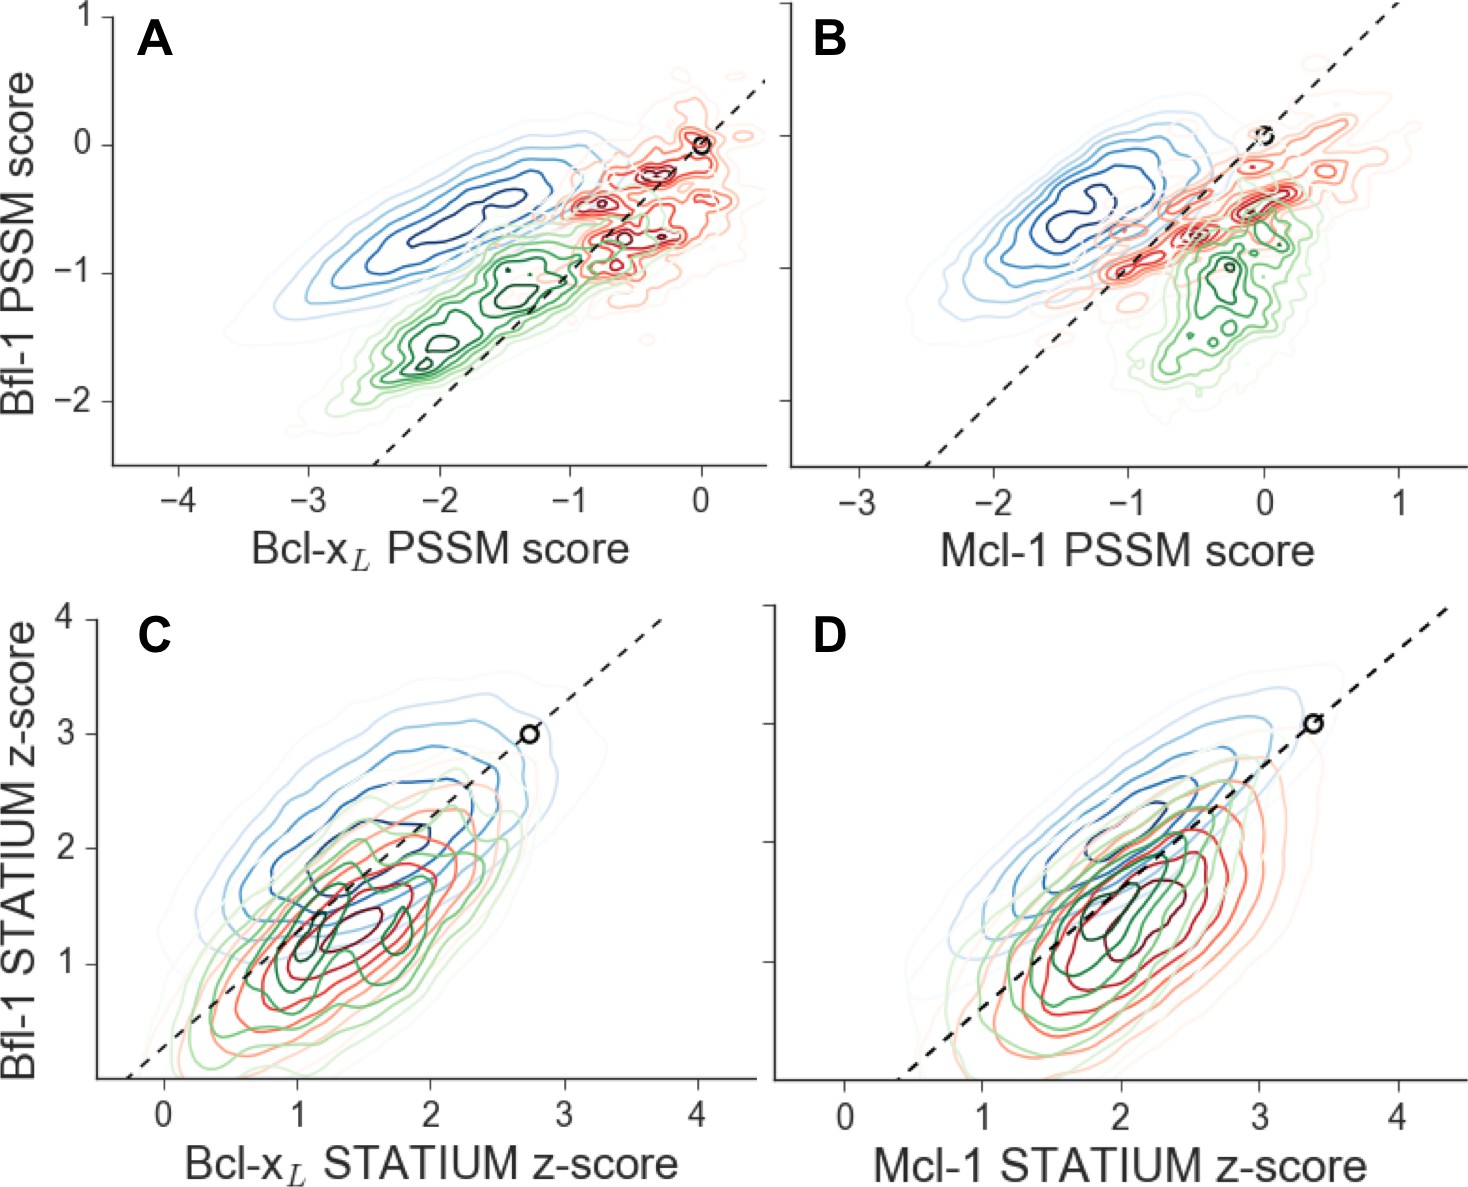
Scores for members of three libraries designed to target Bfl-1 (blue), Mcl-1 (green) or Bcl-xL (red).
Scores show predicted affinities of peptides in each library for each target. Larger scores predict tighter binding. (A) PSSMSPOT scores for binding to Bcl-xL versus Bfl-1, (B) PSSMSPOT scores for binding to Mcl-1 versus Bfl-1, (C) STATIUM z-scores for binding to Bcl-xL versus Bfl-1, (D) STATIUM z-scores for binding to Mcl-1 versus Bfl-1. Points on the dashed line have the same low specificity as PUMA BH3 (open black circle).
Figure 2 with 5 supplements
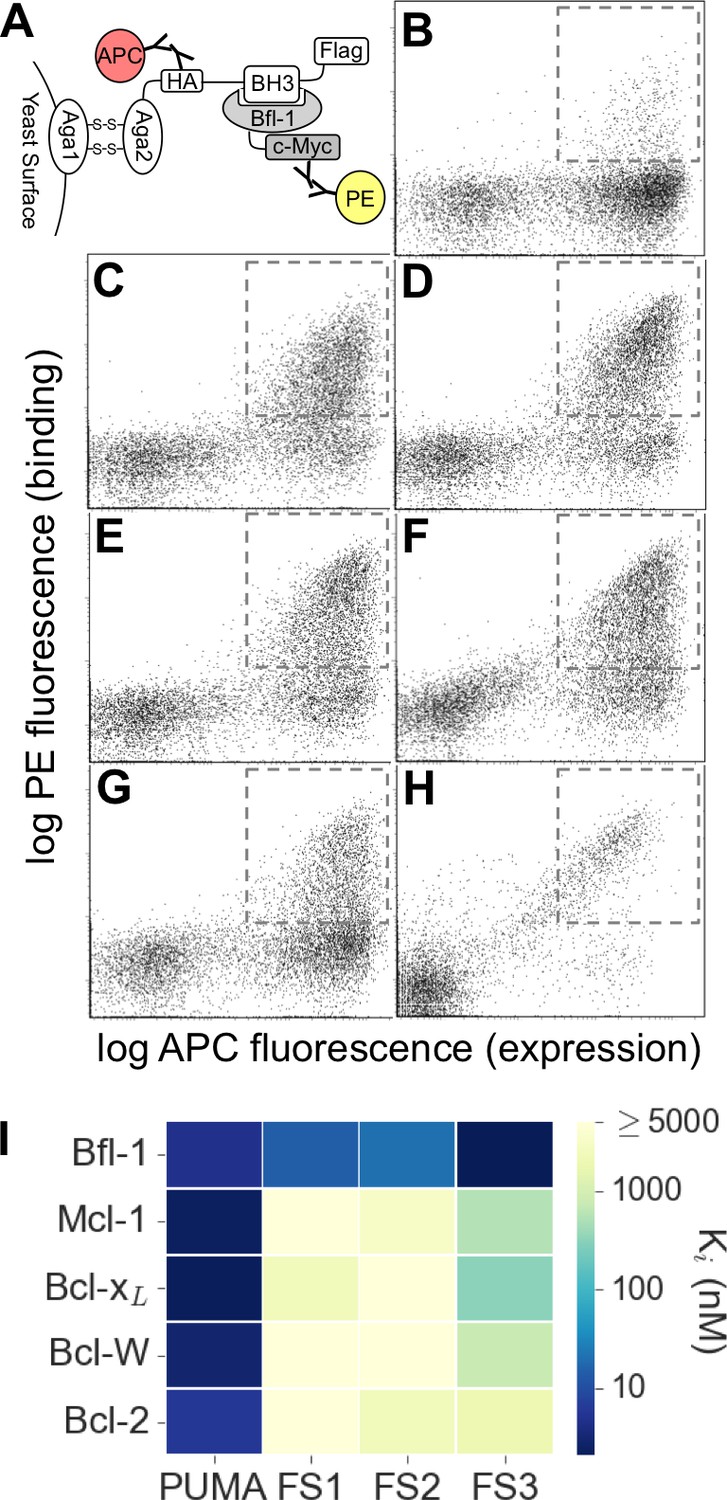
Experimental library screening for Bfl-1 affinity and selectivity.
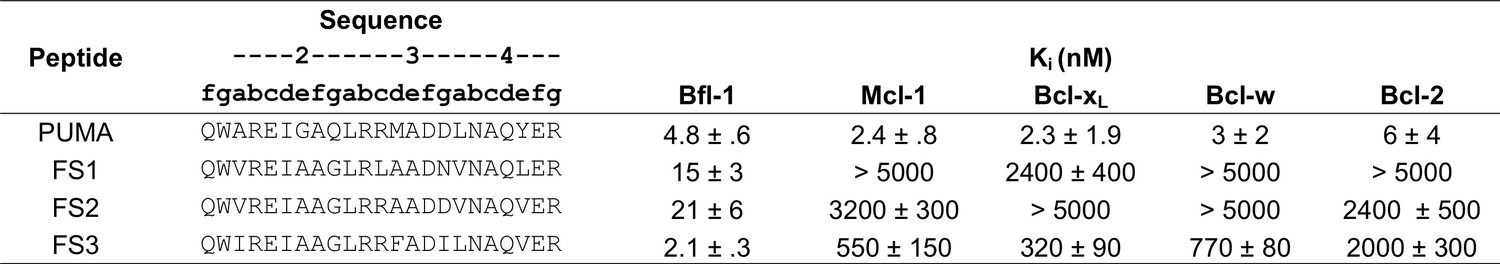
(A) Yeast-surface display configuration. BH3 peptides were expressed as fusions to Aga2; HA tag expression was detected with APC and Bfl-1 binding was detected with PE. (B) FACS analysis showed that only ~5% of cells in the unsorted PUMA libraries bound to Bfl-1 at 100 nM. (C) Library binding to 100 nM Bfl-1 after one round of enrichment. (D–G) Library binding to off-target proteins (100 nM) after one round of enrichment: (D) Bcl-xL, (E) Bcl-2, (F) Bcl-w, (G) Mcl-1. (H) Library binding to 100 nM Myc-tagged Bfl-1 in the presence of excess unlabeled competitor (Mcl-1, Bcl-2, Bcl-w and Bcl-xL; 1 μM each) after six rounds of enrichment. (I) Inhibition constants determined using fluorescence anisotropy for 23-residue peptides corresponding to PUMA BH3, FS1, FS2 and FS3.
-
Figure 2—source data 1
Data collected from competition fluorescence polarization experiments.
- https://doi.org/10.7554/eLife.25541.007
Figure 2—figure supplement 1
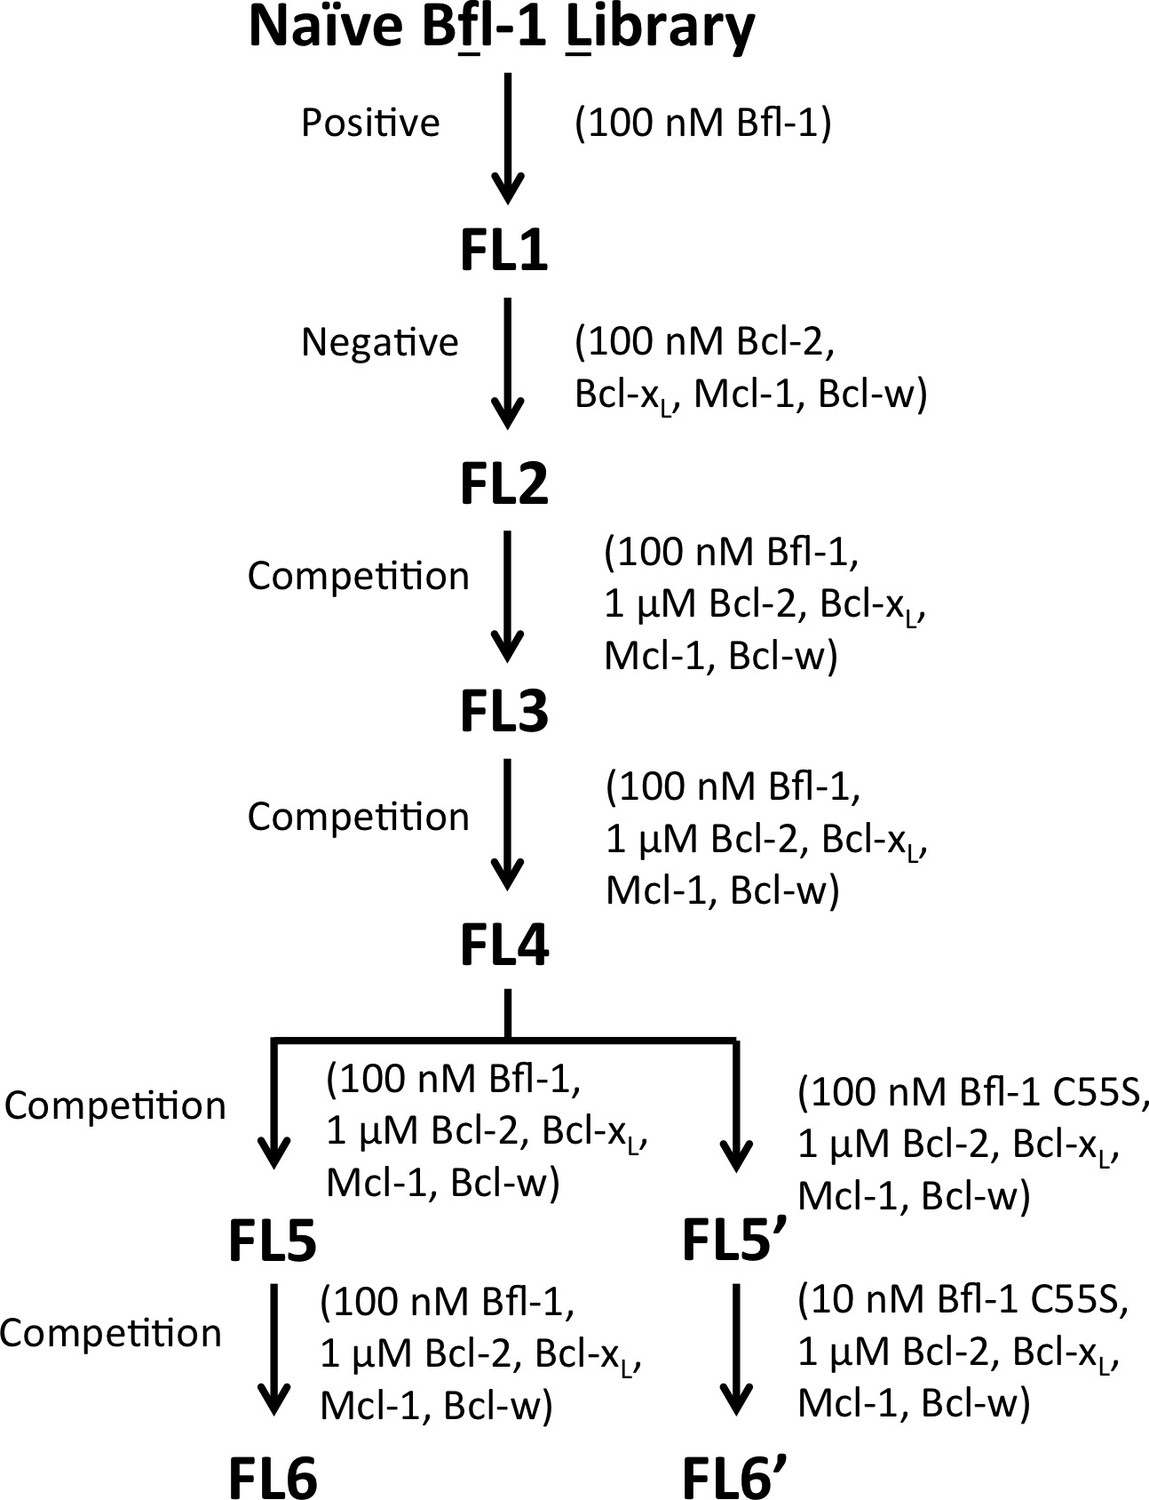
The PUMA BH3 library was screened to enrich for selective binders of Bfl-1.
Several positive, negative and competition screens were used to identify tight and selective Bfl-1 binders. Competition screens included unlabeled competitors at the indicated concentrations. In negative screens, cells that did not bind to the indicated labeled proteins were collected. Nearly all clones sequenced from pools FL5 and FL6 contained a cysteine in positions 1g-2e. Sorts FS5 and FS6 were repeated with the cysteine-to-serine point mutant of Bfl-1, C55S.
Figure 2—figure supplement 2

FACS analysis of the designed libraries after first two rounds of sorting (FL2, see Figure 2—figure supplement 1).
Plots show binding of library peptides to 100 nM Myc-tagged Bfl-1 in the presence of excess unlabeled competitor (Mcl-1, Bcl-2, Bcl-w and Bcl-xL; 1 μM each) when encoded in (A) a BIM background or (B) a PUMA background. Cells displaying Bfl-1 selective peptides fall in the region outlined by dotted lines.
Figure 2—figure supplement 3

Conventionally sequenced clones from pool FL6’.
https://doi.org/10.7554/eLife.25541.010
Figure 2—figure supplement 4
Peptide affinities for Bfl-1, Bcl-xL, Mcl-1, Bcl-2 and Bcl-w.
Ki obtained from competition assays with fluoresceinated BIM peptide. Data are mean ± SD of three replicates.
Figure 2—figure supplement 5

FS2 mutations made in a BIM background generate a weak binder of Bfl-1.
Fluorescence anisotropy competition experiments for unlabeled BIM (blue) vs. BIM including mutations from FS2 (BIM-FS2; E2bV, A2eA, E2gG, I3dA, F4aV, Y4eV; red). BIM-FS2 (Ki = 720 ± 110 nM) binds >1000 fold more weakly than native BIM (Ki <0.1 nM). Data from are three independent measurements. Ki values are mean ± SD at least three replicates.
Figure 3
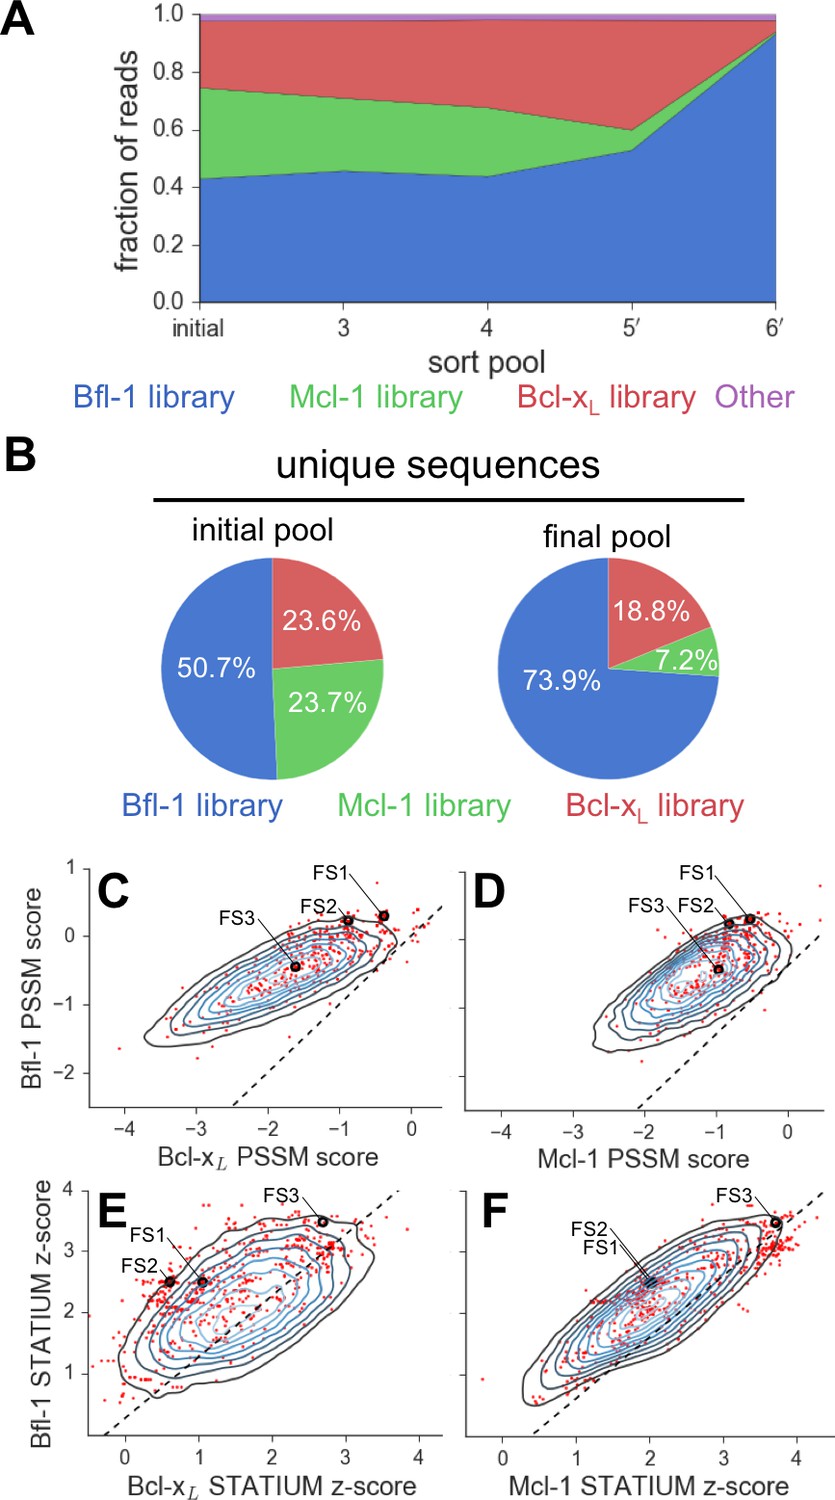
Evaluation of the library design.
(A) Sequences from the Bfl-1 library were preferentially enriched during sorting. Sequences with no more than one amino-acid mutation from the Bfl-1 (blue), Mcl-1 (green), or Bcl-xL (red) targeted libraries are plotted. Other sequences are shown in magenta. (B) The large majority of unique sequences in the final pool originated from the Bfl-1 library (colors as in part A). (C–F) Comparison of PSSMSPOT and STATIUM scores for the library before and after sorting. Peptides from the final sorted pool (red dots) are superimposed on the distribution of scores for the theoretical library (blue contour plots). Points to the left of the dotted lines correspond to peptides predicted to bind more selectively to Bfl-1 than does PUMA, with respect to the indicated competitor protein (Bcl-xL in C and E, Mcl-1 in D and F). Scores for FS1, FS2 and FS3 are indicated.
-
Figure 3—source code 1
Deep sequencing data analysis.
- https://doi.org/10.7554/eLife.25541.014
Figure 4 with 1 supplement
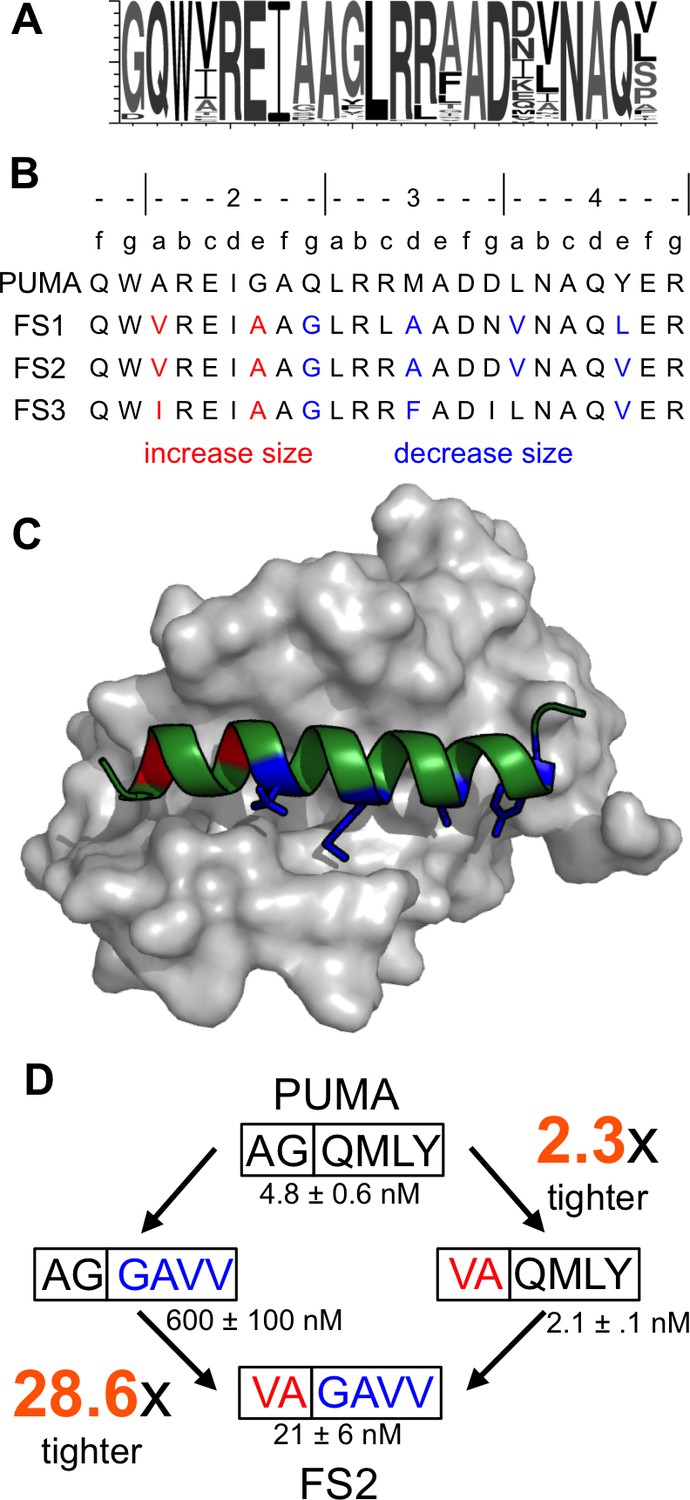
Epistatic mutations in PUMA confer Bfl-1 binding specificity.
(A) Sequence logo of unique peptide sequences in the final sorted pool from the Bfl-1 targeted library. (B) Location of mutated sites in FS1, FS2 and FS3. Mutations at positions 2a and 2e are in red and positions 2g, 3d, 4a and 4e are in blue. (C) Structure of Bfl-1 (gray surface) bound to PUMA (green, this work) with residues at positions 2a and 2e in red and those at 2g, 3d, 4a and 4e in blue. (D) Non-additive mutational energies for PUMA/FS2 chimeric proteins indicate coupling between N- and C-terminal mutations. Data are Ki ± SD of three or more independent fluorescence anisotropy competition experiments.
-
Figure 4—source data 1
Data collected from competition fluorescence polarization experiments.
- https://doi.org/10.7554/eLife.25541.016
Figure 4—figure supplement 1
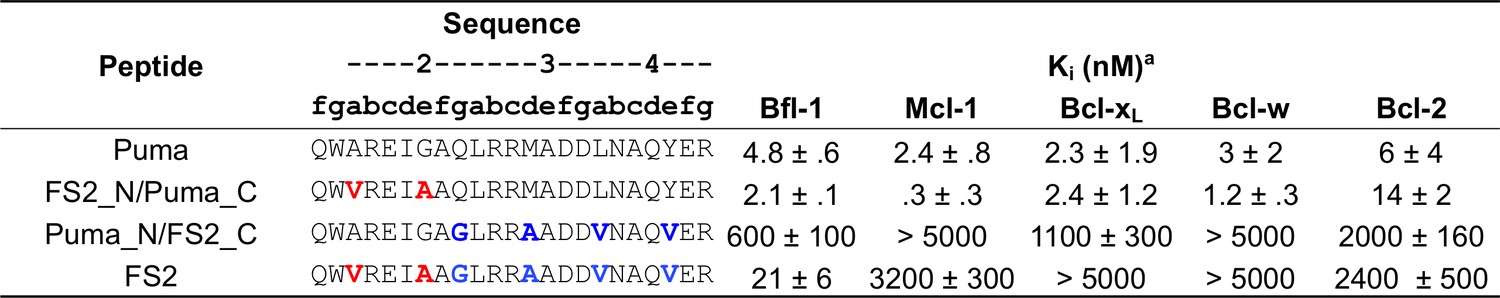
Affinities of FS2 chimeric proteins binding to Bfl-1, Bcl-xL, Mcl-1, Bcl-2 and Bcl-w.
Ki obtained from competition assays with fluoresceinated BIM peptide. Data are mean ± SD of three replicates.
Figure 5 with 4 supplements
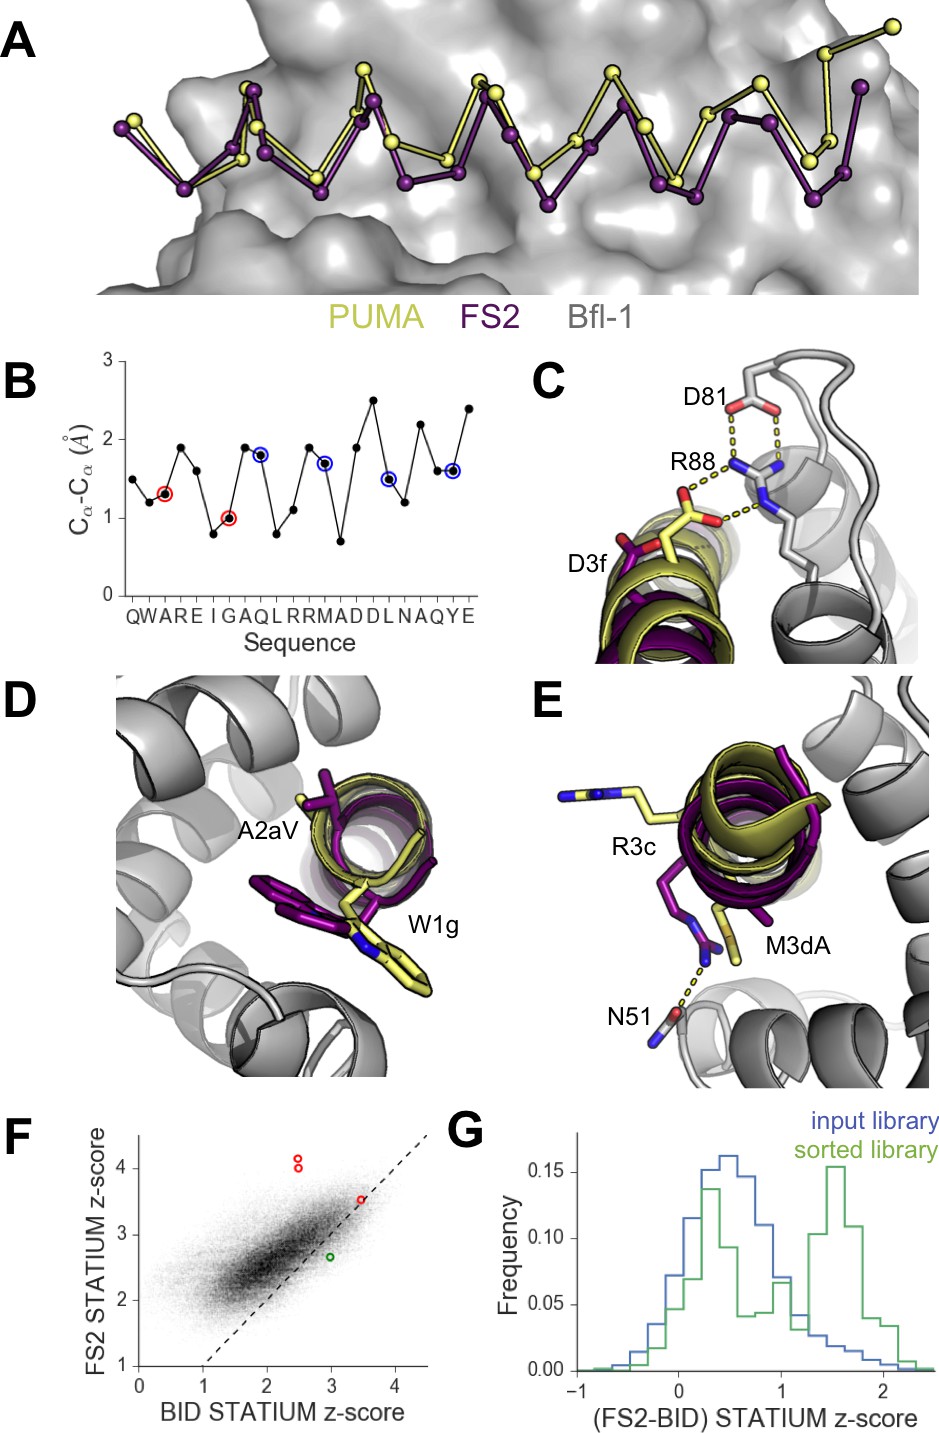
High-resolution structures of PUMA and FS2 bound to human Bfl-1.
(A) Binding groove of Bfl-1 (gray, surface) with PUMA (yellow) and FS2 (purple). (B) Cα- Cα shifts between FS2 and PUMA. Sites with larger/smaller residues in FS2 are indicated in red/blue. (C) The canonical Bfl-1:BH3 salt bridge between D3f and R88 is observed in the Bfl-1:PUMA complex but not the Bfl-1:FS2 complex. (D) Tryptophan at 1g is rotated into the Bfl-1 binding groove in the Bfl-1:FS2 complex and away from the binding groove in the Bfl-1:PUMA complex. (E) In contrast with the solvent exposed arginine at position 3c of the Bfl-1:PUMA complex, R3c is oriented into the BH3 binding groove in the Bfl-1:FS2 complex, forming a hydrogen bond with N51 of Bfl-1. (F) Bfl-1 targeted library sequences score better on the Bfl-1:FS2 structure than on the Bfl-1:BID structure used for the initial library design; higher scores predict tighter binding. STATIUM z-scores for the Bfl-1 targeted library are in blue. FS1, FS2 and FS3 are indicated in red and PUMA in green. (G) Sorting enriched sequences that score better on the Bfl-1:FS2 template than on the Bfl-1:BID template. STATIUM z-scores for the input Bfl-1 library are in blue and scores for sequences identified after the final round of screening are in green.
Figure 5—figure supplement 1
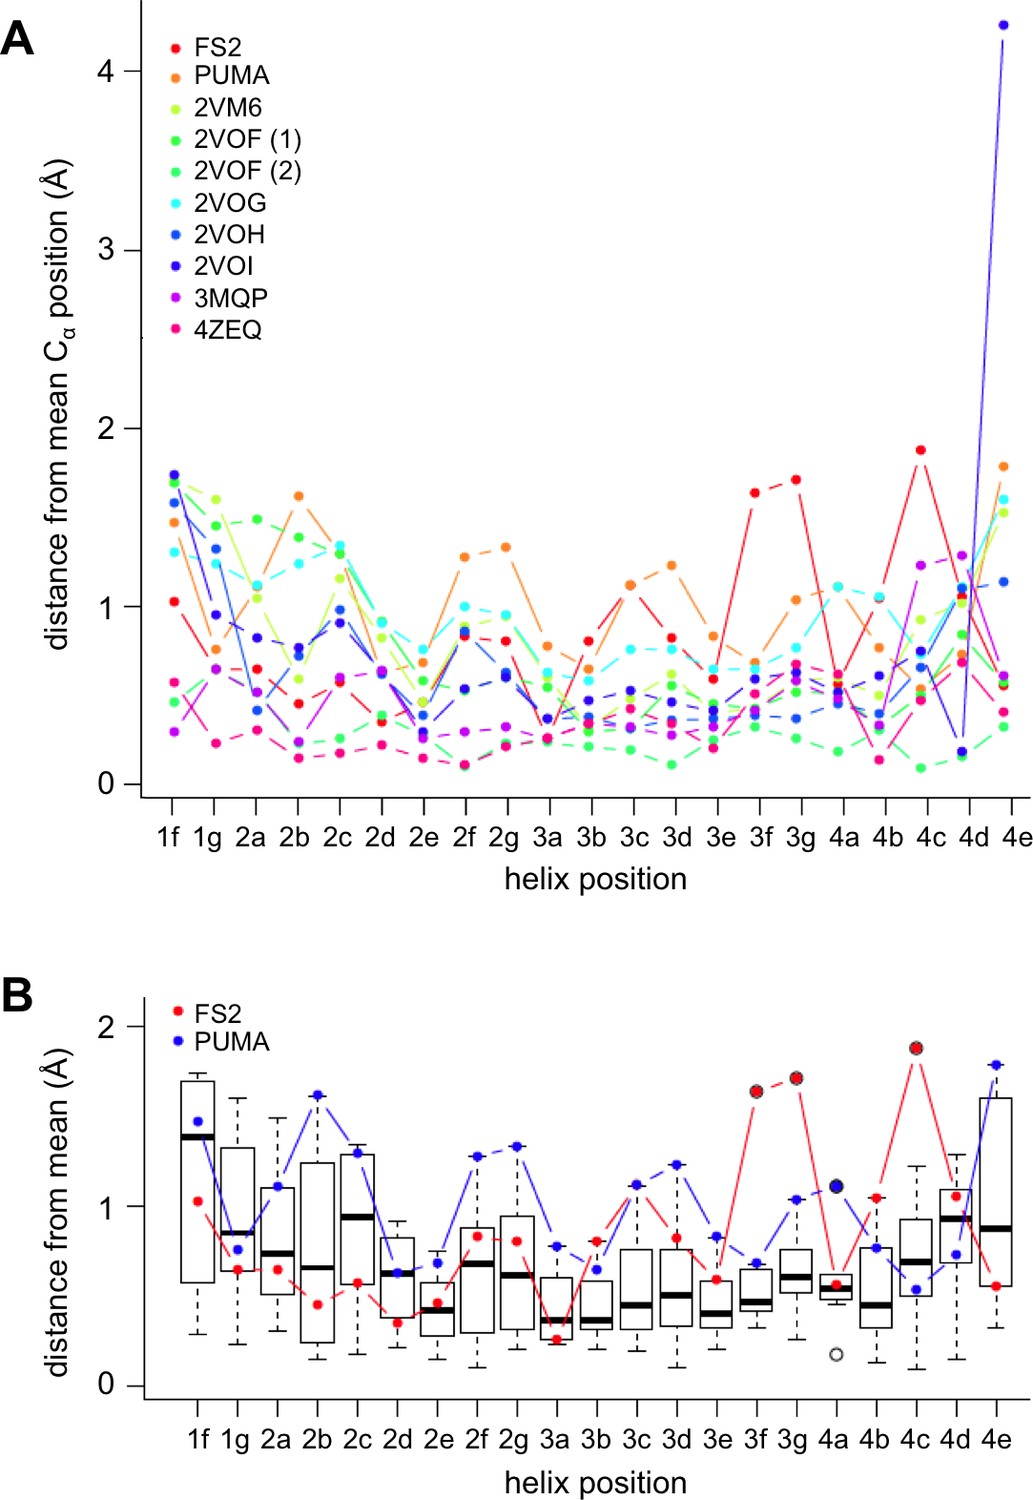
Comparison of PUMA and FS2 binding geometry with that in other crystal structures of BH3:Bfl-1 complexes deposited in the PDB.
All Bfl-1:peptide structures were aligned to Bfl-1 and the mean C-alpha positions were calculated for each BH3 peptide position. Mean distances were calculated separately for all complexes in the asymmetric unit. (A) The C-alpha distance deviation from the mean is plotted for all structures. (B) Box plots illustrate the positional variability at each site. FS2 is significantly shifted at peptide positions 3f, 3g and 4c. The following structures from the PDB were included in this comparison: 2VM6 (Herman et al., 2008), 2VOF (Smits et al., 2008), 2VOG (Smits et al., 2008), 2VOH (Smits et al., 2008), 2VOI (Smits et al., 2008), 3MQP (Guan et al., 2010 in press) and 4ZEQ (Guan et al., 2005).
Figure 5—figure supplement 2

FACS analysis of cells displaying FS2 or FS2 with single point mutants at position 3f.
FACS profiles for mutants are nearly indistinguishable from that of FS2. Data were collected the same day with the same settings, and all plots use the same scale of arbitrary units.
Figure 5—figure supplement 3
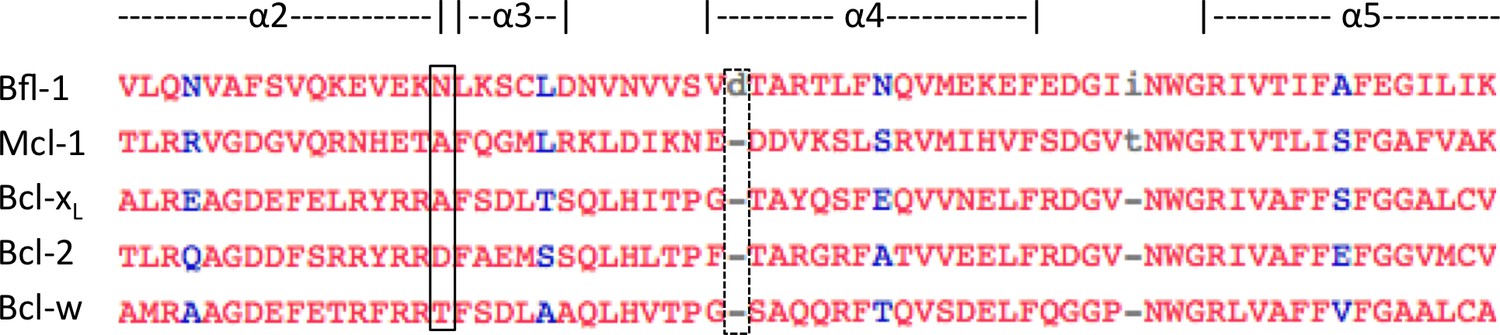
Multiple-sequence alignment of helices 2–4 of human anti-apoptotic Bfl-1 homologs.
Bfl-1 has an amino-acid insertion that may contribute to the widened binding groove between helices 3 and 4 (dotted box). Additionally, there is an asparagine that is unique to Bfl-1 at the elbow between helices 2 and 3 that forms a hydrogen bond with FS2 (solid box). This interaction may contribute to the Bfl-1 specificity of FS2. Sequence alignment made using Cobalt (Papadopoulos and Agarwala, 2007).
Figure 5—figure supplement 4
Residues in FS2 are not readily accommodated in the PUMA -binding geometry.
Modeling on a fixed backbone indicates that all valine rotamers would clash (red spheres) with Bfl-1 (green) when modeled in to position 2a of PUMA (gray). Shown here is the most preferred rotamer. The shifted binding mode of FS2 accommodates valine at position 2a. Model made using Pymol. Red lozenge indicates a steric clash as detected by the program.
Figure 6 with 1 supplement
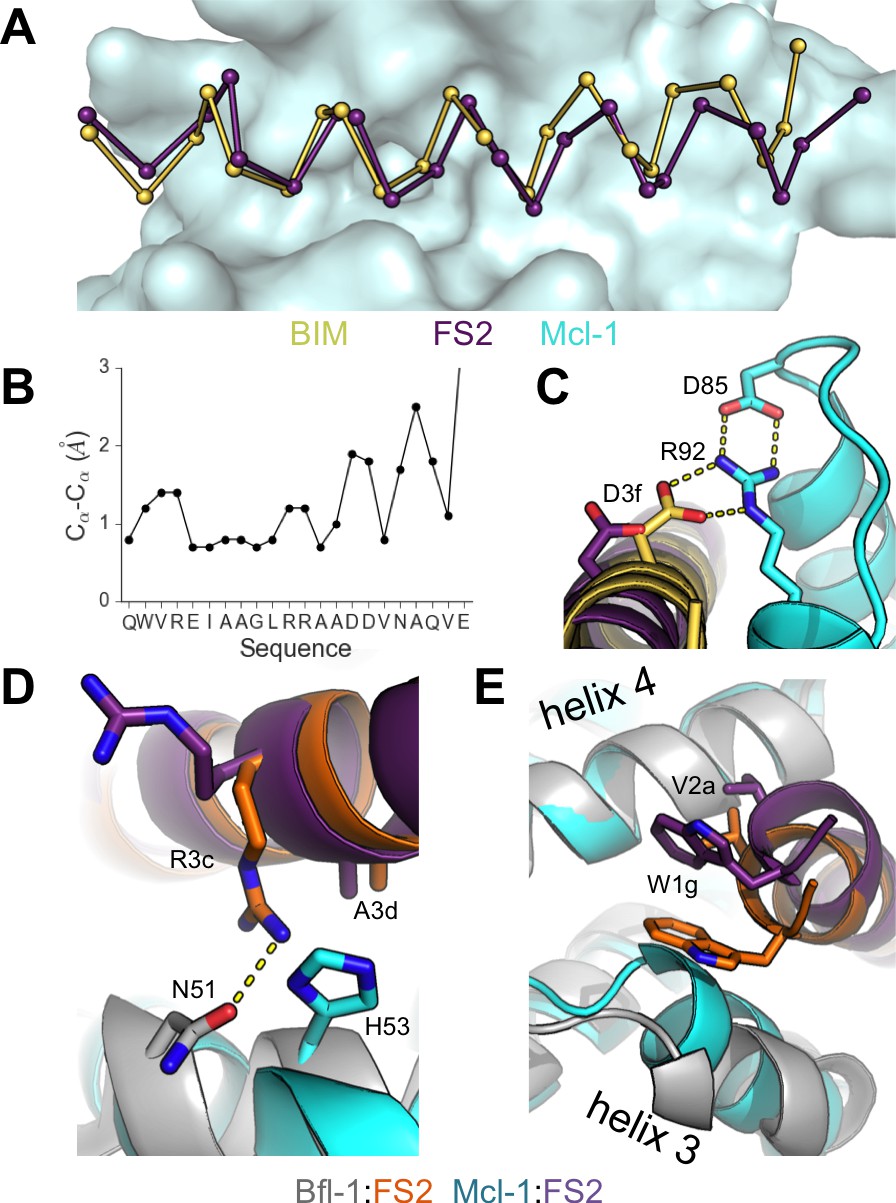
Crystal structure of FS2 bound to human Mcl-1.
(A) Binding groove of Mcl-1 (blue, surface) with BIM (yellow, 2PQK [Fire et al., 2010]) and FS2 (purple). (B) Cα- Cα shifts between FS2 and BIM when bound to Mcl-1. (C) The canonical Bfl-1:BH3 salt bridge between D3f and R92, formed in Mcl-1:BIM, is not observed in the Mcl-1:FS2 complex. (D) In contrast with the arginine at position 3c of the Bfl-1:FS2 complex, which makes packing and hydrogen-bond interactions the interface, R3c is oriented away from the BH3 binding groove in the Mcl-1:FS2 complex. (E) The Mcl-1 binding groove between helix 3 and helix four is narrower than the Bfl-1 binding groove, and the N-terminus of FS2 is shifted in the Mcl-1:FS2 structure in comparison with the Bfl-1:FS2 complex.
Figure 6—figure supplement 1

Alignment of all crystal structures in the PDB of Bfl-1/Mcl-1 bound to BH3 peptides.
Helix three in Bfl-1 is shifted relative to Mcl-1, resulting in a widened binding groove.
Figure 7 with 2 supplements
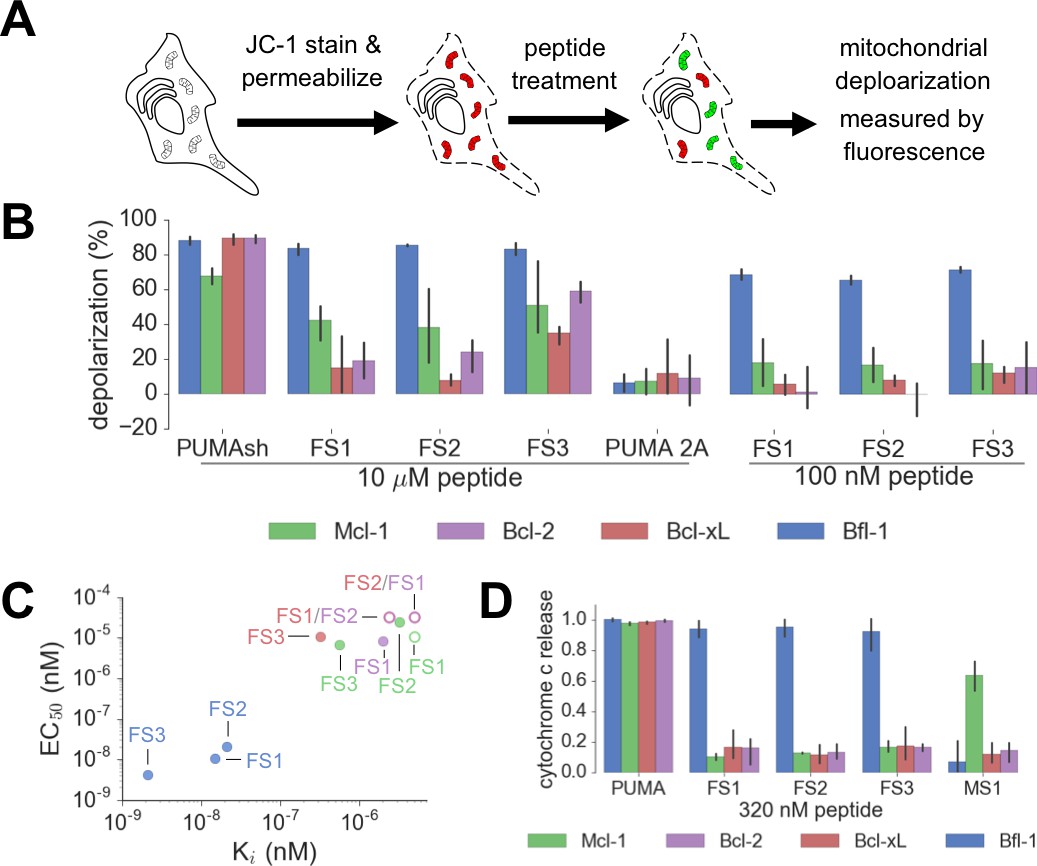
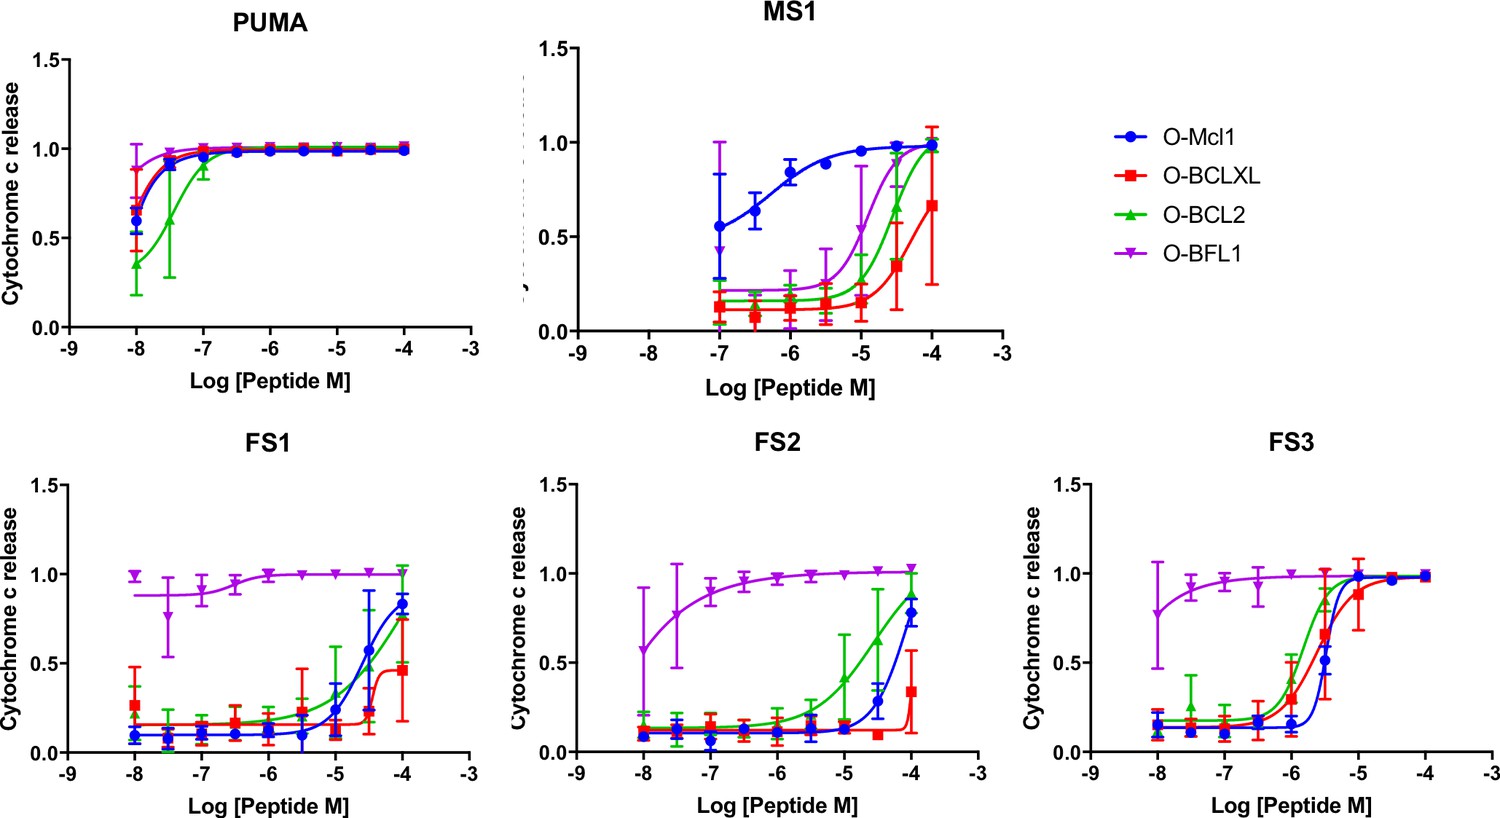
Designed Bfl-1 inhibitors selectively induce MOMP in Bfl-1 dependent cells.
(A) The BH3 profiling assay detects MOMP by monitoring JC-1 fluorescence in permeabilized cells treated with different peptides. (B–C) Depolarization of mitochondria induced by designed peptides in four cell lines that depend on ectopic expression of Mcl-1, Bcl-2, Bcl-xL or Bfl-1 for survival. (C) Correlation between Ki in solution studies and EC50 values in BH3 profiling. Open circles indicate lower bound estimates of EC50 or Ki. (D) Cytochrome c release from the same cell lines in B and C. Data are mean ± SD of three or more independent measurements.
-
Figure 7—source data 1
Data collected from BH3 profiling and cytochrome c release assays.
- https://doi.org/10.7554/eLife.25541.026
Figure 7—figure supplement 1
At low concentrations, FS1, FS2 and FS3 selectively induced cytochrome c release only in Bfl-1 dependent cell lines. iBH3 was performed on highly primed cells of known anti-apoptotic protein dependency.
Data are mean ± SD of 3 or more independent measurements.
Figure 7—figure supplement 2
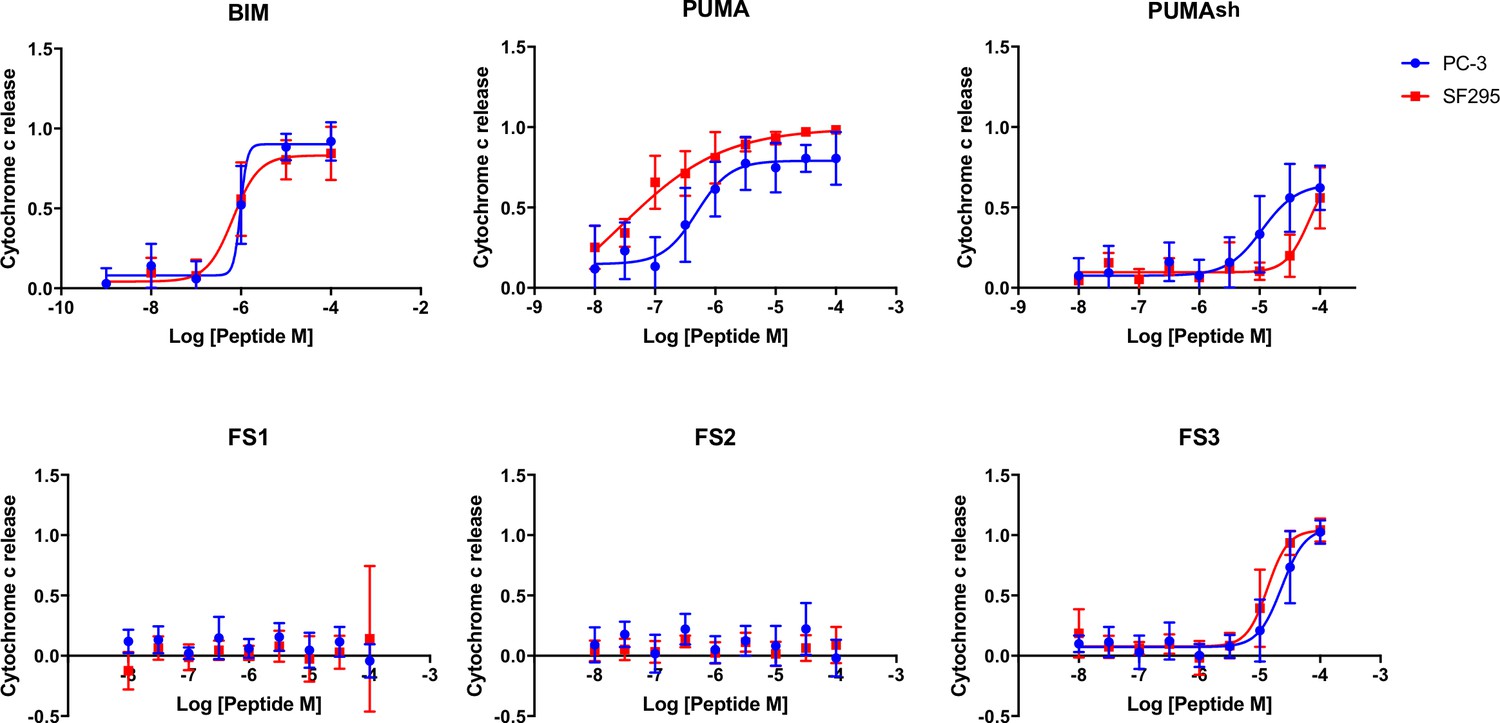
iBH3 was performed on unprimed cells to test for activation function.
These cells require a BAK/BAX activator to release cytochrome c. Cytochrome c release is stimulated by the known activator peptides BIM and PUMA BH3. Truncated PUMA (1e-4c), PUMAsh and FS3 have reduced capacity to promote cytochrome c release. FS1 and FS2 show no cytochrome c release up to 100 μM. Data are mean ± SD of three or more independent measurements.
Figure 8 with 4 supplements

An electrophilic variant of FS2 reacts covalently with Bfl-1.
(A) C55 in Bfl-1 is close to the BH3 binding groove in BIM:Bfl-1 structure 2VM6 (Herman et al., 2008). (B–C) Modeling suggested two ways in which an N-terminal acrylamide group could be incorporated into a BH3 peptide with good reaction geometry, leading to peptides FS2_1gX (modification shown in B) or FS2_1fX (modification shown in C) (D) FS2_1fX (red) reacted more rapidly with Bfl-1 than FS2_1gX (green). Bfl-1 crosslinking as a function of reaction time was measured using gel-shift assays; data are mean ± SD of two or more independent measurements. Crosslinking did not occur with the acetylated control peptide FS2_1fAc (blue). (E) FS2_1fX (red) was more potent than FS2_1fAc (blue) in BH3 profiling assays of Bfl-1 dependent cells. Data are mean ± SD of three or more independent measurements. (F) X-ray structure of Bfl-1 covalently cross-linked to FS2_1fX. (G) Electron density map of covalent crosslink between FS2_1fX and Bfl-1.
-
Figure 8—source data 1
Data collected from gel shift assays.
- https://doi.org/10.7554/eLife.25541.030
Figure 8—figure supplement 1

Conventionally sequenced clones from pool FL6 and their frequencies.
https://doi.org/10.7554/eLife.25541.031
Figure 8—figure supplement 2
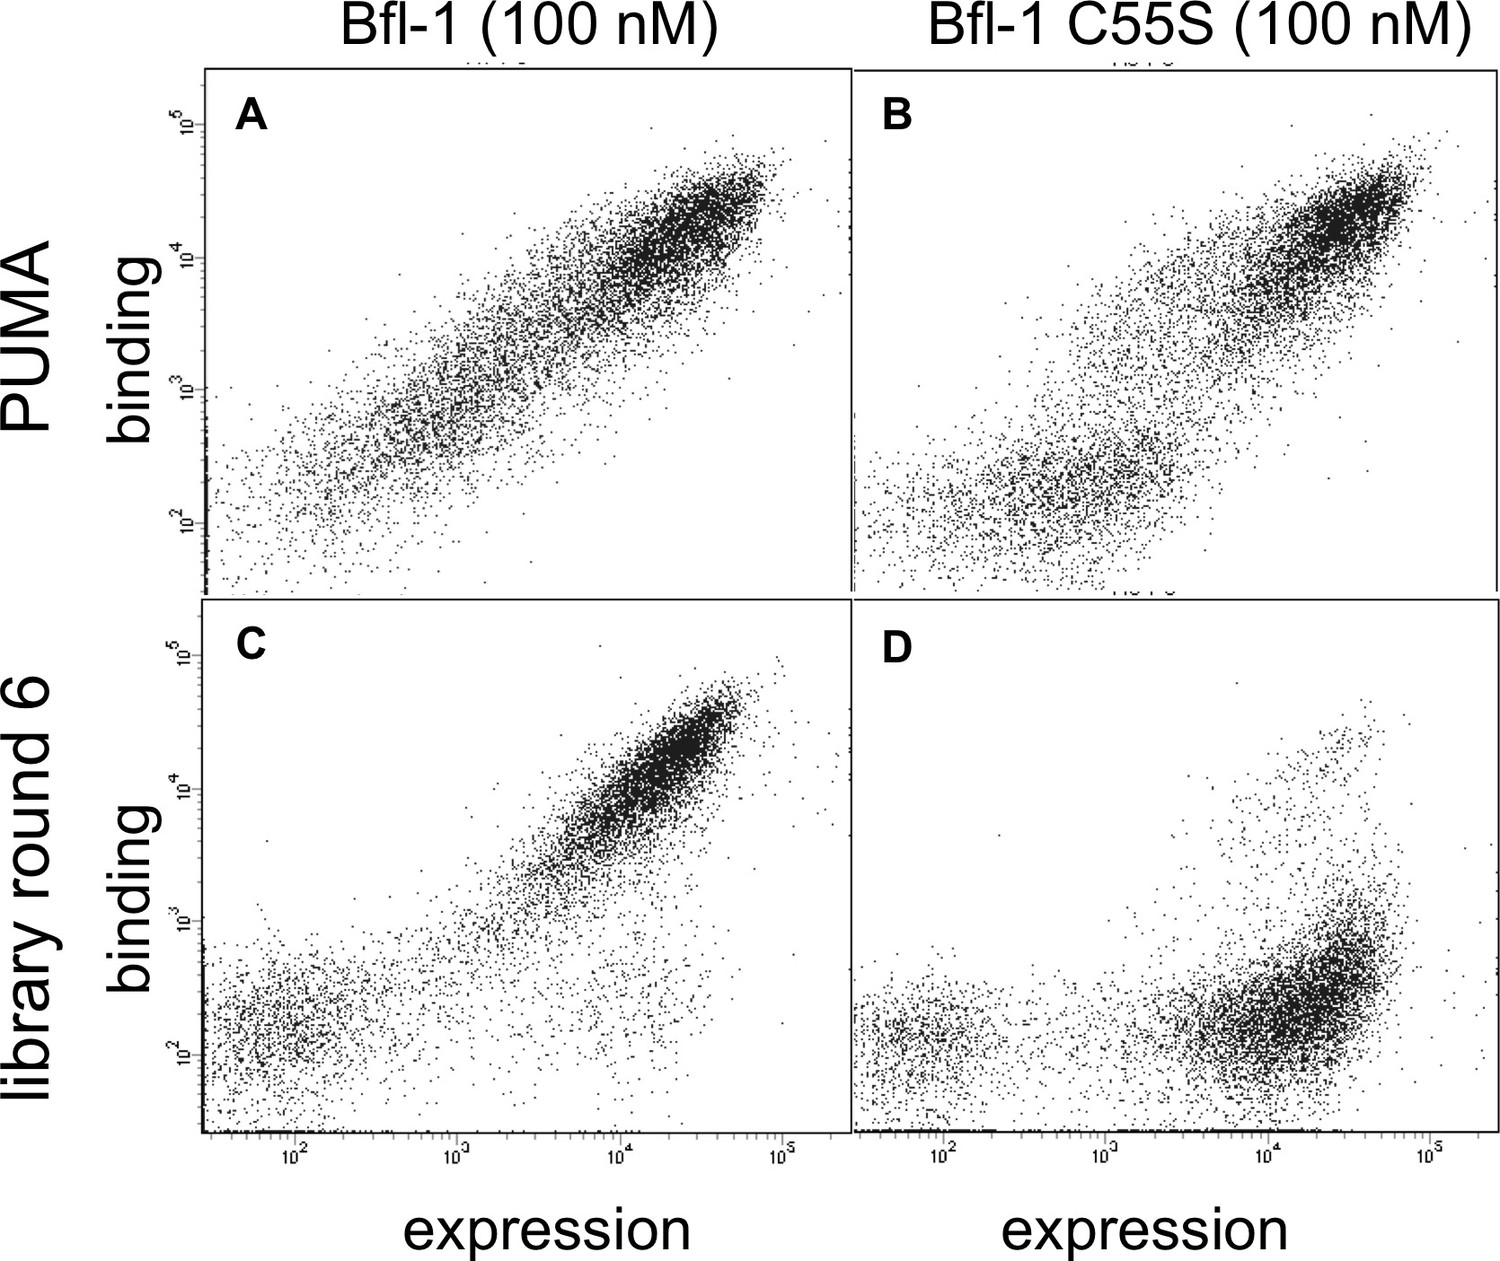
Library members bind covalently to Bfl-1 cysteine 55.
FACS analysis of yeast cells displaying (A) PUMA in the presence of Bfl-1, (B) PUMA in the presence of the cysteine-to-serine point mutant Bfl-1 C55S, (C) the FL6 library pool in the presence of Bfl-1, and (D) the FL6 library pool in the presence of Bfl-1 C55S.
Figure 8—figure supplement 3
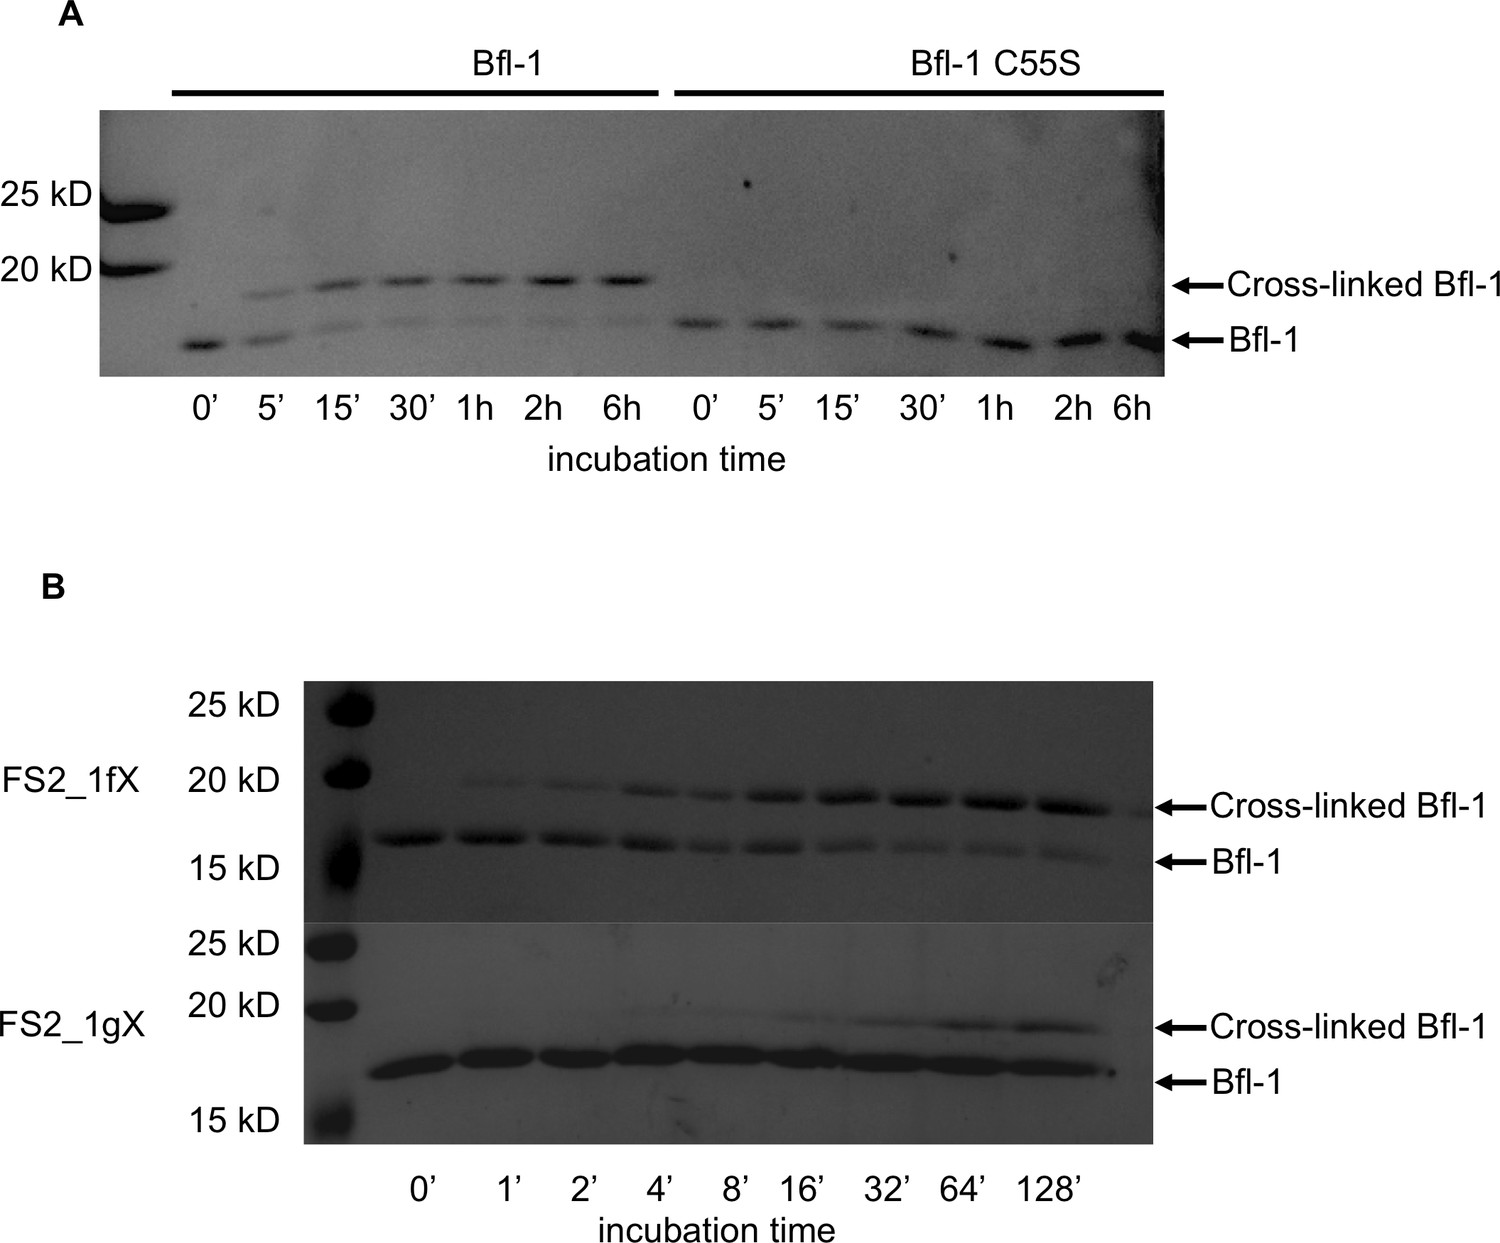
Kinetics of the reaction of Bfl-1 with electrophilic peptides.
(A) There is a time-dependent shift in apparent molecular weight, as assessed by SDS-PAGE, when Bfl-1 is incubated with FS2_1fX but not when Bfl-1 C55S one is incubated with FS2_1gX, consistent with covalent modification of Bfl-1 at cysteine 55. (B) Time course of FS2_1gX and FS2_1fX crosslinking with Bfl-1.
Figure 8—figure supplement 4
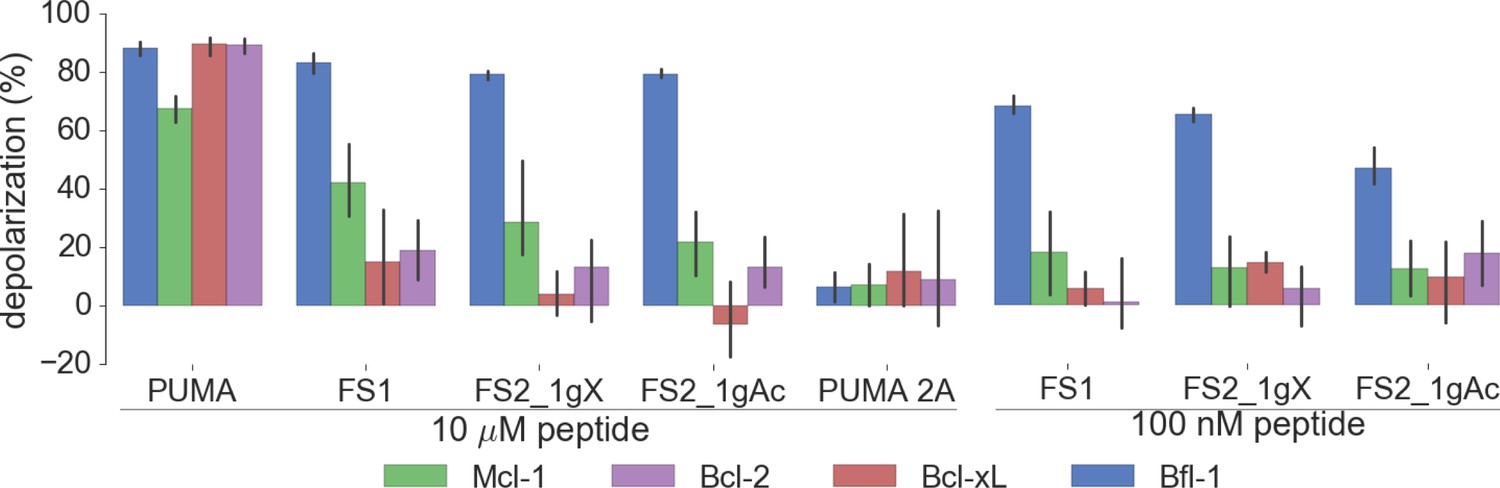
Depolarization of mitochondria induced by designed peptides, including covalent inhibitor FS2_1gX, in four cell lines that depend on ectopic expression of Mcl-1, Bcl-2, Bcl-xL or Bfl-1 for survival.
Data are mean ± SD of three or more independent measurements.
Additional files
-
Supplementary file 1
Summary of X-ray data collection and refinement statistics.
- https://doi.org/10.7554/eLife.25541.035
Download links
A two-part list of links to download the article, or parts of the article, in various formats.
Downloads (link to download the article as PDF)
Open citations (links to open the citations from this article in various online reference manager services)
Cite this article (links to download the citations from this article in formats compatible with various reference manager tools)
Epistatic mutations in PUMA BH3 drive an alternate binding mode to potently and selectively inhibit anti-apoptotic Bfl-1
eLife 6:e25541.
https://doi.org/10.7554/eLife.25541


