Pioneer neurog1 expressing cells ingress into the otic epithelium and instruct neuronal specification
- Universitat Pompeu Fabra, Spain
- Centre de Biologie Intégrative, Université de Toulouse, CNRS, UPS, France
Figures
Figure 1

Specification dynamics and morphogenesis of the otic neurogenic domain.
(A,B) Selected frames of a video of an otic placode from a TgBAC(neurog1:DsRedE)n16 embryo shown in (A) 3D reconstructions (dorsal view) and (B) coronal ventral planes. Green in the right schemes shows the region imaged. Membranes are stained with memb-GFP. D:dorsal, V:ventral, A:anterior, P:posterior, M:medial and L:lateral. The asterisk indicates the region where the SAG is forming. Medial to the otic vesicle, DsRedE is also expressed in the neural tube. (C) Averagez-projection (dorsal view) of the inner ear at 17 hpf. Dashed line indicates the protuberance. (D) Scheme of the rectangular cuboid used for quantifications. Neurogenic region is shown in red. (E,F,G) Quantification of the number of cells (E), the cellular density (F) and mitotic events (G) in the indicated regions at 19 hpf (n = 11) (E,F) or between 14 and 18.5 hpf (n = 2) (G). Data are mean ± s.e.m. ***p<0.0001 one sample t-test in (E) and unpaired t-test (F). Scale bars, 20 µm. Dotted lines outline the limits of the otic vesicle.
Figure 2 with 1 supplement
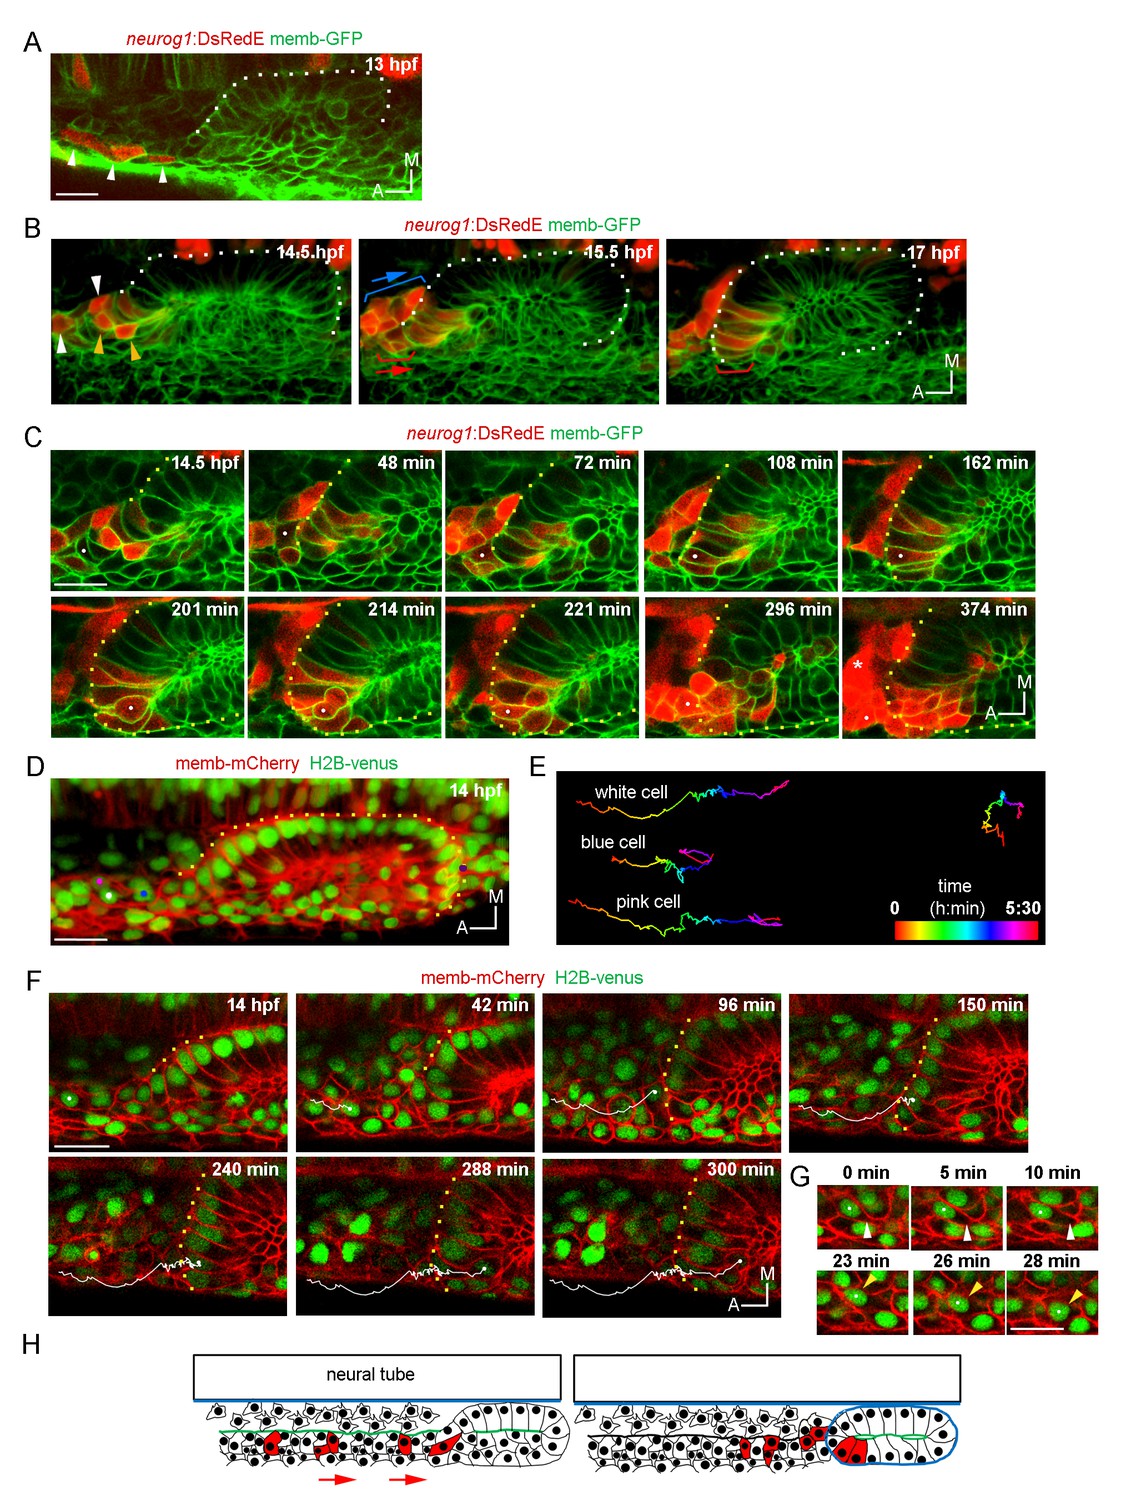
Ingression of neurog1+ cells.
(A) The otic epithelium and its anterior region at 13 hpf. Arrowheads highlight neurog1+ cells outside the otic epithelium. (B) Selected frames of a 3D reconstruction (dorsal view) of the otic placode following the movement of the anterior neurog1+ cells. Arrowheads at 14.5 hpf indicate neurog1+ cells before epithelialisation (white: cells outside the placode, orange: ingressing cells). At 15.5 hpf red bracket identifies cells that will ingress (shown at 17 hpf) and blue bracket cells that will not ingress. In (A) and (B) the contrast of the red signal was increased to improve visualisation. (C) Selected planes of a 3D tracking of a single cell specifying during ingression (white dot). At 108 min the cell is already epithelialised. Asterisk indicates the SAG. (D–F) 3D tracking of single cells during ingression. (D) 3D reconstruction (dorsal view) showing the initial position of the tracked cells (white, pink and blue dots) at 14 hpf. The violet dot indicates the posterior vertex of the placode. (E) 2D visualisation of the 3D tracks shown in (D) are displayed in a temporal color code. Each track was displaced in the y axis for better visualisation. The track of the posterior vertex of the placode is shown on the right (see also Figure 2D). (F) Selected frames for the cell of the white track. At 150 min the cell is ingressing and completed at 240 min. At 300 min cytokinesis occurs. Membranes are stained with memb-mCherry. Embryos are Tg(actb:H2B-venusFP). (G) Selected planes showing cell-membrane displacements during migration of the cell tracked in (F). White arrowheads indicate protrusion of the cell front and orange arrowheads the position of the nucleus. (H) Schematic representation of the migration and ingression during epithelialisation (see Figure 2—figure supplement 1 for further details). Blue line: laminin, green line: actin layer, red cells: neurog1+ cells, red arrows: migration of neurog1+ cells towards the otic placode. Scale bars, 20 µm. Dotted lines outline the limits of the otic vesicle.
Figure 2—figure supplement 1
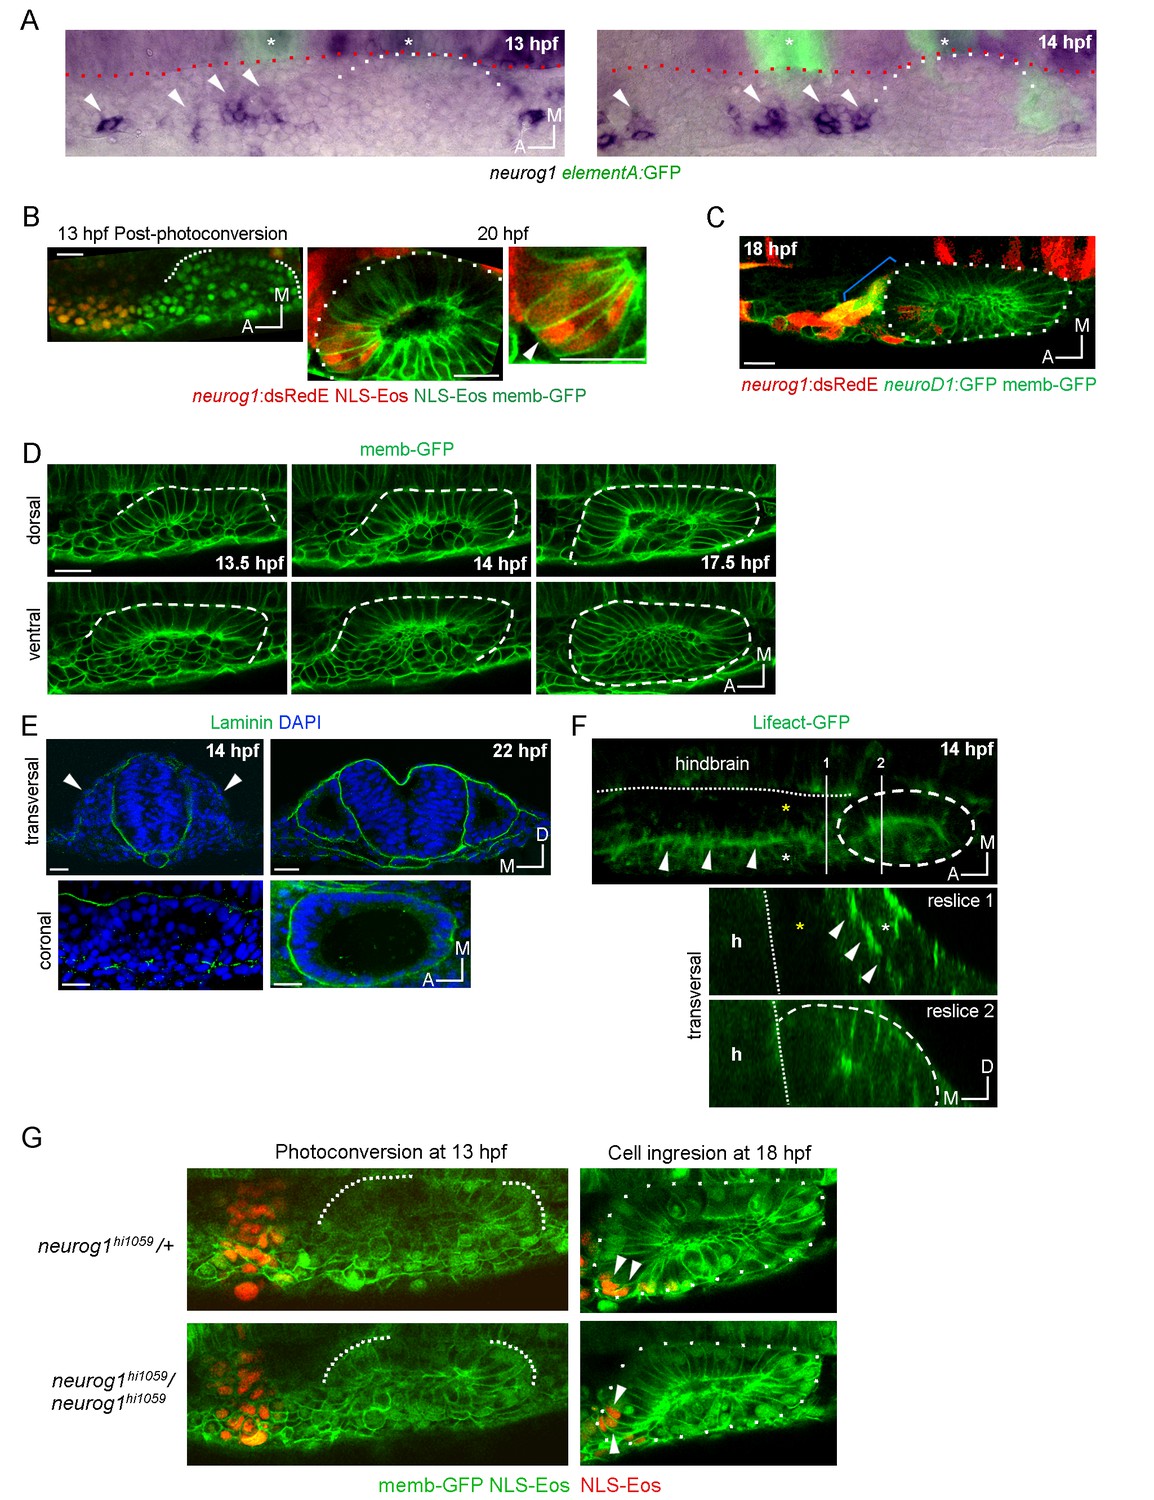
Morphogenetic features related to ingression.
(A) Whole mount ISH for neurog1 from 13 and 14 hpf Tg(elA:GFP) embryos. This transgenic line expresses GFP in rhombomeres 3 and 5 (asterisks, at early stages rhombomere three express higher levels than rhombomere 5), facilitating the spatial localization of the otic placode. An immunostaining for GFP was performed after the in situ hybridisation. Dotted lines highlight the limits of the hindbrain (red) and the forming otic placode (white). White arrowheads indicate neurog1 expression. (B) Photoconversion of NLS-Eos stained nuclei at 13 hpf in a region anterior to the epithelium in TgBAC(neurog1:DsRedE)n16 embryos expressing memb-GFP. At 20 hpf photoconverted nuclei were observed in neurog1+ cells inside the vesicle (arrowhead). (C) GFP reporting neurod1 expression in the non-ingressing pool of cells at 18 hpf (in the SAG region) from Tg(neurod:GFP) embryos (blue bracket). Embryos are also TgBAC(neurog1:DsRedE)n16 and express memb-GFP. (D) Early stages of otic epithelialisation. Dashed line indicates the epithelialised part of the otic vesicle. Membranes are stained with memb-GFP. (E) Laminin staining at 14 and 22 hpf in transversal and coronal sections. Nuclei are counterstained with DAPI. White arrowheads indicate the forming otic placode. (F) 3D reconstruction (dorsal view) of an otic vesicle and its anterior region at 14 hpf from a Tg(actb1:Lifect-GFP) embryo. The white arrowheads indicate the actin layer that divides latero-medially the tissues lateral to the hindbrain in two regions (white and yellow asterisks, see also reslice 1). Reslices, built from the white bars 1 and 2 shown in the 3D reconstruction, show transversal sections anterior (reslice 1) or at the position (reslice 2) of the otic placode (dashed line). h: hindbrain (dotted line). (G) Cell ingression evaluated using NLS-Eos photoconversion at 13 hpf in neurog1hi1059 mutant embryos injected at 1 cell stage with memb-GFP and NLS-Eos mRNAs. White arrowheads indicate ingressed cells at 18 hpf. See also Figure 2H for a scheme of the morphological features described in this figure. Scale bars, 20 µm. Dotted lines in (A–C) outline the limits of the otic epithelium/vesicle.
Figure 3 with 1 supplement
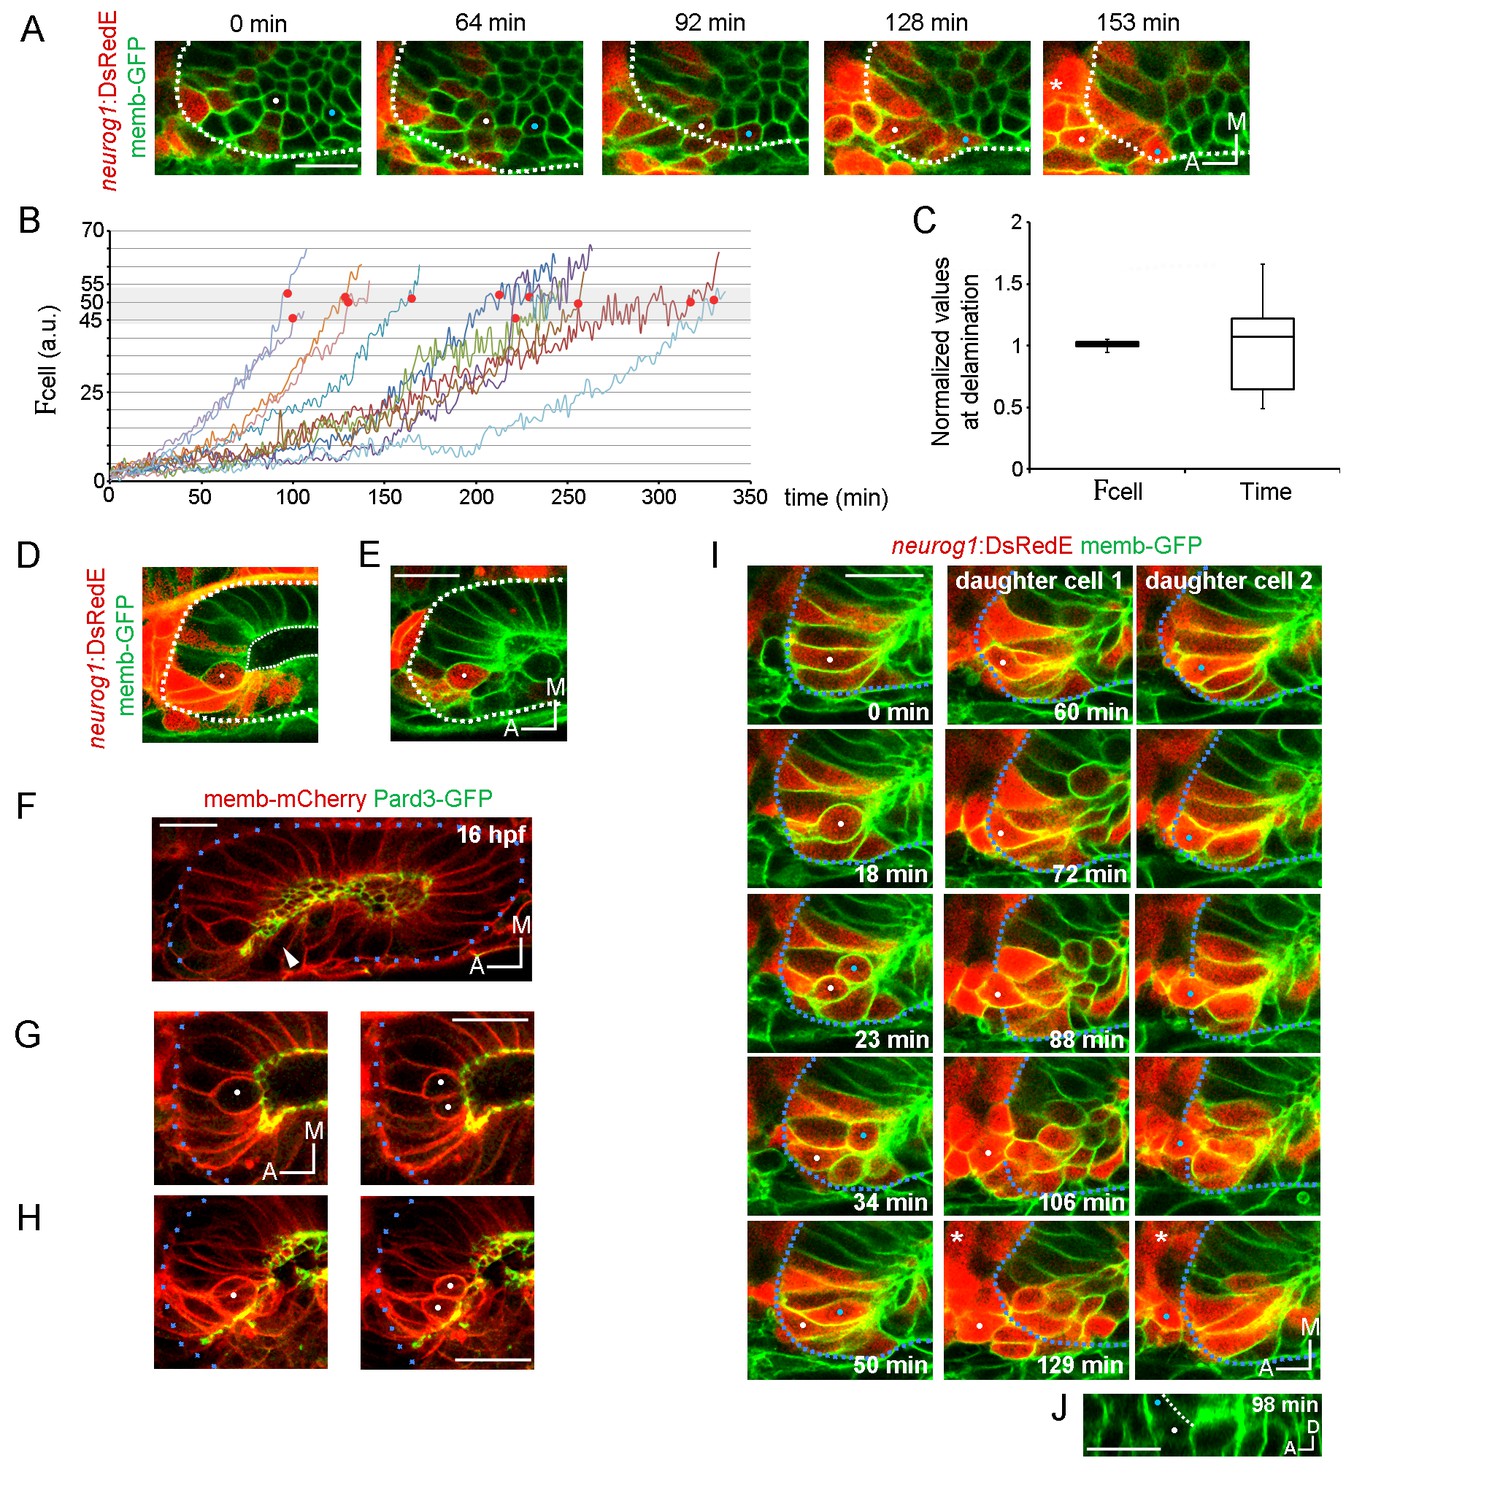
Local specification and divisions of neurog1 expressing cells.
(A) Selected planes showing DsRedE expression dynamics in locally specified cells (white and blue dots) from TgBAC(neurog1:DsRedE)n16 embryos expressing memb-GFP. Asterisk indicates the SAG. The embryo is 16.5 hpf at the beginning of the time-lapse. (B) Quantification of DsRedE fluorescence over time for 11 cells locally inducing neurog1. Red dots indicate beginning of delamination. The gray region highlights the interval of fluorescence levels at which all cells delaminate. (C) Box plot made from the quantifications shown in (B), illustrating that at the moment of delamination, the time elapsed from the initiation of neurog1 expression is highly variable, while the expression levels are not. The value for each cell was normalized by the mean of the cell group. (D,E) neurog1+ mitotic cells (white dots) contacting (D) or not (E) the central lumen (dashed line). 19 (D) and 17 (E) hpf embryos are shown. (F) Pard3-GFP localisation in the central lumen and the anterolateral region (white arrowhead). Membranes are stained with memb-mCherry. (G,H) Divisions (white dots) located in the lumen (G) or the apical scaffold (H, z-projection). 20 (G) and 18 hpf (H) embryos are shown. (I) Selected planes from a 3D time-lapse of a neurog1+ mitosis. White and blue dots track the daughter cells. Dashed lines indicate the approximated limit of the vesicle. Selected planes for each daughter cell are shown from 60 min onwards. At 129 min cells are delaminated. Asterisk indicates the SAG. The embryo is 18 hpf at the beginning of the time-lapse. (J) Reslice of a frame at 98 min from the video shown in (H) showing the z proximity between the tracked daughter cells during delamination (the red signal was removed for better visualisation). Scale bars, 20 µm. Dotted lines outline the limits of the otic vesicle.
Figure 3—figure supplement 1
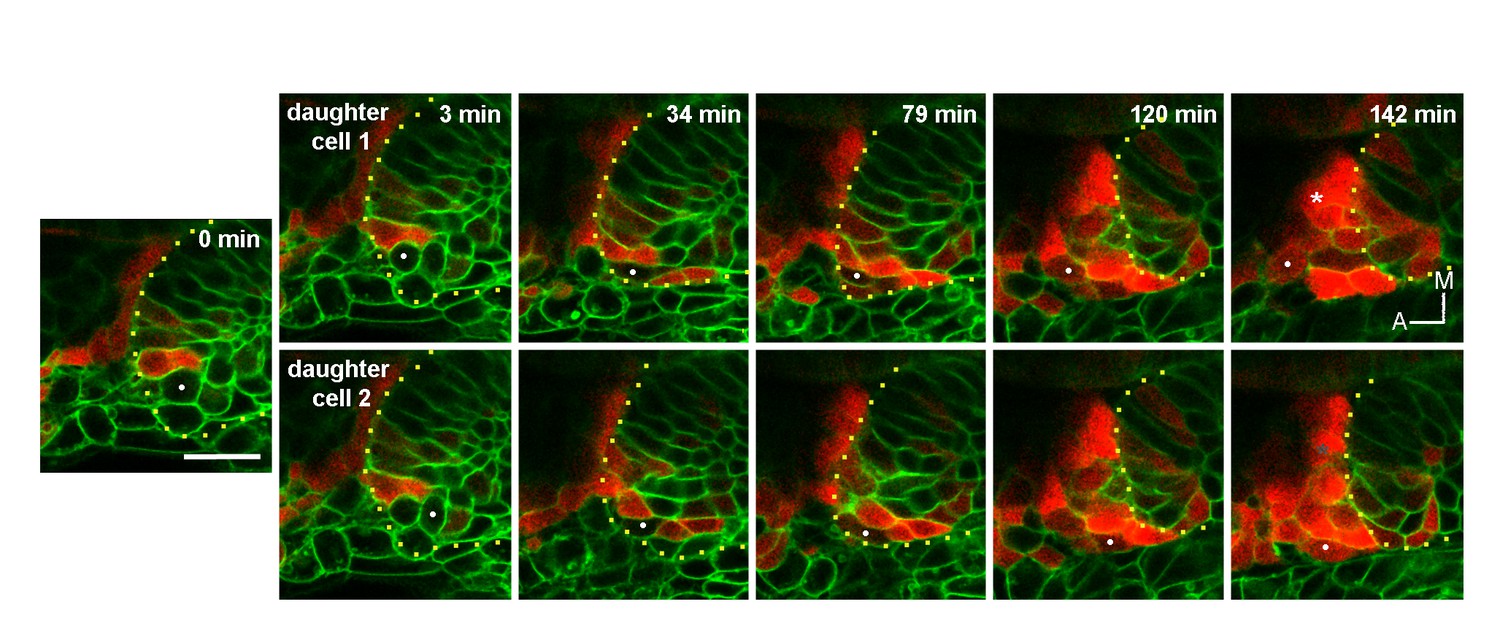
Cell division can precede neurog1 expression.
3D tracking of a neurog1− cell (white dot) that divides and subsequently their daughters express DsRedE and delaminate. Dotted lines outline the limits of the otic vesicle. Asterisk indicates the SAG.
Figure 4 with 2 supplements
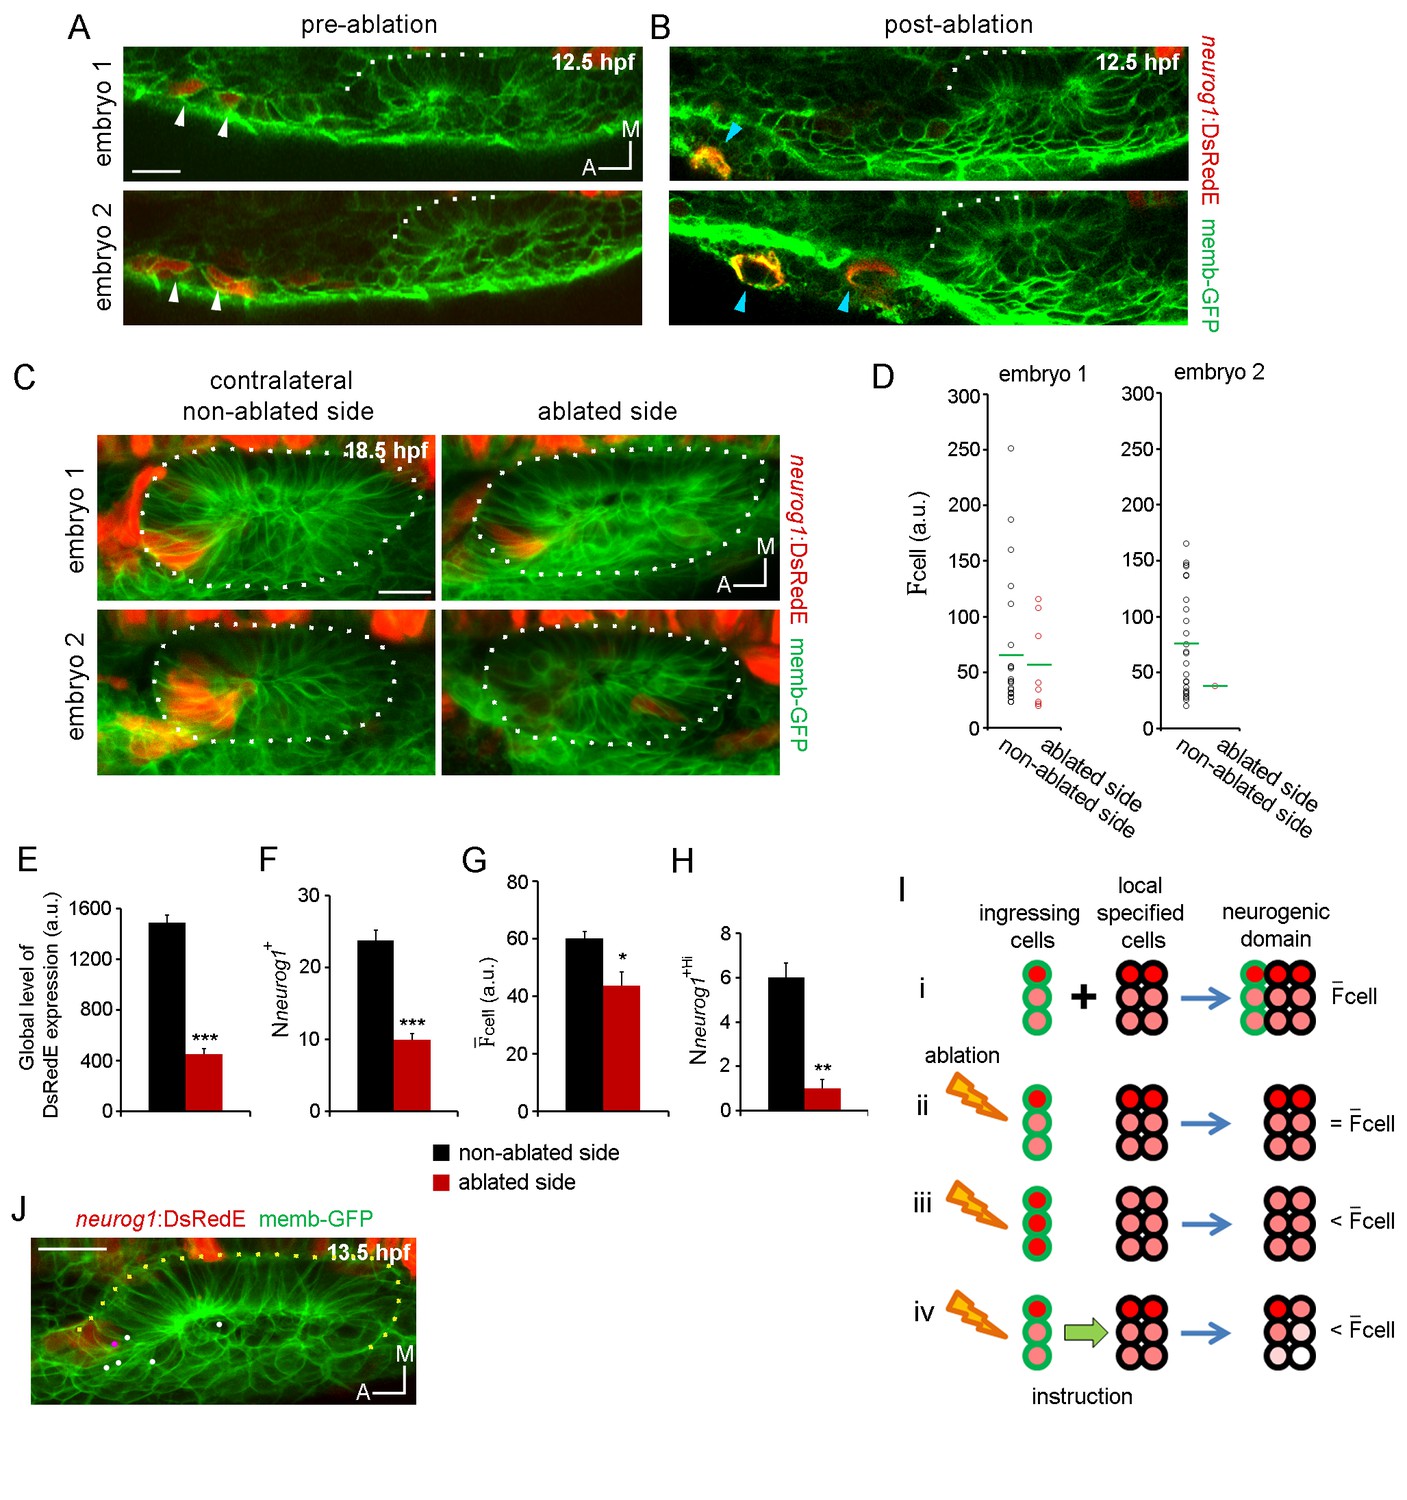
Ingressing cells instruct local neuronal specification.
(A,B) Laser ablation of neurog1+ cells before ingression. Two different embryos are shown. Images of the otic epithelium and its anterior region at 12.5 hpf just before (A) and after (B) laser-ablation. White arrowheads indicate neurog1+ cells. Blue arrowheads localise the ablated region. Embryo 1 only received one laser pulse and embryo 2 three laser pulses (only two are visible in this plane). The contrast of the red signal was increased to improve visualisation. (C–H) neurog1 expression pattern inside the vesicle after ablation. (C) Average z-projections of embryos shown in (A,B) 5 hr after ablation (18.5 hpf). The ablated side and their contralateral non-ablated side of the same embryo are shown. (D) Quantification of cell in each neurog1+ cell of the vesicles shown in (C). Each dot indicates one cell. Green lines indicate the mean of each condition. The number of neurog1+ cells in each vesicle is: embryo 1, non-ablated side: 24, ablated side: 8; embryo 2, non-ablated side: 25, ablated side: 2. (E–H) Parameters of neuronal specification at the single cell level are shown: global level of DsRed expression (E) Nneurog1+ (F), cell (G), and Nneurog1+Hi (H). Data are mean ± s.e.m. (n = 6). t-test ***p<0.0001, **p<0.0005, *p<0.05. (I) Scheme with of different explanations of how early ablation of ingressing cells influences cell inside the vesicle at later stages. (i) In absence of cell ablation the neurogenic domain is composed by ingressing and local specified cells, with a characteristic value for cell. (ii) If the distribution of cells with high and low fluorescence levels is equal between the ingressing and the local specified cells, ablation of ingressing cells does not change the cell. Thus, this possibility does not explain the observed decrease in cell after ablation. (iii) If the neurog1+Hi cells are mainly ingressing cells, ablation of these cells reduces the cell. However, Figure 4J shows that neurog1+Hi cells are mainly resident cells of the epithelium. (iv) If an instruction from the ingressing cells to the local specified cells is present, ablation of the ingressing cells decreases the cell. The intensity of red depicts the DsRedE level of expression in each cell. (J) Dots show the location at 13.5 hpf of backtracked cells corresponding to neurog1+Hi cells at 19 hpf in a non-ablated embryo. Pink dot: neurog1+ ingressed cell. White dots: neurog1- cells. The 3D reconstruction of the placode shown is representative of two different analysed embryos. All embryos are TgBAC(neurog1:DsRedE)n16 and membranes are stained with memb-GFP. Scale bars, 20 µm. Dotted lines outline the limits of the otic vesicle.
Figure 4—figure supplement 1
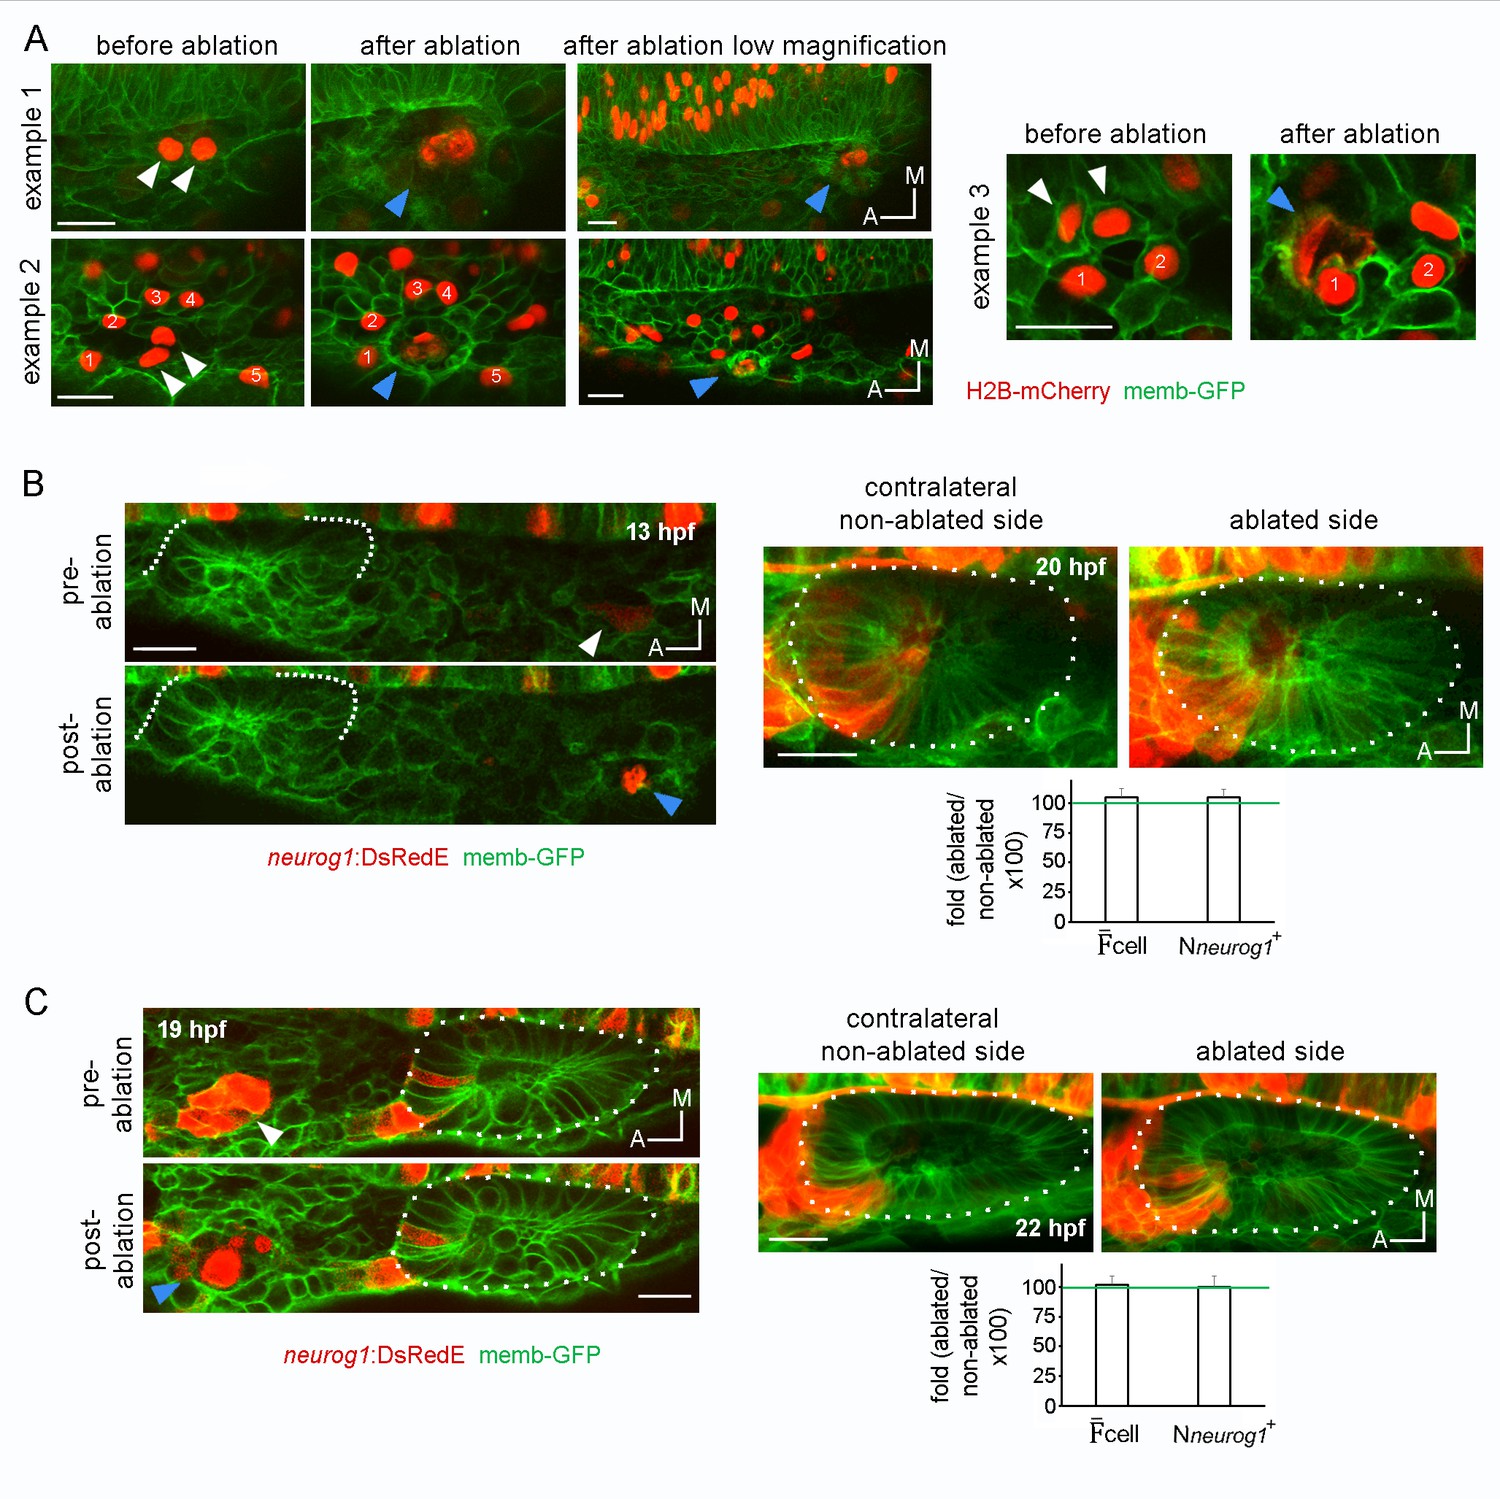
Calibration and specificity of ablation experiments.
(A) Calibration of cell ablations. A laser pulse (as described in Materials and methods) was applied to embryos expressing H2B-mCherry in a mosaic manner lateral to the neural tube. In example 1, two nuclei were stained in the imaged region before ablation (white arrowheads). After the laser pulse, a red ablation bubble was observed as consequence of the death of the two stained cells (blue arrowhead). In example 2, the nuclei of neighbouring cells (numbered from 1 to 5) are surrounding two target cells (white arrowheads). Imaging after ablation indicated that the targeted cells died, but the neighbouring cells remained healthy and only slightly displaced in space. In example 3, a similar behavior as in example two can be observed, but the intact neighbouring cells are in close contact with the dead cells, highlighting the fact that ablation is highly specific and restricted to the targeted cells (white arrowheads, see also Video 14). (B) and (C) Ablation at a posterior region or a late developmental stage. On the left, laser ablation of neurog1+ cells located posterior to the otic epithelium at 13 hpf (B) or anterior to the otic vesicle at 19 hpf (C). White arrowheads indicate neurog1+ cells. Blue arrowheads localise the ablated region. The embryos received one laser pulse. On the right, z-projection images of neurog1 expression pattern inside vesicles at 20 (B) or (22) hpf from the ablated and contralateral non-ablated sides of the embryo are shown. Quantifications of the cell and the Nneurog1+ are shown as the fold change of ablated/non-ablated sidesx100 (n = 5 in (B) and n = 7 in (C)). Data are mean ± s.e.m. Scale bars, 20 µm. Dotted lines outline the limits of the otic epithelium/vesicle.
Figure 4—figure supplement 2
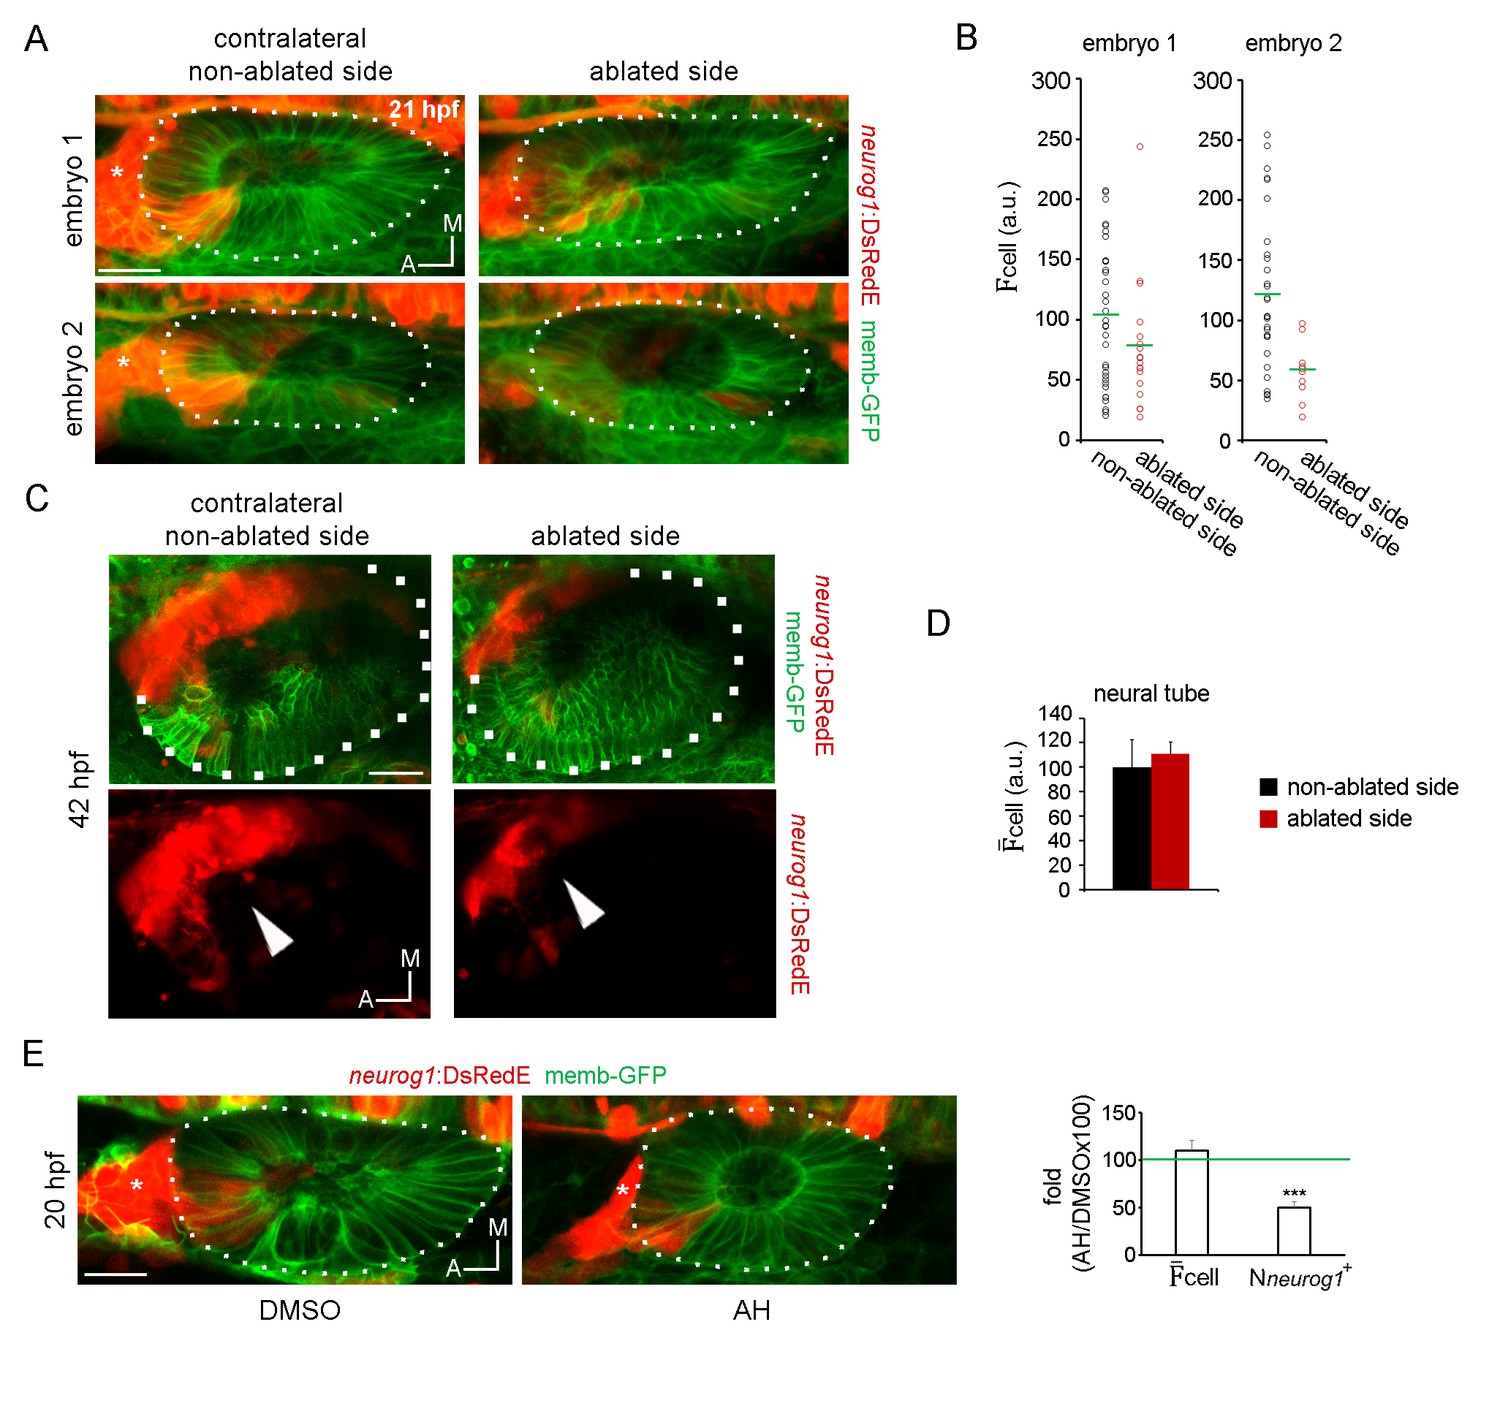
Late neurogenic phenotypes after ablation and specification analysis of non-proliferative otic placodes.
(A) Z-projection images of the embryos shown in Figure 4, A and B, 8 hr after ablation (21 hpf). The ablated side and their contralateral non-ablated side of the same embryo are shown (images are representative of the phenotypes observed in 4 embryos at this stage, see also Video 12). Asterisk indicates the SAG. (B) Quantification of the mean DsRedE fluorescence in each neurog1+ cell of the vesicles shown in (A). Each dot indicates one cell. Green lines indicate the mean of each condition. (C) Z-projection images of otic vesicles and the SAG at 42 hpf from an neurog1-DsRedE embryo ablated at 13 hpf (the ablated side and their contralateral non-ablated side of the same embryo are shown). Note the reduction in size of the SAG in the ablated size of the embryos. Images are representative of 3 embryos analysed. (D) Quantification of the cell in a region of the neural tube adjacent to the otic vesicle 5 hr after ablation (18 hpf). Data are mean ± s.e.m. (70 cells were counted in each region, n = 3). (E) Z-projection images of neurog1 expression pattern inside the vesicle at 20 hpf in DMSO and AH treated embryos. On the right, quantifications of the cell and the Nneurog1+ are shown as the fold change of the AH group respect to the DMSO group (n = 14 for DMSO and n = 12 for AH). Data are mean ± s.e.m. t-test, ***p<0.0001. Scale bars, 20 µm. Asterisk indicates the SAG. Dotted lines outline the limits of the otic vesicle.
Figure 5 with 1 supplement
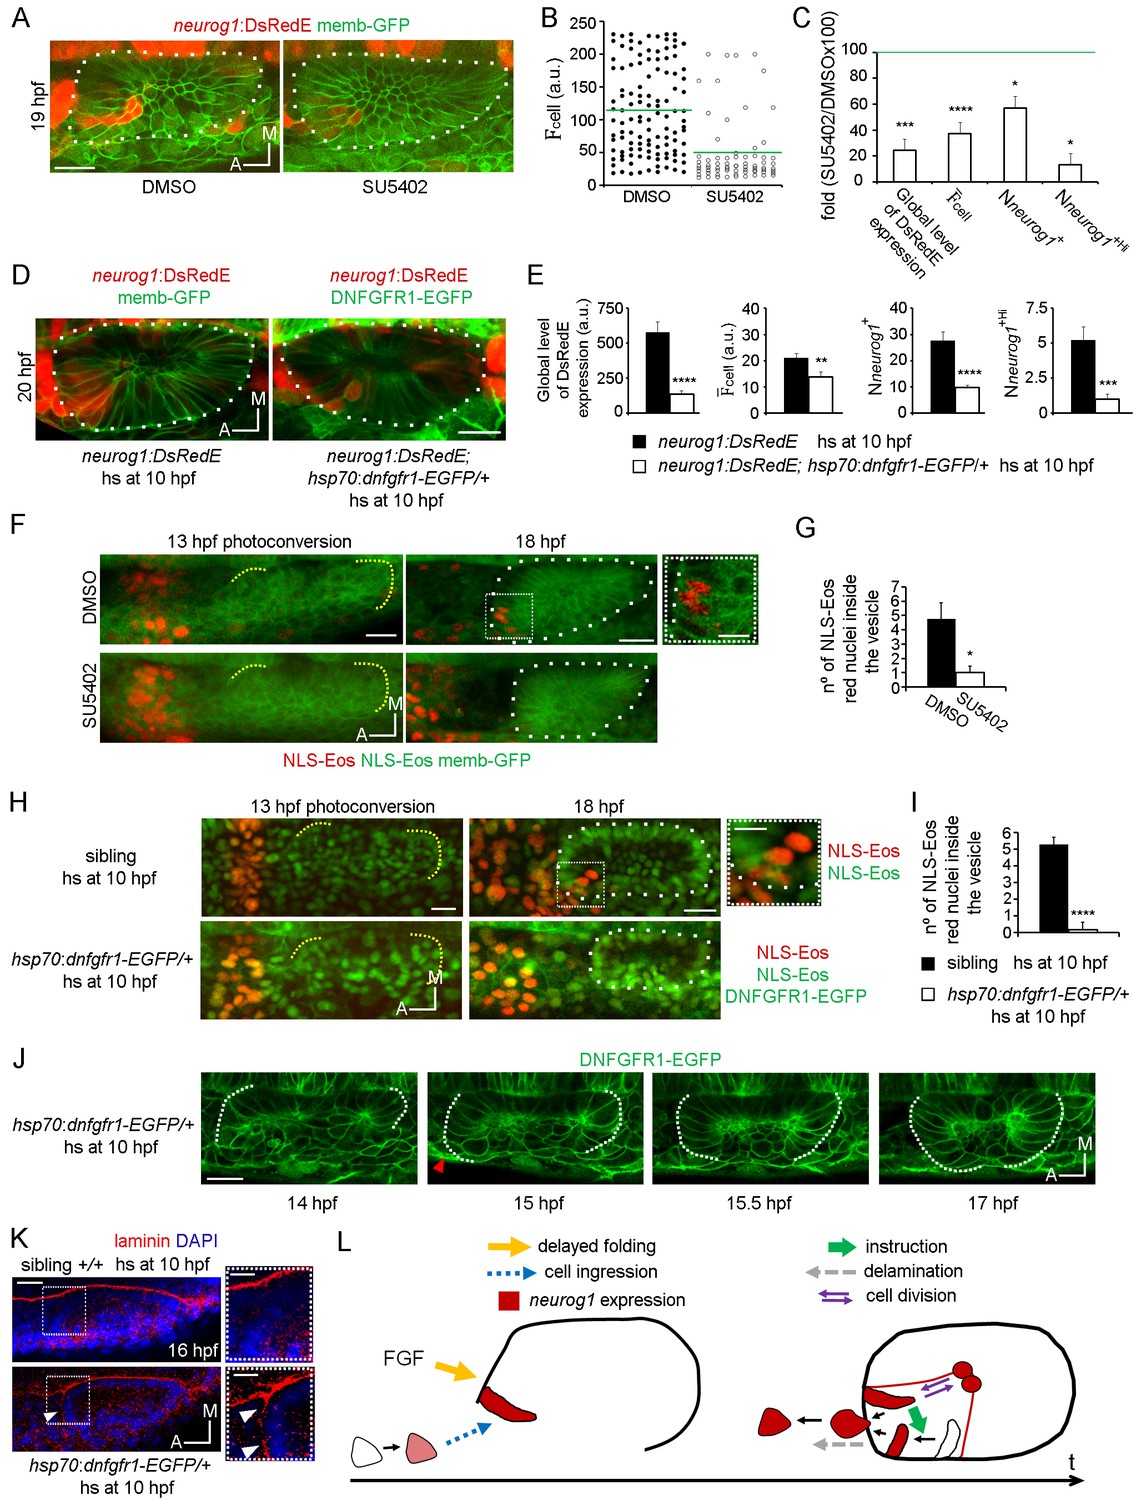
FGF control of neuronal specification.
(A–C) neurog1 expression pattern inside the vesicle in embryos incubated in DMSO or SU5402. (A) Images of otic vesicles at 19 hpf incubated from 11 hpf in DMSO or SU5402 (ventral planes). (B) Quantification of cell for cells of vesicles from the groups shown in (A). Each dot indicates one cell. Green lines indicate the mean of each condition. n = 5 for DMSO and n = 6 for SU5402. (C) Parameters of neuronal specification at the single cell level for the data shown in (B): global level of DsRed expression, cell, Nneurog1+ and Nneurog1+Hi are shown as fold change of SU5402/DMSOx100. (D,E) neurog1 expression pattern inside the vesicle from neurog1:DsRedE;hsp70:dnfgfr1-EGFP/+ or neurog1:DsRedE embryos heat-shocked at 10 hpf. (D) Z-projections of otic vesicles at 20 hpf. (E) Parameters of neuronal specification are shown: global level of DsRed expression, cell, Nneurog1+ and Nneurog1+Hi (n = 8). (F) Photoconversion at 13 hpf of NLS-Eos stained nuclei in a region anterior to the otic epithelium. Embryos expressed memb-GFP and were treated with DMSO or SU5402 from 11 hpf (z-projections). At 18 hpf, photoconverted nuclei is observed inside the vesicle of the DMSO treated embryo. High magnification in the right (dotted square, Scale bar 10 µm). Yellow dotted lines indicate the limits of the otic epithelium. (G) Quantification of the number of photoconverted nuclei inside the vesicle (n = 6 for DMSO and n = 7 for SU5402). (H,I) Photoconversion experiments as in (F,G) but on hsp70:dnfgfr1-EGFP/+ and sibling embryos heat-shocked at 10 hpf. (H) Z-projections of the photoconversion and cell ingression. (I) Quantification of the number of photoconverted nuclei inside the vesicle (n = 7 for siblings and n = 6 for hsp70:dnfgfr1-EGFP/+). (J) Selected images from a time-lapse of hsp70:dnfgfr1-EGFP/+ embryos heat-shocked at 10 hpf. Note that as early as 14 hpf the anterior part of the otic tissue is already folding, at 15 hpf the process is advanced (red arrowhead), and at 15.5 hpf the anterior and posterior regions seem to be symmetrically folded (see also Video 13). (K) Laminin immunostainings at 16 hpf in hsp70:dnfgfr1-EGFP/+ and sibling embryos heat-shocked at 10 hpf. The nuclei were counterstained with DAPI. High magnification in the right (dotted square, Scale bar 10 µm). The images are representative of 6 embryos analysed. Note the formation of a continuous layer of laminin in some regions (white arrowheads). (L) Scheme of cell dynamics playing a role in neuronal patterning of the inner ear. FGF signalling delays anterior tissue folding allowing the ingression of pioneer neurog1+ cells in the prospective neurogenic domain of the otic epithelium. These pioneer cells promote neurog1 expression in other cells of the neurogenic domain. In addition, neurog1+ cells divide symmetrically and delaminate. Data are mean ± s.e.m. t-test ****p<0.001, ***p<0.005, **p<0.01, *p<0.05. Scale bars, 20 µm. White dotted lines outline the limits of the otic vesicle.
Figure 5—figure supplement 1
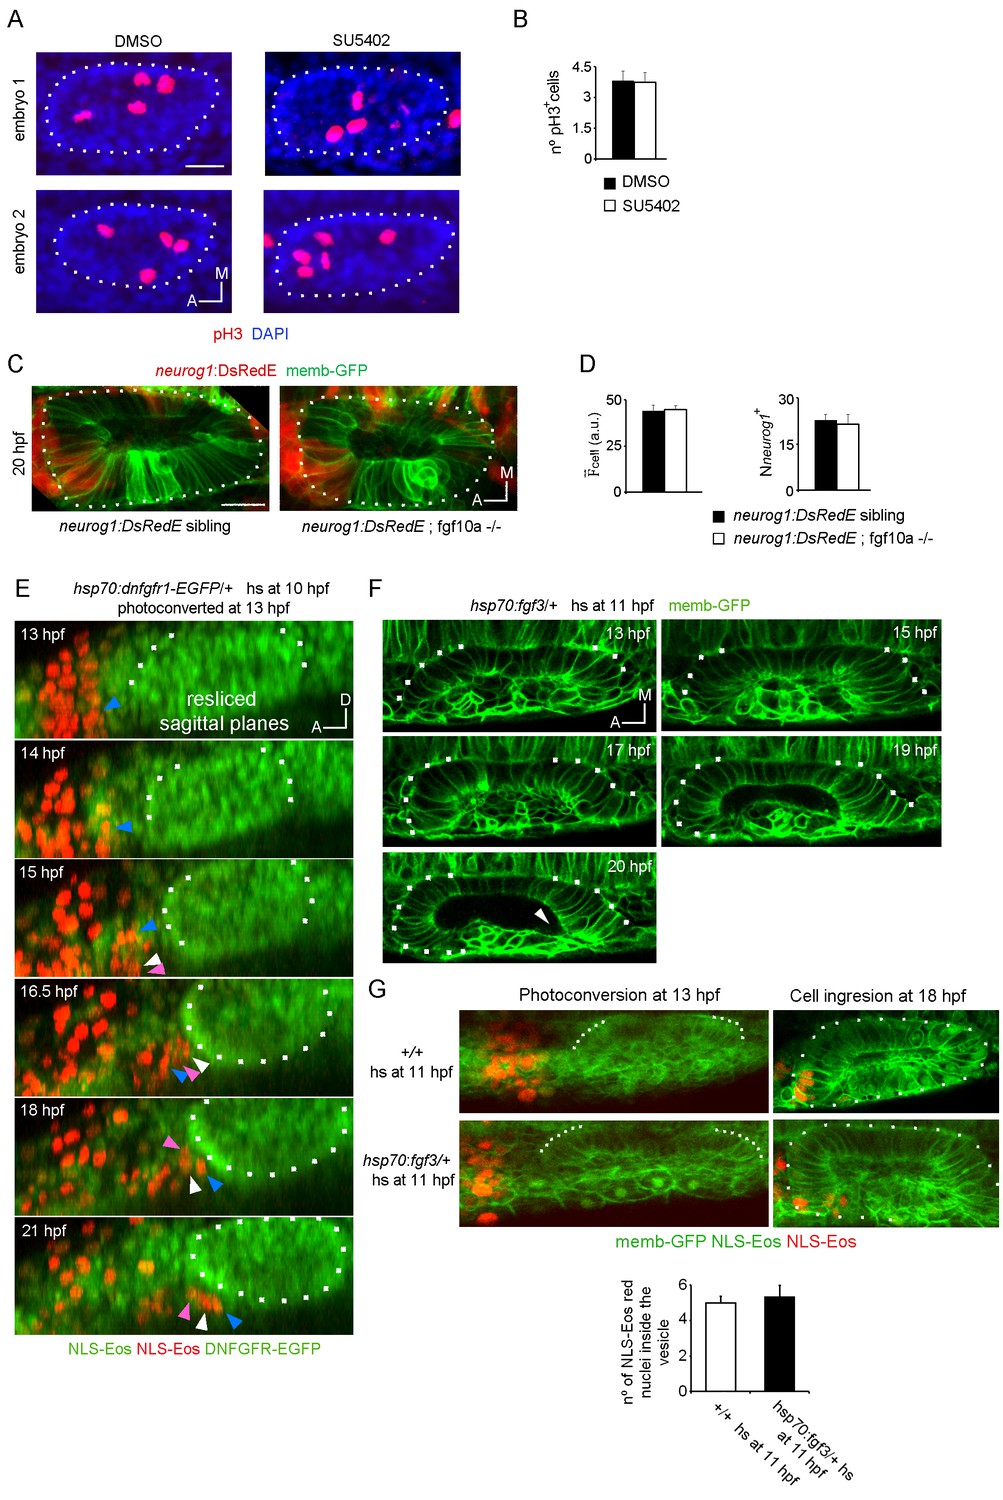
Analysis of cell division controlled by SU5402 and neurog1 expression in FGF10a mutant embryos.
(A) pH3 immunostainings at 16 hpf in otic vesicles from DMSO and SU5402 treated embryos. Two embryos in each experimental group are shown. The nuclei were counterstained with DAPI. (B) Quantification of the pH3 immunostainings (n = 12). (C) and (D) neurog1 expression pattern inside the vesicle in neurog1-DsRedE;fgf10a-/- or neurog1-DsRedE; sibling embryos. (C) Z-projection images of vesicles at 20 hpf. (D) Quantifications of the cell and the Nneurog1+ are shown (n = 10 for siblings and n = 5 for fgf10-/-). (E) 3D Tracking of photoconverted NLS-Eos nuclei in hsp70:dnfgfr1-EGFP/+ induced embryos. Z-projections of resliced sagittal sections are shown. Arrowheads indicate examples of tracked nuclei (each color correspond to a different cell). The cells indicated with white and pink arrowheads in the latter panels were not identified in the two first time points, due to their lateral movement out and in of the video during the posterior migration. (F and G) Tissue folding analysis (G) or cell ingression analysis by NLS-Eos photoconversion (F) during placode formation in FGF3 overexpressing embryos (heat-shock at 11 hpf of the Tg(hsp70:fgf3) line). In (F) the posterior region remains unfolded at late stages (20 hpf). Arrowhead: a deformation of the lumen is observed in the posterior region of the vesicle, which is found only anteriorly in wild type embryos associated with the unfolded tissue. Data are mean ± s.e.m. Scale bars, 20 µm. Dotted lines outline the limits of the otic vesicle.
Author response image 1
Author response image 2

Number of pH3+ cells at 16 hpf.
* p<0.001, t test. n=12 for neurog1hi1059/neurog1hi1059 and n=11 for neurog1hi1059/+.
Author response image 3
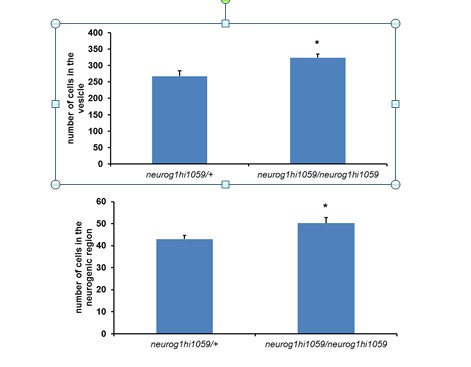
Number of cells in the otic vesicle (upper panel) or the neurogenic region (lower panel) at 18 hpf.
* p<0.05, t test. n=4 for neurog1hi1059/neurog1hi1059 and n=6 for neurog1hi1059/+.
Author response image 4
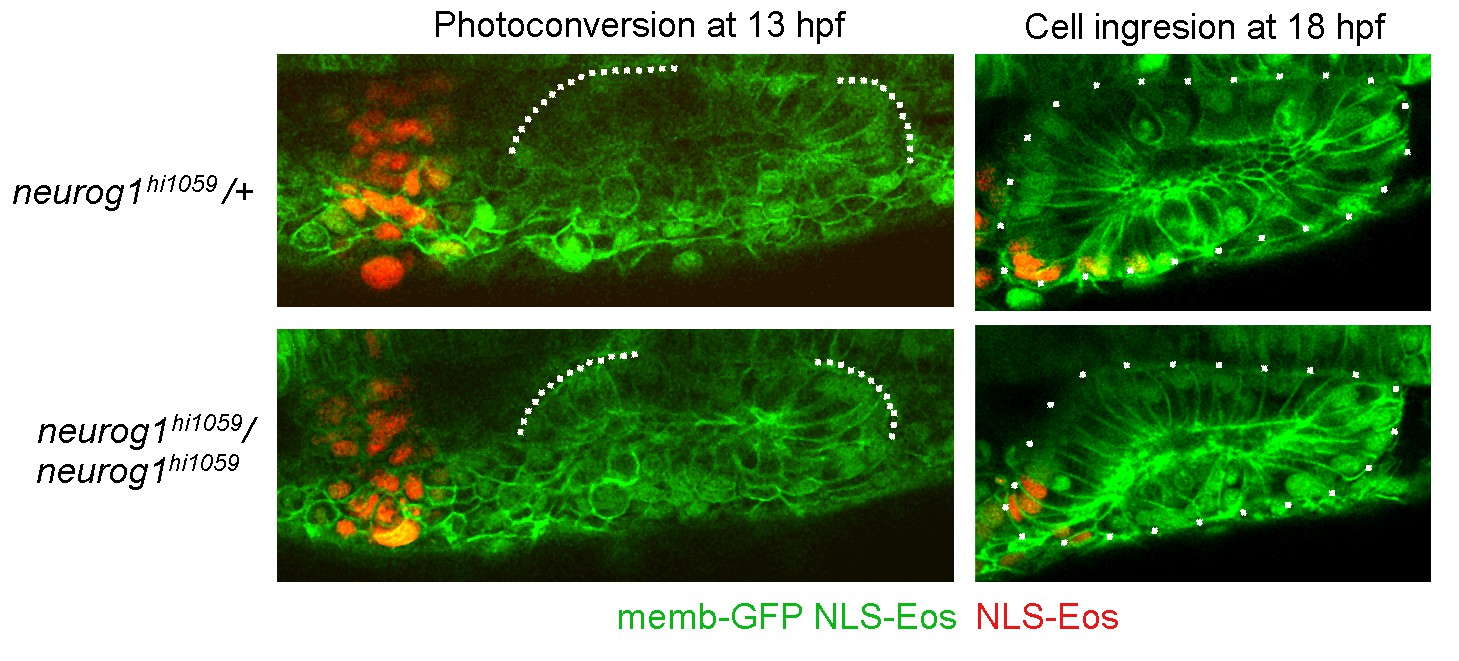
Cell ingression evaluated using NLS-Eos photoconversion in neurog1hi1059 mutant embryos.
The embryos were injected at 1 cell stage with memb-GFP and NLS-Eos mRNAs. For clarification, the genotype of the embryos was identified after imaging by PCR or phenotyping
Author response image 5
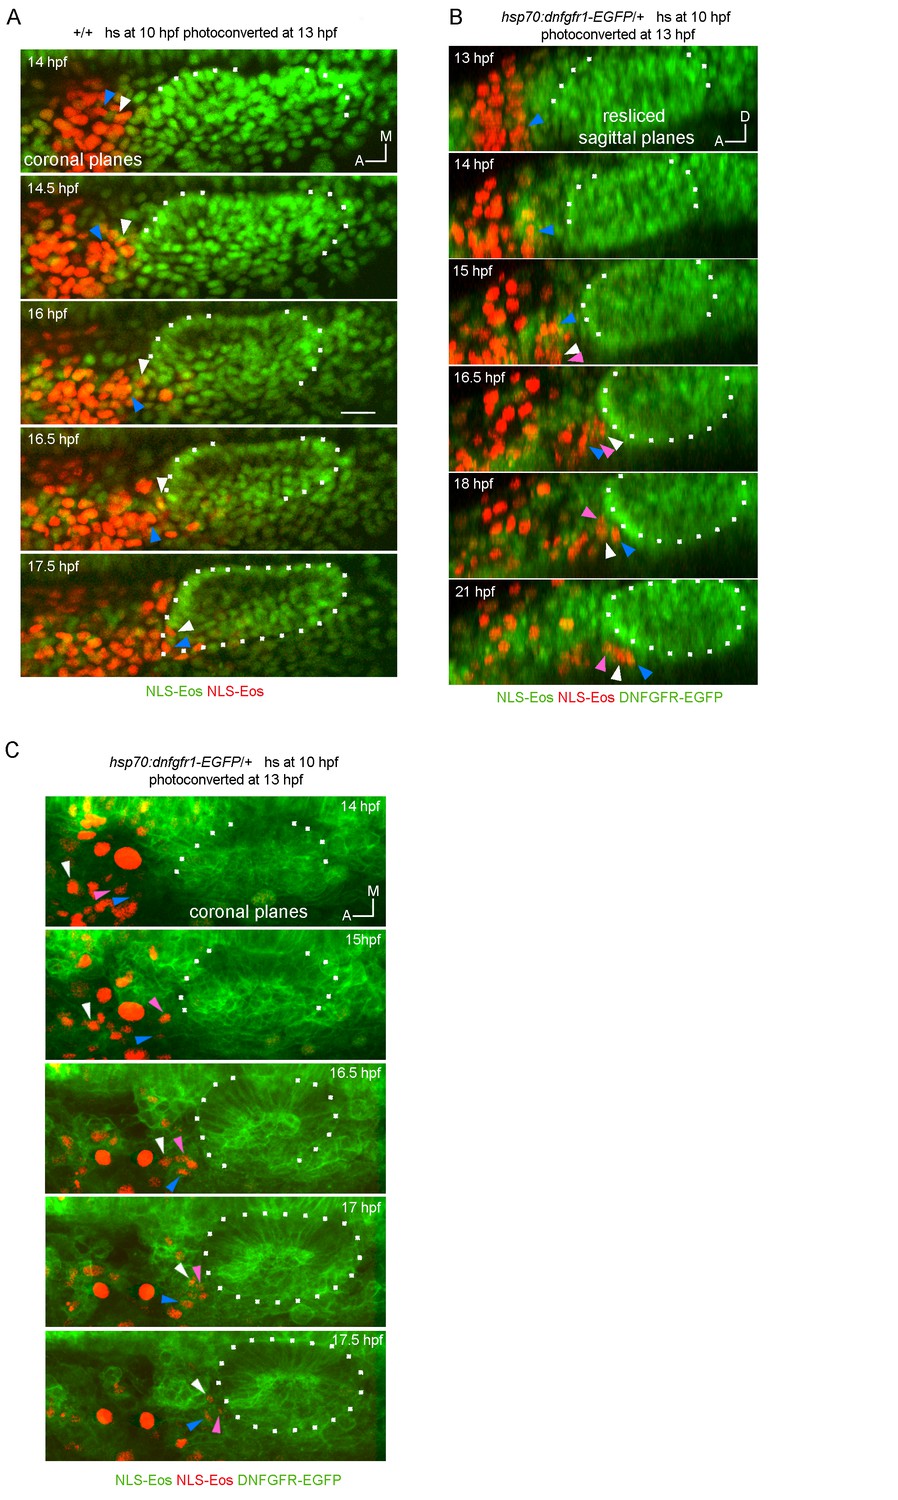
Tracking of photoconverted NLS-Eos nuclei in wild type (A) and hsp70:dnfgfr1-EGFP/+ embryos (B and C).
z-projections of coronal (A and C) or resliced sagittal (B) views are shown. These images were selected from 3D time lapses performed at 5 min time resolution, which allowed us to track individual cells over time. Arrowheads indicate examples of tracked nuclei (each color correspond to a different cell). In the two first time points of (B), it was not possible to track the cells indicated with white and pink arrowheads in the following time points, because they move laterally out and in of the video during their posterior migration.
Author response image 6
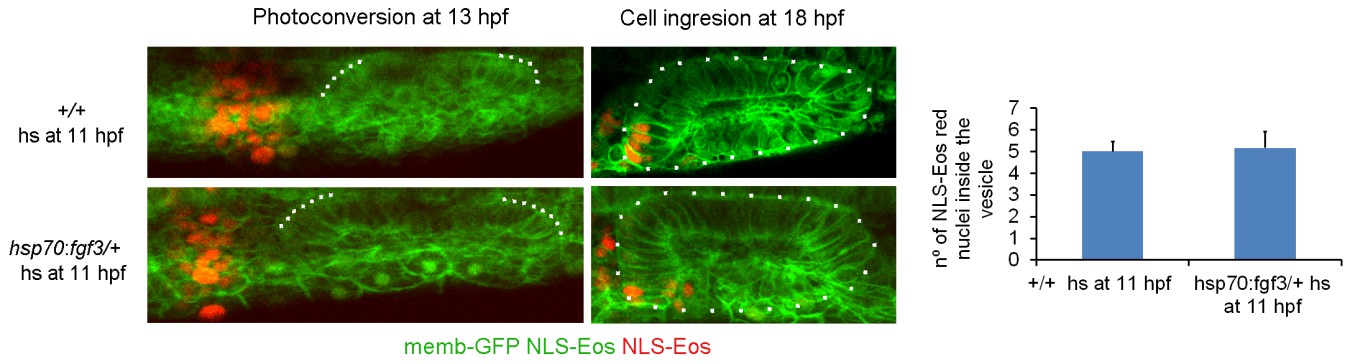
Cell ingression evaluated using NLS-Eos photoconversion in FGF3 overexpressing embryos.
FGF3 expression was induced with a heat shock by incubating the 11 hpf embryos for 30 min at 39 degrees. For this purpose, the Tg(hsp70:fgf3) line was used. The embryos were injected at 1 cell stage with memb-GFP and NLS-Eos mRNAs. The quantification of the ingressed cells is shown in the right panel (no significant differences were found between the two experimental groups, t test, n=5 for +/+ embryos and n=6 for Tg(hsp70:fgf3)/+ embryos).
Author response image 7
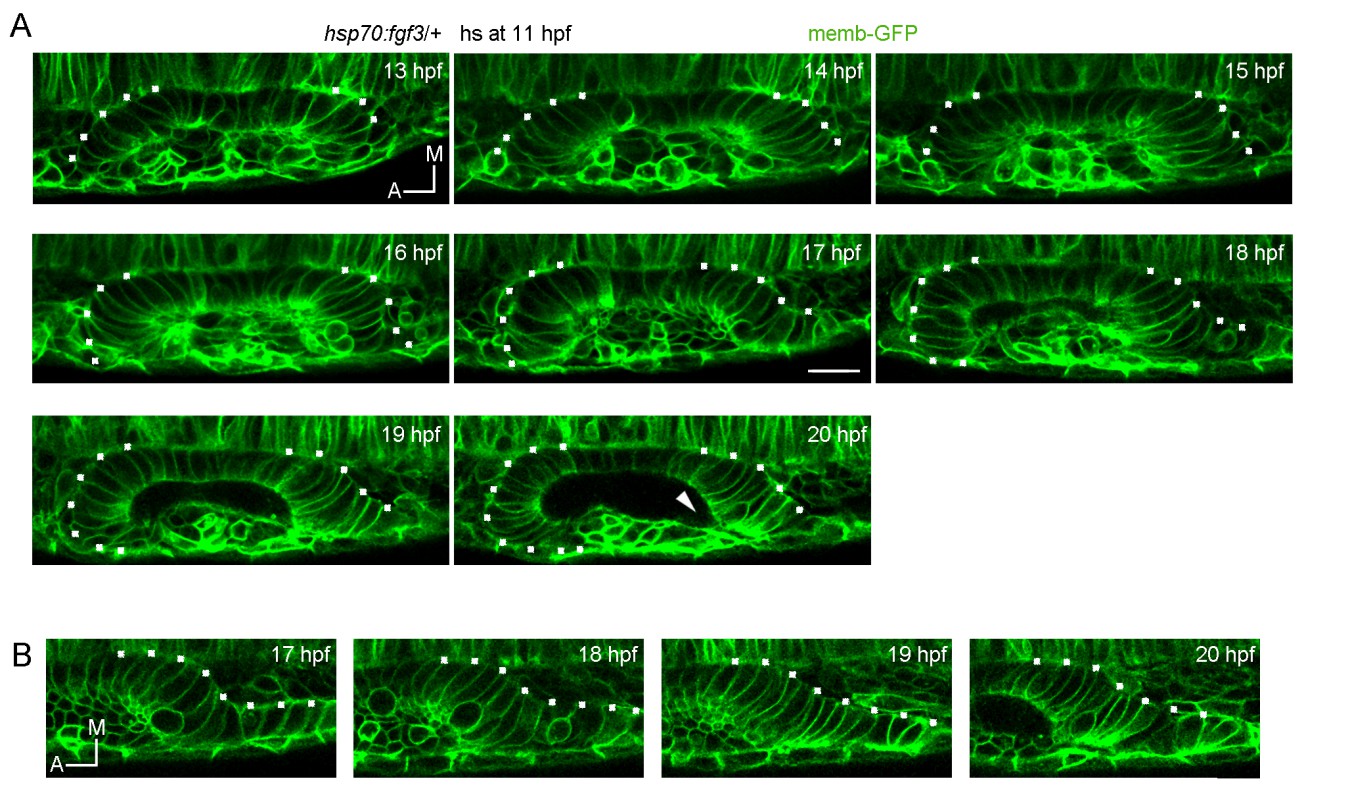
Analysis of tissue folding during placode formation in FGF3 overexpressing embryos.
FGF3 expression was induced with a heat shock by incubating the 11 hpf embryos for 30 min at 39 degrees. For this purpose, the Tg(hsp70:fgf3) line was used. The embryos were injected at 1 cell stage with memb-GFP. (A) Note that the anterior region folds before the posterior one, which remains incompletely folded at late stages (20hf). Arrowhead: a deformation of the lumen can be observed in the posterior region of the vesicle, which is found only anteriorly in wild type embryos and associated to the unfolded tissue. (B) Detail of the posterior unfolded tissue.
Author response image 8

Options 1 and 2 are two different situations that can be underlying the measurements of cell number and cell division.
A and B are the two regions of tissue to be compared. The circles are cells; the green circles indicate mitotic cells. In option 1, the tissue A has much less number of cells and mitosis than tissue B, but the proliferation rate (mitotic index, the probability of a cell to divide) is not different between the two tissues. In this case, the reduction in mitosis in A is just a consequence of a reduced number of cells in this tissue. In option 2, the tissue A has a few less cells than tissue B but much less mitotic events. Thus, A and B present a big difference in proliferation rate. It is possible to think that some signal stimulate proliferation in B. The observed difference in the number of mitosis is not a simple consequence of a different number of cells in the tissue, but of a different proliferative activity
Videos
Video 1
4D imaging of otic neuronal specification.
3D reconstructed time-lapse of the otic vesicle from a TgBAC(neurog1:DsRedE)n16 embryo. Red: DsRedE fluorescence. Green: memb-GFP. Dorsal view. Time from the first frame is indicated.
Video 2
Specification dynamics visualized in individual cells.
Selected coronal ventral planes from the z-stacks used for 3D reconstructions in Video 1.
Video 3
neurog1 expressing cells locate in the SAG after delamination.
3D reconstruction of the otic vesicle at 21 hpf. White arrow indicates the position of the SAG.
Video 4
Early neurog1 expressing cells located anterior to the otic vesicle. 3D reconstruction of an otic vesicle and the anterior region at 13 hpf, showing the presence of DsRedE expressing cells (white arrows).
https://doi.org/10.7554/eLife.25543.009
Video 5
neurog1 expressing cells ingress in the otic epithelium.
3D reconstructed time-lapse showing the ingression of neurog1 expressing cells. Orange arrowheads indicate ingressing cells and white arrowheads cells that are outside the organ. Cells that will ingress are highlighted with a red bracket and the direction of movement by a red arrow. The group of neurog1 expressing cells that do not ingress is indicated by a blue bracket and arrow.
Video 6
3D tracking of an individual cell during ingression, division and delamination.
Coronal ventral planes from z-stacks selected to track an ingressing cell (white dot). Note that it begins to express neurog1 before epithelialization.
Video 7
3D tracking of multiple cells during ingression.
Initially, the position of three cells anterior to the otic epithelium is shown (white, pink and blue dots). Tracking (upper panels) and 2D trajectory of each cell (lower panel, yellow track shows the position of the posterior vertex of the placode) are depicted. Insets highlight the mode of migration, with leading edge of the cell protruding (white arrowheads) before the forward displacement of the nucleus (yellow arrowheads).
Video 8
Detailed view of the morphogenesis of the otic placode.
Time-lapse of memb-GFP expressing embryos showing the different stages of tissue epithelialisation. Note that the posterior region folds before the anterior one (orange arrowhead highlights the unfolded anterior region). Lines indicate the epithelialised regions.
Video 9
Real-time activation of neurog1 expression in local specified cells.
Coronal ventral planes from z-stacks selected to follow the beginning of DsRedE expression in two individual cells that are being specified locally (white and blue dots). Insets show higher magnification images.
Video 10
Apical scaffold formation dynamics.
3D reconstructed time-lapse of Pard3-GFP (gray) localization during otic morphogenesis (dorsal view). Pard3-GFP in the otic vesicle (green arrows) or in the superficial external superficial (orange arrows) is shown. The anterolateral apical scaffold forms early during placode development and is transitory.
Video 11
Coordinated and quick delamination after division of neurog1 expressing cells.
Coordinated delamination: in the upper panel, coronal planes tracking an individual cell before division (white dot) and their daughters after division and until delamination (white and blue dots) are shown. In the lower panel, 2D movement of the tracked cells is shown. Note the coordinated behaviour of daughter cells moving in close contact to the periphery of the tissue and delaminating simultaneously. Quick delamination after division: tracking of other cell including sagittal planes in the lower panel. Only one daughter is tracked (white dot). White lines indicate the limits of the vesicle.
Video 12
Ablation of pioneer cells before ingression affects neurog1 expression in the neurogenic domain at later stages.
3D reconstruction: DsRedE signal in the neurogenic domain (red) of otic vesicles at 21 hpf corresponding to the previously ablated and contralateral non-ablated sides of the same embryo. A single plane of the memb-GFP signal from each vesicle is shown for better 3D orientation (green). The DsRedE fluorescence coming from cells outside the otic vesicle was removed with FIJI to improve the visualisation of the phenotype inside the vesicle. z-stack: sequence of coronal planes from dorsal to ventral of neurog1 expression in the otic vesicle at 21 hpf in ablated and contralateral non-ablated sides of the embryo. The DsRedE expression levels can be visualised in single cells (quantifications of specification phenotypes were performed on this type of z-stacks).
Video 13
Synchronous folding of the anterior and posterior regions of the otic placode in dnfgfr1-EGPF expressing embryos.
Time-lapse during placode morphogenesis in Tg(dnfgfr1-EGFP) embryos heat-shocked at 10 hpf. Lines indicate the epithelial folding.
Video 14
Calibration of cell ablation.
3D reconstruction of z-stacks acquired before and after ablation of embryos expressing H2B-mCherry in some cells adjacent to the neural tube. The neighbouring cells remain undamaged after ablation of the targeted cells (white arrowhead). The damage is indicated by the blue arrowhead. The embryos also express globally memb-GFP.
Download links
A two-part list of links to download the article, or parts of the article, in various formats.
Downloads (link to download the article as PDF)
Open citations (links to open the citations from this article in various online reference manager services)
Cite this article (links to download the citations from this article in formats compatible with various reference manager tools)
Pioneer neurog1 expressing cells ingress into the otic epithelium and instruct neuronal specification
eLife 6:e25543.
https://doi.org/10.7554/eLife.25543


