Energy imbalance alters Ca2+ handling and excitability of POMC neurons
- University of Cologne, Germany
- MAP5 - Mathématiques Appliquées à Paris 5, CNRS UMR 8145, France
- University Hospital of Cologne, Germany
- Max Planck Institute for Metabolism Research, Germany
Figures
Figure 1
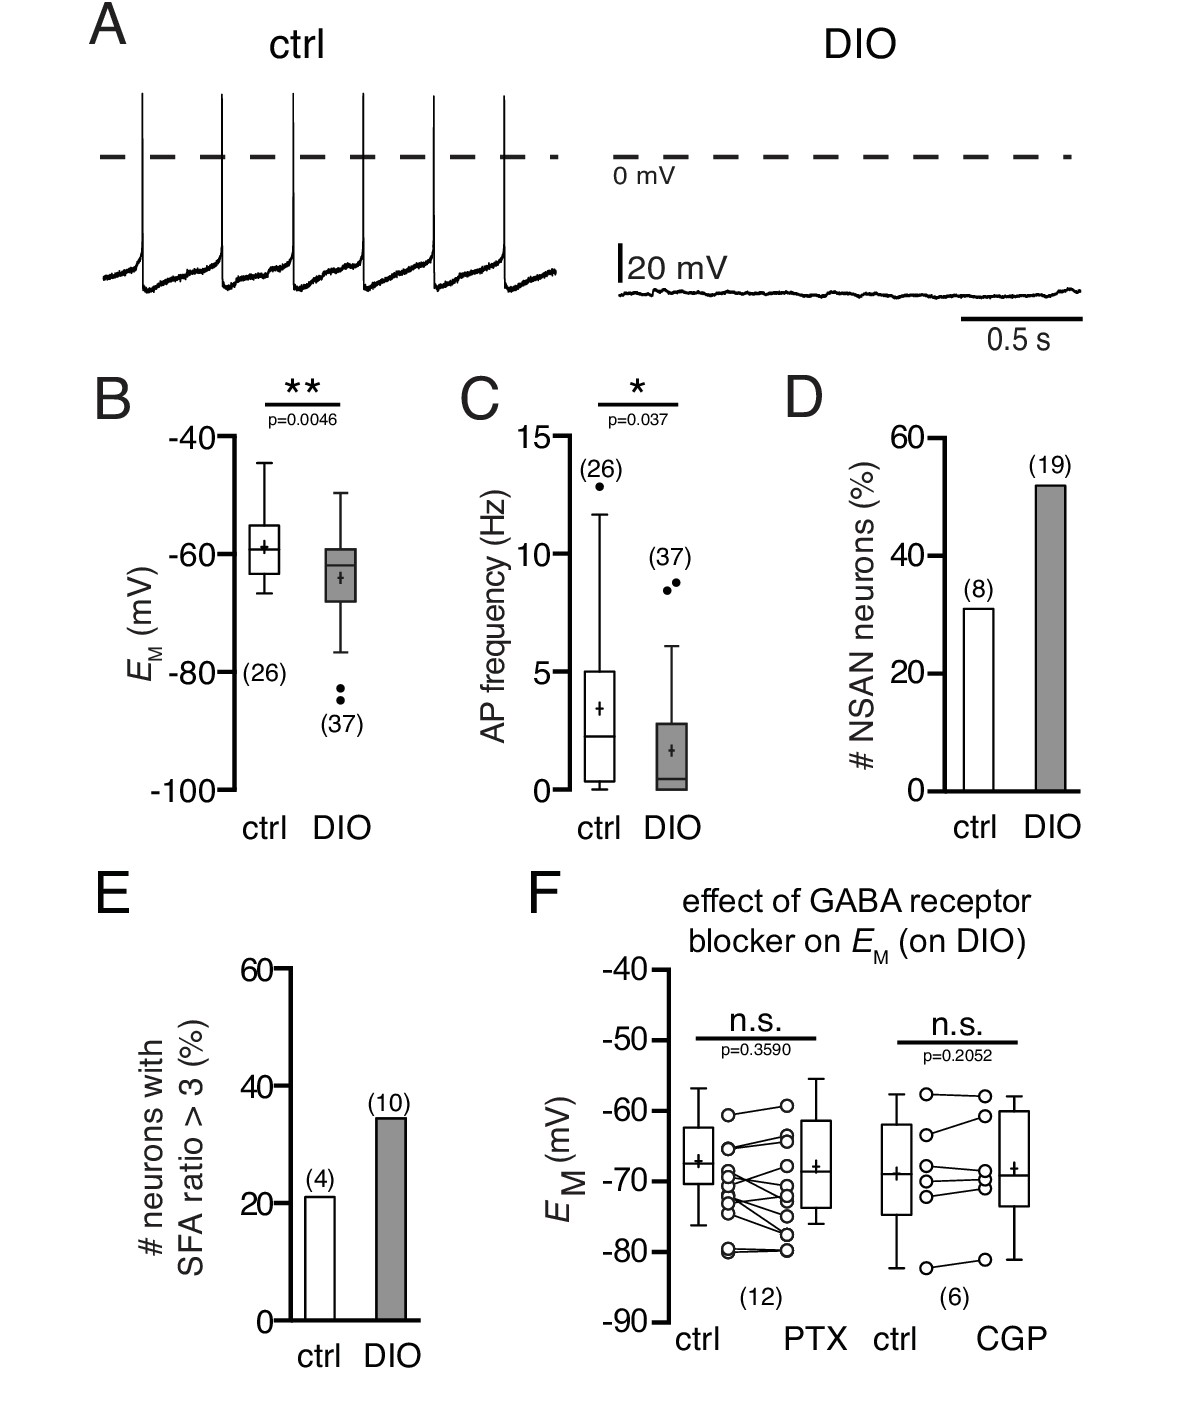
Diet-induced obesity decreases the spontaneous activity and hyperpolarizes the membrane potential of POMC neurons.
Recordings were performed in the perforated patch-clamp configuration from eGFP expressing POMC neurons in the arcuate nucleus. (A) Original recordings of POMC neurons of mice on NCD and in DIO. (B and C) POMC neurons of DIO mice were hyperpolarized (B) and their action potential frequency was decreased (C) (Mann-Whitney test). (D and E) The percentage of silent (F < 0.5 Hz) POMC neurons (D) and the percentage of POMC neurons with strong SFA (SFA ratio >3 Hz) (E) was higher in DIO mice compared to controls. (F) The GABAA receptor blocker PTX and the GABAB receptor blocker CGP54626 did not restore the membrane potential of DIO mice to control (paired t-test). SFA, spike frequency adaptation. **p<0.01, ***p<0.001.
Figure 2
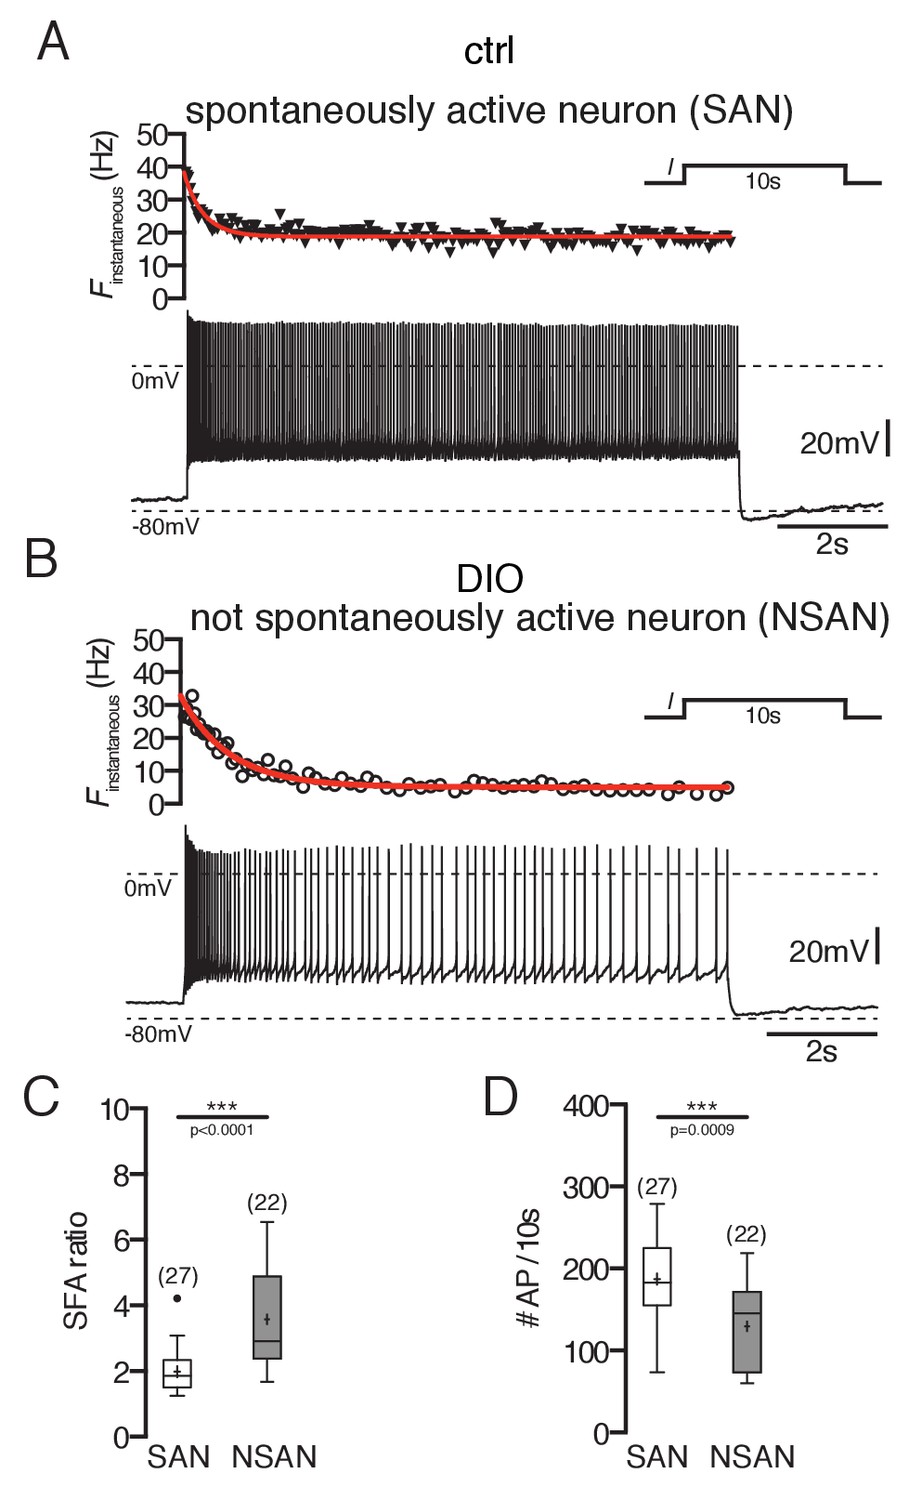
Spike frequency adaptation of POMC neurons is stronger in DIO mice.
(A and B) Original recording (bottom) and the corresponding instantaneous spike frequency plot (top) of a spontaneously firing (A) and silent (B) POMC neuron during a 10 s depolarizing current injection. (C and D) SFA ratios are higher in silent POMC neurons (C) and, accordingly, the number of APs during the 10 s depolarization decreased (D) (Mann-Whitney test). SFA, spike frequency adaptation; SAN, spontaneously active neuron; NSAN, not spontaneously active neuron (F < 0.5 Hz). ***p<0.001.
Figure 3
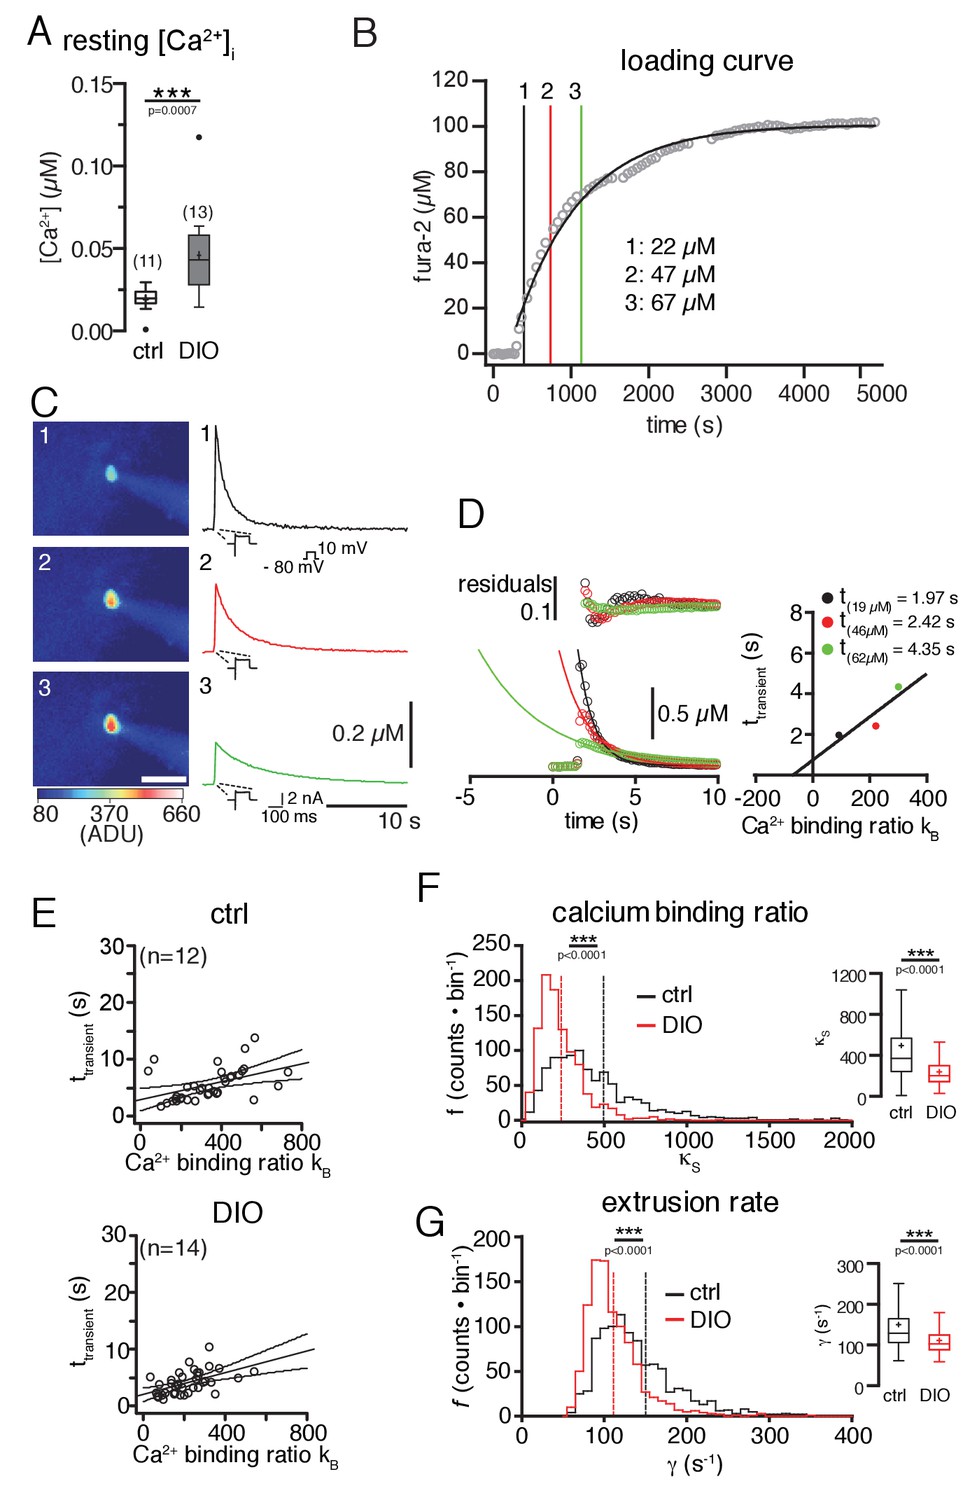
Diet-induced obesity changes the endogenous Ca2+-handling properties of POMC neurons.
Ca2+ handling was analyzed using a combination of patch-clamp recordings, ratiometric Ca2+ imaging, and the ‘added buffer approach’. (A) Ca2+ resting level. The concentration of free cytosolic Ca2+ was increased in DIO mice. (B–G) Ca2+-handling properties. (B) fura-2 loading curve. POMC neurons were loaded via the patch pipette with the ratiometric Ca2+ indicator fura-2, which also serves as the added Ca2+ buffer. Fura-2 fluorescence was acquired at 360 nm excitation (isosbestic point of fura-2) every 30 s, and converted into fura-2 concentrations. (C) Decay kinetics of voltage-induced Ca2+ transients of the POMC neuron in (B). The images (left panels) were acquired at times indicated in (B) and demonstrate the increasing fura-2 concentration during loading. The graphs (right panels) demonstrate the effect of increasing added Ca2+ buffer (fura-2) concentrations on the decay kinetics of voltage-evoked Ca2+ transients. (C and D) Analysis of endogenous Ca2+-handling parameters in a single cell. With increasing fura-2 concentrations, the amplitudes of transients decreased, and the time constants (τtransient) for decay were prolonged (C and D). The decay time constants were plotted against the Ca2+-binding ratios of fura-2 (κB) (D). κB was calculated from the intracellular fura-2 concentration, the Kd of fura-2, and the resting concentration of free intracellular Ca2+. The solid line represents the linear fit to the data. An estimate of κS was obtained as the negative x-axis intercept. The Ca2+ extrusion rate is estimated from the slope of the fit and the endogenous decay time constant from the intercept with the y-axis. (E) The decay time constants of all recorded neurons were plotted as a function of κB for all POMC neurons of the control and DIO mice. The best linear fits with 95% confidence bands are shown. (F and G) To estimate the variance of the endogenous Ca2+-binding ratio (κS) and the extrusion rate (γ), we used a bootstrap method (1000 samples), which provided bootstrap distributions (n = 1000) of the parameters for the control and DIO mice. Vertical lines indicate the means. (F) Distributions of κS. Sixteen counts for the control and one count for the DIO cohort between 2000 and 7500 are not shown. (G) Distribution of γ. Eighteen counts for the control and one count for the DIO cohort between 400 and 1350 are not shown. Subsequently, the distributions were log-transformed to bring them closer to a Gaussian, before applying unpaired t-tests. ***p<0.001.
Figure 4
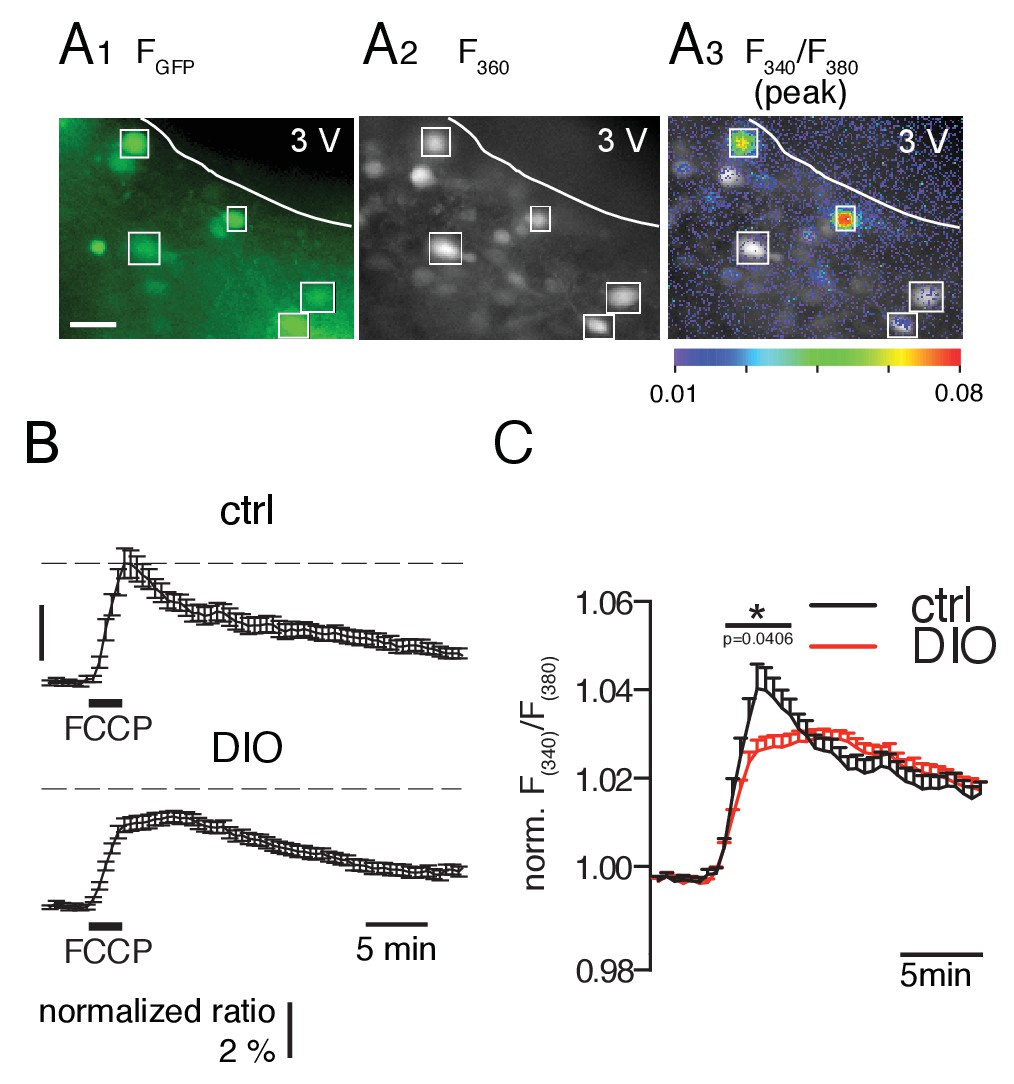
FCCP-induced mitochondrial Ca2+ release is smaller in POMC neurons of DIO mice.
(A) GFP-labeled POMC neurons (A1) and fura-2 fluorescence of AM-loaded neurons in a brain slice before (A2) and during (A3) FCCP (2 µM, 2 min) bath application. Regions of interests indicate double-labeled neurons, which were used for analysis. Scale bar: 50 µm. (B) Time course of FCCP-induced increase in intracellular Ca2+ concentration [as Δ(F340/F380) / (F340/F380)0] in POMC neurons of control and DIO mice. (C) For better visualization and comparison between the two populations, the fluorescence ratio of each recorded neuron was normalized to its baseline. The overlay in the right panel shows the release and uptake in higher resolution. Control, n = 46 cells, N = 10 brain slices. DIO, n = 72 cells, N = 11 brain slices. *p<0.05; Mann-Whitney test.
Figure 5
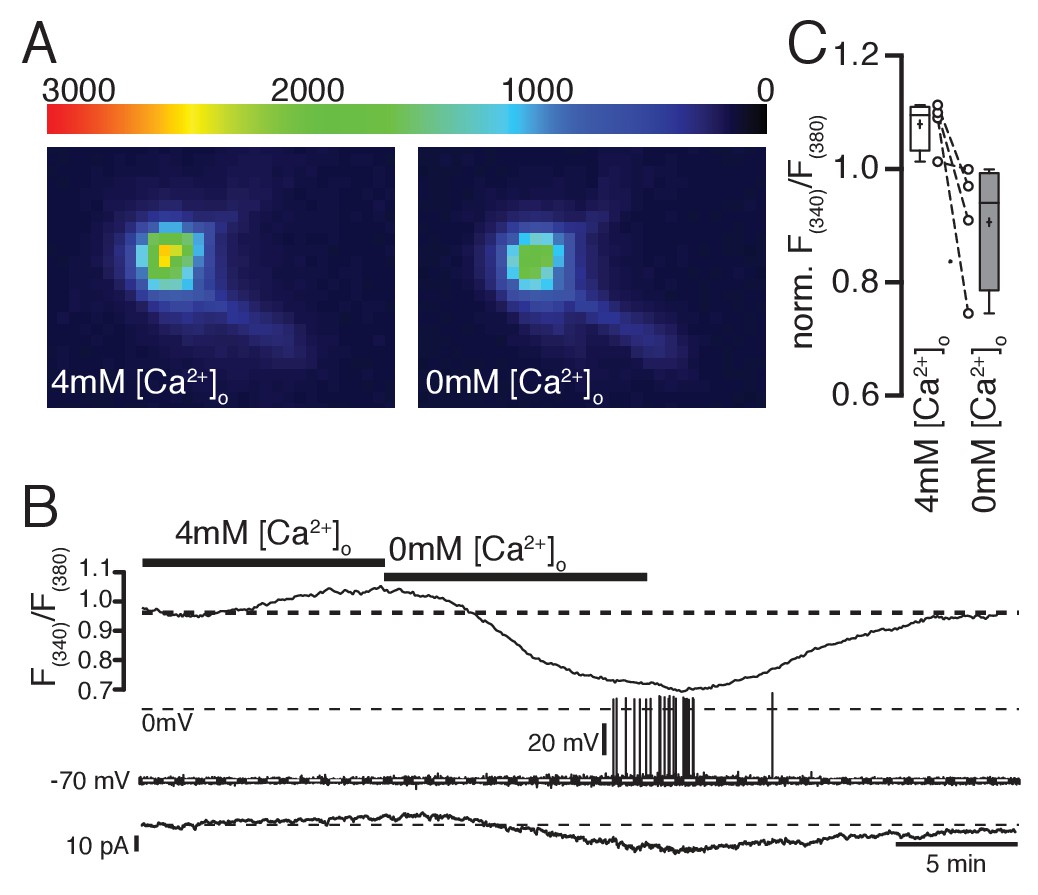
Ratiometric Ca2+ imaging with fura-2 shows that increasing or decreasing extracellular Ca2+ concentrations increases or decreases intracellular Ca2+ levels, respectively.
(A,B,C) Removal of extracellular Ca2+ decreased intracellular Ca2+ levels concomitant with an increase in hyperpolarizing holding current (B) when cells were clamped to −70 mV (low-frequency voltage-clamp). Note the generation of spontaneous action potentials in low Ca2+ conditions. (C) Changes of intracellular Ca2+ levels (normalized fura-2 ratios) under normal, high, and low Ca2+ conditions (n = 4).
Figure 6
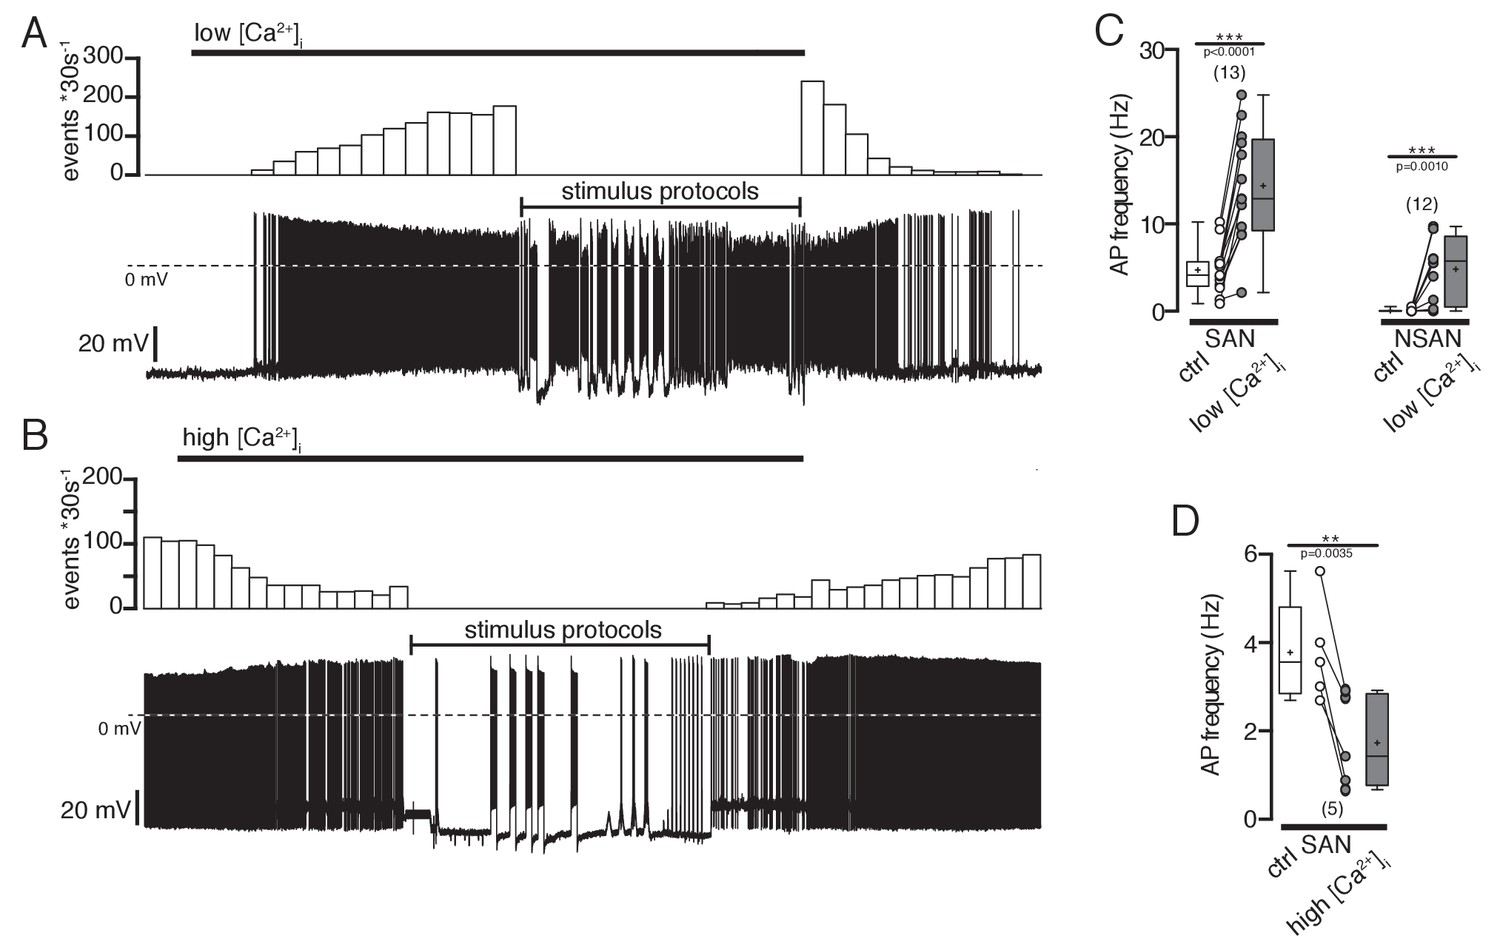
Effect of intracellular Ca2+ concentrations on action potential frequency of POMC neurons.
(A and B) Original recordings of POMC neurons illustrating the effect of decreasing or increasing intracellular Ca2+ concentrations. (A) A silent POMC neurons started to generate action potentials with decreasing [Ca2+]i. The effect reverted to control levels at normal [Ca2+]i. (B) In a spontaneously active neuron, the AP frequency was reduced with increasing [Ca2+]i. The effect reversed at normal Ca2+ levels. (C) Action potential frequency of spontaneously active and silent POMC neurons at normal and low [Ca2+]i, respectively (paired t-test). (D) Action potential frequency of spontaneously active neurons at normal and high [Ca2+]i, respectively (paired t-test). SAN, spontaneously active neuron; NSAN, not spontaneously active neuron (F < 0.5 Hz). **p<0.01, ***p<0.001.
Figure 7

Spike frequency adaptation in POMC neurons depends on intracellular Ca2+ concentrations.
(A and B) Original recording (A) and corresponding plot of the instantaneous spike frequency (B) of a silent POMC neuron showing the SFA during a 10 s depolarizing current pulse at normal and reduced [Ca2+]I. Reducing [Ca2+]i decreased the SFA. (C) SFA ratios of spontaneously firing and silent POMC neurons at different [Ca2+]i. In silent POMC neurons, the SFA is higher compared to firing POMC neurons. Reducing [Ca2+]i in silent neurons decreases SFA ratios to levels of firing neurons (ANOVA with Bonferroni corrections). (D) The number of action potentials during the 10 s depolarizing current pulse is smaller in silent compared to firing POMC neurons. Reducing [Ca2+]i increased the number of APs in silent neurons to the level of firing neurons (ANOVA with Bonferroni corrections). SFA, spike frequency adaptation; SAN, spontaneously active neuron; NSAN, not spontaneously active neuron (F < 0.5 Hz). *p<0.05, ***p<0.01.
Figure 8

Low intracellular Ca2+ concentrations increase excitability in POMC neurons.
(A and B) Spontaneously active neurons have a lower threshold current than silent neurons to elicit action potentials. Reducing [Ca2+]i decreased Ithreshold of silent and spontaneously active neurons to similar levels (ANOVA with Bonferroni analysis). (C) Number of action potentials during the current pulse as a function of injected current. Under control [Ca2+]i, the excitability is higher in spontaneously active neurons compared to silent POMC neurons (open symbols). Reducing [Ca2+]i increased the excitability of all neurons to similar levels. SAN, spontaneously active neuron; NSAN, not spontaneously active neuron (F < 0.5 Hz). *p<0.05.
Figure 9

Blocking SK currents by apamin changes intrinsic electrophysiological properties of silent POMC neurons.
(A, B, C) The SK channel blocker apamin (100 nM) induced depolarization and action potential firing. (A) A silent POMC neuron depolarized and started to generate action potentials under apamin. Action potential frequency (B) and membrane potential (C) before and during apamin application. (D, E, F) Apamin decreased spike frequency adaptation in silent neurons. (D) Original recording of a silent POMC neuron. Apamin reduced the SFA ratio (E) and increased the number of action potentials (F) during depolarization in silent but not in spontaneously active neurons. (G, H) Apamin reduced Ithreshold only in silent POMC neurons. (G) Recording of a silent POMC neuron. (H) Quantification of the apamin effect on Ithreshold. SAN, spontaneously active neuron; NSAN, not spontaneously active neuron (F < 0.5 Hz). Paired t-test. *p<0.05, **p<0.01, ***p<0.001.
Download links
A two-part list of links to download the article, or parts of the article, in various formats.
Downloads (link to download the article as PDF)
Open citations (links to open the citations from this article in various online reference manager services)
Cite this article (links to download the citations from this article in formats compatible with various reference manager tools)
Energy imbalance alters Ca2+ handling and excitability of POMC neurons
eLife 6:e25641.
https://doi.org/10.7554/eLife.25641


