Energy imbalance alters Ca2+ handling and excitability of POMC neurons
- University of Cologne, Germany
- MAP5 - Mathématiques Appliquées à Paris 5, CNRS UMR 8145, France
- University Hospital of Cologne, Germany
- Max Planck Institute for Metabolism Research, Germany
Abstract
Satiety-signaling, pro-opiomelanocortin (POMC)-expressing neurons in the arcuate nucleus of the hypothalamus play a pivotal role in the regulation of energy homeostasis. Recent studies reported altered mitochondrial dynamics and decreased mitochondria- endoplasmic reticulum contacts in POMC neurons during diet-induced obesity. Since mitochondria play a crucial role in Ca2+ signaling, we investigated whether obesity alters Ca2+ handling of these neurons in mice. In diet-induced obesity, cellular Ca2+ handling properties including mitochondrial Ca2+ uptake capacity are impaired, and an increased resting level of free intracellular Ca2+ is accompanied by a marked decrease in neuronal excitability. Experimentally increasing or decreasing intracellular Ca2+ concentrations reproduced electrophysiological properties observed in diet-induced obesity. Taken together, we provide the first direct evidence for a diet-dependent deterioration of Ca2+ homeostasis in POMC neurons during obesity development resulting in impaired function of these critical energy homeostasis-regulating neurons.
https://doi.org/10.7554/eLife.25641.001Introduction
Energy homeostasis is tightly regulated by highly dynamic neuronal networks in the hypothalamus. These control circuits adapt food intake and energy expenditure to the needs of the organism and the availability of fuel sources in the periphery of the body (Apovian, 2016; Gao and Horvath, 2007; Power, 2012). Dysregulation of this functional circuitry can cause metabolic disorders including obesity and type two diabetes, whose prevalence is increasing in Western societies (Schwartz and Porte, 2005). In the arcuate nucleus of the hypothalamus (ARH), satiety-signaling (anorexigenic), pro-opiomelanocortin (POMC)-expressing, and hunger-signaling (orexigenic) agouti-related peptide (AgRP)-expressing neurons integrate endocrine and metabolic factors to adapt neuronal activity that ultimately generates neurosecretory output (Morton et al., 2006; Sohn et al., 2013). This neurocircuitry not only regulates food intake and energy expenditure but also adapts glucose homeostasis to the acutely changing needs of the organism (Belgardt et al., 2009; Blouet and Schwartz, 2010; Könner et al., 2007; Steculorum et al., 2016).
Substantial progress has been made in identifying fuel-sensing endocrine and metabolic factors, such as leptin, insulin, glucose, free fatty acids, and uridine diphosphate (Gao and Horvath, 2007; Jordan et al., 2010; Steculorum et al., 2015; Varela and Horvath, 2012), and many immediate actions of these hormones and nutrient components on POMC and AgRP neurons are well understood (Claret et al., 2007; Jo et al., 2009; Parton et al., 2007; Spanswick et al., 1997, 2000).
In contrast, we have only limited information about the effects of sustained extreme nutritional states, such as high caloric intake and obesity, on the cellular electrophysiological properties and performance of these cells. It is well documented that increased caloric intake causes leptin and insulin resistance in ARH neurons (Könner and Brüning, 2012; Varela and Horvath, 2012), and that glucose sensing of POMC neurons is impaired in obesity (Parton et al., 2007). In POMC neurons, which are activated by reactive oxygen species (ROS), high-fat feeding promoted proliferation of peroxisomes and in turn reduced ROS levels and action potential firing (Diano et al., 2011). Increased expression of the suppressor of cytokine signaling (SOCS-3) has been shown to desensitize neurons to the anorexigenic actions of leptin and insulin (Bjørbaek et al., 1998; Ueki et al., 2004), and we and others have demonstrated that inflammatory signals activated by a high-fat diet cause neuronal leptin and insulin resistance (Belgardt et al., 2010; Dietrich et al., 2013; Kleinridders et al., 2009; Schneeberger et al., 2013; Tsaousidou et al., 2014). Correspondingly, endoplasmic reticulum (ER) stress was recognized as an important causal factor for the development of leptin resistance (Hosoi et al., 2008; Ramírez and Claret, 2015). Most recent studies have identified mitofusin-2 (MFN2) as a direct link between ER stress and leptin resistance in the hypothalamus (Schneeberger et al., 2013). In anorexigenic POMC neurons diet-induced obesity (DIO) altered mitochondrial network dynamics and decreased mitochondria-ER contacts by downregulation of MFN2. It is important to note that this is a cell type-specific response, when compared to the functionally antagonistic orexigenic AgRP neurons in the ARH (Dietrich et al., 2013; Schneeberger et al., 2013). Since mitochondrial function is intimately linked to the dynamic behavior of these organelles, and since mitochondria play a crucial role in intracellular Ca2+ signaling (Szabadkai and Duchen, 2008), we asked if intracellular Ca2+-handling properties are modulated in POMC neurons under DIO.
This question is especially interesting, since several lines of evidence suggest that age-dependent changes in Ca2+ homeostasis may partially increase, or even cause, the susceptibility for age-dependent impairment of neuronal function and neurodegeneration (Berridge, 2012; Marambaud et al., 2009; Toescu and Verkhratsky, 2007). Here, increased Ca2+ load on the cell can result in neurotoxicity and impaired neuronal function (Rizzuto et al., 2012; Rowland and Voeltz, 2012; Surmeier et al., 2010). Thus, to assess whether Ca2+ handling and the function of satiety-mediating POMC neurons are altered in diet-induced obesity, we analyzed the Ca2+-handling properties of these neurons and their intrinsic electrophysiological characteristics in detail. We found that diet-induced obesity impaired intracellular Ca2+ handling, including mitochondrial Ca2+ uptake. The changes in Ca2+ handling were accompanied by a marked decrease in activity and excitability of POMC neurons. Experimentally increasing or decreasing intracellular Ca2+ concentrations reproduced the electrophysiological properties observed in diet-induced obesity.
Results
High-fat diet decreases activity of anorexigenic POMC neurons
To investigate the effects of diet-induced obesity (DIO) on the intrinsic electrophysiological characteristics of POMC neurons, we performed electrophysiological recordings on identified POMC neurons of 18-week-old transgenic mice expressing GFP under the control of the Pomc promoter (Cowley et al., 2001). The animals had been fed a normal chow diet (NCD) or a high-fat diet (HFD) for 12 weeks, starting at an age of six weeks. In an independent experiment we measured increase in body weight and body fat content during HFD exposure. Mice exposed to 11–13 weeks of HFD-feeding (starting at an age of 6 weeks) showed an elevation in body weight (control: 29.3 ± 1.9 g, n = 25; DIO: 38.6 ± 4.1 g, n = 25; p<0.0001, Mann-Whitney test) and body fat content (control: 12.7 ± 4.2%, n = 25; DIO: 32.1 ± 4.0%, n = 25; p<0.0001, Mann-Whitney test) compared to NCD-fed controls.
Using perforated patch recordings, the integrity of intracellular components was ensured. The activity of POMC neurons of mice exposed to a HFD was clearly reduced, which is in line with previous results (Jo et al., 2009). The membrane potential was hyperpolarized (Figure 1A,B; control: −58.8 ± 1.1 mV, n = 26; DIO: −64.0 ± 1.2 mV, n = 37; p=0.0046, Mann-Whitney test) and the spontaneous activity was decreased (Figure 1A,C; control: 3.4 ± 0.7 Hz, n = 26; DIO: 1.7 ± 0.4 Hz, n = 37; p=0.037, Mann-Whitney test). Moreover, the percentage of POMC neurons without spontaneous action potential firing (NSAN, not spontaneously active neuron; F < 0.5 Hz) increased from 31% (8 of 26) in control mice to 51% (19 of 37) in DIO mice (Figure 1D). Likewise, the number of POMC neurons with strong spike frequency adaptation was markedly enhanced, i.e., the percentage of neurons with a spike frequency adaptation ratio (SFA, for details see Materials and methods) >3 increased from 21% (4 of 19) in the control group to 34% (10 of 29) in the DIO group (Figure 1E).
Figure 1
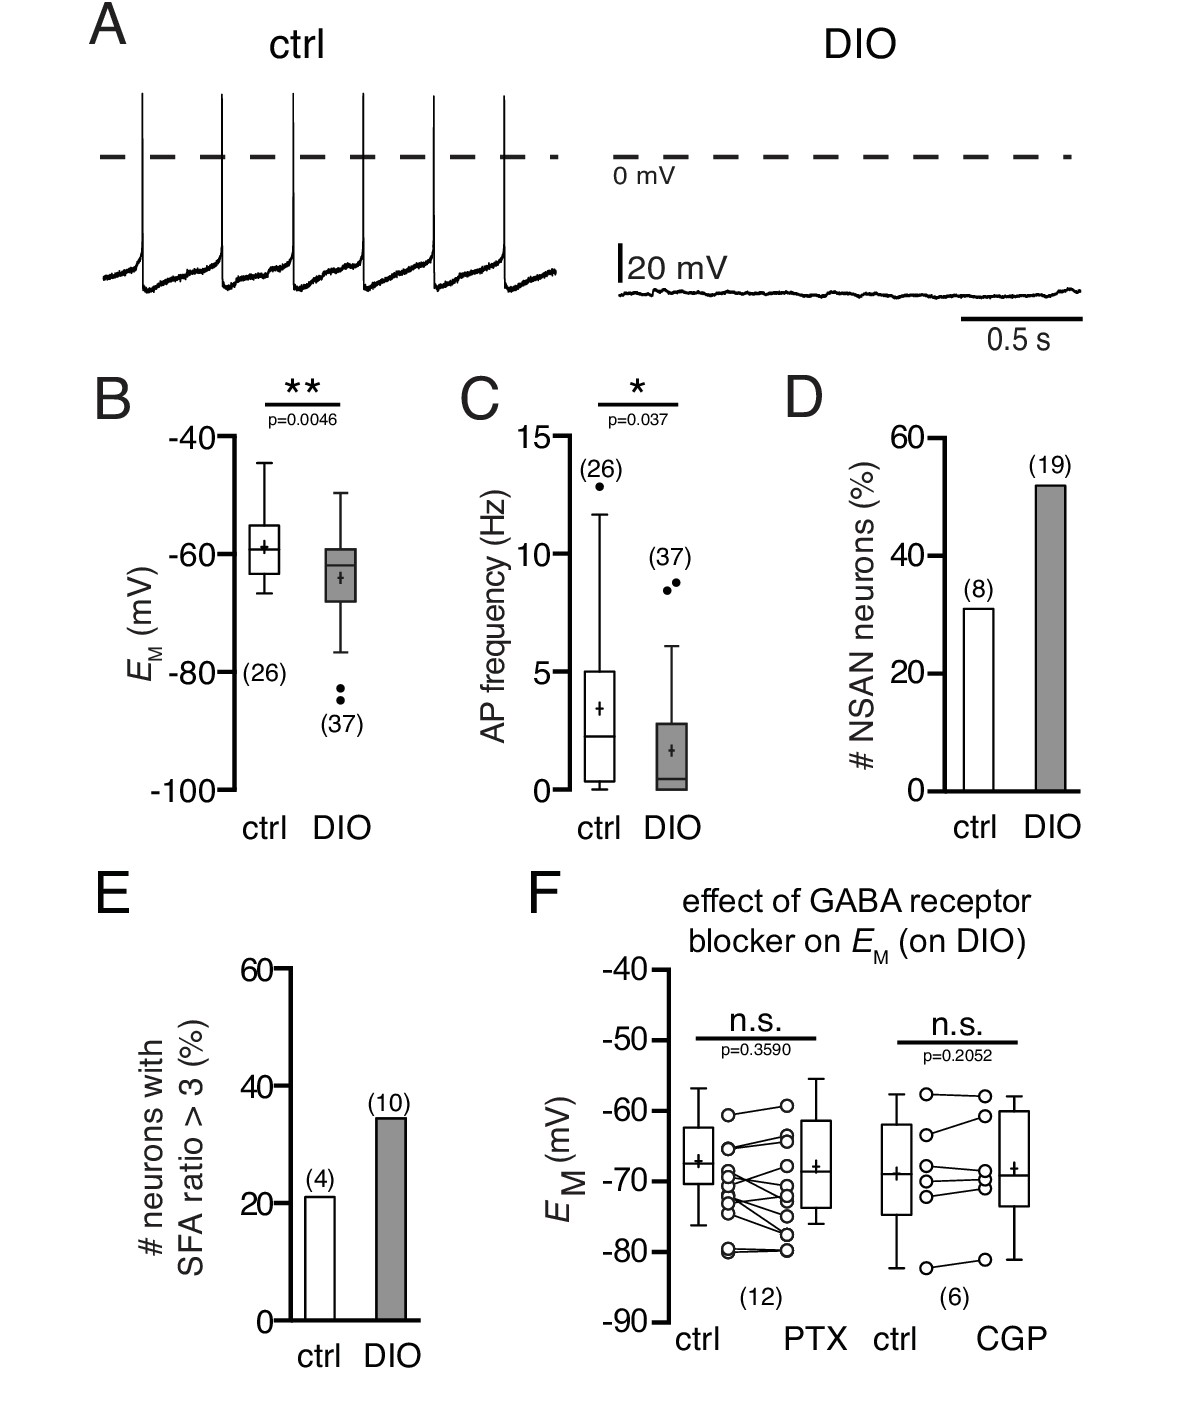
Diet-induced obesity decreases the spontaneous activity and hyperpolarizes the membrane potential of POMC neurons.
Recordings were performed in the perforated patch-clamp configuration from eGFP expressing POMC neurons in the arcuate nucleus. (A) Original recordings of POMC neurons of mice on NCD and in DIO. (B and C) POMC neurons of DIO mice were hyperpolarized (B) and their action potential frequency was decreased (C) (Mann-Whitney test). (D and E) The percentage of silent (F < 0.5 Hz) POMC neurons (D) and the percentage of POMC neurons with strong SFA (SFA ratio >3 Hz) (E) was higher in DIO mice compared to controls. (F) The GABAA receptor blocker PTX and the GABAB receptor blocker CGP54626 did not restore the membrane potential of DIO mice to control (paired t-test). SFA, spike frequency adaptation. **p<0.01, ***p<0.001.
Previous studies reported changes in both glutamatergic and GABAergic synaptic innervation of POMC neurons during a sustained HFD (Klöckener et al., 2011; Newton et al., 2013). Since all our experiments were performed in the presence of ionotropic synaptic blockers (for details see Materials and methods), it is unlikely that the observed hyperpolarization of the membrane potential in POMC neurons was caused by changes in synaptic input. However, to define the effect of potentially altered GABAergic input on POMC neurons in DIO, we performed two sets of experiments. Whole-cell voltage-clamp recordings revealed that the inhibitory postsynaptic current frequency was increased in DIO. Application of picrotoxin (100 µM), a GABAA receptor antagonist, and CGP54626 (50 µM), a GABAB receptor antagonist, blocked GABAergic currents and eliminated IPSCs completely (data not shown). However, neither picrotoxin nor CGP54626 restored the membrane potential and firing rate to control levels (Figure 1F; PTX: n = 12, p=0.3590; CGP: n = 6; p=0.2052; paired t-tests). The results show that the DIO-induced hyperpolarization and the decrease in firing rate cannot be exclusively attributed to the increase in inhibitory input organization of these cells, but are also a consequence of altered cell-intrinsic properties.
Overall, we found that POMC neurons without spontaneous activity had a two-fold higher SFA ratio than spontaneously firing POMC neurons (Figure 2A–C; POMC firing: 2.0 ± 0.1, n = 27; POMC silent: 3.6 ± 0.3, n = 22, p<0.0001, Mann-Whitney test). This was particularly reflected in a strong reduction of the action potential number over the time course of the depolarizing stimulus (Figure 2D; POMC firing: 188 ± 10, n = 25; POMC silent: 130 ± 11.0, n = 22; p=0.0009, Mann-Whitney test).
Figure 2
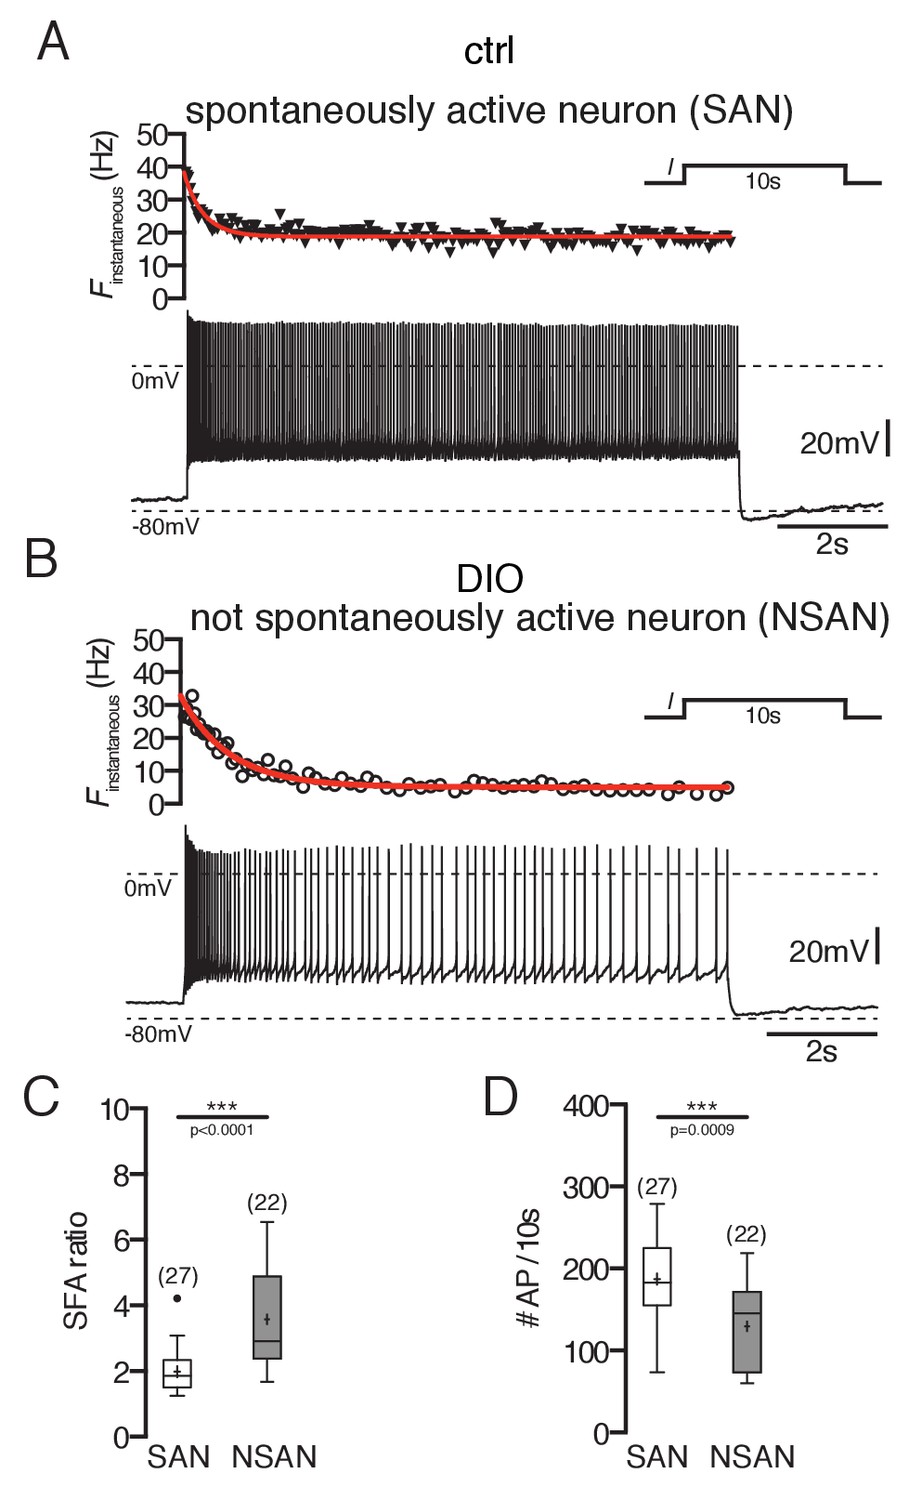
Spike frequency adaptation of POMC neurons is stronger in DIO mice.
(A and B) Original recording (bottom) and the corresponding instantaneous spike frequency plot (top) of a spontaneously firing (A) and silent (B) POMC neuron during a 10 s depolarizing current injection. (C and D) SFA ratios are higher in silent POMC neurons (C) and, accordingly, the number of APs during the 10 s depolarization decreased (D) (Mann-Whitney test). SFA, spike frequency adaptation; SAN, spontaneously active neuron; NSAN, not spontaneously active neuron (F < 0.5 Hz). ***p<0.001.
Collectively, these data show that in DIO mice, the excitability of anorexigenic POMC neurons is markedly reduced.
DIO alters Ca2+ handling of POMC neurons
Further, we compared the Ca2+-handling properties of POMC neurons, which represent a critical determinant of neuronal activity, of control and DIO mice, by using ratiometric Ca2+ imaging with fura-2 (Grynkiewicz et al., 1985). Surprisingly, these experiments revealed increased levels of free intracellular Ca2+ in POMC neurons in DIO compared to control mice (Figure 3A; control: 19.3 ± 2.3 nM, n = 11; DIO: 45.8 ± 7.3 nM, n = 13; p=0.0007, Mann-Whitney test), which was not expected, because of the DIO-induced hyperpolarization and decreased activity of the neurons.
Figure 3
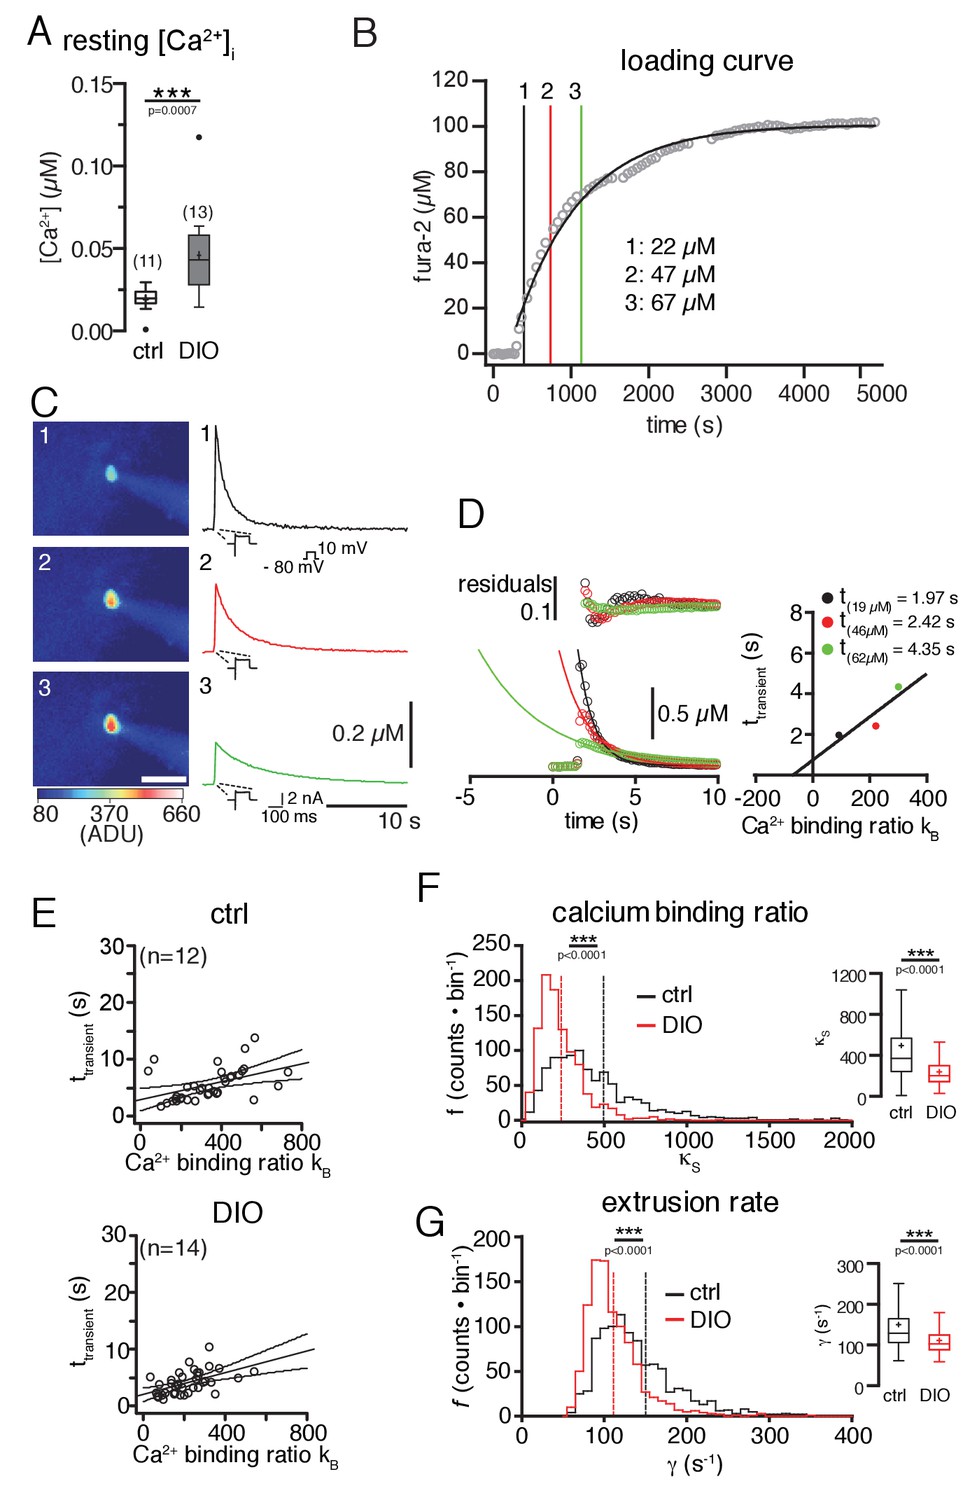
Diet-induced obesity changes the endogenous Ca2+-handling properties of POMC neurons.
Ca2+ handling was analyzed using a combination of patch-clamp recordings, ratiometric Ca2+ imaging, and the ‘added buffer approach’. (A) Ca2+ resting level. The concentration of free cytosolic Ca2+ was increased in DIO mice. (B–G) Ca2+-handling properties. (B) fura-2 loading curve. POMC neurons were loaded via the patch pipette with the ratiometric Ca2+ indicator fura-2, which also serves as the added Ca2+ buffer. Fura-2 fluorescence was acquired at 360 nm excitation (isosbestic point of fura-2) every 30 s, and converted into fura-2 concentrations. (C) Decay kinetics of voltage-induced Ca2+ transients of the POMC neuron in (B). The images (left panels) were acquired at times indicated in (B) and demonstrate the increasing fura-2 concentration during loading. The graphs (right panels) demonstrate the effect of increasing added Ca2+ buffer (fura-2) concentrations on the decay kinetics of voltage-evoked Ca2+ transients. (C and D) Analysis of endogenous Ca2+-handling parameters in a single cell. With increasing fura-2 concentrations, the amplitudes of transients decreased, and the time constants (τtransient) for decay were prolonged (C and D). The decay time constants were plotted against the Ca2+-binding ratios of fura-2 (κB) (D). κB was calculated from the intracellular fura-2 concentration, the Kd of fura-2, and the resting concentration of free intracellular Ca2+. The solid line represents the linear fit to the data. An estimate of κS was obtained as the negative x-axis intercept. The Ca2+ extrusion rate is estimated from the slope of the fit and the endogenous decay time constant from the intercept with the y-axis. (E) The decay time constants of all recorded neurons were plotted as a function of κB for all POMC neurons of the control and DIO mice. The best linear fits with 95% confidence bands are shown. (F and G) To estimate the variance of the endogenous Ca2+-binding ratio (κS) and the extrusion rate (γ), we used a bootstrap method (1000 samples), which provided bootstrap distributions (n = 1000) of the parameters for the control and DIO mice. Vertical lines indicate the means. (F) Distributions of κS. Sixteen counts for the control and one count for the DIO cohort between 2000 and 7500 are not shown. (G) Distribution of γ. Eighteen counts for the control and one count for the DIO cohort between 400 and 1350 are not shown. Subsequently, the distributions were log-transformed to bring them closer to a Gaussian, before applying unpaired t-tests. ***p<0.001.
Based on this finding, we next analyzed changes in Ca2+-handling properties of POMC neurons. Since the dynamics of free intracellular Ca2+ concentrations strongly depend on the endogenous Ca2+-buffering capacity and the Ca2+ extrusion rate, we also investigated whether DIO induces changes in the Ca2+-handling parameters of POMC neurons by using the ‘added buffer approach’ in combination with whole-cell patch-clamp recordings and optical Ca2+ imaging (Neher and Augustine, 1992; Pippow et al., 2009). The added buffer approach is based on a single compartment model with the rationale that for measurements of intracellular Ca2+ concentrations with Ca2+ chelator-based indicators, the amplitude and time course of the signals depend on the concentration of the Ca2+ indicator (here: fura-2). The indicator acts as an exogenous Ca2+ buffer and competes with the endogenous Ca2+ buffer(s).
The kinetics of cytosolic Ca2+ signals strongly rely on the endogenous and exogenous (added) Ca2+ buffers of the cell. The amplitude and decay rate of free intracellular Ca2+ changes with the increasing exogenous buffer concentration; the amplitude of free Ca2+ decreases, and the time constant τtransient of the decay increases, as shown in Figure 3C and D. If the buffer capacity of the added buffer is known, the time constant of the decay (τtransient; Figure 3D) can be used to estimate, by extrapolation, the Ca2+ signal to conditions, with only endogenous buffers are present (-κB = 1 + κS). The model used for this study (see Equation 4) assumes that the decay time constants τtransient are a linear function of the Ca2+-binding ratios (κB and κS) (Neher and Augustine, 1992). The ratio κS was determined from the negative x-axis intercept of the plot shown in Figure 3E. The slope of the fit is the inverse of the linear extrusion rate (γ). The point of intersection of the linear fit with the y-axis denotes the endogenous decay time constant τendo (no exogenous Ca2+ buffer in the cell). To estimate the variability of these parameters, which were determined by linear fits, we used a bootstrap approach (n = 1000; as described in the Materials and methods). Using this method, we found that the endogenous Ca2+-binding ratio (Figure 3F; control: 497 ± 18; DIO: 240 ± 5; p=0.0001, unpaired t-test), and, simultaneously, the Ca2+ extrusion rate (Figure 3G; control: 150 ± 3 s−1; DIO: 111 ± 1 s−1; p<0.0001; unpaired t-test) were reduced in POMC neurons of DIO mice compared to control mice.
DIO reduces mitochondrial Ca2+ content of POMC neurons
Since mitochondria play a crucial role in intracellular Ca2+ handling, we investigated whether the mitochondrial capacity of POMC neurons to accumulate Ca2+ was affected in DIO mice (Santo-Domingo and Demaurex, 2010; Szabadkai and Duchen, 2008). This was achieved by determining the Ca2+ release induced by the protonophore FCCP, as a measure for the ability of the mitochondria to contribute to the regulation of intracellular Ca2+. Brain slices were AM-loaded with fura-2, and mitochondrial Ca2+ release was induced in GFP-expressing POMC neurons by bath application of FCCP for 2 min (2 µM; Figure 4A). To monitor the Ca2+ release, we recorded the fluorescence ratio (F340/F380) (Figure 4B), which is proportional to an increase in free cytosolic calcium ([Ca2+]i). FCCP induced a lower elevation of free cytosolic Ca2+ in the DIO (Δ F340/F380 = 0.012 ± 0.001, n = 72 cells, N = 11 brain slices) than in the control cohort (Δ F340/F380 = 0.020 ± 0.003, n = 46 cells, N = 10 brain slices) (Figure 4B,C; p=0.0406, unpaired t-test). This indicates a reduced mitochondrial capacity to accumulate Ca2+ in POMC neurons of DIO mice.
Figure 4
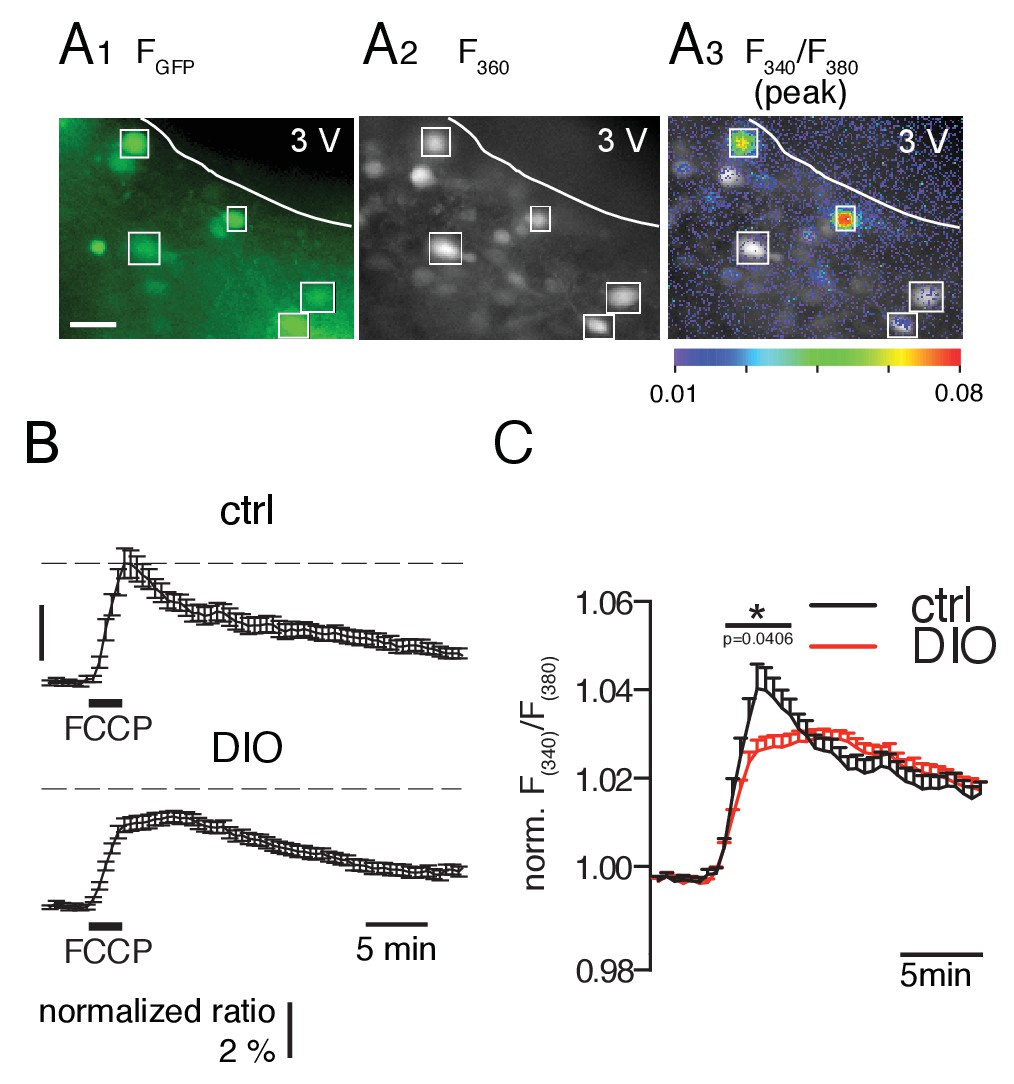
FCCP-induced mitochondrial Ca2+ release is smaller in POMC neurons of DIO mice.
(A) GFP-labeled POMC neurons (A1) and fura-2 fluorescence of AM-loaded neurons in a brain slice before (A2) and during (A3) FCCP (2 µM, 2 min) bath application. Regions of interests indicate double-labeled neurons, which were used for analysis. Scale bar: 50 µm. (B) Time course of FCCP-induced increase in intracellular Ca2+ concentration [as Δ(F340/F380) / (F340/F380)0] in POMC neurons of control and DIO mice. (C) For better visualization and comparison between the two populations, the fluorescence ratio of each recorded neuron was normalized to its baseline. The overlay in the right panel shows the release and uptake in higher resolution. Control, n = 46 cells, N = 10 brain slices. DIO, n = 72 cells, N = 11 brain slices. *p<0.05; Mann-Whitney test.
Spike frequency adaptation is increased in silent POMC neurons
Since the DIO-induced decrease in POMC neuron activity and excitability coincided with elevated levels of free intracellular Ca2+, we hypothesized that both findings are linked and that the elevated Ca2+ levels might cause the DIO-induced inhibition of POMC neurons. To verify this hypothesis, we modified the intracellular Ca2+ concentration by changing the extracellular Ca2+ concentration and tested if the changes in intrinsic electrophysiological properties observed in DIO can be reproduced by changing the intracellular Ca2+ concentration.
To confirm that changes in extracellular Ca2+ concentration indeed affect free intracellular Ca2+ levels, we combined electrophysiological recordings and ratiometric Ca2+ imaging with fura-2. An example experiment is shown in Figure 5A–C. To prevent indirect (activity-induced) changes in intracellular Ca2+ concentrations, the neurons were clamped at −70 mV with low-frequency voltage-clamp (implemented in an EPC10 patch-clamp amplifier, HEKA, Lambrecht, Germany). Elevating extracellular Ca2+ concentrations from 2 mM to 4 mM increased intracellular Ca2+ levels and decreased the hyperpolarizing holding current (Figure 5B). In contrast, reducing extracellular Ca2+ caused a drop in free intracellular Ca2+, increased the hyperpolarizing holding current, and even induced the generation of action potentials (Figure 5A–C). Using this direct approach to decrease or increase intracellular Ca2+ levels, we investigated if the DIO-induced changes in excitability can be directly mimicked by adjusting the levels of free intracellular Ca2+.
Figure 5
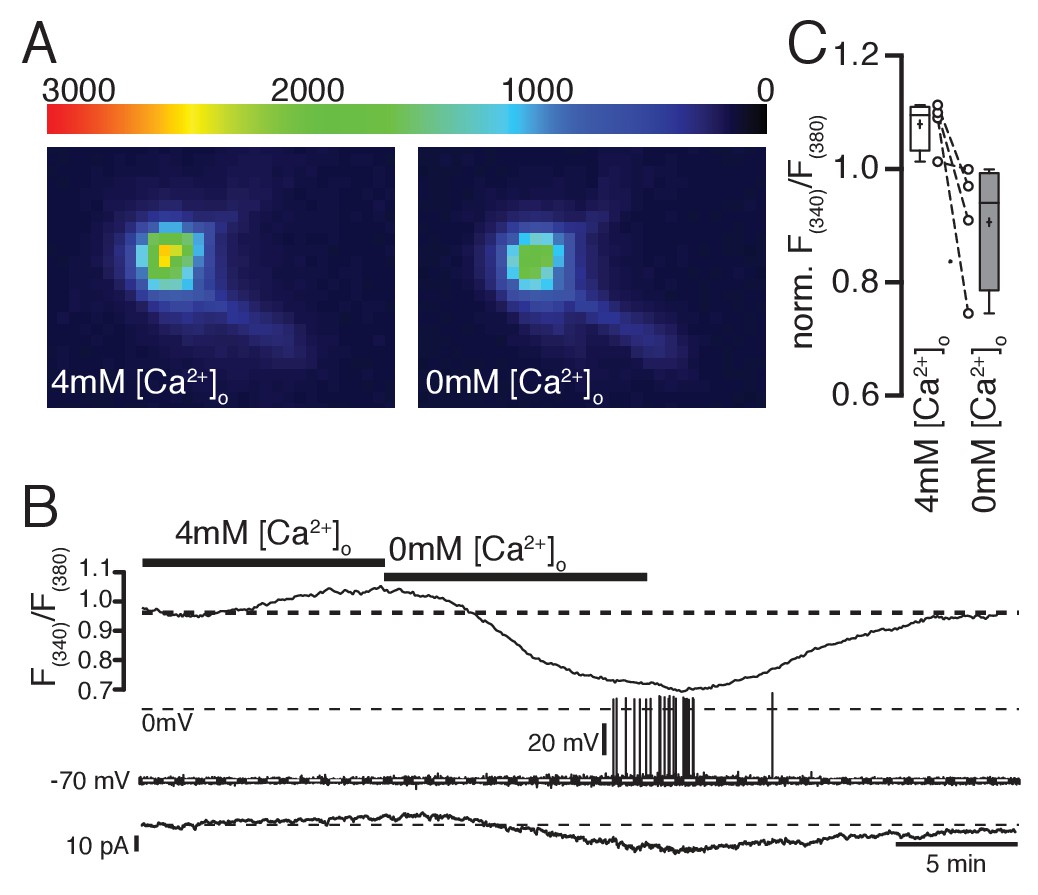
Ratiometric Ca2+ imaging with fura-2 shows that increasing or decreasing extracellular Ca2+ concentrations increases or decreases intracellular Ca2+ levels, respectively.
(A,B,C) Removal of extracellular Ca2+ decreased intracellular Ca2+ levels concomitant with an increase in hyperpolarizing holding current (B) when cells were clamped to −70 mV (low-frequency voltage-clamp). Note the generation of spontaneous action potentials in low Ca2+ conditions. (C) Changes of intracellular Ca2+ levels (normalized fura-2 ratios) under normal, high, and low Ca2+ conditions (n = 4).
As hypothesized, reducing intracellular Ca2+ depolarized the membrane potential and led to the generation of spontaneous action potentials in silent POMC neurons (Figure 6A,C). Increasing intracellular Ca2+ reduced the action potential frequency in neurons that were spontaneously active (Figure 6B,D). It is important to note that this is not a general effect, that is, removing extracellular Ca2+ did not change the intrinsic electrophysiological properties of hippocampal CA1 pyramidal cells of rats (Penn et al., 2016; Su et al., 2001). Reducing intracellular Ca2+ concentrations in silent POMC neurons decreased the elevated SFA ratios to control levels of spontaneously active POMC neurons (Figure 7A–C). In neurons with spontaneous activity the SFA ratio decreased upon reducing the intracellular Ca2+ concentration (Figure 7C). As a consequence of the reduced SFA, the number of action potentials per 10 s depolarizing current pulse was larger with low [Ca2+]i (Figure 7D).
Figure 6
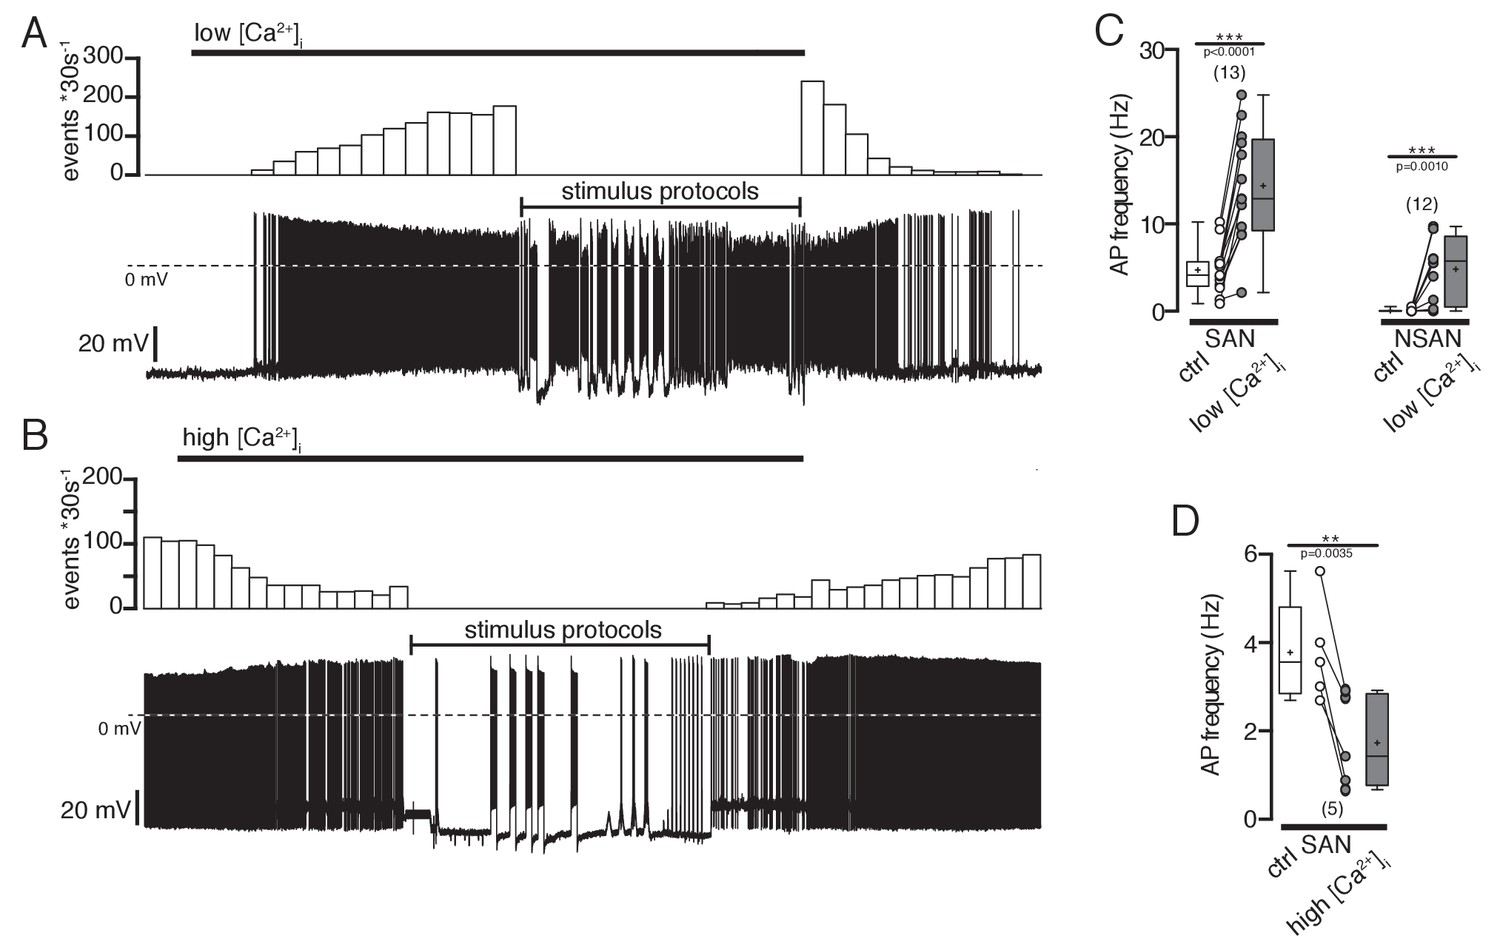
Effect of intracellular Ca2+ concentrations on action potential frequency of POMC neurons.
(A and B) Original recordings of POMC neurons illustrating the effect of decreasing or increasing intracellular Ca2+ concentrations. (A) A silent POMC neurons started to generate action potentials with decreasing [Ca2+]i. The effect reverted to control levels at normal [Ca2+]i. (B) In a spontaneously active neuron, the AP frequency was reduced with increasing [Ca2+]i. The effect reversed at normal Ca2+ levels. (C) Action potential frequency of spontaneously active and silent POMC neurons at normal and low [Ca2+]i, respectively (paired t-test). (D) Action potential frequency of spontaneously active neurons at normal and high [Ca2+]i, respectively (paired t-test). SAN, spontaneously active neuron; NSAN, not spontaneously active neuron (F < 0.5 Hz). **p<0.01, ***p<0.001.
Figure 7

Spike frequency adaptation in POMC neurons depends on intracellular Ca2+ concentrations.
(A and B) Original recording (A) and corresponding plot of the instantaneous spike frequency (B) of a silent POMC neuron showing the SFA during a 10 s depolarizing current pulse at normal and reduced [Ca2+]I. Reducing [Ca2+]i decreased the SFA. (C) SFA ratios of spontaneously firing and silent POMC neurons at different [Ca2+]i. In silent POMC neurons, the SFA is higher compared to firing POMC neurons. Reducing [Ca2+]i in silent neurons decreases SFA ratios to levels of firing neurons (ANOVA with Bonferroni corrections). (D) The number of action potentials during the 10 s depolarizing current pulse is smaller in silent compared to firing POMC neurons. Reducing [Ca2+]i increased the number of APs in silent neurons to the level of firing neurons (ANOVA with Bonferroni corrections). SFA, spike frequency adaptation; SAN, spontaneously active neuron; NSAN, not spontaneously active neuron (F < 0.5 Hz). *p<0.05, ***p<0.01.
Moreover, we determined the current at which action potentials were generated (threshold current, Ithreshold) by using ascending current ramps. In silent POMC neurons Ithreshold was higher compared to spontaneously active neurons, reflecting the decreased excitability of these cells (Figure 8A,B). Decreasing [Ca2+]i reduced Ithreshold in both firing and silent POMC neurons to similar values (Figure 8A,B). In line with these experiments, current-frequency relations were steeper in firing neurons compared to silent POMC neurons, and decreasing [Ca2+]i increased the current-frequency relation to the same level in all cells (Figure 8C).
Figure 8

Low intracellular Ca2+ concentrations increase excitability in POMC neurons.
(A and B) Spontaneously active neurons have a lower threshold current than silent neurons to elicit action potentials. Reducing [Ca2+]i decreased Ithreshold of silent and spontaneously active neurons to similar levels (ANOVA with Bonferroni analysis). (C) Number of action potentials during the current pulse as a function of injected current. Under control [Ca2+]i, the excitability is higher in spontaneously active neurons compared to silent POMC neurons (open symbols). Reducing [Ca2+]i increased the excitability of all neurons to similar levels. SAN, spontaneously active neuron; NSAN, not spontaneously active neuron (F < 0.5 Hz). *p<0.05.
SK channels contribute to decreased excitability of POMC neurons in DIO
Based on the findings that DIO increased the Ca2+ resting level and hyperpolarized the membrane potential, we hypothesized that activation of Ca2+-dependent K+ currents (IK(Ca)) might contribute to the observed hyperpolarization and decreased neuronal activity. To verify this hypothesis, we used blockers for specific components of IK(Ca) and assessed if the changes in intrinsic electrophysiological properties, which we observed in silenced neurons and which were accompanied by elevated [Ca2+]i, can be reversed. We applied the toxins apamin, charybdotoxin, iberiotoxin, and paxilline, which have been shown to block specific components of IK(Ca) in vertebrates (Bennett et al., 2000; Blatz and Magleby, 1986; Faber and Sah, 2003; Fioretti et al., 2004; Galvez et al., 1990; Ghatta et al., 2006; Giangiacomo et al., 1992; Kaczorowski et al., 1996; Pineda et al., 1992; Wolfart et al., 2001; Sanchez and McManus, 1996; Li and Cheung, 1999; Zhou and Lingle, 2014). Apamin blocks SK (KCa 2.1, KCa 2.2, KCa 2.3) channels, and iberiotoxin and paxilline blocks BK (KCa 1.1) channels. Charybdotoxin not only blocks BK (KCa 1.1) channels but has also been shown to block IK (KCa 3.1) and KV (KV 1.2; KV 1.3) channels.
Bath-application of the BK channel blockers charybdotoxin (100 nM, n = 17), iberiotoxin (100 nM, n = 7) and paxilline (10 µM, n = 6) did not have reproducible effects on membrane potential, SFA or threshold currents to generate action potentials in silent, hyperpolarized POMC neurons (data not shown). In contrast, the SK channel blocker apamin (100–200 nM) had clear excitatory effects on these neurons, inducing depolarization and action potential firing in most of the silent POMC neurons (Figure 9A–C). Likewise, it reduced the SFA (Figure 9D–F) and decreased the threshold current for generation of action potentials in silent neurons, but not in spontaneously active control neurons.
Figure 9

Blocking SK currents by apamin changes intrinsic electrophysiological properties of silent POMC neurons.
(A, B, C) The SK channel blocker apamin (100 nM) induced depolarization and action potential firing. (A) A silent POMC neuron depolarized and started to generate action potentials under apamin. Action potential frequency (B) and membrane potential (C) before and during apamin application. (D, E, F) Apamin decreased spike frequency adaptation in silent neurons. (D) Original recording of a silent POMC neuron. Apamin reduced the SFA ratio (E) and increased the number of action potentials (F) during depolarization in silent but not in spontaneously active neurons. (G, H) Apamin reduced Ithreshold only in silent POMC neurons. (G) Recording of a silent POMC neuron. (H) Quantification of the apamin effect on Ithreshold. SAN, spontaneously active neuron; NSAN, not spontaneously active neuron (F < 0.5 Hz). Paired t-test. *p<0.05, **p<0.01, ***p<0.001.
Taken together, these blocker experiments suggest that SK channels are an import link between increased intracellular Ca2+ levels and decreased excitability of POMC neuron in DIO. It is not surprising that the BK channel blockers did not depolarize silent neurons, since BK channels are highly voltage dependence (Sah and Davies, 2000) and might not contribute to the resting membrane potential. Interestingly, the SK channel blocker apamin, but not the BK channel blockers decreased SFA in silent neurons, suggesting that SK channels contribute markedly to SFA in silent POMC neurons, as shown for various cell types (Brenner et al., 2005; Vandael et al., 2012; Yen et al., 1999).
In summary, we show that DIO impairs the cellular Ca2+-handling properties of POMC neurons and increases the resting level of free intracellular Ca2+. In agreement with these general functional changes, we found the mitochondrial Ca2+ content to be diminished. The changes in intracellular Ca2+ handling properties were accompanied by membrane hyperpolarization and a marked decrease in excitability. By experimentally changing intracellular Ca2+ concentrations we could reproduce the electrophysiological properties observed in DIO. Taken together, we provide the first direct evidence for a diet-dependent deterioration of Ca2+ homeostasis in POMC neurons during obesity development.
Discussion
Satiety-signaling anorexigenic POMC neurons in the ARH play a pivotal role in the regulation of energy homeostasis. While the acute physiological role of various hormones and nutrients and their signaling mechanisms in the CNS are increasingly well understood (Gao and Horvath, 2007; Morton et al., 2006; Power, 2012; Schwartz and Porte, 2005), the effects of sustained high caloric intake and obesity on these circuits remain elusive. However, defining diet-associated changes in this network and elucidating their cellular and molecular mechanisms is critical to further unravel the mechanisms leading to increased susceptibility to metabolic disorders. The present study has clearly established that the intrinsic physiological state of anorexigenic POMC neurons is markedly altered in DIO. The starting point for this study was recent work that reported POMC neuron-specific alterations in mitochondrial morphology and decreased mitochondria-ER contacts in DIO by downregulation of MNF2 expression (Schneeberger et al., 2013). Mitochondrial shape changes influence the activity of mitochondria and can thus have dramatic effects on cellular signaling. Since mitochondria play a crucial role in intracellular Ca2+ handling, we tested if Ca2+ handling of POMC neurons is altered in DIO. DIO caused a reduction in Ca2+-buffer capacity, a reduction in Ca2+ extrusion rate, and an elevation of levels of free intracellular Ca2+. These findings are in line with the decreased Ca2+ content of mitochondria also found in these experiments, which indicates impaired mitochondrial Ca2+ handling. The changes in intracellular Ca2+ handling were accompanied by a hyperpolarized membrane potential, a reduction in action potential frequency, and an increase in the number of POMC neurons with no spontaneous activity. Since the recordings were performed in the presence of synaptic blockers, these alterations in electrophysiological activity were not caused by changes in synaptic input, which have been described previously (Klöckener et al., 2011; Newton et al., 2013).
Cowley et al. (2001) reported that leptin depolarizes POMC neurons and increases their firing rate; hence, it is conceivable that DIO-induced reduction in intrinsic activity also contributes to leptin resistance. Former studies had primarily focused on defining alterations in leptin-evoked signaling in POMC neurons, revealing ER stress, reduced leptin-evoked Stat-3 phosphorylation, α-MSH secretion in hypothalamic sections of HFD-fed obese mice (El-Haschimi et al., 2000), and increased expression of SOCS-3 or fatty acid-induced activation of inhibitory stress kinases (Belgardt et al., 2010; Ernst et al., 2009; Kievit et al., 2006; Kleinridders et al., 2009; Hosoi et al., 2008; Ramírez and Claret, 2015).
Given the results of these previous studies, it is likely that, from a mechanistic point of view, the decreased activity of POMC neurons reflects the net effect of DIO on multiple pathways. Nevertheless, our experiments, in which altering the intracellular Ca2+ concentration could reproduce the electrophysiological properties observed in DIO, identified the intracellular Ca2+ concentration as a probable direct link between DIO-induced changes in mitochondrial morphology and function, and the reduction in excitability of POMC neurons. Nevertheless, the downstream targets of Ca2+ signals have yet to be revealed. Obvious candidates for mediating the observed changes are Ca2+ activated K+ channels (Kaczorowski et al., 1996; Kimm et al., 2015; McManus, 1991; Pedarzani and Stocker, 2008; Sah and Davies, 2000; Weatherall et al., 2010, Li and Bennett, 2007; Liu and Herbison, 2008). This notion is supported by our experiments which show that the SK channel blocker apamin can, at least in part, revers the Ca2+ induced decrease in neuronal activity. Nevertheless, there may well be other Ca2+-dependent pathways that can reduce neuronal excitability (Ashcroft and Ashcroft, 1990; Ha et al., 2016).
On the systemic level, the clearly decreased activity of POMC neurons represents a critical reduction in, or even loss of, an important satiety signal, which raises questions regarding the etiology of these dramatic changes. One can assume that POMC neurons initially respond to high-fat feeding with an increase in activity in order to prevent a positive energy balance. Subsequently, chronic overactivation could lead to compensatory adaptations to reestablish normal neuronal baseline activity, as it has been demonstrated in numerous neuronal systems (Marder and Prinz, 2002). However, the drastic decrease in neuronal activity of anorexic POMC neurons in a situation of sustained high caloric intake clearly argues against a ‘controlled’ compensatory mechanism aiming at the reestablishment of normal neuronal responses. Considerable Ca2+ entry into POMC neurons during sustained activation by HFD might contribute to the impairment of Ca2+ homeostasis (Suyama et al., 2017). Thus, it seems more likely that the sustained metabolic stress of HFD-feeding directly impairs Ca2+ homeostasis (Fu et al., 2011). This notion is in line with previously described alterations in mitochondrial morphology and decreases in mitochondria-ER contacts, caused by downregulation of MNF2 (Bach et al., 2003; Guillet et al., 2011; Pich et al., 2005; Schneeberger et al., 2013). This is also interesting in the context of previous work which indicates that an opposite caloric regimen, namely caloric restriction, is an effective way to drastically delay the onset of age related neurodegenerative diseases and age-related impairment of intrinsic neuronal properties (Hemond and Jaffe, 2005; Murchison and Griffith, 2007). Since several lines of evidence suggest that age-dependent changes in Ca2+ homeostasis may increase the susceptibility for age-dependent impairment of neuronal function (Berridge, 2012; Marambaud et al., 2009; Toescu and Verkhratsky, 2007), a compromised Ca2+ homeostasis induced by high caloric intake might accelerate aging. Since age-related changes in neuronal activity have also been observed in POMC neurons (Yang et al., 2012), the decreased activity observed in our study may be associated with DIO-induced accelerated aging.
From a mechanistic point of view, additional mechanisms have to be taken into account. Since the byproducts of nutrient oxidation are free radicals, and since satiety is associated with high levels of ROS production in POMC neurons, oxidative stress is a likely candidate for modulating mitochondrial function (Barsukova et al., 2011). While ROS can act as a physiological signaling molecule at low concentrations (Brookes et al., 2004; Zima and Blatter, 2006), and while acute increases in ROS levels have been shown to activate POMC neurons (Diano et al., 2011), it is not unreasonable to anticipate that sustained high ROS levels as a consequence of high-fat feeding impair mitochondrial function (Horvath et al., 2009). At high concentrations, ROS can induce mitochondrial permeability transition, causing mitochondrial Ca2+ release and elevation of cytosolic Ca2+ levels (Barsukova et al., 2011).
In summary, our study shows that DIO dramatically reduces the activity of satiety-mediating POMC neurons. Our experiments suggest that impaired mitochondrial Ca2+ handling causes an increase in free cytosolic Ca2+, which mediates membrane hyperpolarization. Our study thus provides direct evidence that besides altering hormonal responses, chronic HFD-feeding induces a direct, profound impairment of cell-intrinsic properties, which are of critical importance for neuronal excitability in energy balance-regulating circuits. Further defining the exact molecular pathways leading to impaired Ca2+ handling during the development of diet-induced obesity may thus set the ground for novel therapeutic approaches to tackle the current obesity epidemic.
Materials and methods
Animals and brain slice preparation
Request a detailed protocolAll animal procedures were conducted in compliance with guidelines approved by local government authorities (LANUV NRW, Recklinghausen, Germany) and were in accordance with NIH guidelines. Experiments were performed on brain slices from 18-week-old male POMC-EGFP mice that expressed green fluorescent protein (eGFP) selectively in pro-opiomelanocortin (POMC) neurons (Cowley et al., 2001). Animals were kept under standard laboratory conditions, with tap water and chow available ad libitum, on a 12 hr light/dark cycle. Animals were either fed normal chow diet (NCD; Teklad Global Rodent 2018; Harlan, Madison, WI, USA) containing 53.5% carbohydrates, 18.5% protein, and 5.5% fat (12% of calories from fat) or a high-fat diet (HFD; C1057; Altromin, Lage, Germany) containing 32.7% carbohydrates, 20% protein, and 35.5% fat (55.2% of calories from fat) for 12 weeks (starting at an age of 6 weeks). The animals were lightly anesthetized with isoflurane (B506; AbbVie Deutschland GmbH and Co KG, Ludwigshafen, Germany) and subsequently decapitated. Coronal slices (270–300 µm) containing the arcuate nucleus of the hypothalamus (ARH) were cut with a vibration microtome (HM-650 V; Thermo Scientific, Walldorf, Germany) under cold (4°C), carbogenated (95% O2 and 5% CO2), glycerol-based modified artificial cerebrospinal fluid (GaCSF) (Ye et al., 2006). The GaCSF contained (in mM): 250 Glycerol, 2.5 KCl, 2 MgCl2, 2 CaCl2, 1.2 NaH2PO4, 10 HEPES, 21 NaHCO3, and 5 Glucose adjusted to pH 7.2 with NaOH. If not mentioned otherwise, the brain slices were continuously superfused with carbogenated aCSF at a flow rate of ~2 ml·min−1. The aCSF contained (in mM): 125 NaCl, 2.5 KCl, 2 MgCl2, 2 CaCl2, 1.2 NaH2PO4, 21 NaHCO3, 10 HEPES, and 5 Glucose adjusted to pH 7.2 with NaOH. To block synaptic currents, it contained 10−4 M PTX, 5 × 10⁻⁵ M D-AP5, and 10−5 M CNQX.
Electrophysiology
Request a detailed protocolPOMC neurons were recorded at room temperature under current- and voltage-clamp in the perforated patch and whole-cell patch-clamp configuration using an EPC10 patch-clamp amplifier (HEKA, Lambrecht, Germany). Current clamp recordings in the perforated patch configuration were performed using protocols modified from Horn and Marty (1988), Rae et al. (1991), and Akaike and Harata (1994). The recordings were performed with ATP and GTP free pipette solution containing (in mM): 128 K-gluconate, 10 KCl, 10 HEPES, 0.1 EGTA, 2 MgCl2, and adjusted to pH 7.3 with KOH. The patch pipette was tip-filled with internal solution and back-filled with tetraethylrhodamine-dextran (D3308; Invitrogen, Eugene, OR, USA) and amphotericin B (~200 µg·ml−1; A4888; Sigma-Aldrich, Taufkirchen, Germany) or nystatin-containing (~200 µg·ml−1; N6261; Sigma-Aldrich) internal solution to achieve perforated patch recordings. Whole-cell recordings were performed following the methods of Hamill et al. (Hamill et al., 1981).
Spike frequency adaptation
Request a detailed protocolFor SFA ratios 10 s depolarizing stimuli were applied from a holding potential of ∼−70 mV with initial instantaneous AP frequencies between 30 and 40 Hz. Instantaneous frequencies were plotted (Y in the next equation) over the 10 s time course and fit to a mono-exponential decay equation with Y0 set to the initial instantaneous frequency:
where Plateau is the asymptotic frequency, K the inverse timeconstant and T the time.
Ca2+ imaging experiments
Request a detailed protocolFor Ca2+ imaging experiments, slices were superfused with carbogenated aCSF. To block synaptic currents, it contained 10−4 M PTX, 5 × 10⁻⁵ M D-AP5, and 10−5 M CNQX. The pipette solution contained (in mM): 135 K-gluconate, 10 KCl, 10 HEPES, 2 MgCl2, and 0.1 fura-2 (pentapotassium salt, F1200, Molecular Probes, OR, USA) adjusted with KOH to pH 7.3.
Fluorimetric Ca2+ measurements
Request a detailed protocolIntracellular Ca2+ concentrations and dynamics were measured with the Ca2+ indicator fura-2, a ratiometric dye suitable to determine absolute Ca2+ concentration after calibration (Grynkiewicz et al., 1985). The Ca2+-handling parameters were determined as described previously using the ‘added buffer’ approach (Neher and Augustine, 1992) in combination with whole-cell patch-clamp recordings and fast optical imaging. The imaging setup consisted of an Imago/SensiCam CCD camera with a 640 × 480 chip (Till Photonics, Gräfelfing, Germany) and a Polychromator IV (Till Photonics) that was coupled via an optical fiber into the upright microscope. The fura-2-loaded neurons were illuminated during data collection with 340 nm, 360 nm, or 380 nm. Emitted fluorescence was detected through a 440 nm long-pass filter (LP440). Data were acquired as 80 × 60 frames using 8 × 8 on-chip binning. Images were recorded in analog-to-digital units (ADUs) and stored and analyzed as 12-bit grayscale images. For all calculations of kinetics, the mean values of ADUs within regions of interest (ROIs) from the center of the cell bodies were used.
Free intracellular Ca2+ concentrations were determined as in (Grynkiewicz et al., 1985):
(1)
is the free intracellular Ca2+ concentration for the background-subtracted fluorescence ratio R from 340 nm and 380 nm excitation. and are the ratios at a Ca2+ concentration of virtually 0 M and at saturating Ca2+ concentrations, respectively. is the dissociation constant of fura-2. is the ratio between the emitted fluorescence of Ca2+-free dye and the emitted fluorescence of Ca2+-saturated dye at 380 nm excitation, reflecting the dynamic range of the indicator. The term is substituted with the effective dissociation constant , which is independent of the dye concentration and specific for each experimental setup:
(2)
The free Ca2+ concentrations in the calibration solutions were determined using a Ca2+-selective electrode (Kay et al., 2008; McGuigan et al., 1991). Calibration solutions contained (in mM): Rmax: 140 KCl, 2.5 KOH, 15 NaCl, 1 MgCl2, 5 HEPES, 10 CaCl2, and 0.05 fura-2; Rmin: 129.5 KCl, 13 KOH, 15 NaCl, 1 MgCl2, 5 HEPES, 4 EGTA, and 0.05 fura-2; Rdef: 129.5 KCl, 13 KOH, 10.3 NaCl, 4.7 NaOH, 1 MgCl2, 5 HEPES, 4 EGTA, 2.7 CaCl2, and 0.05 fura-2, yielding a free Ca2+ concentration of 0.35 µM. All solutions were adjusted to pH 7.2 with HCl.
Ca2+-handling parameters were determined by using the ‘added buffer’ approach originally introduced by Neher and Augustine (Neher and Augustine, 1992). This method is based on a linear, single compartment model, with the rationale that for measurements of intracellular Ca2+ concentrations with Ca2+ chelator-based indicators, the amplitude and time course of the signals are dependent on the concentration of the Ca2+ indicator (here: fura−2), which acts as an exogenous Ca2+ buffer (B), and the endogenous buffer (S). The ability of the experimentally introduced exogenous buffer to bind Ca2+ is described by its Ca2+-binding ratio that is defined as the ratio of the change in buffer-bound Ca2+ over the change in free Ca2+:
(3)
[BT] is the total concentration of the exogenous buffer and is its dissociation constant for Ca2+. In this model, the decay time constant () of a Ca2+ transient induced by a brief Ca2+ influx is described as:
(4)
is proportional to , and a linear fit to the data has its negative x-axis intercept at , yielding the endogenous Ca2+-binding ratio of the cell. The slope of this fit is the inverse of the Ca2+ extrusion rate . The y-axis intercept yields the time constant for the decay of the Ca2+ transient as it would appear in the cell without exogenous buffer. values were plotted as a function of κB values and fit with a linear function , using the ‘R function’ lm (R Development Core Team [2009]). To estimate the variance of the Ca2+-handling parameters, we used the bootstrap method (Pippow et al., 2009) implemented in the boot library in R (fixed-x resampling, 1000 bootstrap samples, boot: Bootstrap R Functions, R package version 1.2–36), which provided bootstrap distributions (n = 1000) for each of the parameters. The distributions were log-transformed to bring them closer to a Gaussian. To determine differences in means between the different cell types, unpaired t-tests were performed.
To monitor calcium release from mitochondria into the cytoplasm, the calcium indicator fura-2 was AM-loaded into POMC neurons by incubating brain slices in carbogenated aCSF containing 10 µM fura-2 (fura-2 AM, F1221, Molecular Probes; 24°C for 50–60 min). During the recordings, slices were superfused with aCSF additionally containing 250 µM sulfinpyrazone (S9509, Sigma-Aldrich), to inhibit fura-2 sequestration (Di Virgilio et al., 1990). Ca2+ release from mitochondria was induced by bath application of 2 µM carbonyl cyanide p-(trifluoromethoxy) phenylhydrazone (FCCP, Sigma-Aldrich) at a flow rate of 3 ml·min−1. Since the background fluorescence is not clearly determinable in AM-loaded cells, no background was subtracted, and instead of reporting absolute changes in free intracellular Ca2+, changes in calcium concentration were given as changes in the fura-2 ratio (340/380 nm) (Bergmann and Keller, 2004; Jaiswal et al., 2009). For better visualization and comparison of the time courses of the fura-2 ratio between the two populations, we normalized the fluorescence ratio to the baseline. Analysis was performed off-line using IGOR Pro 6 (Wavemetrics, Lake Oswego, OR, USA).
Tools for data analysis and statistics
Request a detailed protocolElectrophysiological data were analyzed using Pulse (version 8.63, HEKA-Elektronik) and Igor Pro six software (Wavemetrics, including the Patcher's Power Tools plug-in: http://www.mpibpc.mpg.de/groups/neher/index.php?page=software). All calculations for the determination of EGTA purity, its dissociation constant, and the free Ca2+ concentrations in the calibration solutions were performed in R (R Development Core Team [2009], http://www.R-project.org). All functions that were used to fit the Ca2+ buffering-related data with a linearized one-compartment model were implemented in R(R Development Core Team [2009]. If not stated otherwise, all calculated values are expressed as means ± SEM (standard error of the mean). For pairwise comparisons of dependent and independent normal distributions, paired and unpaired t-tests were used, respectively. For pairwise comparisons of independent, not normal distributions, Mann-Whitney U-tests were used. For multiple comparisons, ANOVA with Bonferroni post hoc analysis was performed. Tests were executed using GraphPad Prism 5 (GraphPad Software Inc., La Jolla, CA, USA). A significance level of 0.05 was accepted for all tests. Significance levels were: *p<0.05, **p<0.01, ***p<0.001. In all figures, n-values are given in brackets. Exact p-values are reported if p>0.0001.
References
-
Nystatin perforated patch recording and its applications to analyses of intracellular mechanismsThe Japanese Journal of Physiology 44:433–473.https://doi.org/10.2170/jjphysiol.44.433
-
The Obesity Epidemic--understanding the disease and the treatmentNew England Journal of Medicine 374:177–179.https://doi.org/10.1056/NEJMe1514957
-
Properties and functions of ATP-sensitive K-channelsCellular Signalling 2:197–214.https://doi.org/10.1016/0898-6568(90)90048-F
-
Mitofusin-2 determines mitochondrial network architecture and mitochondrial metabolism. A novel regulatory mechanism altered in obesityThe Journal of Biological Chemistry 278:17190–17197.https://doi.org/10.1074/jbc.M212754200
-
Hormone and glucose signalling in POMC and AgRP neuronsThe Journal of Physiology 587:5305–5314.https://doi.org/10.1113/jphysiol.2009.179192
-
Intrinsic membrane properties underlying spontaneous tonic firing in neostriatal cholinergic interneuronsJournal of Neuroscience 20:8493–8503.
-
Calcium signalling remodelling and diseaseBiochemical Society Transactions 40:297–309.https://doi.org/10.1042/BST20110766
-
Hypothalamic nutrient sensing in the control of energy homeostasisBehavioural Brain Research 209:1–12.https://doi.org/10.1016/j.bbr.2009.12.024
-
Calcium, ATP, and ROS: a mitochondrial love-hate triangleAJP: Cell Physiology 287:C817–C833.https://doi.org/10.1152/ajpcell.00139.2004
-
AMPK is essential for energy homeostasis regulation and glucose sensing by POMC and AgRP neuronsJournal of Clinical Investigation 117:2325–2336.https://doi.org/10.1172/JCI31516
-
Two defects contribute to hypothalamic leptin resistance in mice with diet-induced obesityJournal of Clinical Investigation 105:1827–1832.https://doi.org/10.1172/JCI9842
-
NPPB block of the intermediate-conductance Ca2+-activated K+ channelEuropean Journal of Pharmacology 497:1–6.https://doi.org/10.1016/j.ejphar.2004.06.034
-
Purification and characterization of a unique, potent, peptidyl probe for the high conductance calcium-activated potassium channel from venom of the scorpion Buthus tamulusThe Journal of Biological Chemistry 265:11083–11173.
-
Neurobiology of feeding and energy expenditureAnnual Review of Neuroscience 30:367–398.https://doi.org/10.1146/annurev.neuro.30.051606.094324
-
Large-conductance, calcium-activated potassium channels: structural and functional implicationsPharmacology & Therapeutics 110:103–116.https://doi.org/10.1016/j.pharmthera.2005.10.007
-
A new generation of Ca2+ indicators with greatly improved fluorescence propertiesThe Journal of Biological Chemistry 260:3440–3450.
-
Improved patch-clamp techniques for high-resolution current recording from cells and cell-free membrane patchesPflügers Archiv - European Journal of Physiology 391:85–100.https://doi.org/10.1007/BF00656997
-
Muscarinic activation of ionic currents measured by a new whole-cell recording methodThe Journal of General Physiology 92:145–159.https://doi.org/10.1085/jgp.92.2.145
-
Fuel utilization by hypothalamic neurons: roles for ROSTrends in Endocrinology & Metabolism 20:78–87.https://doi.org/10.1016/j.tem.2008.10.003
-
Endoplasmic reticulum stress induces leptin resistanceMolecular Pharmacology 74:1610–1619.https://doi.org/10.1124/mol.108.050070
-
Oleic acid directly regulates POMC neuron excitability in the hypothalamusJournal of Neurophysiology 101:2305–2316.https://doi.org/10.1152/jn.91294.2008
-
Sensing the fuels: glucose and lipid signaling in the CNS controlling energy homeostasisCellular and Molecular Life Sciences 67:3255–3273.https://doi.org/10.1007/s00018-010-0414-7
-
High-conductance calcium-activated potassium channels; structure, pharmacology, and functionJournal of Bioenergetics and Biomembranes 28:255–267.https://doi.org/10.1007/BF02110699
-
Automatic determination of ligand purity and apparent dissociation constant (K(app)) in ca(2+)/Mg(2+) buffer solutions and the K(app) for ca(2+)/Mg(2+) anion binding in physiological solutions from ca(2+)/Mg(2+)-macroelectrode measurementsComputers in Biology and Medicine 38:101–110.https://doi.org/10.1016/j.compbiomed.2007.07.008
-
Selective insulin and leptin resistance in metabolic disordersCell Metabolism 16:144–152.https://doi.org/10.1016/j.cmet.2012.07.004
-
Effects of paxilline on K+ channels in rat mesenteric arterial cellsEuropean Journal of Pharmacology 372:103–107.https://doi.org/10.1016/S0014-2999(99)00188-0
-
Calcium signaling in neurodegenerationMolecular Neurodegeneration 4:20.https://doi.org/10.1186/1750-1326-4-20
-
Calcium buffer solutions and how to make them: a do it yourself guideCanadian Journal of Physiology and Pharmacology 69:1733–1749.https://doi.org/10.1139/y91-257
-
Calcium-activated potassium channels: regulation by calciumJournal of Bioenergetics and Biomembranes 23:537–560.https://doi.org/10.1007/BF00785810
-
Calcium gradients and buffers in bovine chromaffin cellsThe Journal of Physiology 450:273–301.https://doi.org/10.1113/jphysiol.1992.sp019127
-
Molecular and cellular basis of small--and intermediate-conductance, calcium-activated potassium channel function in the brainCellular and Molecular Life Sciences 65:3196–3217.https://doi.org/10.1007/s00018-008-8216-x
-
Charybdotoxin and apamin sensitivity of the calcium-dependent repolarization and the afterhyperpolarization in neostriatal neuronsJournal of Neurophysiology 68:287–294.
-
The human obesity epidemic, the mismatch paradigm, and our modern "captive" environmentAmerican Journal of Human Biology 24:116–122.https://doi.org/10.1002/ajhb.22236
-
Low access resistance perforated patch recordings using amphotericin BJournal of Neuroscience Methods 37:15–26.https://doi.org/10.1016/0165-0270(91)90017-T
-
Mitochondria as sensors and regulators of calcium signallingNature Reviews Molecular Cell Biology 13:566–578.https://doi.org/10.1038/nrm3412
-
Endoplasmic reticulum-mitochondria contacts: function of the junctionNature Reviews Molecular Cell Biology 13:607–625.https://doi.org/10.1038/nrm3440
-
Calcium-activated potassium currents in mammalian neuronsClinical and Experimental Pharmacology and Physiology 27:657–663.https://doi.org/10.1046/j.1440-1681.2000.03317.x
-
Calcium uptake mechanisms of mitochondriaBiochimica Et Biophysica Acta (BBA) - Bioenergetics 1797:907–912.https://doi.org/10.1016/j.bbabio.2010.01.005
-
Neuronal circuits that regulate feeding behavior and metabolismTrends in Neurosciences 36:504–512.https://doi.org/10.1016/j.tins.2013.05.003
-
Extracellular calcium modulates persistent sodium current-dependent burst-firing in hippocampal pyramidal neuronsJournal of Neuroscience 21:4173–4182.
-
Small conductance calcium-activated potassium channels: from structure to functionProgress in Neurobiology 91:242–255.https://doi.org/10.1016/j.pneurobio.2010.03.002
-
Differential expression of the small-conductance, calcium-activated potassium channel SK3 is critical for pacemaker control in dopaminergic midbrain neuronsJournal of Neuroscience 21:3443–3456.
-
Paxilline inhibits BK channels by an almost exclusively closed-channel block mechanismThe Journal of General Physiology 144:415–440.https://doi.org/10.1085/jgp.201411259
-
Redox regulation of cardiac calcium channels and transportersCardiovascular Research 71:310–321.https://doi.org/10.1016/j.cardiores.2006.02.019
Article and author information
Author details
Funding
Boehringer Ingelheim Fonds (Fellowship)
- Moritz Paehler
CECAD
- Jens C Brüning
- Peter Kloppenburg
Max-Planck-Gesellschaft
- Jens C Brüning
Deutsche Forschungsgemeinschaft (TR-SFB 134/TP A03)
- Peter Kloppenburg
Deutsche Forschungsgemeinschaft (SFB 1218/TP B07)
- Peter Kloppenburg
The funders had no role in study design, data collection and interpretation, or the decision to submit the work for publication.
Acknowledgements
We would like to thank Helmut Wratil for excellent technical assistance.
Ethics
Animal experimentation: All animal procedures were conducted in compliance with guidelines approved by local government authorities (8.87-51.05.20.09.208, 84-02.05.20.12.254, 8.87-50.10.31.08.279, 84-02.04.2014.A511) (LANUV NRW, Recklinghausen, Germany) and were in accordance with NIH guidelines.
Copyright
© 2017, Paeger et al.
This article is distributed under the terms of the Creative Commons Attribution License, which permits unrestricted use and redistribution provided that the original author and source are credited.
Metrics
-
- 2,120
- views
-
- 411
- downloads
-
- 58
- citations
Views, downloads and citations are aggregated across all versions of this paper published by eLife.
Citations by DOI
-
- 58
- citations for umbrella DOI https://doi.org/10.7554/eLife.25641
Download links
A two-part list of links to download the article, or parts of the article, in various formats.
Downloads (link to download the article as PDF)
Open citations (links to open the citations from this article in various online reference manager services)
Cite this article (links to download the citations from this article in formats compatible with various reference manager tools)
Energy imbalance alters Ca2+ handling and excitability of POMC neurons
eLife 6:e25641.
https://doi.org/10.7554/eLife.25641
Further reading
-
- Neuroscience
In the arcuate nucleus of the hypothalamus (ARH) satiety signaling (anorexigenic) pro-opiomelanocortin (POMC)-expressing and hunger signaling (orexigenic) agouti-related peptide (AgRP)-expressing neurons are key components of the neuronal circuits that control food intake and energy homeostasis. Here, we assessed whether the catecholamine noradrenalin directly modulates the activity of these neurons in mice. Perforated patch clamp recordings showed that noradrenalin changes the activity of these functionally antagonistic neurons in opposite ways, increasing the activity of the orexigenic NPY/AgRP neurons and decreasing the activity of the anorexigenic POMC neurons. Cell type-specific transcriptomics and pharmacological experiments revealed that the opposing effect on these neurons is mediated by the activation of excitatory α1A - and β- adrenergic receptors in NPY/AgRP neurons, while POMC neurons are inhibited via α2A – adrenergic receptors. Thus, the coordinated differential modulation of the key hypothalamic neurons in control of energy homeostasis assigns noradrenalin an important role to promote feeding.


