The force-sensing peptide VemP employs extreme compaction and secondary structure formation to induce ribosomal stalling
- Ludwig Maximilian University of Munich, Germany
- Stockholm University, Sweden
- Science for Life Laboratory Stockholm University, Sweden
- University of Hamburg, Germany
Figures
Figure 1 with 3 supplements
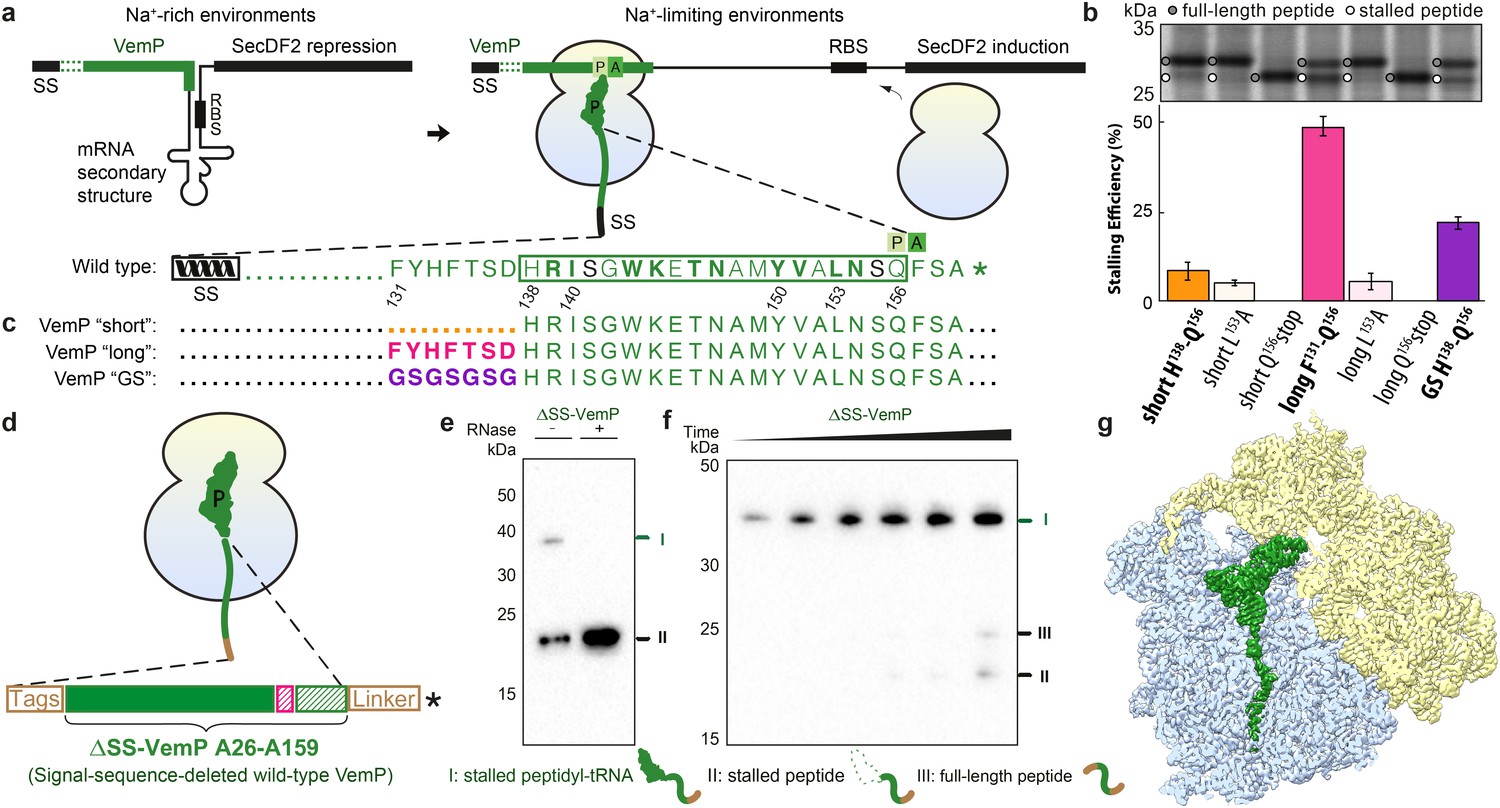
Biochemical and structural analysis of VemP stalling.
(a) Schematic representation of the VemP-SecDF2 mRNA encoding VemP leader peptide with N-terminal signal sequence (SS) and C-terminal stalling region (green), followed by a stem-loop structure that sequesters the ribosome-binding site (RBS) of the SecDF2 gene (left). The translation arrest of VemP maintains the unfolded conformation of the mRNA allowing ribosome binding and induction of SecDF2 expression. The VemP stalling window H138–Q156 (boxed) is shown with critical (green bold) and important (green) residues highlighted (Ishii et al., 2015), and an asterisk indicating the stop codon (right). (b–c) In vivo pulse-chase analysis with different VemP constructs; VemP ‘short’ (H138–Q156, orange), VemP ‘long’ (F131–Q156, pink), VemP ‘GS’ (purple) and VemP mutants L153A and Q156*. (d) Schematic of the VemP-SRC used for cryo-EM. (e–f) Western blot against the N-terminal HA-tag of in vitro translated ∆SS-VemP detecting stalled peptidyl-tRNA (I), stalled free peptide (II) or full-length free peptide (III), (e) in the absence and presence of RNase A treatment, or (f) as a function of time (25, 40, 55, 70, 85, 100 min). (g) Transverse section of cryo-EM structure of the VemP-SRC showing the peptidyl-tRNA (green), with small and large subunits coloured in yellow and blue, respectively.
Figure 1—figure supplement 1
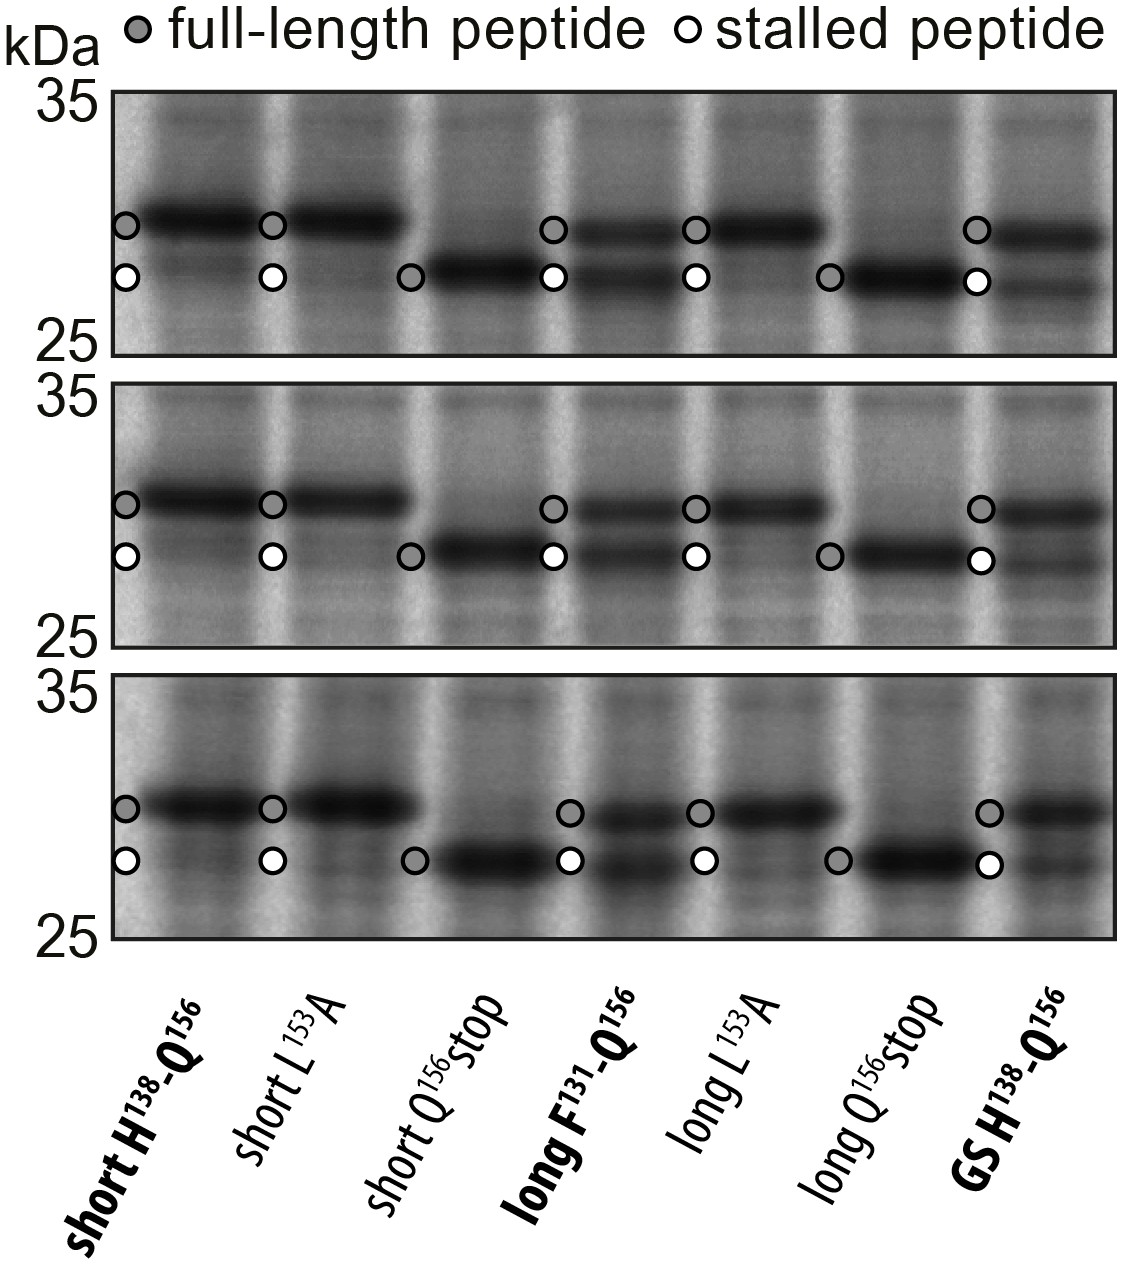
Triplicates of the pulse-chase analysis.
In vivo pulse-chase analysis with different VemP constructs; VemP ‘short’ (H138–Q156), VemP ‘long’ (F131–Q156), VemP ‘GS’ and VemP mutants L153A and Q156*. The triplicate data are from different colonies, preparations of medium and gels.
Figure 1—figure supplement 2

Classification of the VemP-SRC.
A total of 850,433 extracted particles were subjected to 2D classification with 8 x binned images, 200 initial classes and 100 rounds in order to filter away non-particle contaminants. A subset of 789,006 particles was then aligned to a low-resolution (60 Å) E. coli 70S ribosome reference followed by refinement with non-binned images. Subsequently, focused sorting was performed with five classes and 64 rounds using a spherical mask covering the A- and P-tRNAs. The focused sorting resulted in one major class with a highly resolved P-tRNA. This subset with 644,577 particles was further sorted using a ribosomal mask for 58 rounds with four output classes, yielding two classes having improved occupancy of the P-tRNA. The class with higher resolution and quantity in particles (400,024, 62%) was then subjected to the final refinement and reconstruction.
Figure 1—figure supplement 3
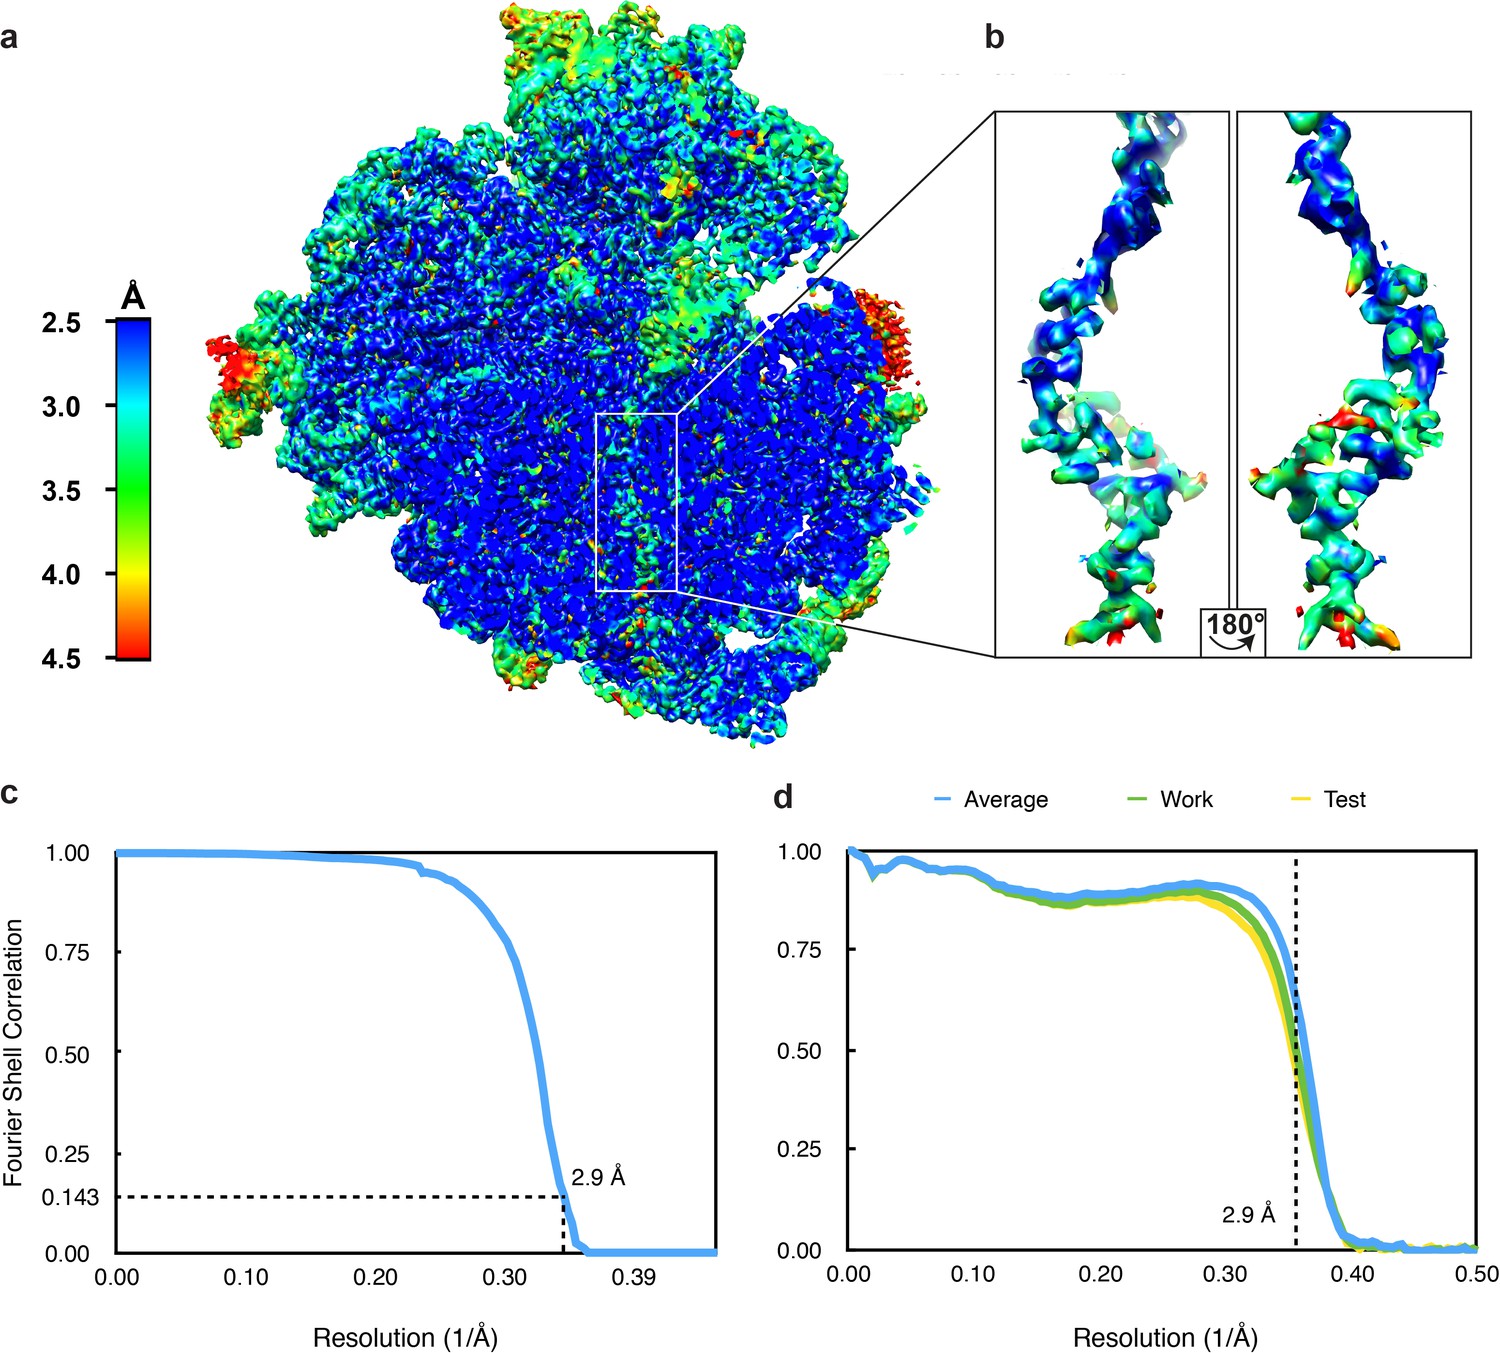
Resolution of the VemP-SRC.
(a) Transverse section of the VemP-SRC showing local resolution of the VemP nascent chain within the ribosomal tunnel. (b) Zoomed-in view of the extracted VemP nascent chain coloured according to local resolution. (c) Fourier-shell correlation (FSC) curve of the refined final map of the VemP-SRC, indicating the average resolution is 2.9 Å (at 0.143). (d) Fit of models to maps. FSC curves calculated between the refined model and the final map (blue), with the self- and cross-validated correlations in green and yellow, respectively.
Figure 2
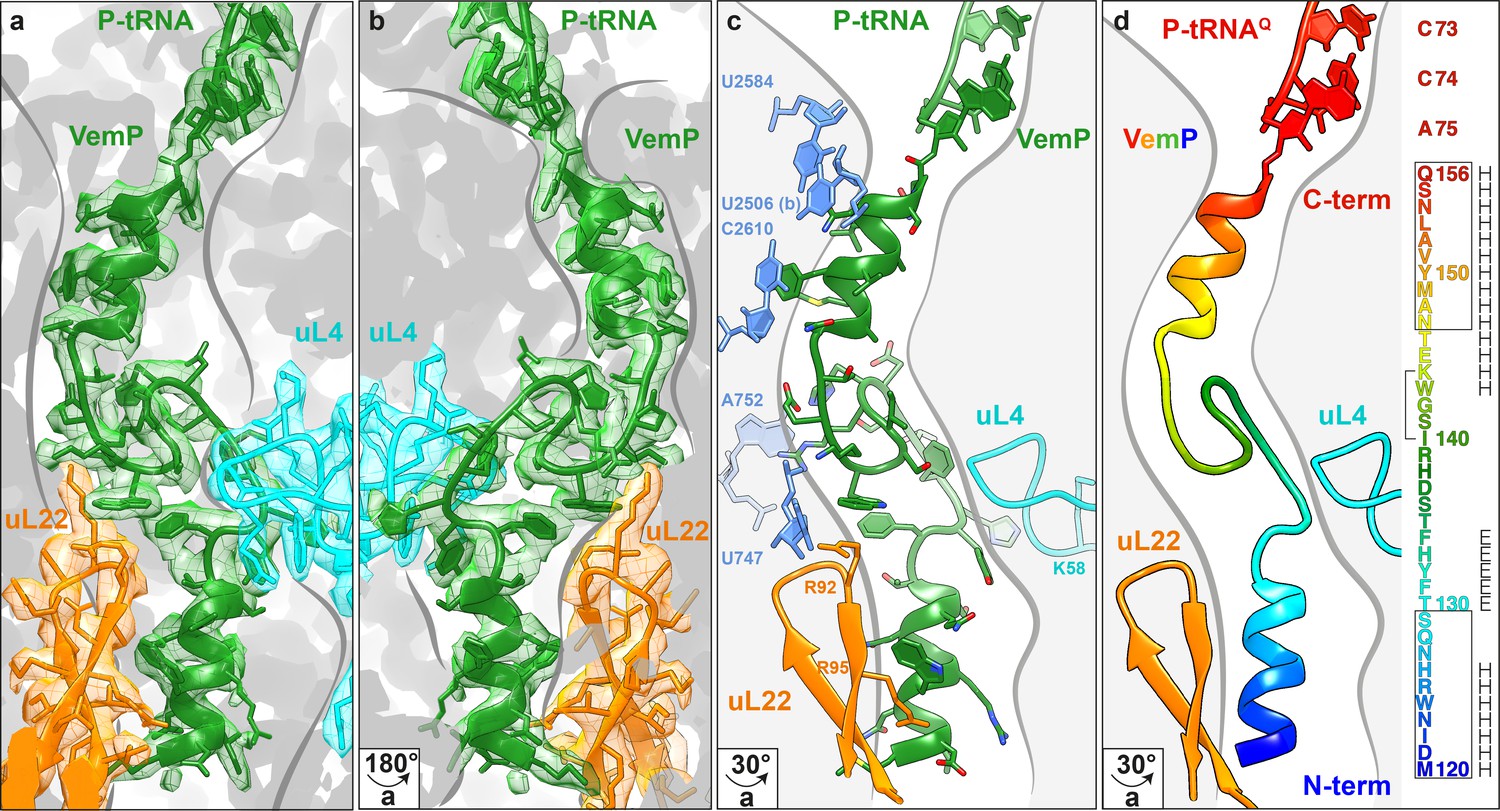
Overview of the VemP nascent chain in the ribosomal tunnel.
(a–b) Isolated electron density and molecular model for the VemP nascent chain connected to the P-tRNA (green) in the ribosomal tunnel (grey) with ribosomal proteins uL4 (cyan) and uL22 (orange) highlighted. (b) is the same as (a) but rotated by 180°. (c) Model of the VemP nascent chain in the ribosomal tunnel highlighting ribosomal components that interact with VemP, namely, nucleotides of the 23S rRNA (blue) and ribosomal proteins uL4 (cyan) and uL22 (orange). (d) Rainbow representation of the VemP nascent chain with sequence coloured accordingly. The upper and lower α-helices of VemP are boxed and the α-turn in the linking loop region is bracketed. Secondary structure predictions for VemP are indicated with H (helix) and E (loop region).
Figure 3
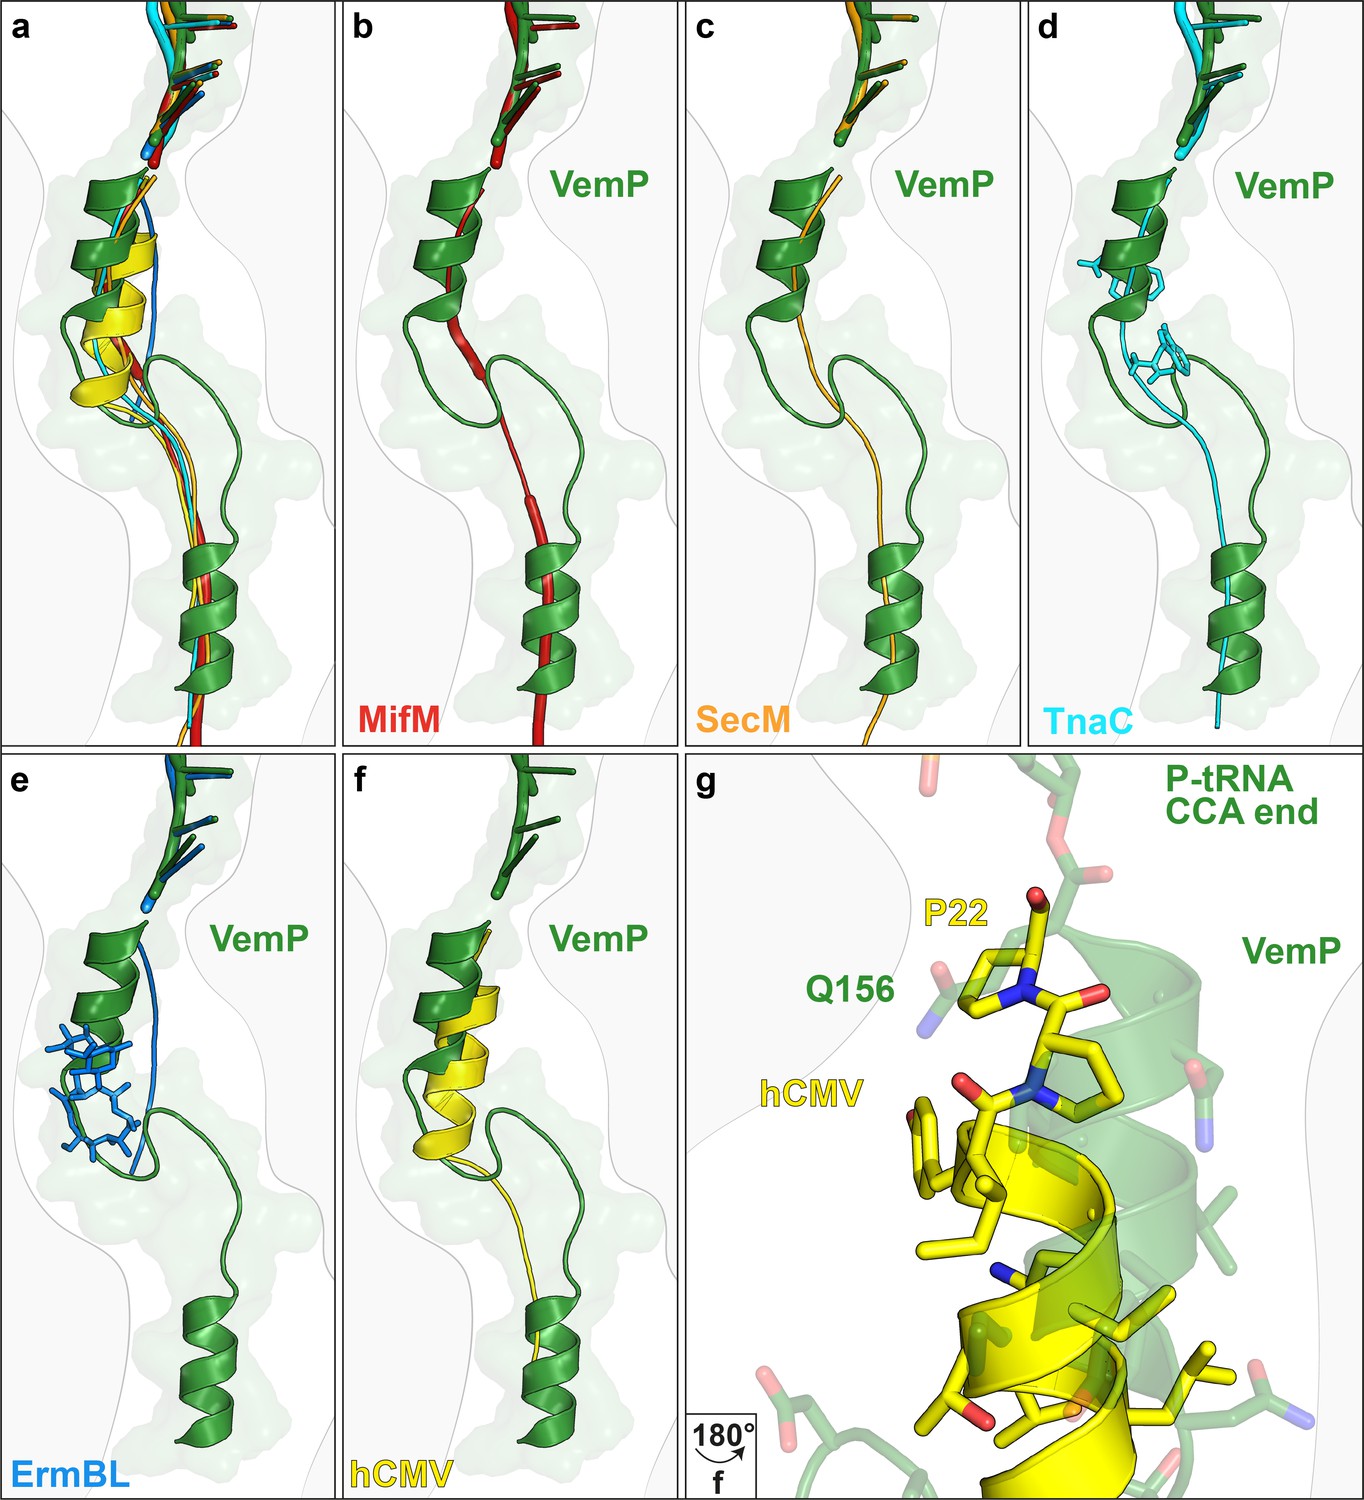
Comparison of the VemP nascent chain in the ribosomal tunnel with other stalling peptides.
(a) Overall superposition of VemP (model in green, surface in light green) with MifM (red, PDB ID 3J9W) (Sohmen et al., 2015), SecM (orange, PDB ID 3JBU) (Zhang et al., 2015), hCMV (yellow, PDB ID 5A8L) (Matheisl et al., 2015), TnaC (cyan, PDB ID 4UY8) (Bischoff et al., 2014) and ErmBL (blue, PDB ID 5JU8)(Arenz et al., 2016) in the ribosomal tunnel (light grey). The CCA-end of the P-tRNA is shown for reference. The ribosomal tunnel is shown schematically in grey. (b–f) Superposition of VemP (green) with each arrest peptide described above. For (d) TnaC and (e) ErmBL, the two tryptophans (cyan) and the one erythromycin (blue) molecule are shown, respectively. (g) A zoomed-in view of (f) showing the superposition of VemP (green) and hCMV (yellow) in the C-terminal helical part including the side chains. The last residue, Q156 in case of VemP and P22 in case of hCMV, connecting to the CCA end of tRNA is labelled.
Figure 4
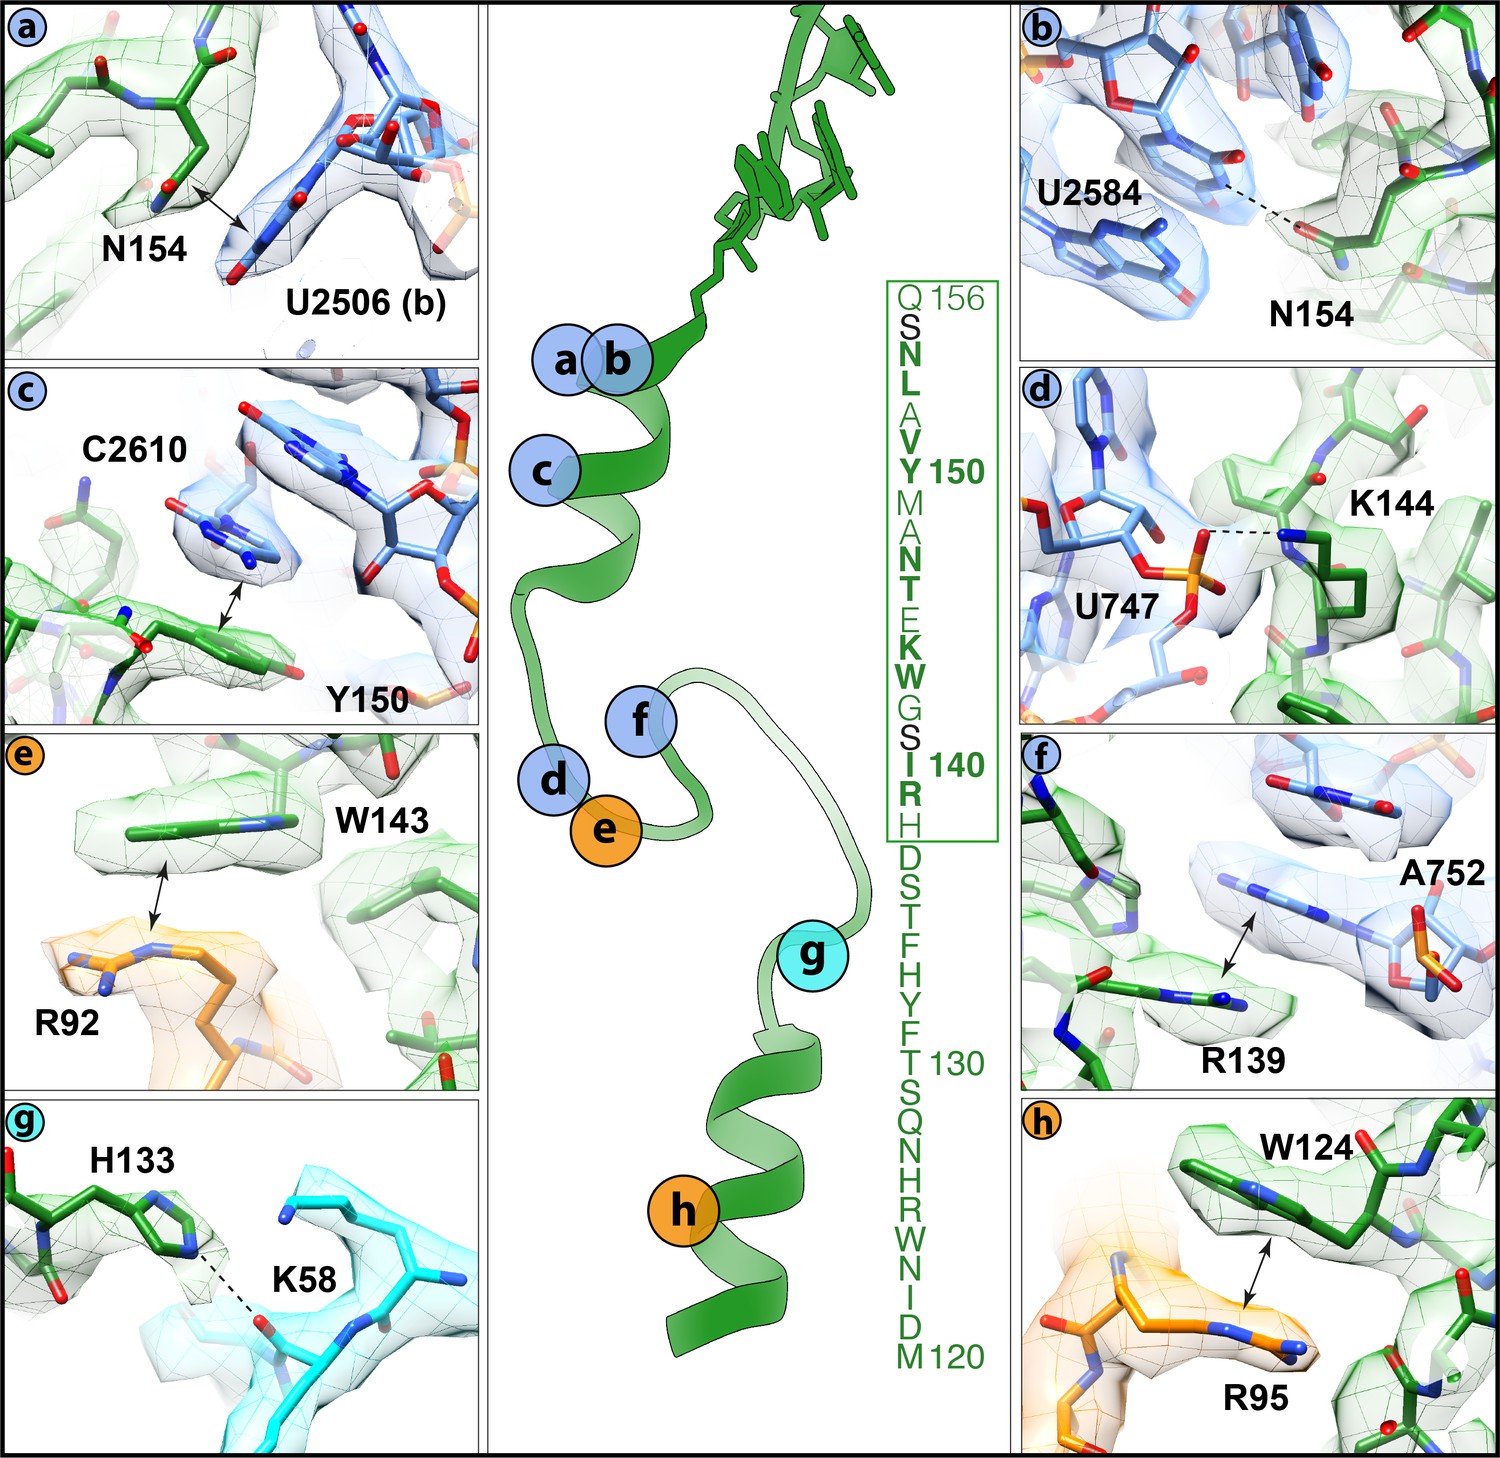
Interactions of the VemP nascent chain with the ribosomal tunnel (with density shown).
(a) N154 of VemP (green) stacks upon U2506(b) of the 23S rRNA (blue). (b) N154 of VemP is within hydrogen bond distance of nucleotide U2584. (c) Y150 of VemP stacks upon C2610. (d) K144 of VemP forms a salt bridge with U747. (e) W143 of VemP stacks with R92 of uL22 (orange). (f) R139 of VemP stacks upon A752. (g) W124 of VemP stacks upon R95 of uL22. (h) H133 of VemP interacts with K58 of uL4 (cyan). The middle panel maps the approximate locations of the interactions and includes the sequence of VemP with critical (bold) and important (boxed green) residues highlighted (Ishii et al., 2015). In panels (a–h) the electron density for the VemP-SRC map (mesh) is coloured according to either VemP (green), 23S rRNA (blue), uL4 (cyan) or uL22 (orange).
Figure 5
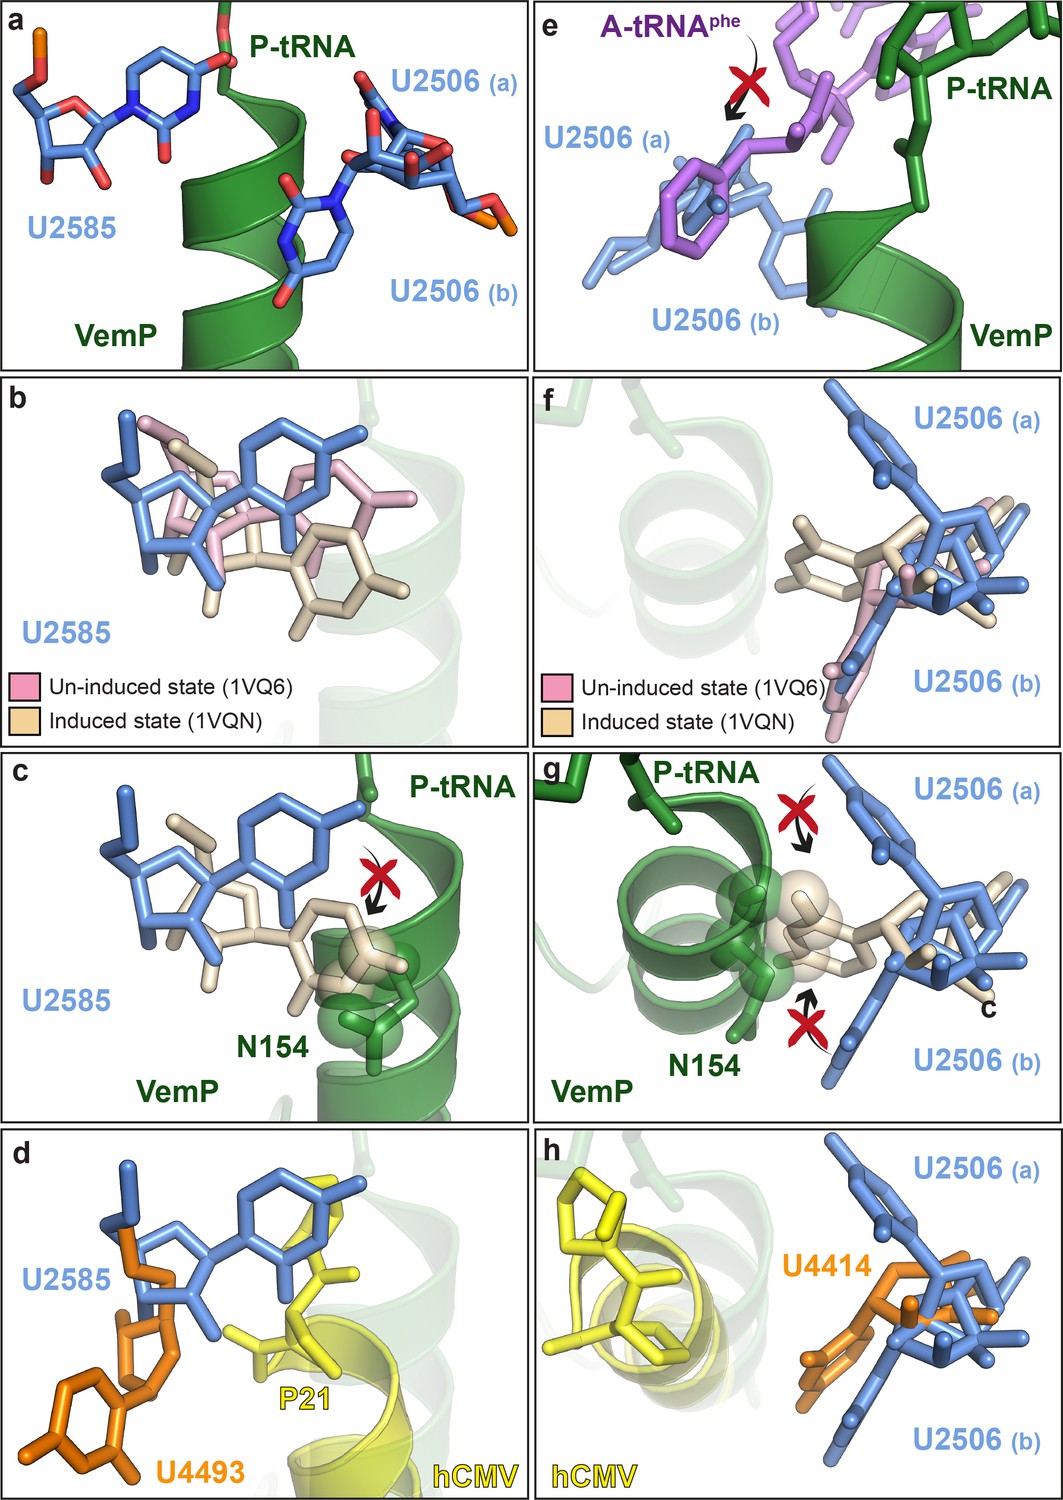
VemP stabilizes the uninduced state of the PTC to inhibit A-tRNA accommodation.
(a) Conformation of U2585 and U2506 relative to VemP (green) at the PTC of the VemP-SRC. (b) Conformation of U2585 (blue) in the VemP-SRC compared with the uninduced (pink, PDB ID 1VQ6) and induced (tan, PDB ID 1VQN) states (Schmeing et al., 2005). (c) N154 of the upper α-helix of VemP clashes (indicated by spheres) with the induced conformation of U2585 (Schmeing et al., 2005). (d) Conformation of human U4493 (orange, numbering according to PDB ID 5A8L and 5AJ0, being equivalent to U4531 in PDB ID 4UG0 and 4V6X) in the hCMV-SRC compared with E. coli U2585 (blue) in the VemP-SRC. (e) The U2506(a) conformation overlaps the binding position of an accommodated Phe-tRNA (purple) at the A-site of the PTC (Schmeing et al., 2005). (f) Conformation of U2506 in the VemP-SRC (blue) compared with the uninduced (pink) and induced (tan) states (Schmeing et al., 2005). (g) N154 of the upper α-helix of VemP clashes (indicated by spheres) with the induced conformation of U2506 (Schmeing et al., 2005). (h) Conformation of human U4414 (orange, numbering according to PDB ID 5A8L and 5AJ0, being equivalent to U4452 in PDB ID 4UG0 and 4V6X) in the hCMV-SRC compared with U2506 (blue) in the VemP-SRC. hCMV stalling peptide is shown in yellow in (d) and (h).
Figure 6
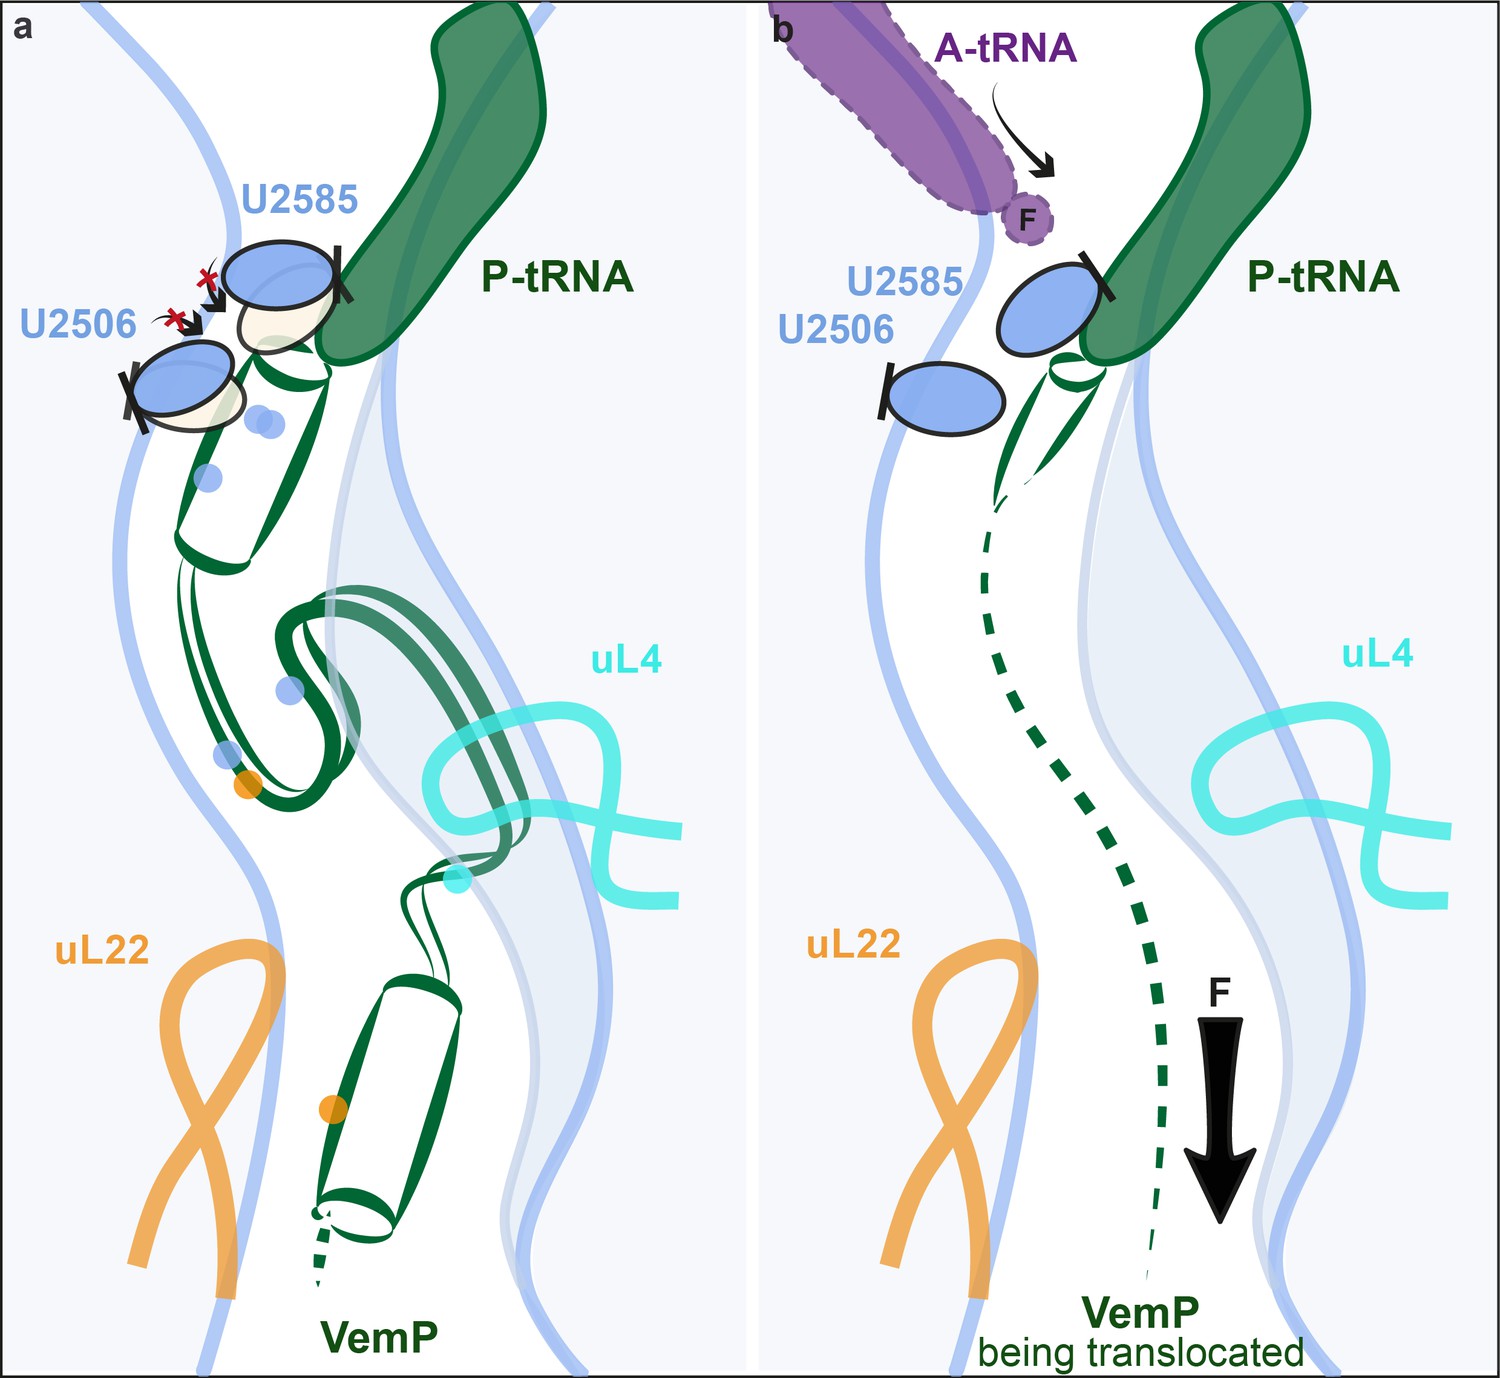
Model for VemP-mediated translation stalling and relief.
(a–b) Schematic summarizing the molecular basis for (a) VemP-dependent translation arrest and (b) relief of arrest via the pulling-force (indicated by arrow) on VemP protein translocation.
Videos
Video 1
Cryo-EM density and model for the VemP nascent chain.
Video showing the quality of the cryo-EM density (green mesh) and fit of the molecular model (green ribbon) of the VemP nascent chain and CCA-end of the P-tRNA.
Video 2
Cryo-EM density and model for α-turn and loop of the VemP nascent chain.
Video showing a zoom of the cryo-EM density (green mesh) and fit of the molecular model (stick representation) of the α-turn and loop of the VemP nascent chain.
Tables
Table 1
Refinement and Model Statistics.
| Data collection | |
|---|---|
| Particles | 400,024 |
| Pixel size (Å) | 1.084 |
| Defocus range (µm) | 1–2.5 |
| Voltage (kV) | 300 |
| Electron dose (e-/Å-2) | 25 |
| Model Composition | |
| Protein residues | 5615 |
| RNA bases | 4641 |
| Refinement | |
| Resolution (Å, 0.143 FSC) | 2.93 |
| Map sharpening B factor (Å2) | -162.55 |
| FSCAverage | 0.90 |
| Validation | |
| rmsd, bonds | 0.016 |
| rmsd, angles | 1.66 |
| Rotamers outliers (%) | 1.45 |
| Ramachandran outliers (%) | 1.00 |
| Ramachandran favoured (%) | 90.29 |
| Correct sugar puckers (%) | 98.77 |
| Good backbone conformations (%) | 81.74 |
| Scores | |
| MolProbity | 1.96 |
| Clash score, all atoms | 5.45 |
Download links
A two-part list of links to download the article, or parts of the article, in various formats.
Downloads (link to download the article as PDF)
Open citations (links to open the citations from this article in various online reference manager services)
Cite this article (links to download the citations from this article in formats compatible with various reference manager tools)
The force-sensing peptide VemP employs extreme compaction and secondary structure formation to induce ribosomal stalling
eLife 6:e25642.
https://doi.org/10.7554/eLife.25642


