Dynamics of BMP signaling and distribution during zebrafish dorsal-ventral patterning
- Friedrich Miescher Laboratory of the Max Planck Society, Germany
Figures
Figure 1 with 1 supplement
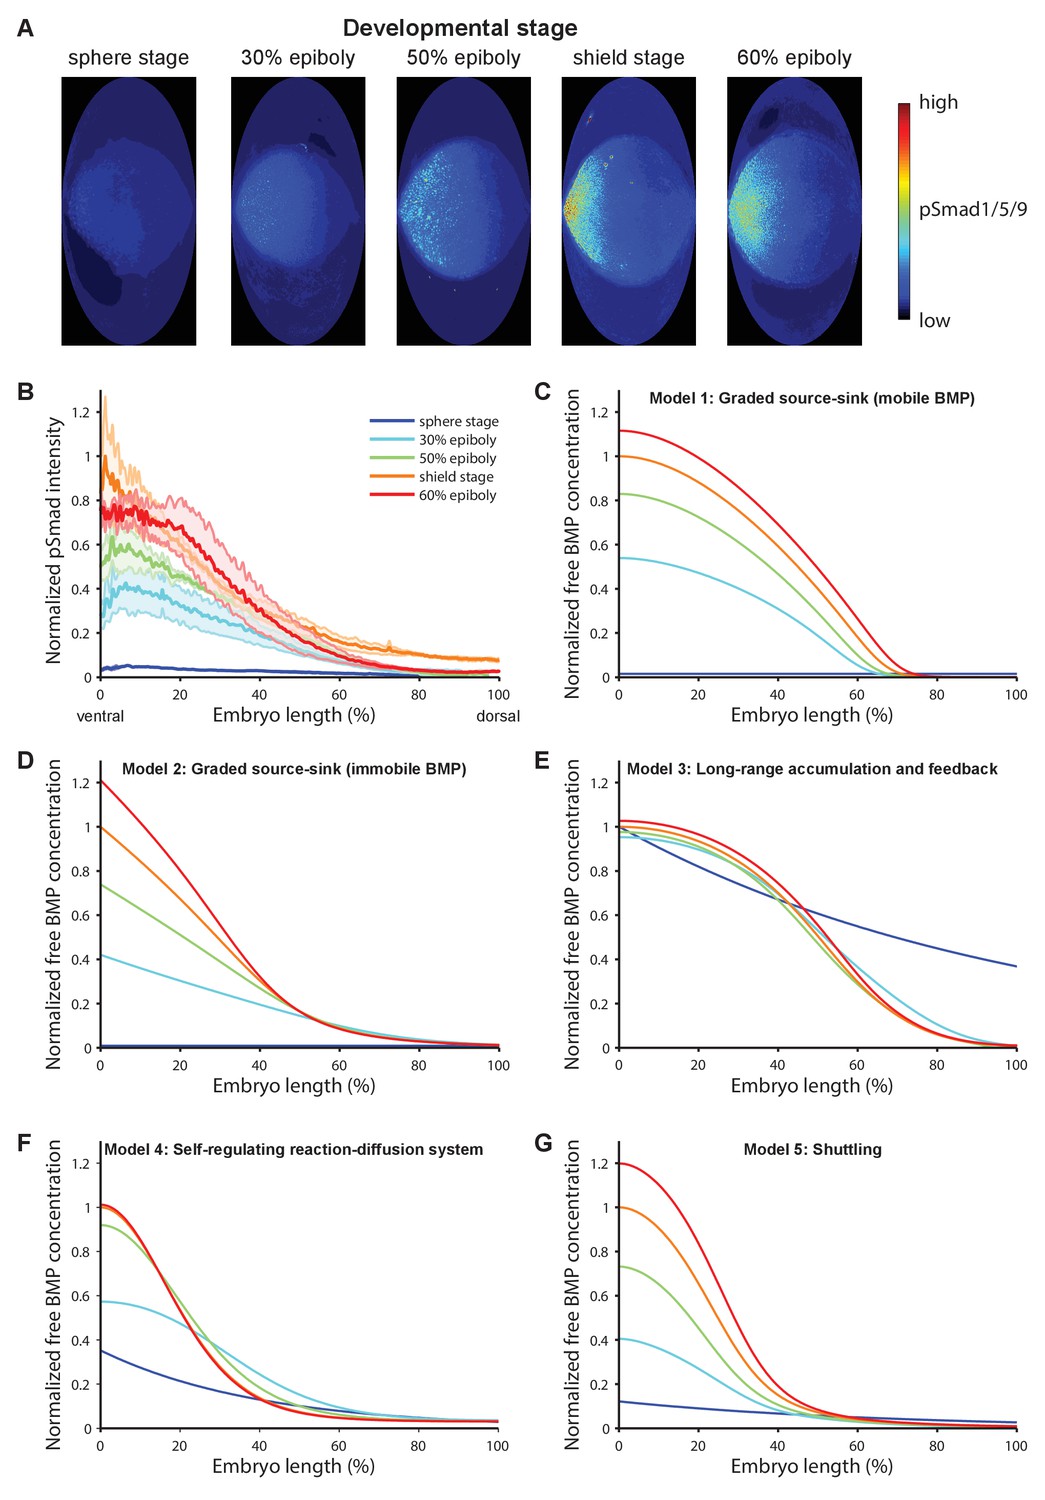
BMP signaling (pSmad1/5/9) gradient formation and simulations of five major dorsal-ventral patterning models over relevant zebrafish developmental stages (3 hr).
(A) Two-dimensional Hammer-Aitoff projections (2D maps) of pSmad1/5/9-immunostained individual wild type zebrafish embryos at different developmental stages. Embryos were imaged using light sheet microscopy (see Materials and methods for details). (B) Quantification of ventral-to-dorsal average pSmad1/5/9 distributions in one-dimensional projections of 2D maps generated for embryos at different developmental stages (n = 3 for each stage) as in (A). Error bars denote standard error. (C–G) Gradient formation kinetics simulated for Models 1–5 at relevant zebrafish developmental stages.
Figure 1—figure supplement 1
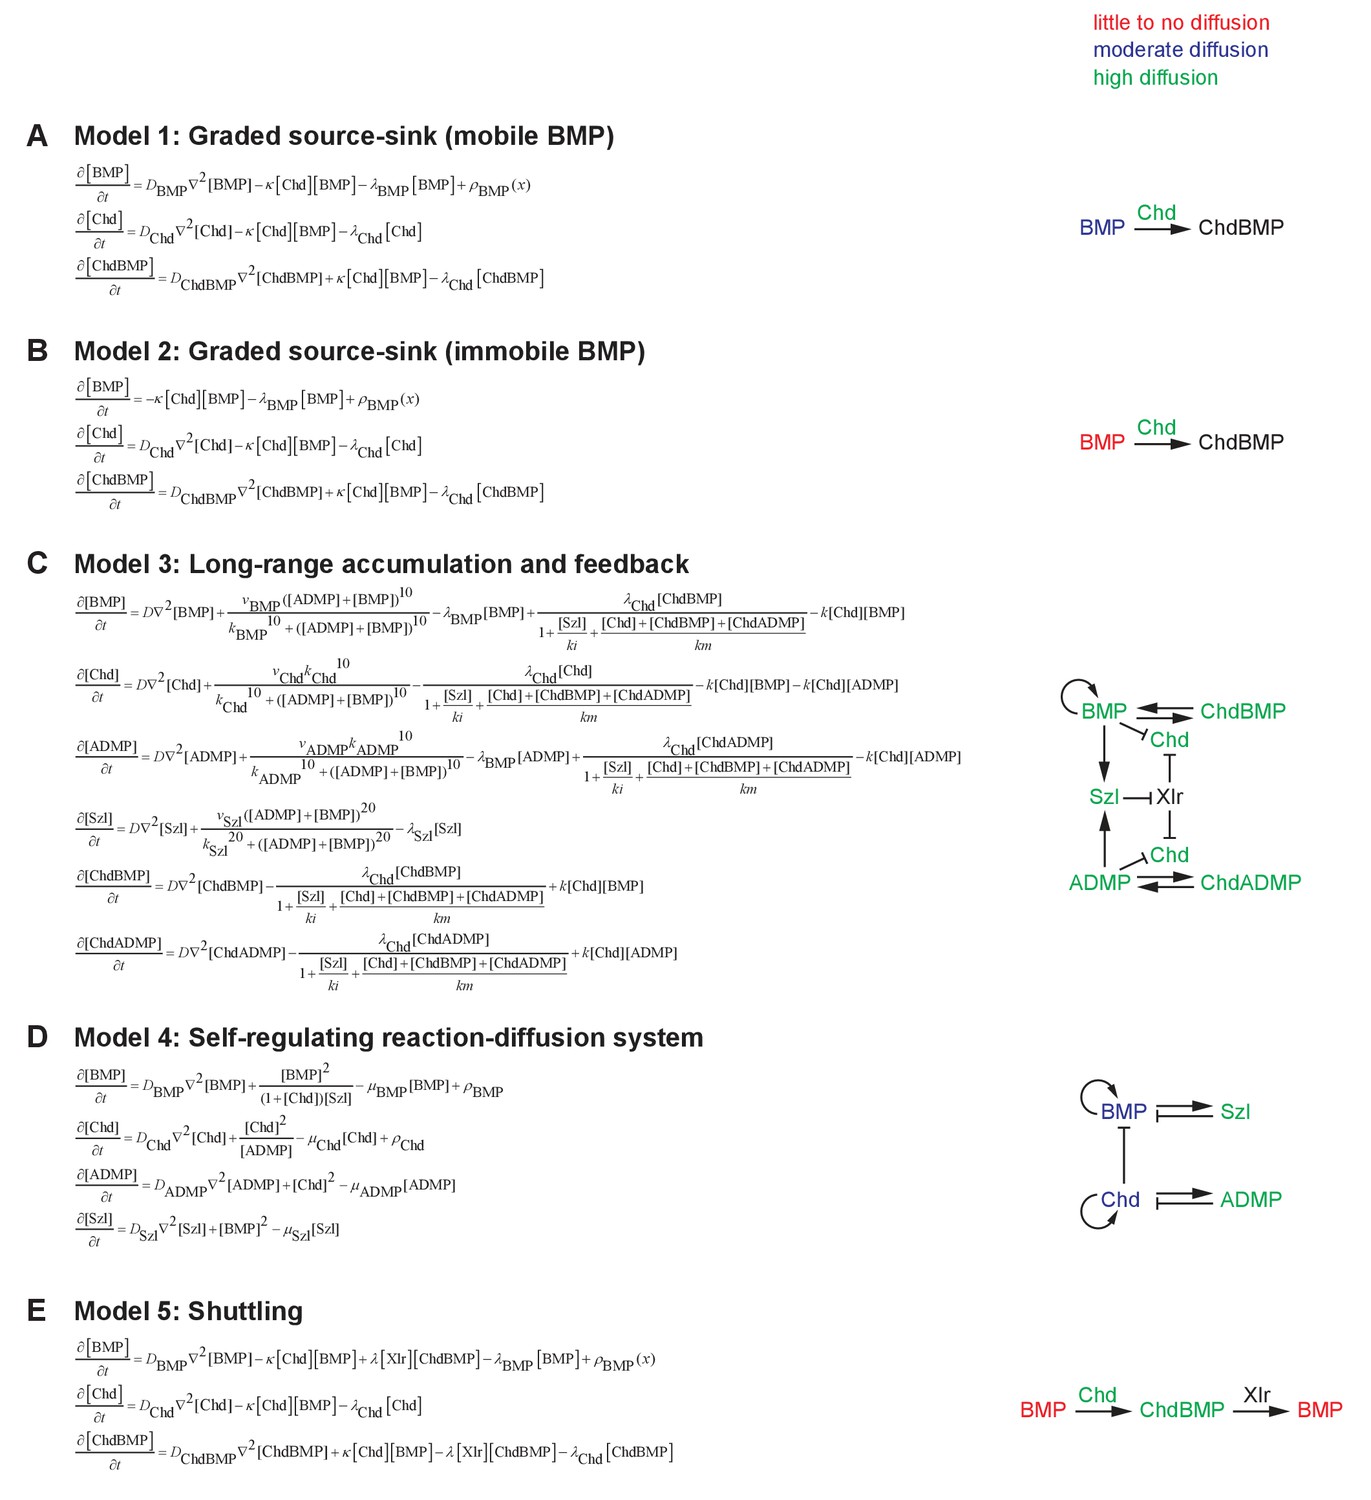
Mathematical formulation of five major models of BMP/Chordin-mediated dorsal-ventral patterning.
See Materials and methods for details. Selected essential features of the models are illustrated on the right. (A) Model 1: Graded source-sink (mobile BMP). In this model, BMP diffuses from a ventrally biased graded source, and Chordin produced from the dorsal side inhibits BMP by irreversible binding. (B) Model 2: Graded source-sink (immobile BMP). In this model, BMP diffusion is negligible (D = 0 μm2/s). The mechanism of restricting BMP signaling by Chordin irreversibly binding to BMP is the same as in Model 1, but with weaker binding kinetics. (C) Model 3: Long-range accumulation and feedback. Model and parameters were adapted from (Inomata et al., 2013). (D) Model 4: Self-regulating reaction-diffusion system. Model and parameters were adapted from (Francois et al., 2009). (E) Model 5: Shuttling. A simplified model without feedback to purely illustrate the biophysical aspects of shuttling was adapted from (Ben-Zvi et al., 2008).
Figure 2

Theoretical predictions for the influence of the inhibitor Chordin on the BMP signaling gradient and experimental test.
(A–E) Simulations of BMP distributions in five major models of dorsal-ventral patterning in the presence (black) or absence (red) of Chordin. The BMP and Chordin sources are indicated below each graph in green and blue, respectively. Note that the spatial production rates in Models 3 and 4 are modulated over time by feedback. (F–G) Quantification of average pSmad1/5/9 distributions in wild type (black) and chordin−/− (red) embryos using one-dimensional projections of 2D maps. Wild type n = 7, chordin−/− mutants n = 10. Error bars denote standard error. (H) p-values (unpaired two-tailed t-test assuming equal variance) calculated as a function of space between pSmad1/5/9 distributions in wild type and chordin−/− embryos shown in (F) indicate no significant difference of pSmad1/5/9 on the ventral side but a dramatic expansion into dorsal-lateral domains.
Figure 3 with 2 supplements
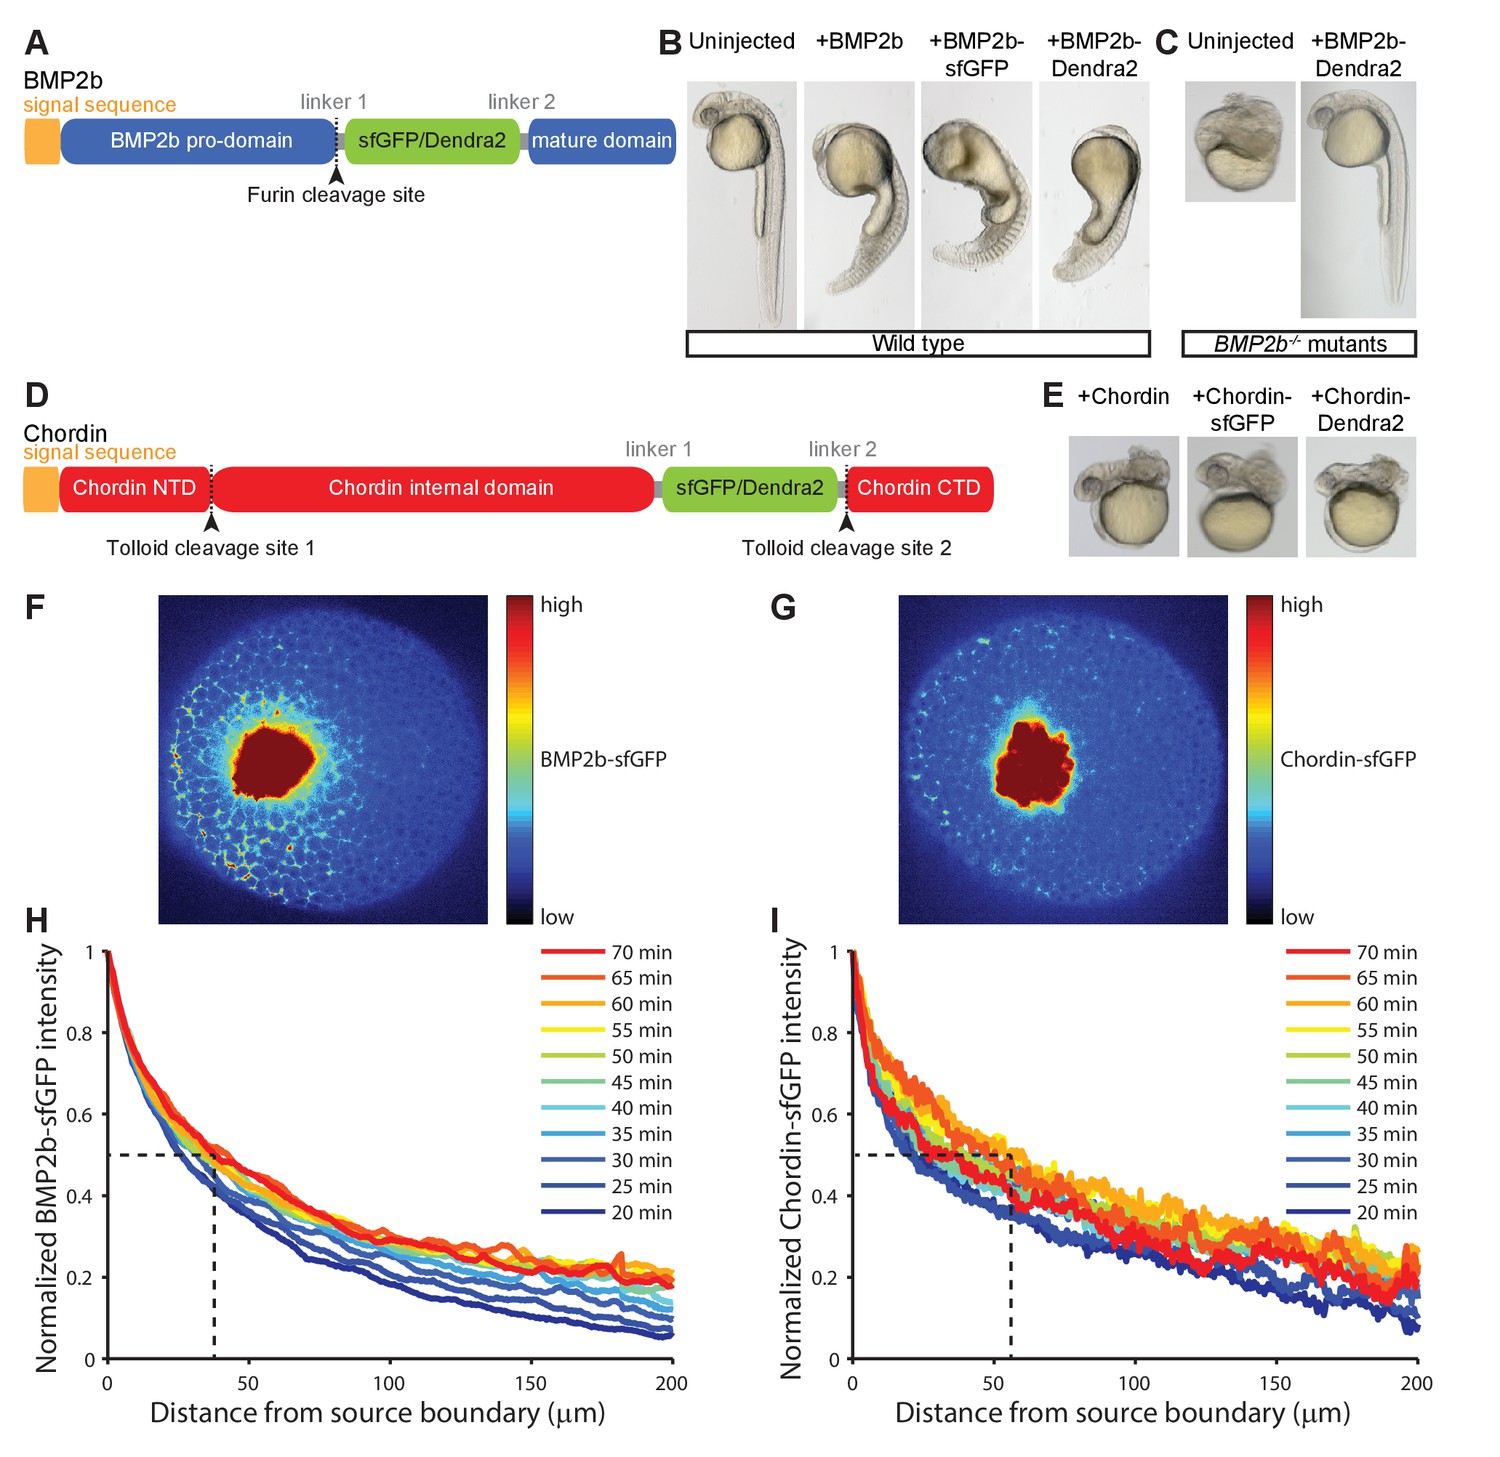
Gradient formation kinetics of fluorescently tagged BMP and Chordin.
(A) Schematic of BMP2b-sfGFP and -Dendra2 fusion constructs. (B) Fluorescent BMP2b fusion constructs can induce ventralization, a BMP-overexpression phenotype (Kishimoto et al., 1997). mRNA amounts equimolar to 2 pg of BMP2b mRNA were injected at the one-cell stage, and images were taken 30 hr post-fertilization (hpf). (C) Rescue of a BMP2b mutant (swr−/−) with BMP2b-Dendra2. 2.74 pg of BMP2b-Dendra2-encoding mRNA were injected at the one-cell stage, and images were taken at 30 hpf. In a separate experiment with 1 pg of BMP2b-sfGFP-encoding mRNA, 20% (9/44) of all injected swr−/− mutants were rescued, 16% (7/44) were ventralized, and 64% (28/44) were dorsalized. (D) Schematic of Chordin-sfGFP and -Dendra2 fusion constructs. (E) Fluorescent Chordin constructs can induce dorsalization, a Chordin-overexpression phenotype. mRNA amounts equimolar to 30 pg of Chordin mRNA were injected into wild type embryos at the one-cell stage, and images were taken at 30 hpf. F + G) Light sheet microscopy images of BMP- and Chordin-sfGFP gradients forming from a local source in live zebrafish embryos. Approximately 50–75 cells expressing BMP2b-sfGFP (F) or Chordin-sfGFP (G) were transplanted into host embryos at sphere stage (see Materials and methods for details). The images show gradient formation in single optical slices approximately 20 min after transplantation. H + I) Quantification of BMP2b-sfGFP (H) and Chordin-sfGFP (I) gradient formation kinetics from a local source (BMP2b-sfGFP: n = 8; Chordin-sfGFP: n = 5). Dashed lines indicate the distance at which the protein distributions drop to 50% of their maximal concentration 60 min post-transplantation.
Figure 3—figure supplement 1

Detailed characterization of fluorescently tagged BMP2b and Chordin.
(A) Ventralized and dorsalized phenotypes at 24 hr post-fertilization (hpf) were categorized using established classification schemes (Mullins et al., 1996; Kishimoto et al., 1997). (B) Embryos were injected with equimolar amounts of mRNA encoding BMP2b (1 pg, n = 102), BMP2b-sfGFP (1.49 pg, n = 101), and BMP2b-Dendra2 (1.47 pg, n = 107) at the one-cell stage. BMP2b-sfGFP induced stronger ventralization, and BMP2b-Dendra2 induced weaker ventralization compared to untagged BMP2b. (C) To determine whether the differences in the degree of ventralization (B) are due to changes in protein activity or protein levels, extracellularly enriched extracts were obtained from zebrafish embryos injected with mRNA amounts equimolar to 444 pg BMP2b-FLAG-encoding mRNA. Levels and processing of FLAG-tagged BMP ligands were assessed using anti-FLAG western blots. Green asterisks to the left of a band indicate properly processed mature BMP2b ligand; blue asterisks indicate unprocessed full-length pro-protein. Similar to FLAG-tagged BMP2b, FLAG-tagged BMP2b-sfGFP and -Dendra2 are properly processed and mostly secreted as mature ligands into the extracellular space. BMP2b-sfGFP-FLAG protein levels are higher compared to FLAG-tagged BMP2b, possibly owing to the rapid folding kinetics of sfGFP (Pédelacq et al., 2006); in contrast, BMP2b-Dendra2-FLAG levels are lower. The correlation between protein levels and activity (B) suggests that the fluorescent BMP2b constructs are equivalent to untagged BMP2b in inducing downstream signaling responses. (D) Phenotype distributions at 24 hpf. Zebrafish embryos were injected at the one-cell stage with equimolar amounts of mRNA encoding Chordin (30 pg, n = 41), Chordin-sfGFP (37 pg, n = 39), Chordin-Dendra2 (37 pg, n = 39), and Chordin-FLAG (30 pg, n = 33) (uninjected: n = 49). (E) Extracellularly enriched fractions were obtained from zebrafish embryos injected with mRNA equimolar to 500 pg of Chordin-FLAG-encoding mRNA. Levels and processing of FLAG-tagged Chordin constructs were assessed using anti-FLAG western blots. Green asterisks indicate properly processed mature Chordin; blue asterisks indicate unprocessed full-length protein. Similar to the correlation between BMP2b construct levels and ventralization activity, the dorsalization activity of Chordin constructs (D) is correlated with protein levels. (F–H) Distribution of BMP2b/Chordin-sfGFP in transplantation donors similar to those used in experiments shown in Figures 3 and 5 . Embryos were injected at the one-cell stage with 500 pg BMP2b-sfGFP- (G) or 1000 pg Chordin-sfGFP- (H) encoding mRNA (compare to uninjected embryo (F)). Embryos were imaged using light sheet microscopy at sphere stage (5–5.5 hpf), when transplantations were carried out in the experiments shown in Figures 3 and 5. Maximum intensity projections are shown.
Figure 3—figure supplement 2
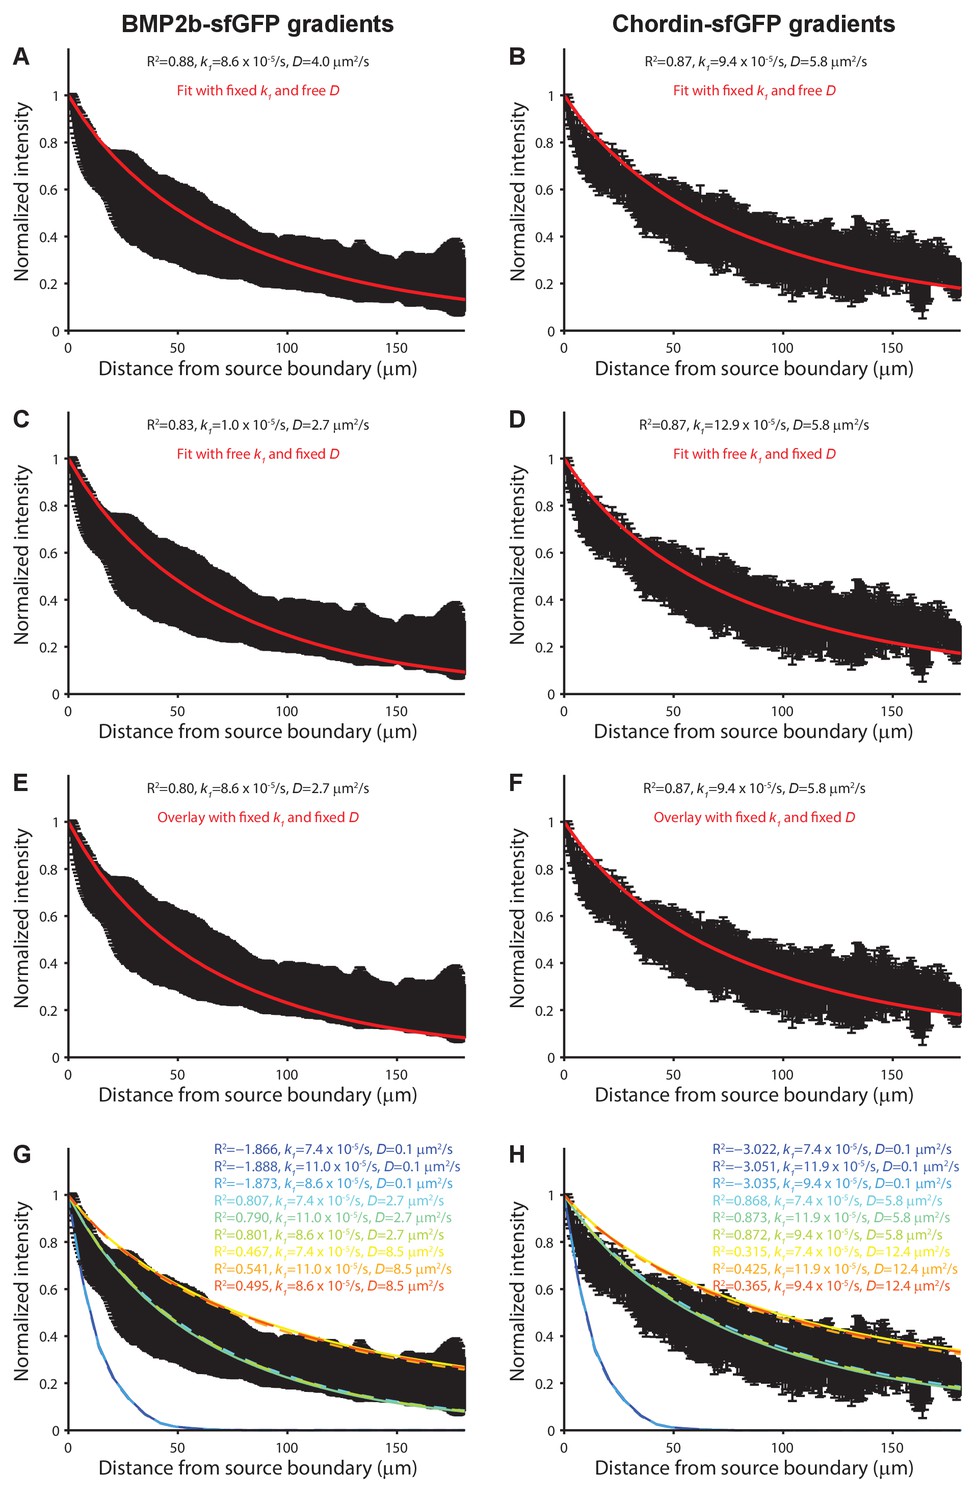
Modeling of BMP and Chordin gradient formation kinetics and comparison to measured gradients.
Gradient simulations were executed in a three-dimensional embryo-like geometry with a local production source and uniform diffusion and clearance as in (Müller et al., 2012). Gradient formation was simulated for 70 min and compared to gradients measured in vivo ≈70–75 min post-transplantation. A 50 by 50 logarithmically spaced parameter grid was simulated for diffusion coefficients (D) ranging from 0.1 to 50 µm2/s and clearance rate constants (k1) ranging from to 1 × 10⁻⁵/s to 5 × 10⁻⁴/s. The fits in (A) and (B) were constrained with the measured clearance rate constants of BMP2b-Dendra2 and Chordin-Dendra2 and fitted with D as the free parameter. The fits in (C) and (D) were constrained with the measured diffusion coefficients of fluorescent BMP2b and Chordin constructs and fitted with k1 as the free parameter. The data in (E) and (F) was overlaid with simulations using the measured D and k1 values. (G–H) Sensitivity analysis of gradient simulations with all combinations of measured D and k1 values as well as D and k1 values three standard deviations above and below the measured averages (rainbow colors) overlaid with the experimental data (black). R2 values indicate the goodness of the fit. Error bars denote standard deviation.
Figure 4 with 1 supplement
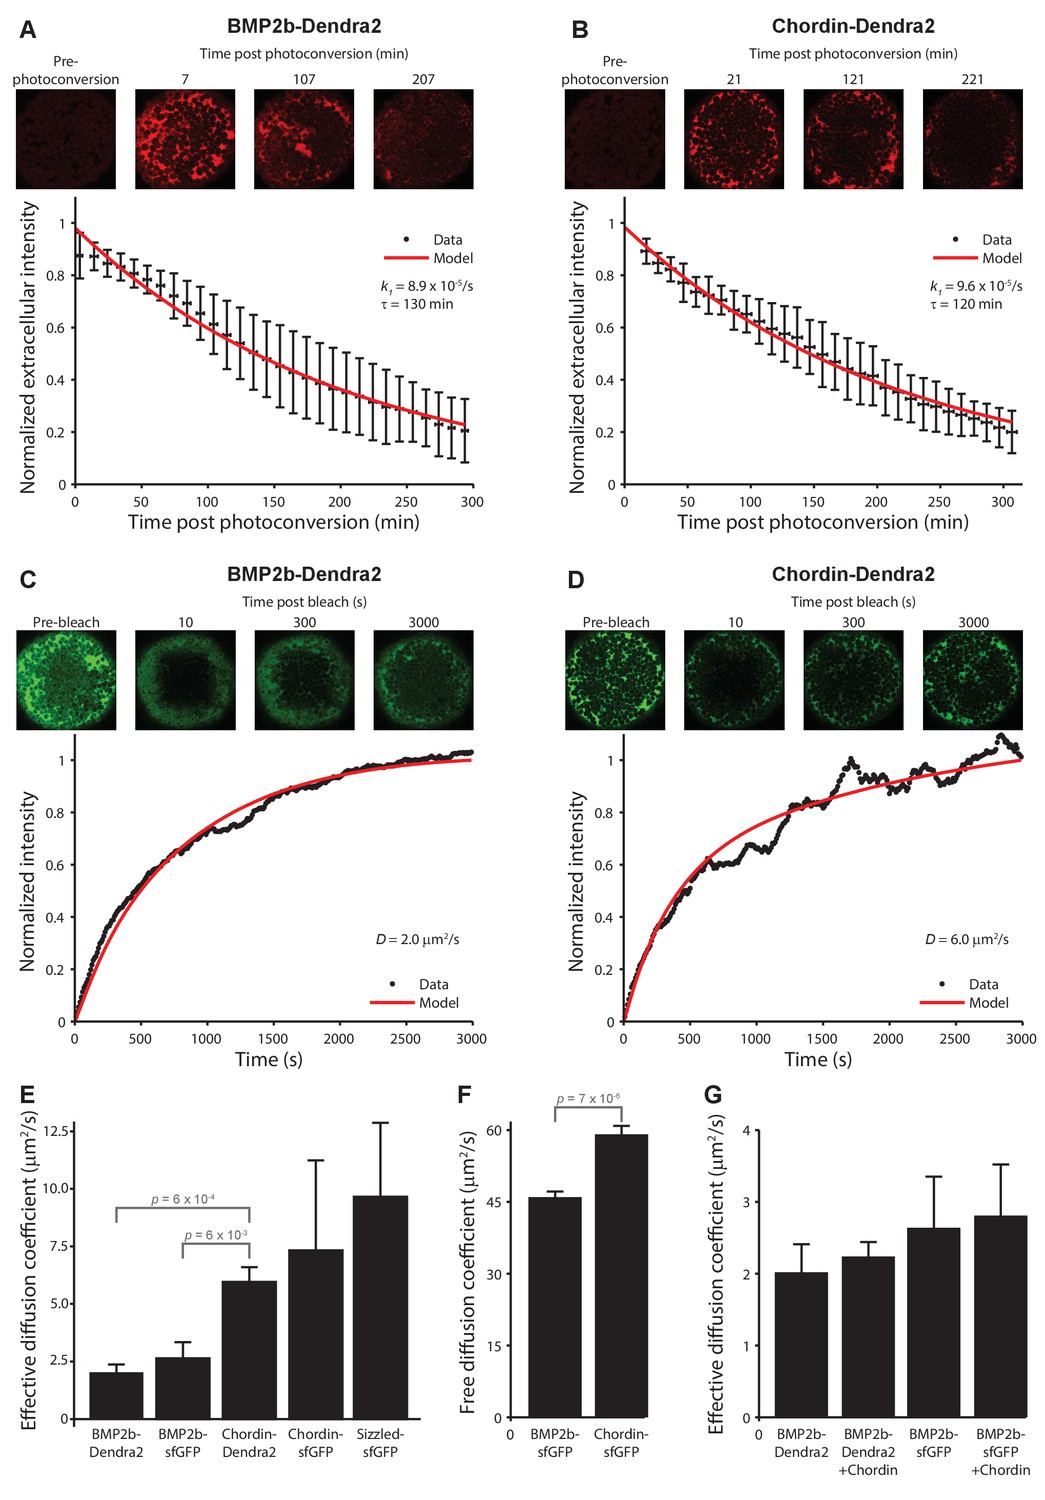
Biophysical measurements of BMP and Chordin protein stability and diffusivity.
A + B) FDAP protein stability measurements for BMP2b-Dendra2 (A) and Chordin-Dendra2 (B). Error bars denote standard deviation. BMP2b-Dendra2: n = 22; Chordin-Dendra2: n = 6. C + D) FRAP effective protein diffusivity measurements for BMP2b-Dendra2 (C) and Chordin-Dendra2 (D). Data and fits from single experiments are shown. (E) Bar chart of the average effective diffusion coefficients from FRAP experiments. Error bars denote standard error. BMP2b-Dendra2: n = 6; BMP2b-sfGFP: n = 8; Chordin-Dendra2: n = 8; Chordin-sfGFP: n = 6; Sizzled-sfGFP: n = 12. (F) Free diffusion coefficients of BMP2b-sfGFP and Chordin-sfGFP measured by Fluorescence Correlation Spectroscopy (FCS) in a diffraction-limited spot within the zebrafish embryonic extracellular space far away from cell membranes (see Materials and methods for details). Error bars denote standard error. BMP2b-sfGFP: n = 17 measurements from 4 embryos; Chordin-sfGFP: n = 19 measurements from 5 embryos. (G) Negligible influence of Chordin on BMP2b effective diffusion. Untagged Chordin was co-expressed with BMP2b-Dendra2 (n = 8) or BMP2b-sfGFP (n = 9) in zebrafish embryos subjected to FRAP measurements at blastula stages. The data shown for BMP2b-Dendra2 and BMP2b-sfGFP FRAP experiments without co-expressed Chordin is identical to the data shown in (E). p-values (unpaired two-tailed t-test assuming equal variance) are shown for statistically significant (p<0.05) data sets.
Figure 4—figure supplement 1
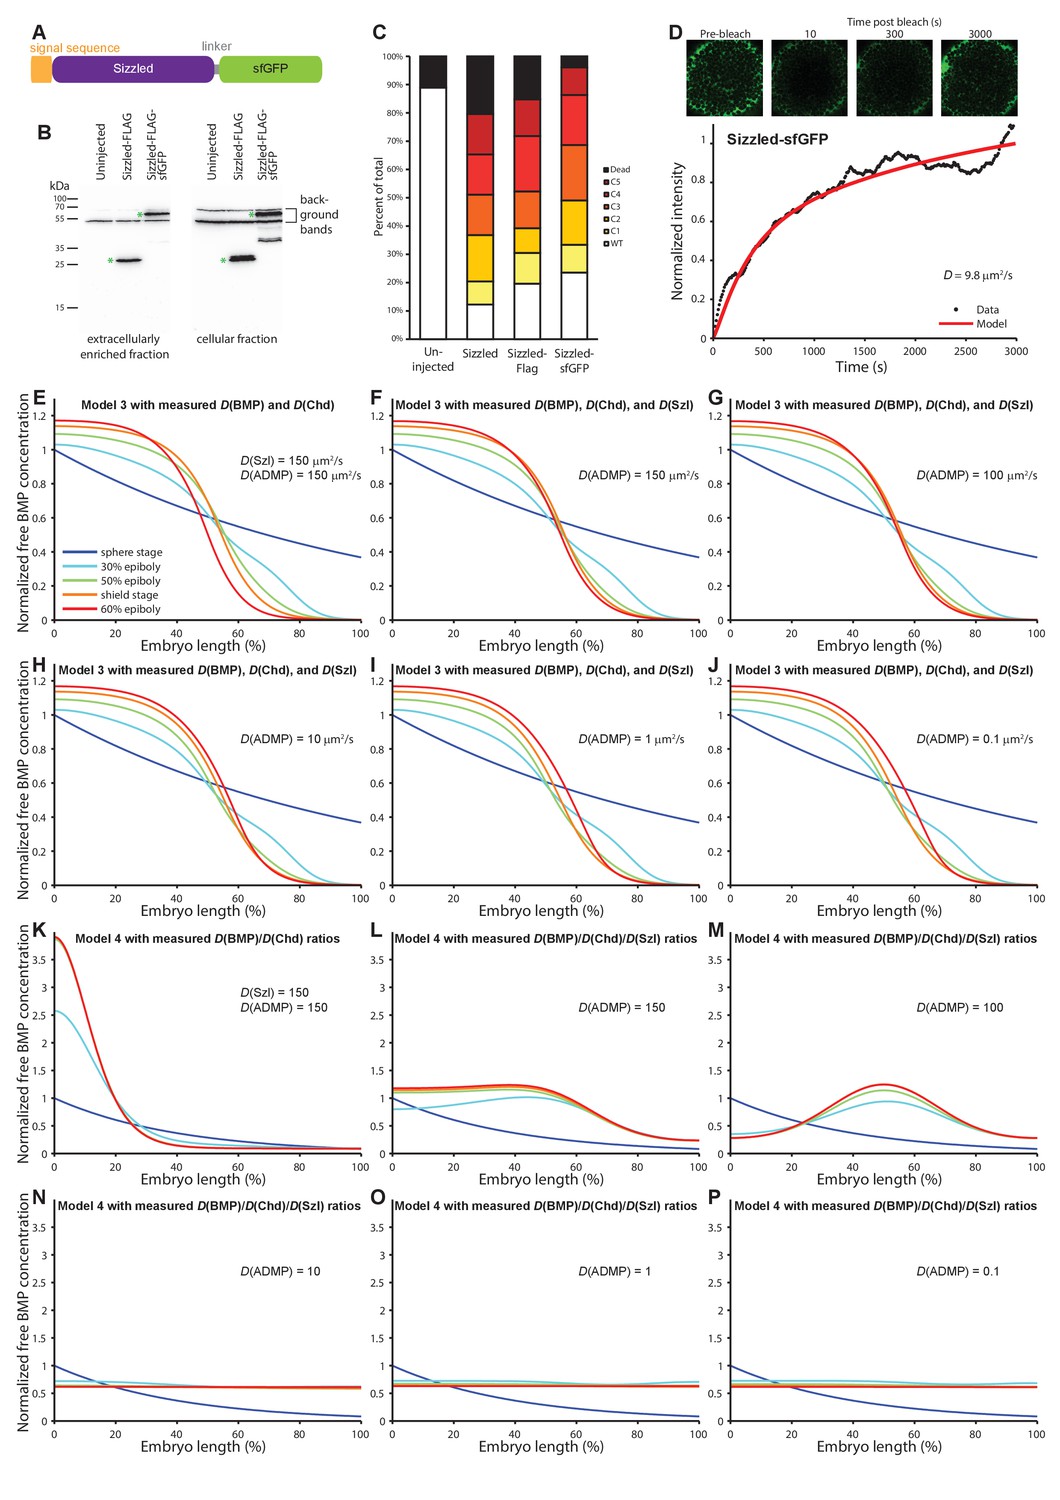
Characterization of Sizzled diffusion and its role in gradient formation.
(A) Schematic of the Sizzled-sfGFP fusion protein. (B) Anti-FLAG western blot analysis of Sizzled-sfGFP. Green asterisks indicate full-length Sizzled fusions. (C) Characterization of phenotypes after overexpression of Sizzled fusion proteins (mRNA injections at the one-cell stage equivalent to 1 pg sizzled mRNA; uninjected n = 45, Sizzled n = 49, Sizzled-FLAG n = 46, Sizzled-sfGFP n = 51). (D) FRAP analysis of Sizzled-sfGFP effective diffusion (D = 9.7 ± 3.2 µm2/s, n = 12). Data and fit from a single experiment is shown. (E–J) Simulations of Model 3 using the effective diffusion coefficients of BMP2b and Chordin measured here instead of the previously assumed value D = 15 µm2/s (Inomata et al., 2013). The diffusion coefficient of Sizzled was set to 150 µm2/s in (E) and to the measured value of 10 µm2/s in (F–J). ADMP diffusivity was varied from 0.1 µm2/s to 150 µm2/s as indicated in (E–J). Gradients form over time, but the gradient evolution profiles are not consistent with the pSmad1/5/9 distribution measurements in Figure 1B. (K–P) Simulations of Model 4 using the ratio of effective BMP/Chordin diffusion coefficients (i.e. Chordin is approximately two to three times more diffusive than BMP; D(BMP) = 3, D(Chordin) = 6) measured here. The diffusion coefficient of Sizzled was set to 150 in (K) as in (Francois et al., 2009) and to 10 in (L–P), reflecting the ~3 fold higher measured diffusivity of Sizzled compared to BMP2b. ADMP diffusivity was varied from 0.1 to 150 (Francois et al., 2009) as indicated in (K–P). With 50-fold higher diffusion coefficients for ADMP and Sizzled compared to BMP (K) gradients peaking on the ventral side form over time, but with realistic diffusion ratios relevant gradients do not form (L–P).
Figure 5
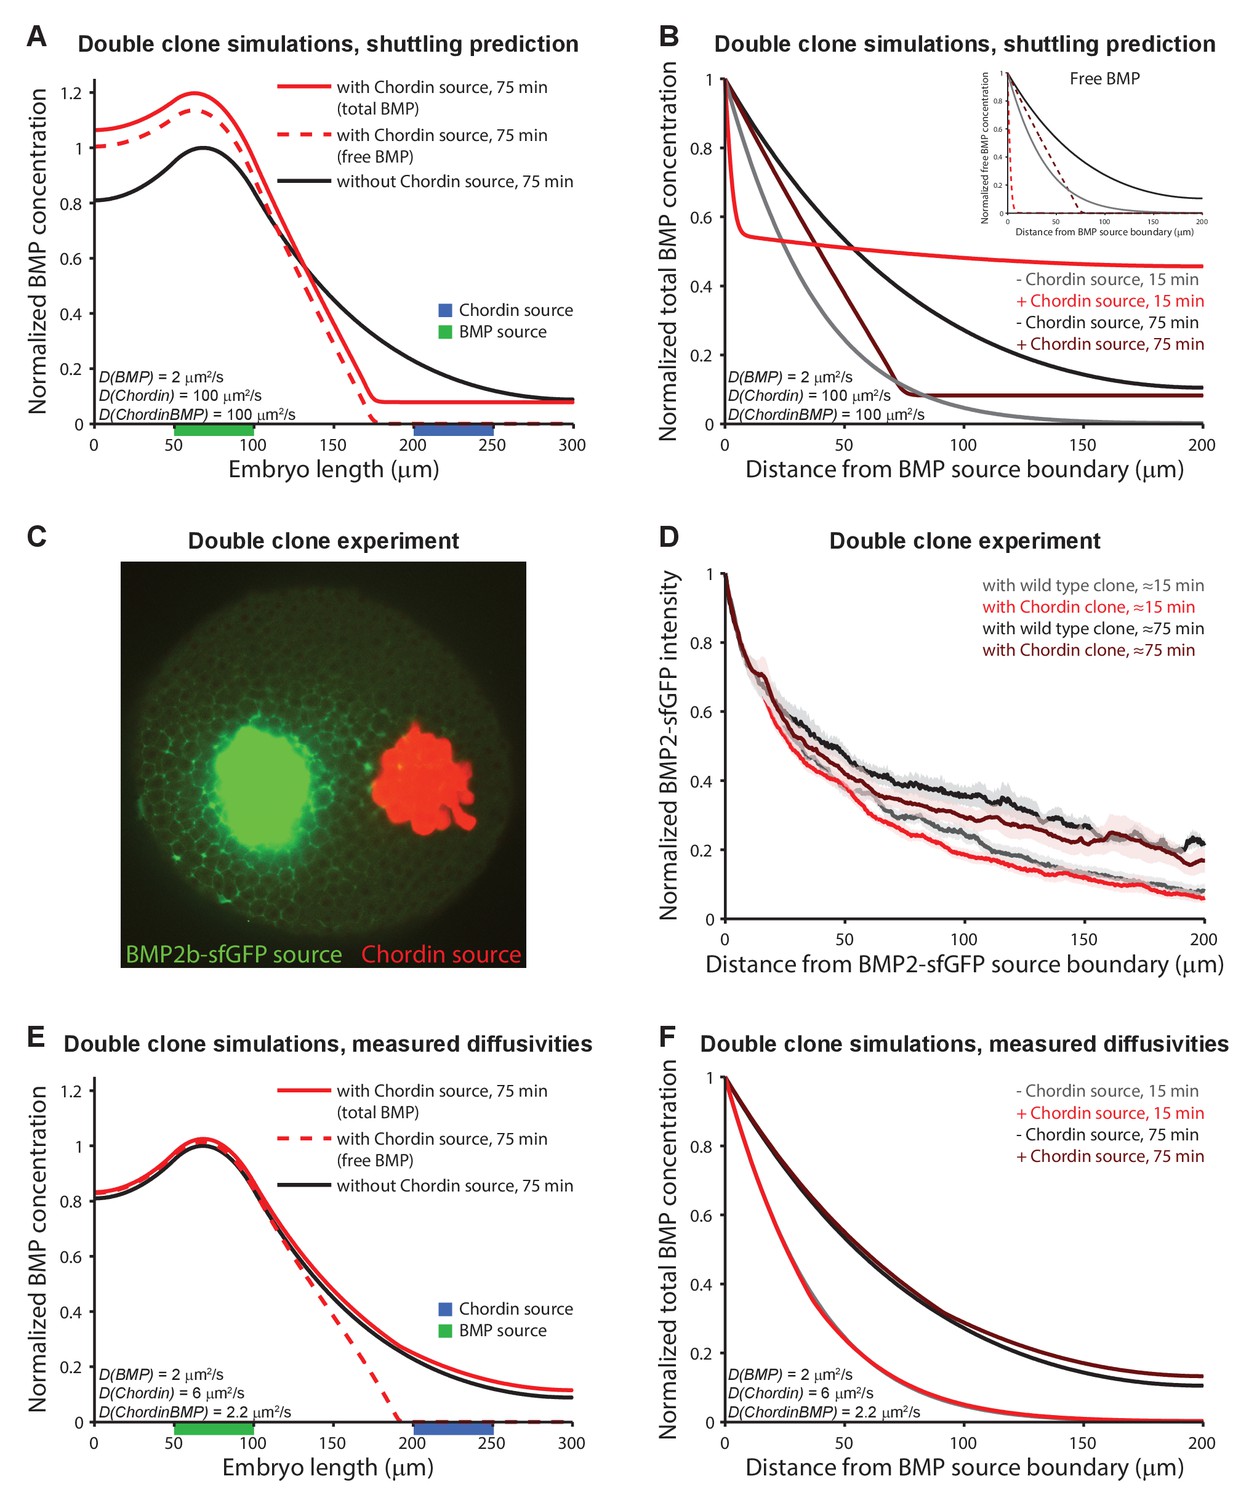
Testing shuttling of BMP2b predicted by Model 5.
(A) One-dimensional model of two clones expressing BMP (green) or Chordin (blue) with DBMP = 2 μm2/s, DChd = 100 μm2/s, and DChdBMP = 100 μm2/s. BMP levels increase over time due to constant production. In the presence of Chordin, the BMP gradient is deflected away from the Chordin source indicative of shuttling (compare black and red lines). Solid lines show total BMP levels (i.e. BMP + ChdBMP in the presence of Chordin), and dashed line shows free BMP levels. (B) BMP gradients to the right of the BMP-expressing clone re-normalized to the BMP concentration at the source boundary to demonstrate that the range of BMP is decreased between the two clones in the presence of Chordin. The main panel shows total BMP levels (i.e., BMP + ChdBMP in the presence of Chordin), and the inset shows free BMP levels (dashed lines). (C) Experimental test of the predictions in (A) and (B). Clones of cells expressing BMP2b-sfGFP (green) were generated by transplanting approximately 50–75 cells from a donor embryo into wild type hosts at sphere stage (see Materials and methods for details). Another clone of cells (red) was transplanted next to the BMP2b-sfGFP-expressing clone shortly after. The red clone is marked by the presence of fluorescent Alexa 546-coupled dextran. Cells from red-labeled clones either contained only Alexa 546-coupled dextran (Video 9) or Alexa-546-coupled dextran and ectopic chordin mRNA (Video 10). 15–20 min after transplantation of the clones, embryos were imaged using light sheet microscopy. The image shows gradient formation in a single optical slice approximately 20 min after transplantation. (D) Quantification of average BMP2b-sfGFP gradients at ~15 min or ~75 min after transplantation in embryos generated as in (C) with (red/brown) or without (black/gray) ectopic Chordin sources. Error bars denote standard error. n = 8 for each condition. (E) One-dimensional simulation of two clones expressing BMP (green) or Chordin (blue) with the experimentally measured diffusion coefficients DBMP = 2 μm2/s, DChd = 6 μm2/s, and DChdBMP = 2.2 μm2/s. BMP levels increase over time due to constant production. Solid lines show total BMP levels (i.e. BMP + ChdBMP in the presence of Chordin), and the dashed line shows free BMP levels. Only the distribution of free BMP is affected as a consequence of Chordin binding, and the gradient of total BMP is not deflected away from the Chordin source (compare solid black and red lines). (F) Gradients of total BMP levels to the right of the BMP expressing clone simulated with the experimentally measured diffusion coefficients (DBMP = 2 μm2/s, DChd = 6 μm2/s, and DChdBMP = 2.2 μm2/s) and renormalized to the concentration at the boundary show that the range of BMP is not decreased between the two clones in the presence of Chordin.
Videos
Video 1
3D reconstruction of pSmad1/5/9 localization in a wild type sphere stage zebrafish embryo imaged by light sheet microscopy.
https://doi.org/10.7554/eLife.25861.006
Video 2
3D reconstruction of pSmad1/5/9 localization in a wild type 30% epiboly stage zebrafish embryo imaged by light sheet microscopy.
https://doi.org/10.7554/eLife.25861.007
Video 3
3D reconstruction of pSmad1/5/9 localization in a wild type 50% epiboly stage zebrafish embryo imaged by light sheet microscopy.
https://doi.org/10.7554/eLife.25861.008
Video 4
3D reconstruction of pSmad1/5/9 localization in a wild type shield stage zebrafish embryo imaged by light sheet microscopy.
https://doi.org/10.7554/eLife.25861.009
Video 5
3D reconstruction of pSmad1/5/9 localization in a wild type 60% epiboly stage zebrafish embryo imaged by light sheet microscopy.
https://doi.org/10.7554/eLife.25861.010
Video 6
3D reconstruction of pSmad1/5/9 localization in a chordin−/− shield stage zebrafish embryo imaged by light sheet microscopy.
https://doi.org/10.7554/eLife.25861.012
Video 7
Gradient formation in a dome stage wild type embryo with a BMP2b-sfGFP clone.
Imaging started approximately 15 min post-transplantation. Interval between frames: 5 min.
Video 8
Gradient formation in a dome stage wild type embryo with a Chordin-sfGFP clone.
Imaging started approximately 15 min post-transplantation. Interval between frames: 5 min.
Video 9
Gradient formation in three representative dome stage wild type embryos with BMP2b-sfGFP clones (green) next to clones labeled with Alexa 546-coupled dextran (red).
Imaging started approximately 15 min post-transplantation. Interval between frames: 5 min. The video shows images that were normalized to the mean intensity of a region close to the BMP2b-sfGFP source boundary in each embryo at the first time point.
Video 10
Gradient formation in three representative dome stage wild type embryos with BMP2b-sfGFP clones (green) next to chordin-expressing clones labeled with Alexa 546-coupled dextran (red).
Imaging started approximately 15 min post-transplantation. Interval between frames: 5 min. The video shows images that were normalized to the mean intensity of a region close to the BMP2b-sfGFP source boundary in each embryo at the first time point.
Tables
Table 1
Summary of model assumptions, predictions, and experimental findings.
Model assumptions or predictions that are consistent with the experimental findings (gray) are highlighted in green. NA: no testable model assumptions or predictions.
| Model 1 Graded source-sink (mobile BMP) | Model 2 Graded source-sink (immobile BMP) | Model 3 Long-range accumulation and feedback | Model 4 Self-regulating reaction-diffusion system | Model 5 Shuttling | Experimental findings | |
|---|---|---|---|---|---|---|
| Diffusivity of BMP and Chordin | D(BMP) > 0 D(BMP) < D(Chd) | D(BMP) ≈ 0 D(Chd) high | D(BMP) ≈ D(Chd) High | D(BMP) ≈ D(Chd) Low | D(BMP) << D(Chd) | D(BMP) ≤ D(Chd) (≈2 and 6 µm2/s) |
| Effect of Chordin on BMP diffusivity | No effect | No effect | No effect | No effect | Chd enhances BMP diffusion | No effect |
| Half-life of BMP and Chordin | τ(BMP) ≈ τ(Chd) | Unconstrained | τ(BMP) >> τ(Chd) | τ(BMP) ≈ τ(Chd) | τ(BMP) > τ(Chd)* | τ(BMP) ≈ τ(Chd) (130 and 120 min) |
| pSmad gradient formation kinetics | Progressive rise ventrally, always low dorsally | Progressive rise ventrally, always low dorsally | Initially high dorsally and ventrally | Progressive rise ventrally, always low dorsally | Progressive rise ventrally, always low dorsally | Progressive rise ventrally, always low dorsally |
| Ventral pSmad peak decreased in the absence of Chordin? | No | No | No | No | Yes | No |
| Dorso-lateral pSmad expansion in the absence of Chordin? | Yes | Yes | Yes | No | Yes | Yes |
| Diffusivity of Sizzled relative to BMP/Chordin | NA | NA | D(ADMP) & D(Szl) ≈ D(BMP) & D(Chd) | D(ADMP) & D(Szl) >> D(BMP) & D(Chd) | NA | D(Szl) ≈ D(BMP) & D(Chd) (≈10, 2, and 6 µm2/s) |
-
*The simplified shuttling model without ADMP presented here is based on the experimentally measured clearance rate constants of BMP and Chordin; the full model for scale-invariant patterning including ADMP (Ben-Zvi et al., 2008) assumes a lower stability of Chordin due to Xlr-mediated degradation.
Additional files
-
Transparent reporting form
- https://doi.org/10.7554/eLife.25861.023
Download links
A two-part list of links to download the article, or parts of the article, in various formats.
Downloads (link to download the article as PDF)
Open citations (links to open the citations from this article in various online reference manager services)
Cite this article (links to download the citations from this article in formats compatible with various reference manager tools)
Dynamics of BMP signaling and distribution during zebrafish dorsal-ventral patterning
eLife 6:e25861.
https://doi.org/10.7554/eLife.25861


