Two-step membrane binding by the bacterial SRP receptor enable efficient and accurate Co-translational protein targeting
- California Institute of Technology, United States
- University of California at Berkeley, United States
Figures
Figure 1
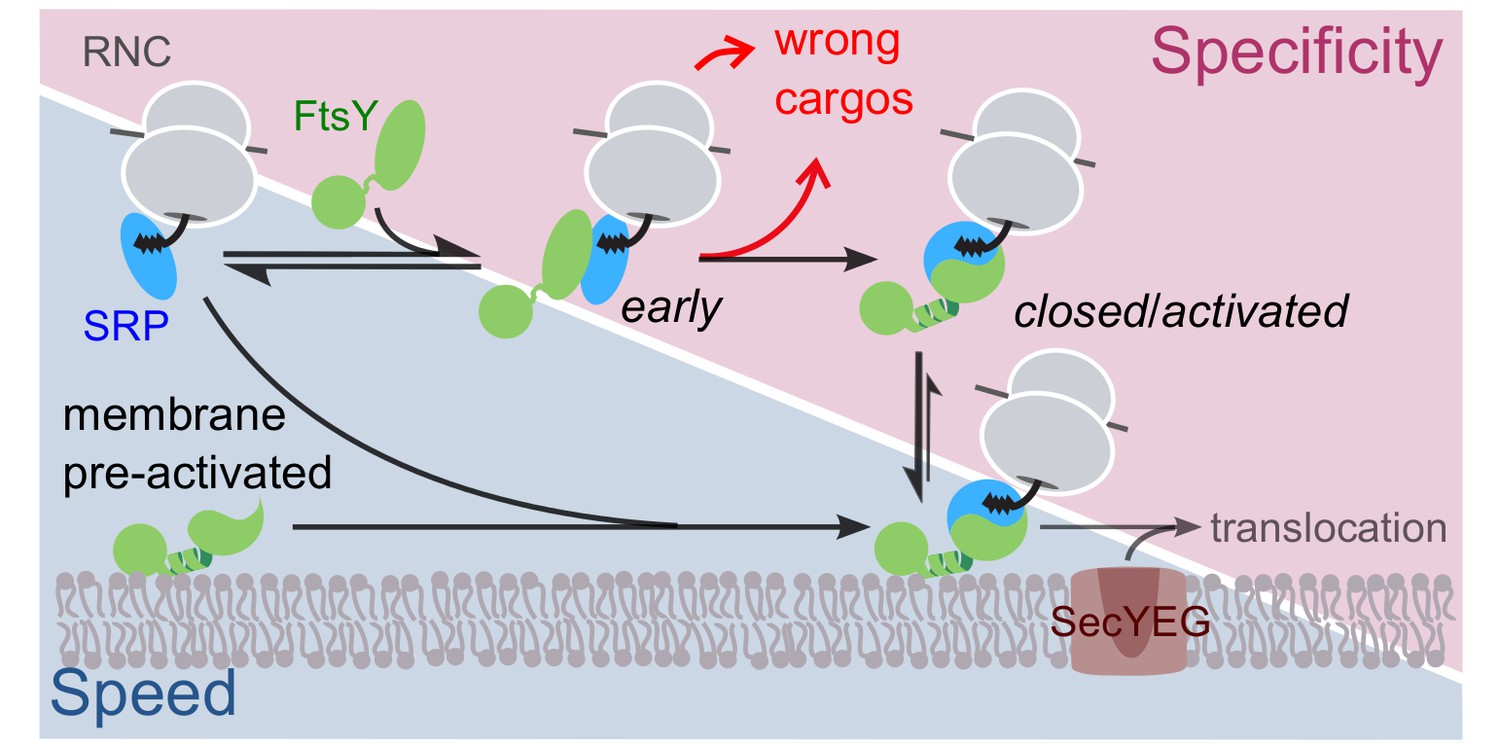
Schematic of the current models for co-translational protein targeting by the SRP pathway.
Targeting via FtsY molecules that are pre-bound and activated at the membrane is shown on the lower left (shaded in blue); the alternative targeting route via FtsY molecules in solution is shown on the upper right (shaded in magenta).
Figure 2 with 2 supplements
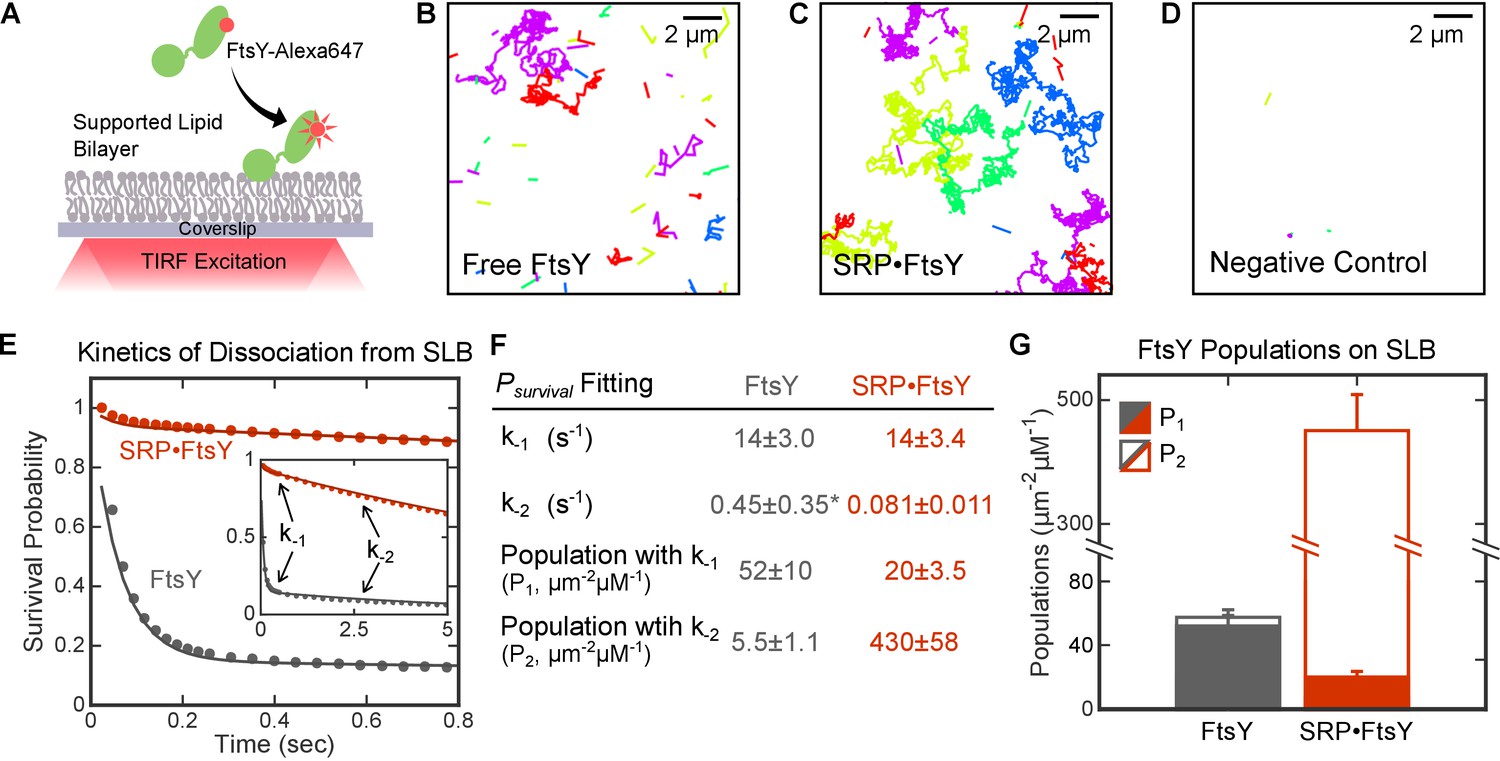
Single molecule analyses detected two distinct modes of FtsY-lipid interactions that are regulated by SRP.
(A) Schematic of smTIRF setup for observing FtsY-membrane interaction on the SLB. FtsY was labeled with Alexa647 at position C345. (B–D) Representative trajectories of free FtsY molecules (B), SRP•FtsY complexes (C), and FtsY-dN1 (D) on SLB within an arbitrary section of 100 frames. The colors are randomly assigned to distinguish different molecules. (E) Representative data (dots) and fitting curves (lines) of the survival probability distribution of trajectories on SLB for free FtsY (grey) and the SRP•FtsY complex (red). The data were fit to Equation 3, and the obtained parameters were summarized in parts F and G. (F) Summary of the dissociation rate constants and population distributions obtained from the survival probability analyses in part E. *The fitting of k-2 in free FtsY is only accurate to an order of magnitude, due to the small population of free FtsY in the Stable mode. (G) Summary of the population distributions in the Dynamic (filled bars) and Stable (open bars) modes in free FtsY (grey) and the SRP•FtsY complex (red). All values are reported as mean ± S.D., with n ≥ 3.
Figure 2—figure supplement 1
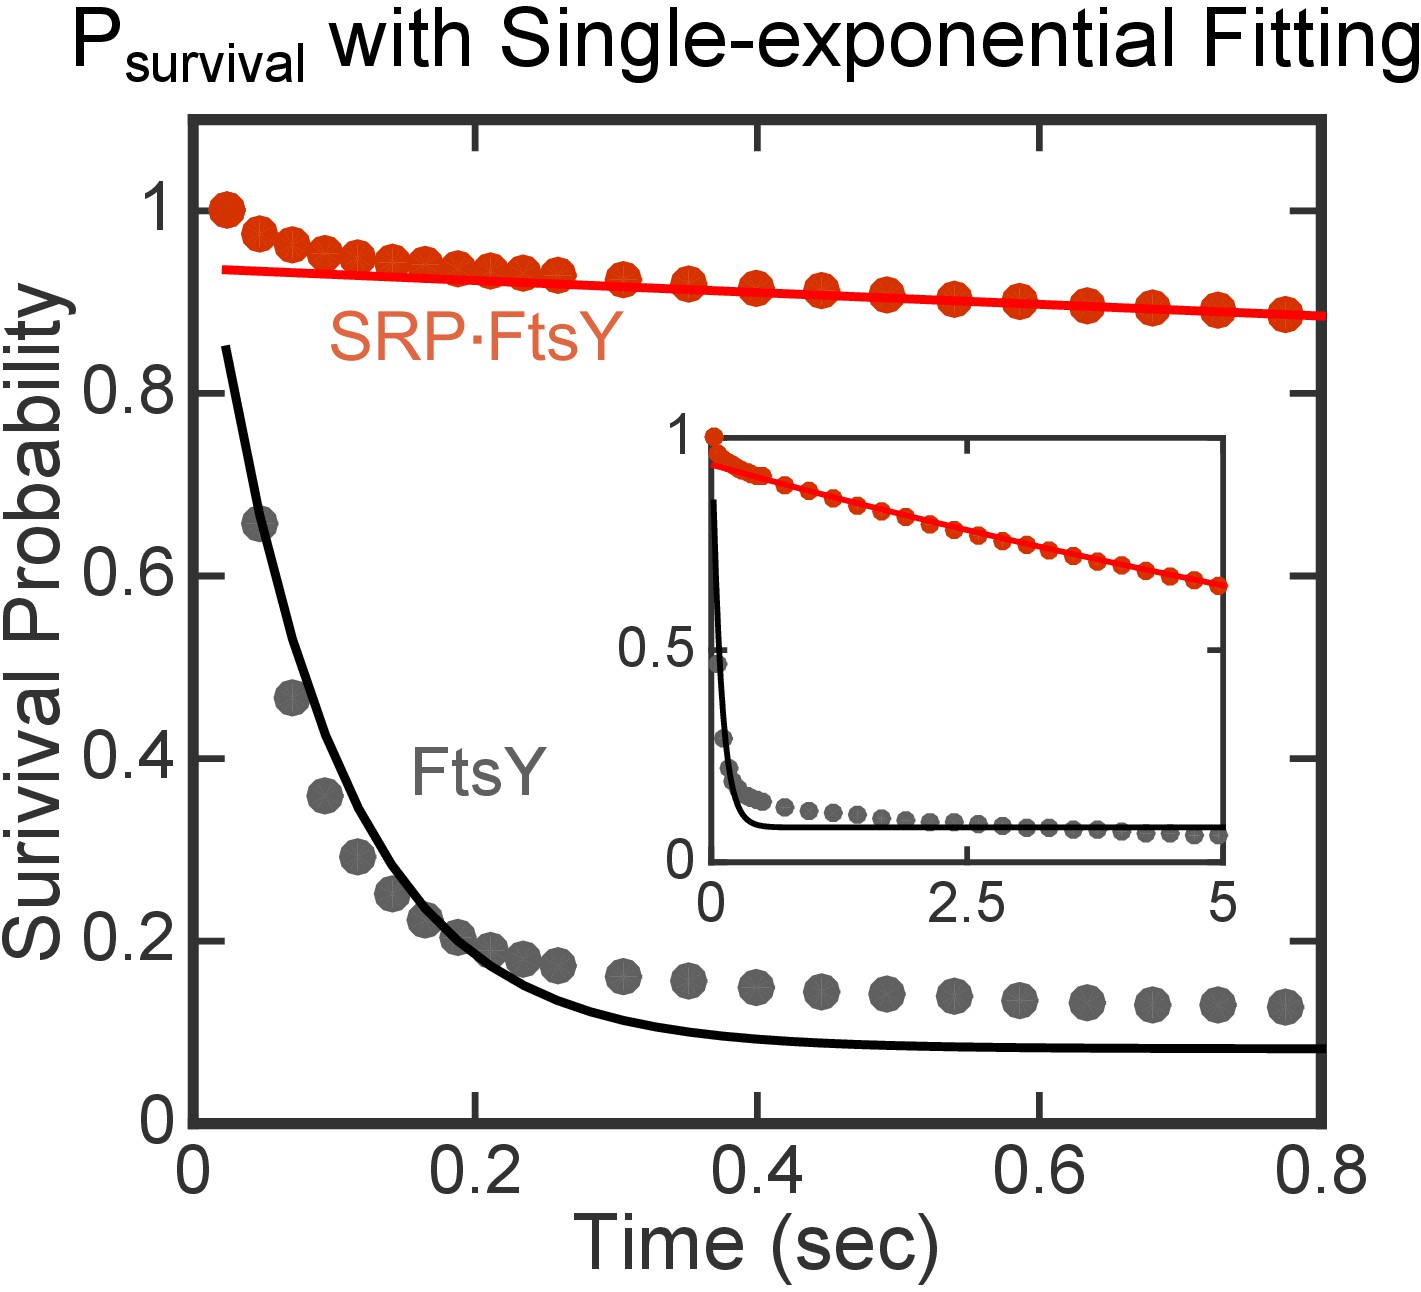
Single-exponential functions do not adequately fit Psurvival(t) data.
https://doi.org/10.7554/eLife.25885.004
Figure 2—figure supplement 2

Photobleaching is slow and does not interfere with the lifetime analysis.
The red and gray dots are the same set of data shown in Figure 2E. The green line is the averaged bleaching curve from three movies, determined from the total fluorescence intensity of FtsY tethered on Ni-DGS SLB. Variation in photobleaching is represented by the light gray area around the green line.
Figure 3 with 1 supplement
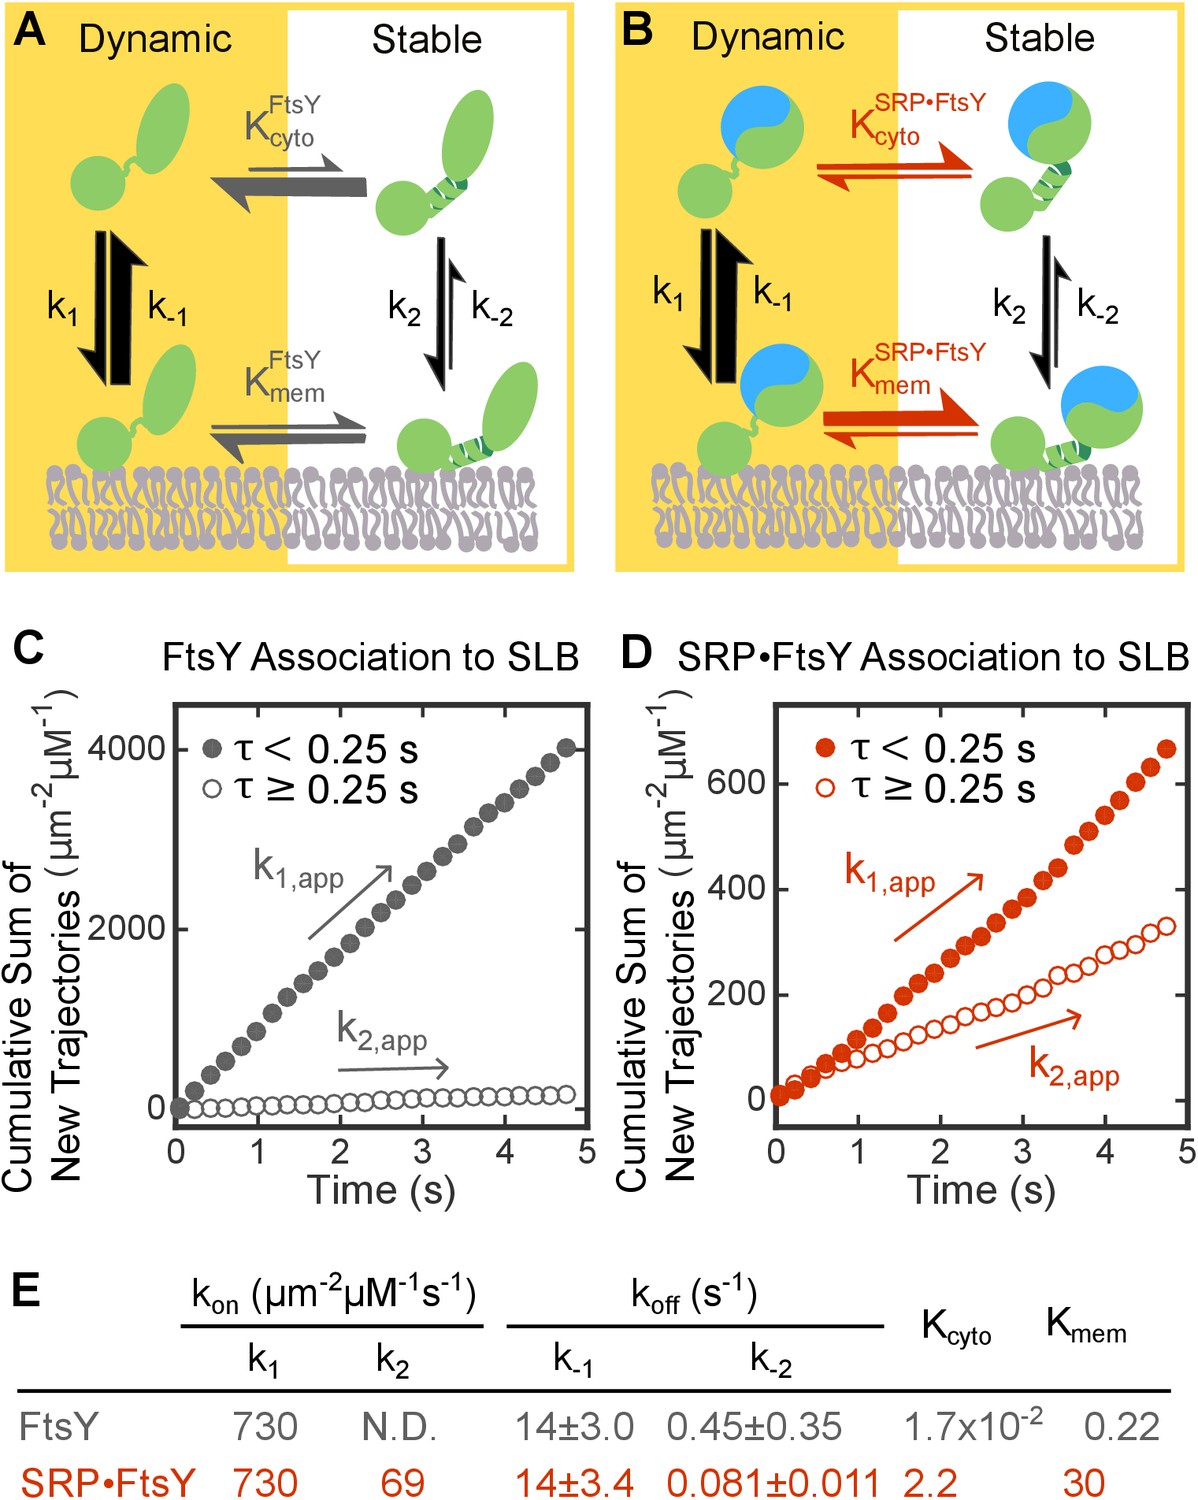
SRP binding drives FtsY from the Dynamic to the Stable mode.
(A, B) Thermodynamic models of FtsY-membrane interaction in free FtsY (A) and the SRP•FtsY complex (B). (C, D) Representative data for apparent association kinetics of FtsY (C) and the SRP•FtsY complex (D) with SLB in the Dynamic (closed circles) and Stable mode (open circles). (E) List of the rate and equilibrium constants for the models in parts A and B. N.D., not determined with confidence due to the unstable fitting of k-2. Values are reported as mean ± S.D., with n ≥ 3.
Figure 3—figure supplement 1
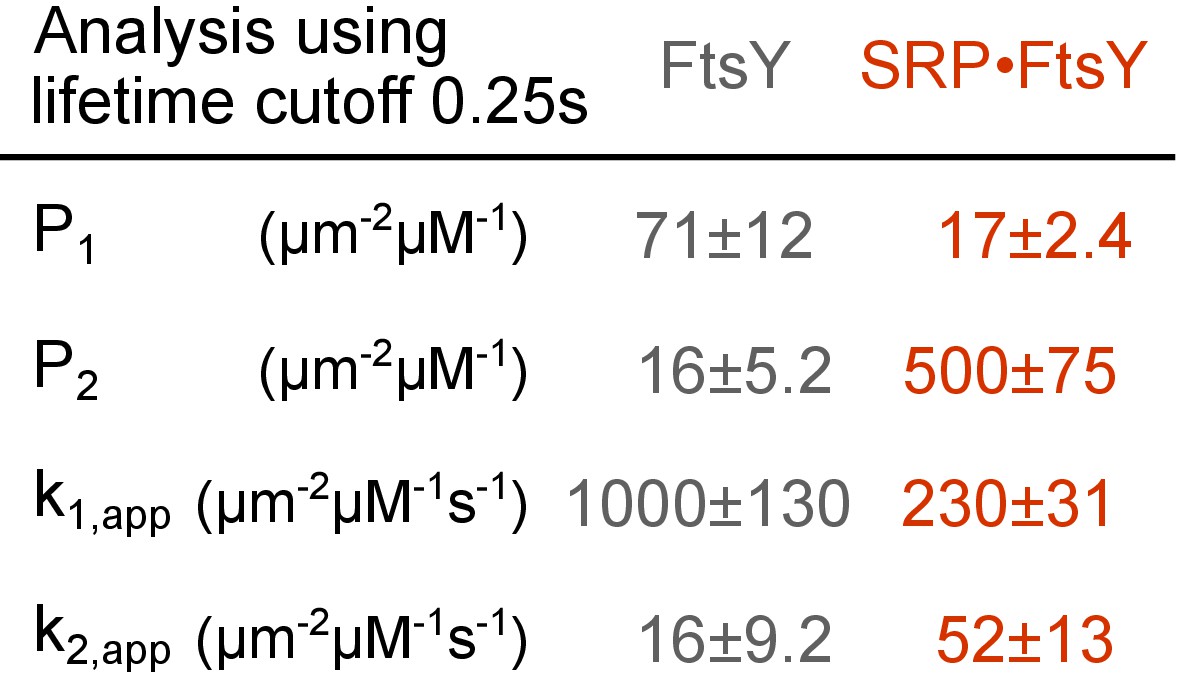
Summary of the population distributions and apparent association rate constants obtained by using a lifetime cutoff of 0.25 s to distinguish trajectories in the Dynamic and Stable modes.
https://doi.org/10.7554/eLife.25885.010
Figure 4
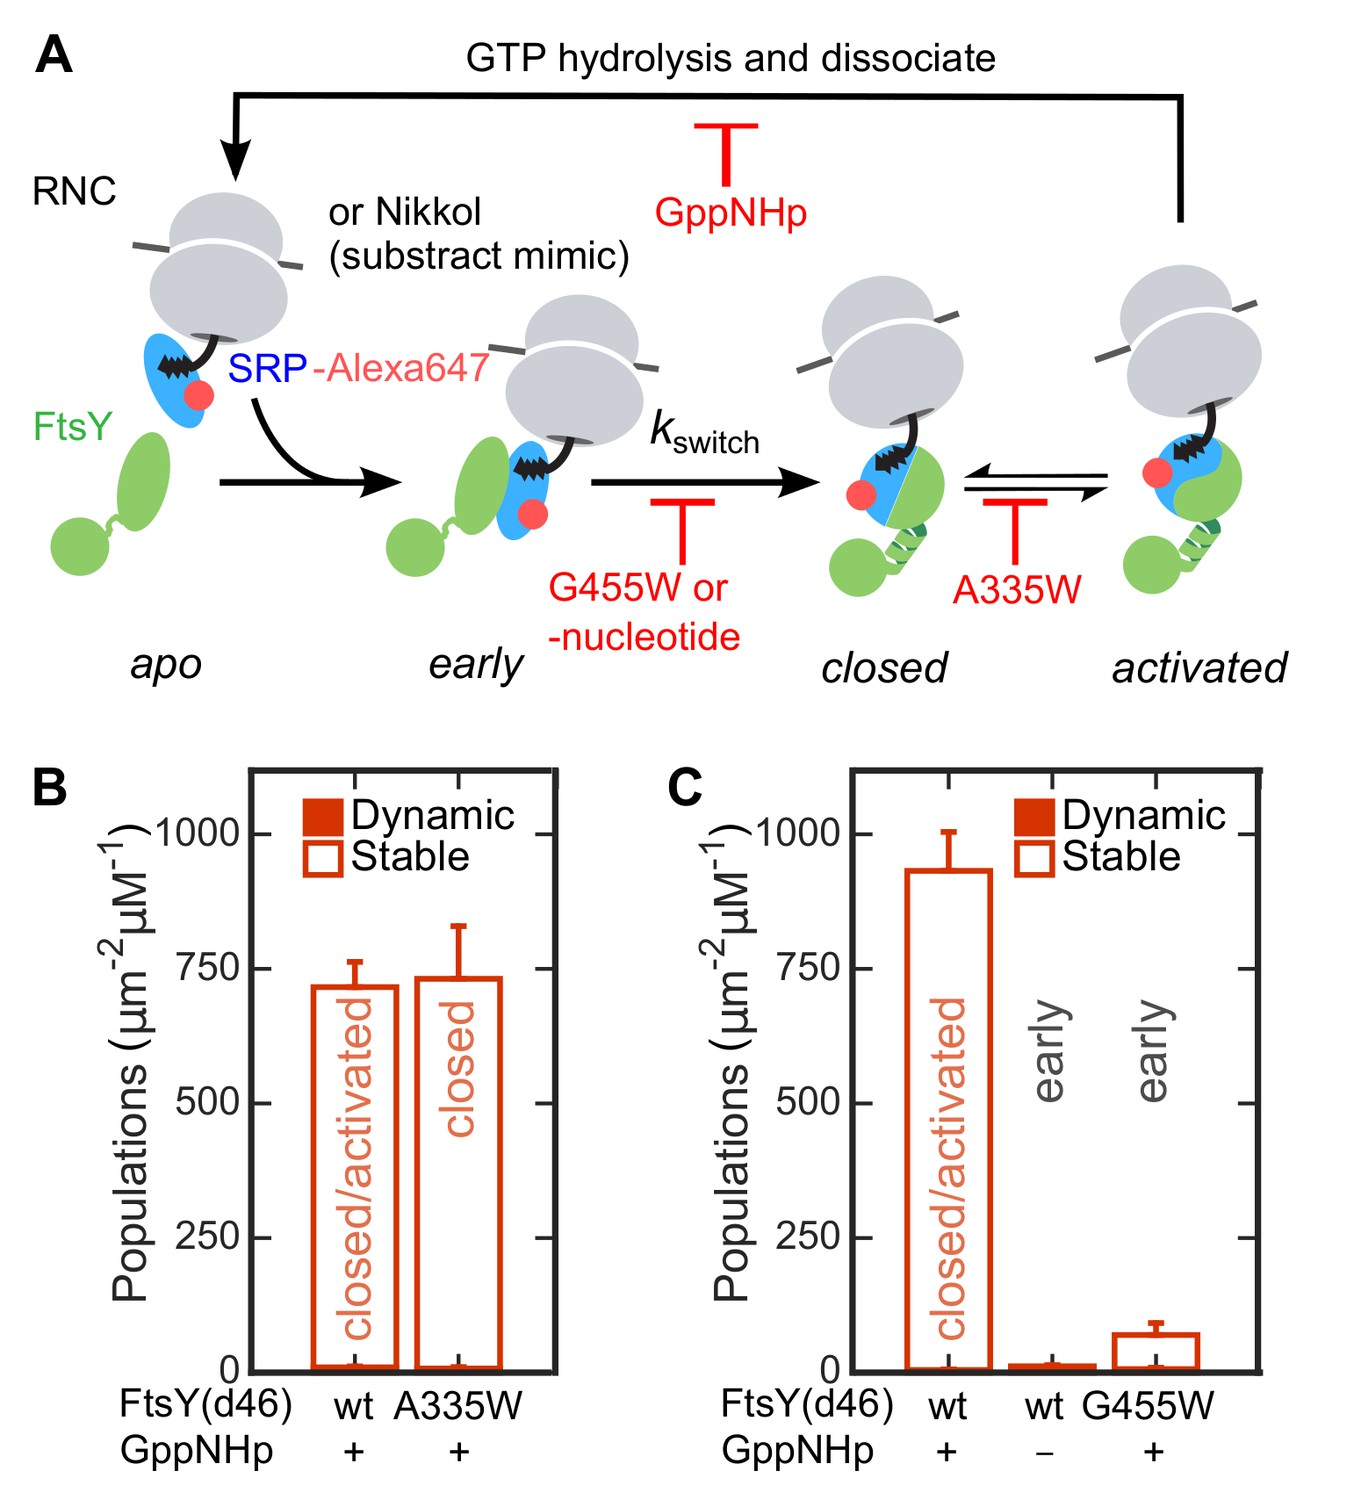
The Dynamic-to-Stable transition occurs during the early-to-closed rearrangement in the SRP•FtsY complex.
(A) Schematic of conformational changes in the SRP-FtsY GTPase cycle and the conditions that stall the complex at different conformational stages. SRP was labeled with Alexa647 at C153. (B, C) Comparison of the lipid interactions of the SRP•FtsY complex with wildtype proteins in GppNHp (a mixture of closed/activated states) and with the complex stalled in the closed state (B) or the early state (C). Filled and open bars represent populations in the Dynamic and Stable modes, respectively, determined using the lifetime cutoff of 0.25 s. As expression of full-length FtsY(A335W) is toxic to the cell, FtsY-d46 was used for the measurements in these experiments. Except for the lipid interactions, FtsY-d46 behaves identically to full-length FtsY in the SRP/FtsY GTPase cycle and in activation by RNC (Powers and Walter, 1997; Zhang et al., 2009). A substrate mimic, Nikkol (Bradshaw et al., 2009), was included in (B) to facilitate complex formation. RNCFtsQ was included in (C) to stabilize the early complex. Values are reported as mean ± S.D., with n ≥ 3.
Figure 5 with 4 supplements
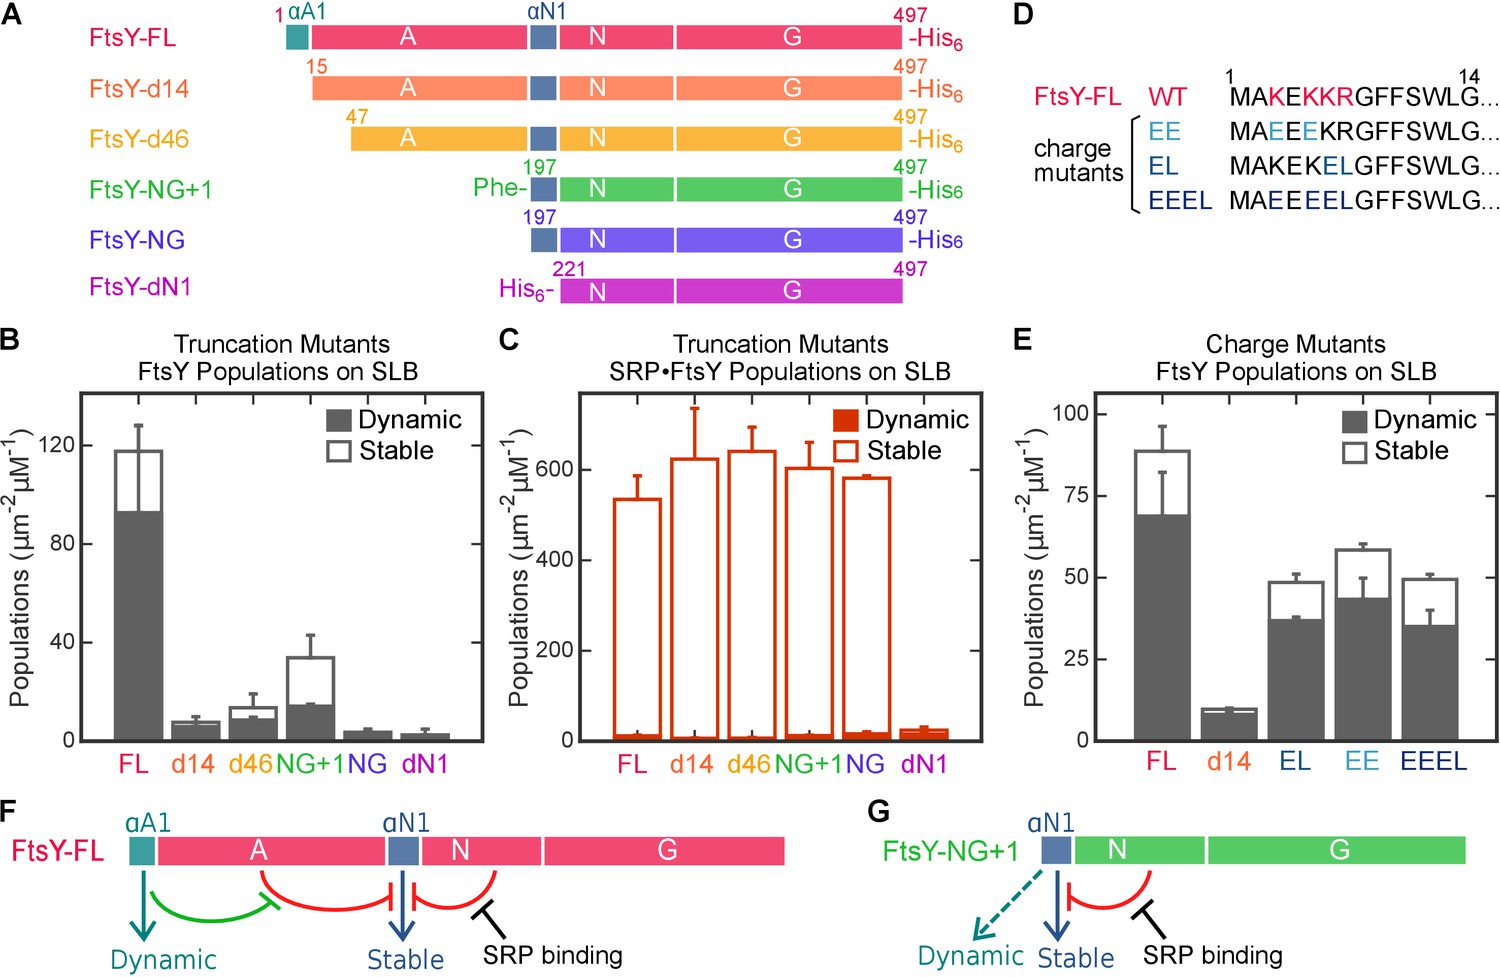
Distinct motifs in FtsY mediate the two membrane interaction modes.
(A) Domain structures of wildtype FtsY and FtsY truncation mutants. (B, C) The membrane binding abilities of the truncation mutants on SLB as free FtsY (B) and SRP•FtsY complex (C). Filled and open bars represent populations in the Dynamic and Stable modes, respectively, determined using the lifetime cutoff of 0.25 s. (D) Sequences of the αA1 motif in wildtype and charge mutants. Charged residues in wildtype sequence are highlighted in red, and their mutations are highlighted in blue. (E) Charge mutations in αA1 reduced membrane interactions of free FtsY with SLB. (F, G) Model for regulation of the membrane interactions of full length FtsY (F) and FtsY-NG+1 (G). Cyan and blue arrows denote membrane interactions in the Dynamic and Stable modes, respectively. Both the A-domain (this work) and N-domain (Parlitz et al., 2007; Lam et al., 2010) inhibit FtsY from engaging the membrane in the Stable mode (red inhibition marks). In full-length FtsY, αA1 partially relieves the inhibition from the A-domain (green inhibition mark). In FtsY-NG+1, the αN1 motif can also mediate some degree of Dynamic interactions (dashed arrow in G). With both constructs, interaction with SRP is the most effective mechanism to relieve the inhibitory effect from the N-domain and allow FtsY to interact with the membrane in the Stable mode. Values are reported as mean ± S.D., with n ≥ 3.
Figure 5—figure supplement 1

FtsY truncation mutants exhibit no defects in complex formation and GTPase activation with SRP in the absence of lipids.
Stimulated GTPase reactions of SRP with FtsY were determined as described in Materials and methods. The data were fit to Equation 6 and gave kcat values of 28.5, 25.3, 28.9 min−1 and Km values of 0.9, 0.7, 0.6 μM for wildtype (FL), d14, and NG + 1 mutants of FtsY, respectively.
Figure 5—figure supplement 2
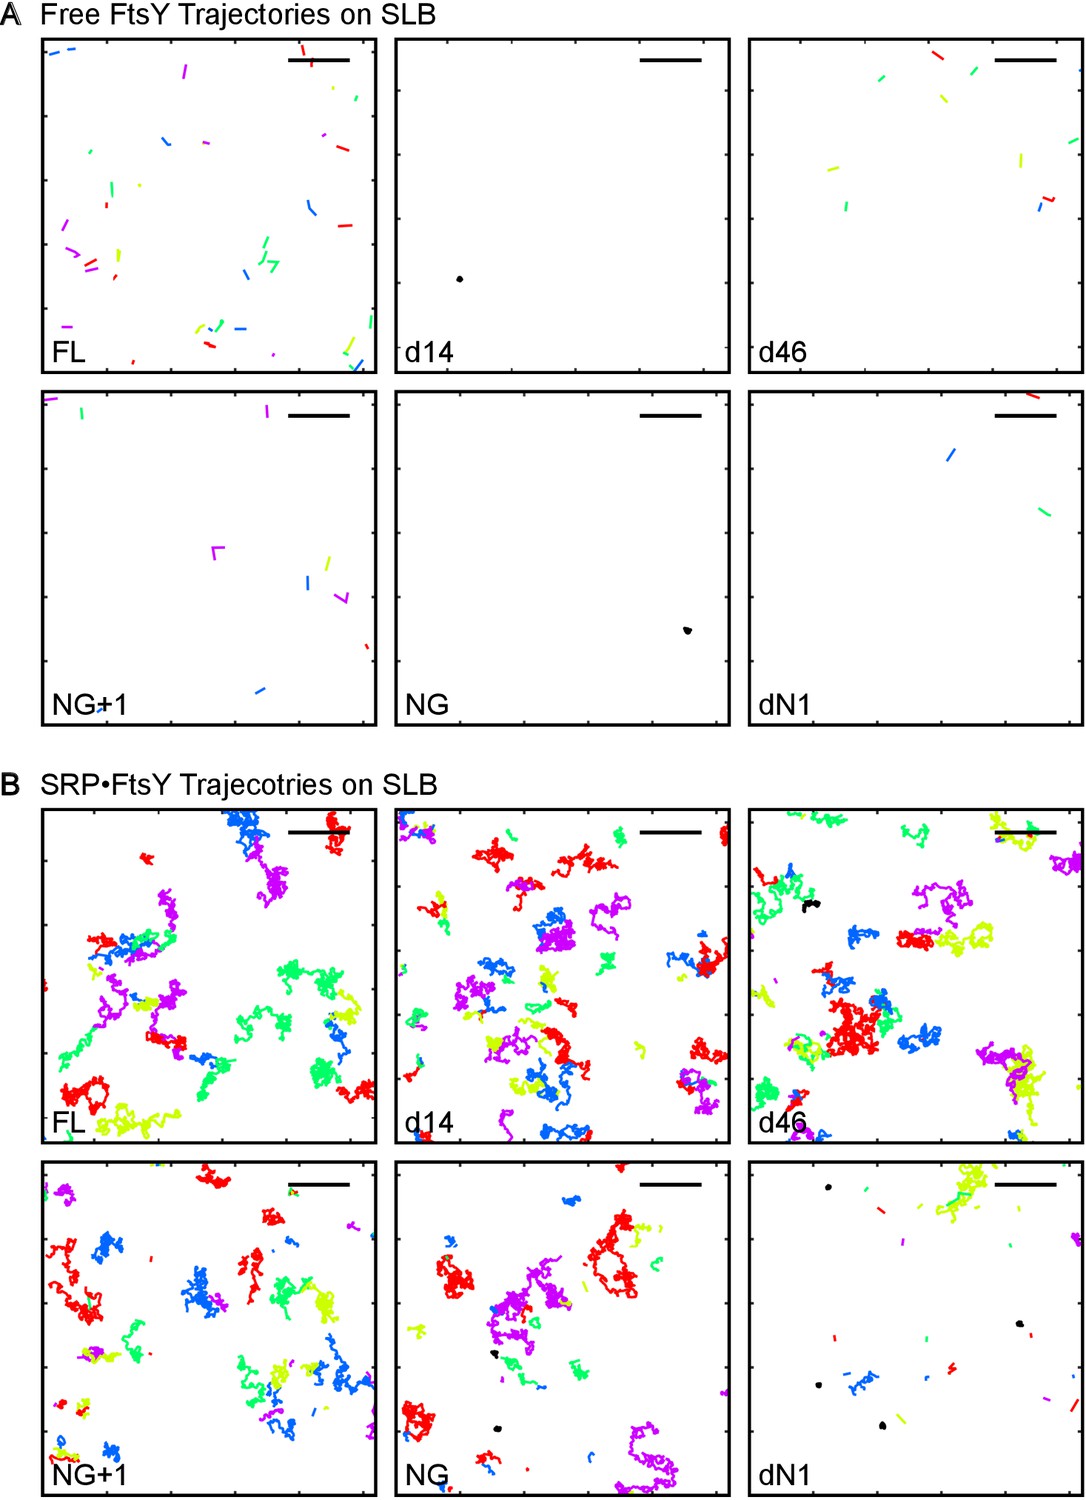
Representative trajectories of free FtsY molecules (A) and SRP•FtsY complexes (B) on SLB for wildtype and truncation mutants of FtsY.
Trajectories within an arbitrary section of 100 frames are shown. The colors are randomly assigned for distinguishing each trajectory. The scale bars represent 5 μm.
Figure 5—figure supplement 3
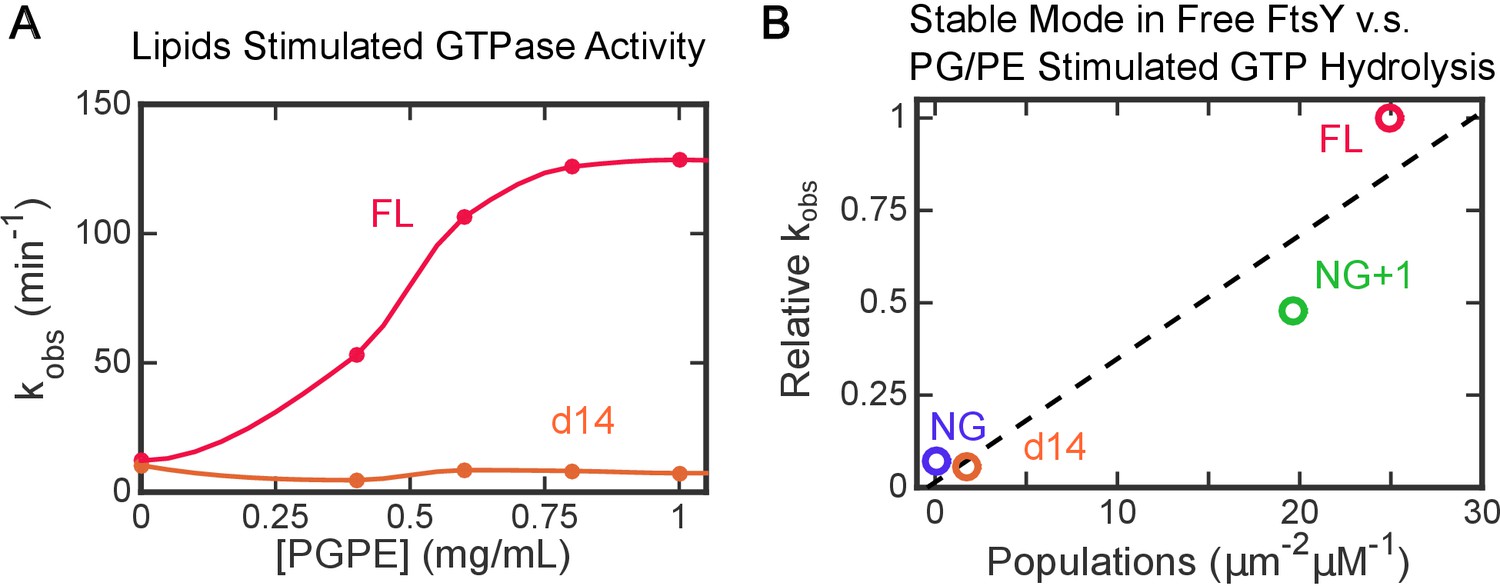
Lipid activation of FtsY’s GTPase activity independently probes the ability of free FtsY to sample the Stable mode.
(A) Lipid activated GTP hydrolysis reactions of full length FtsY and mutant FtsY-d14. (B) Populations in the Stable mode in free FtsY correlate with lipid-stimulated GTPase activity of SRP•FtsY complex. The GTPase rate constants were from part A and from Figure 1B in (Lam et al., 2010). All the observed rates (kobsd) at saturating liposome concentrations (>1 mg/mL) were normalized to the values for full-length FtsY measured in the same experiment.
Figure 5—figure supplement 4
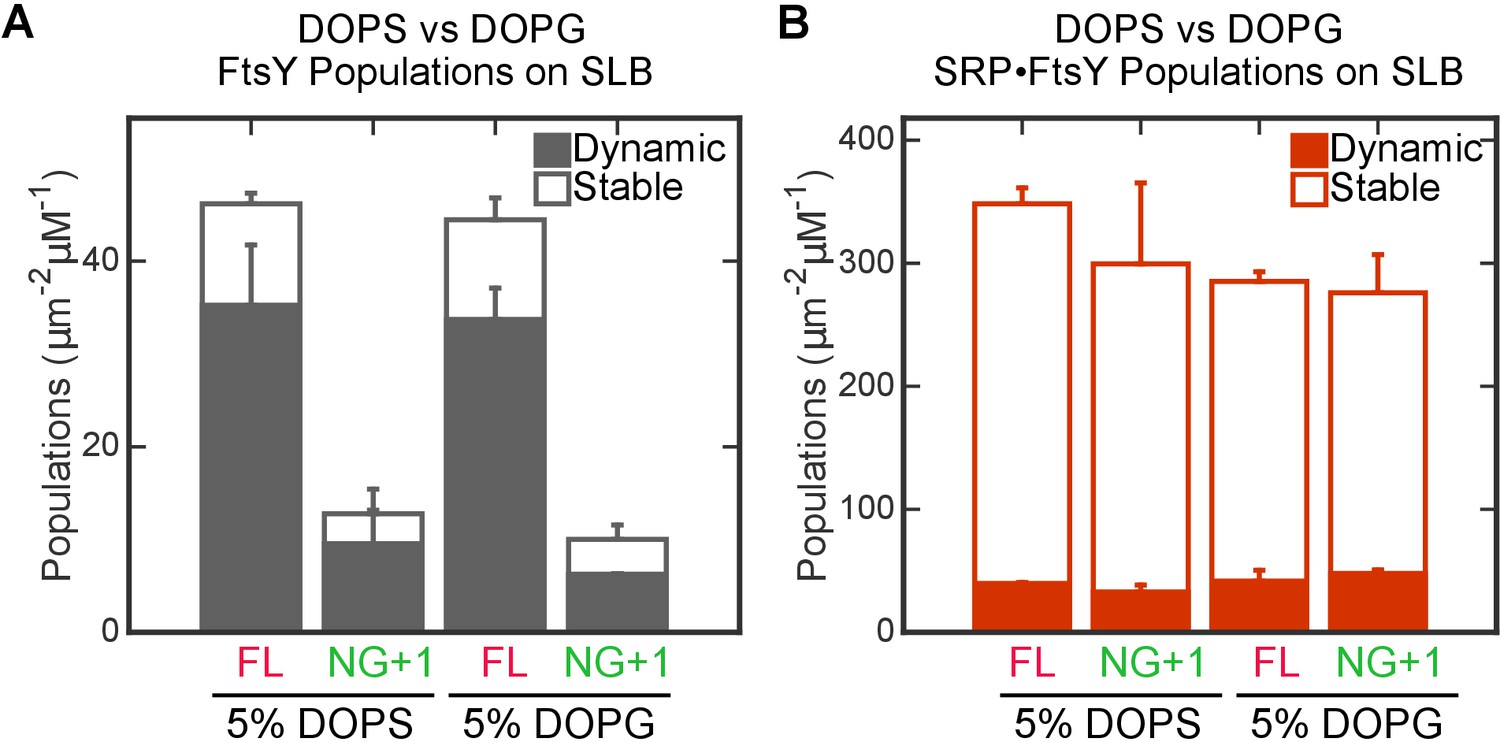
The interaction of FtsY with SLB is insensitive to the identity of anionic phospholipids.
The binding of full-length (FL) FtsY and FtsY(NG + 1) with SLBs generated using DOPC with either 5% DOPS or 5% DOPG were measured for free FtsY (A) and SRP•FtsY complex (B). Filled and open bars represent populations in the Dynamic and Stable modes, respectively.
Figure 6 with 1 supplement
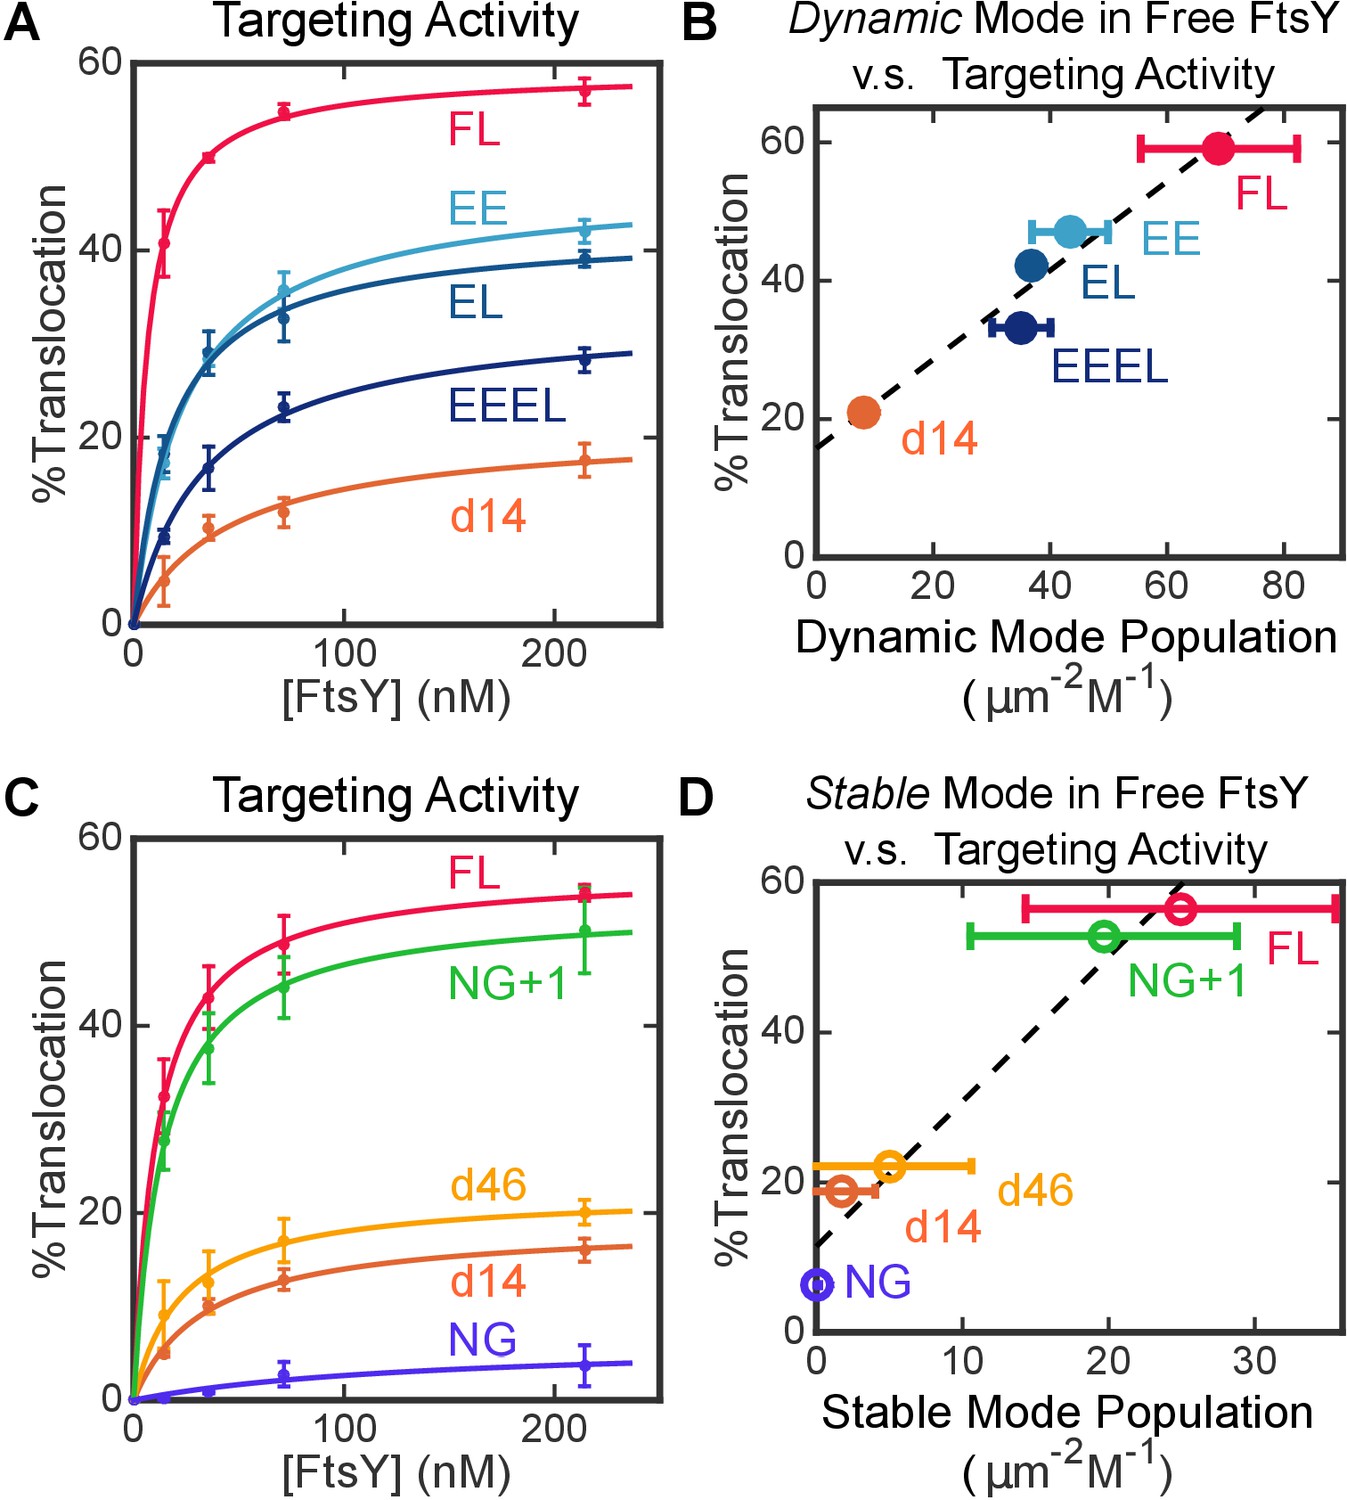
Both modes of FtsY-membrane interactions impact efficient protein targeting.
(A) The effect of charge mutations in the αA1 motif on the co-translational targeting of pPL. Data were fitted to Equation 7. (B) Targeting efficiencies of the αA1 charge mutants correlate with the populations of molecules in the Dynamic mode in free FtsY. (C) The effect of A-domain truncations on the co-translational targeting of pPL. (D) Targeting efficiencies of A-domain truncation mutants parallel their abilities to sample the Stable mode prior to SRP binding. Values are reported as mean ± S.D., with n ≥ 3.
Figure 6—figure supplement 1
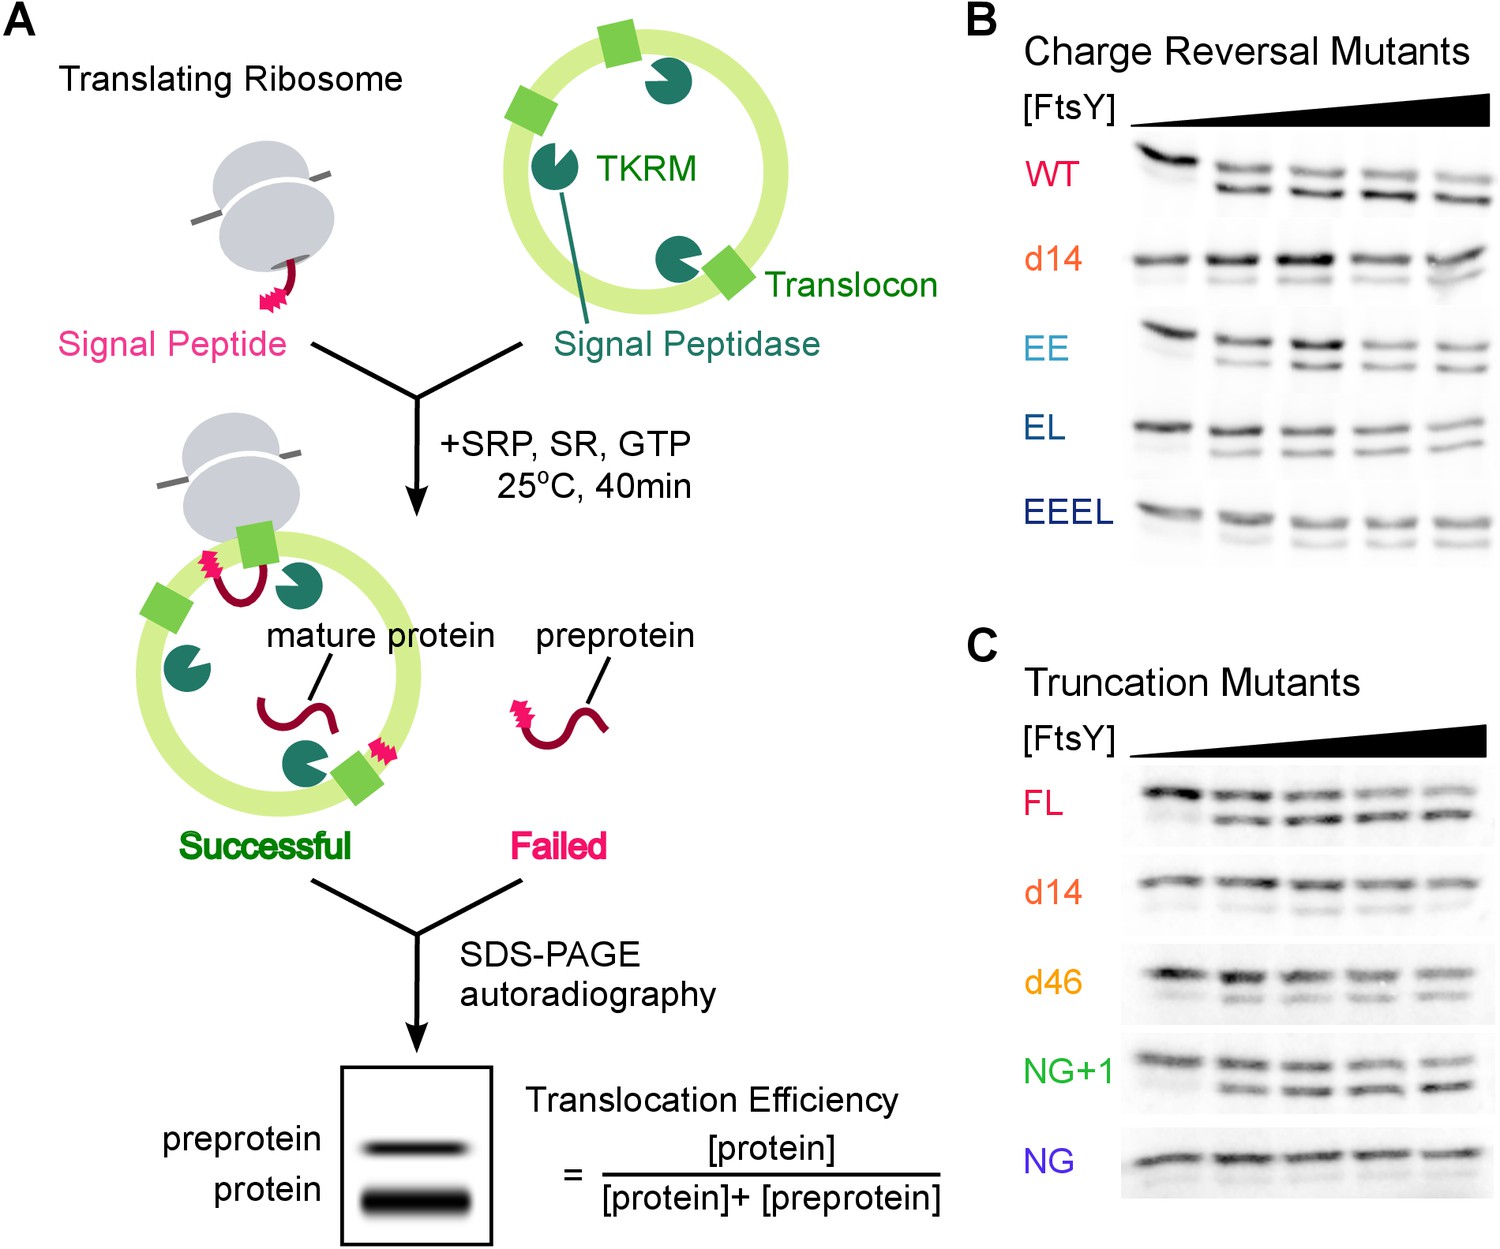
Co-translational protein targeting and translocation by FtsY mutants.
(A) Schematics of the co-translational targeting and translocation assay using trypsin-treated, high salt-washed endoplasmic reticulum membrane (TKRM). (B, C) Representative translocation data for FtsY charge-reversal (B) and truncation (C) mutants.
Figure 7 with 1 supplement
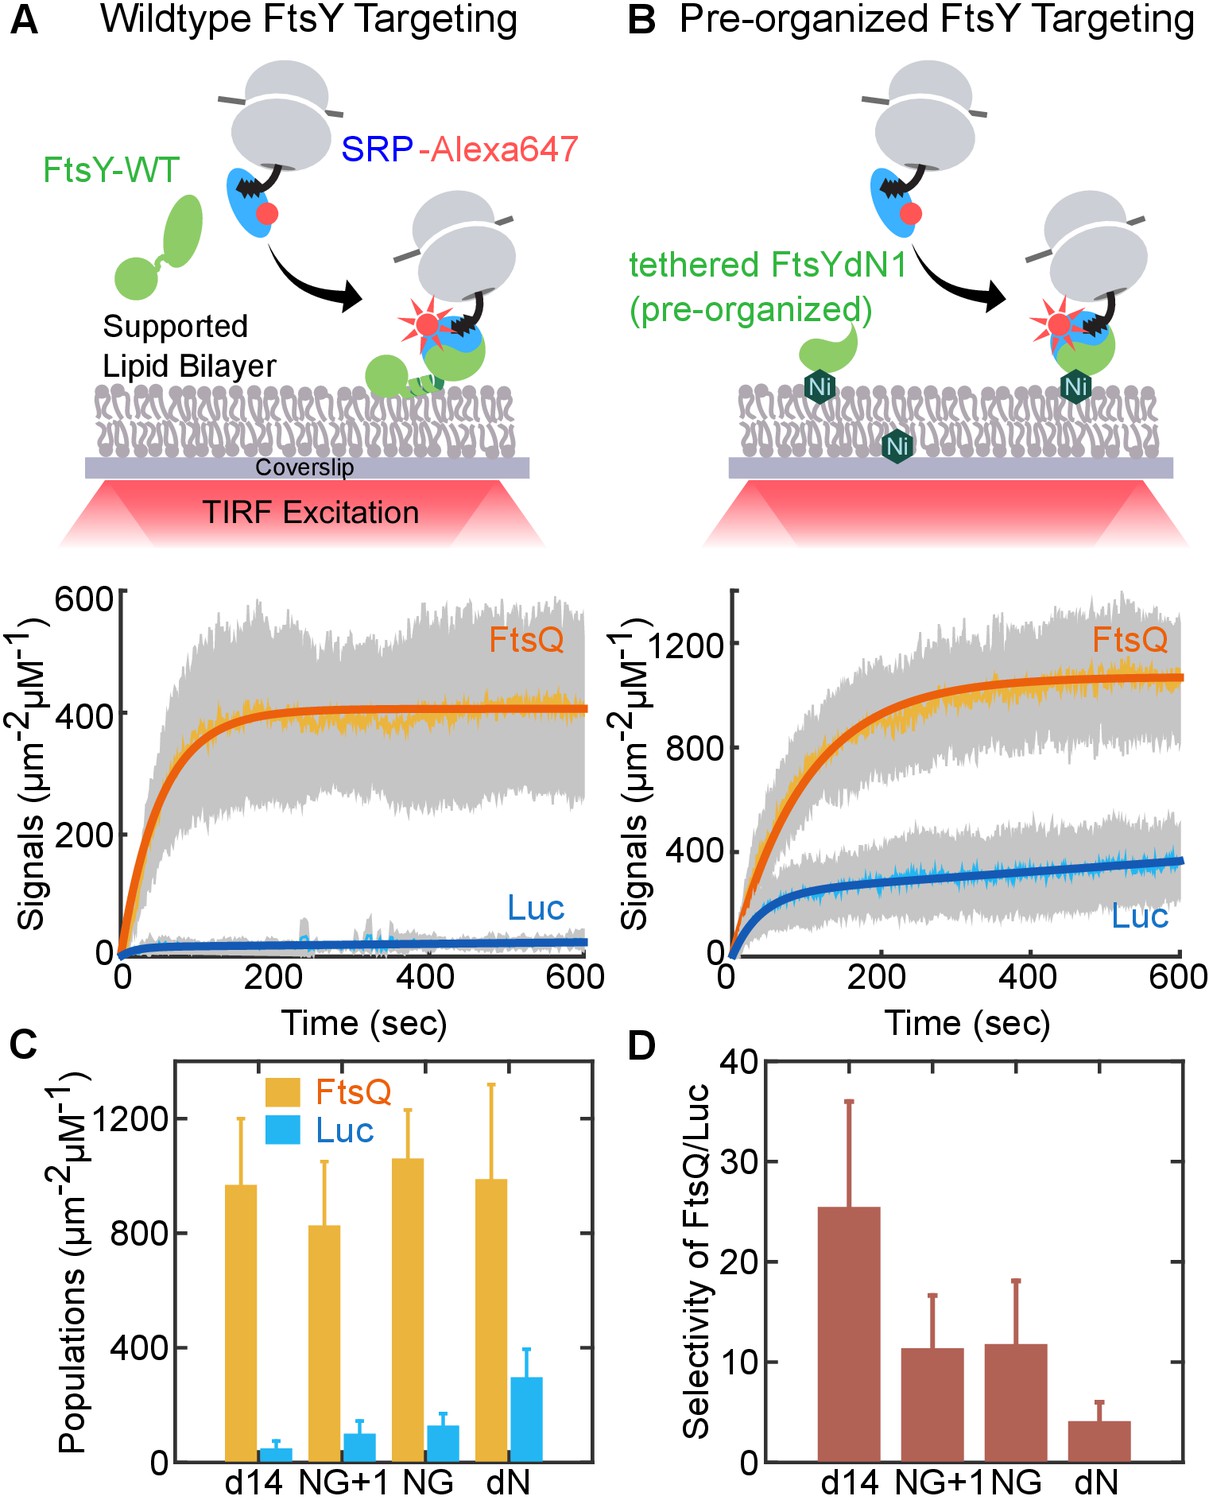
An engineered FtsY pre-organized into the Stable mode led to indiscriminate targeting.
(A, B) Time courses for targeting of RNCFtsQ (orange) and RNCLuc (blue) to SLB mediated by wildtype FtsY (A) and FtsY pre-organized into the Stable mode (B). Schematics of the single-molecule real-time targeting assay is depicted above. The amounts of FtsY in the two experiments were equalized by adjusting the surface density of tethered FtsY-dN1. (C) The amount of RNCFtsQ (orange bars) and RNCLuc (blue bars) targeted to SLB by tethered mutant FtsYs. (D) Targeting specificities of SLB-tethered FtsY mutants, defined by the ratio of targeted RNCFtsQ over RNCLuc in (C). Values are reported as mean ± S.D., with n ≥ 3.
Figure 7—figure supplement 1
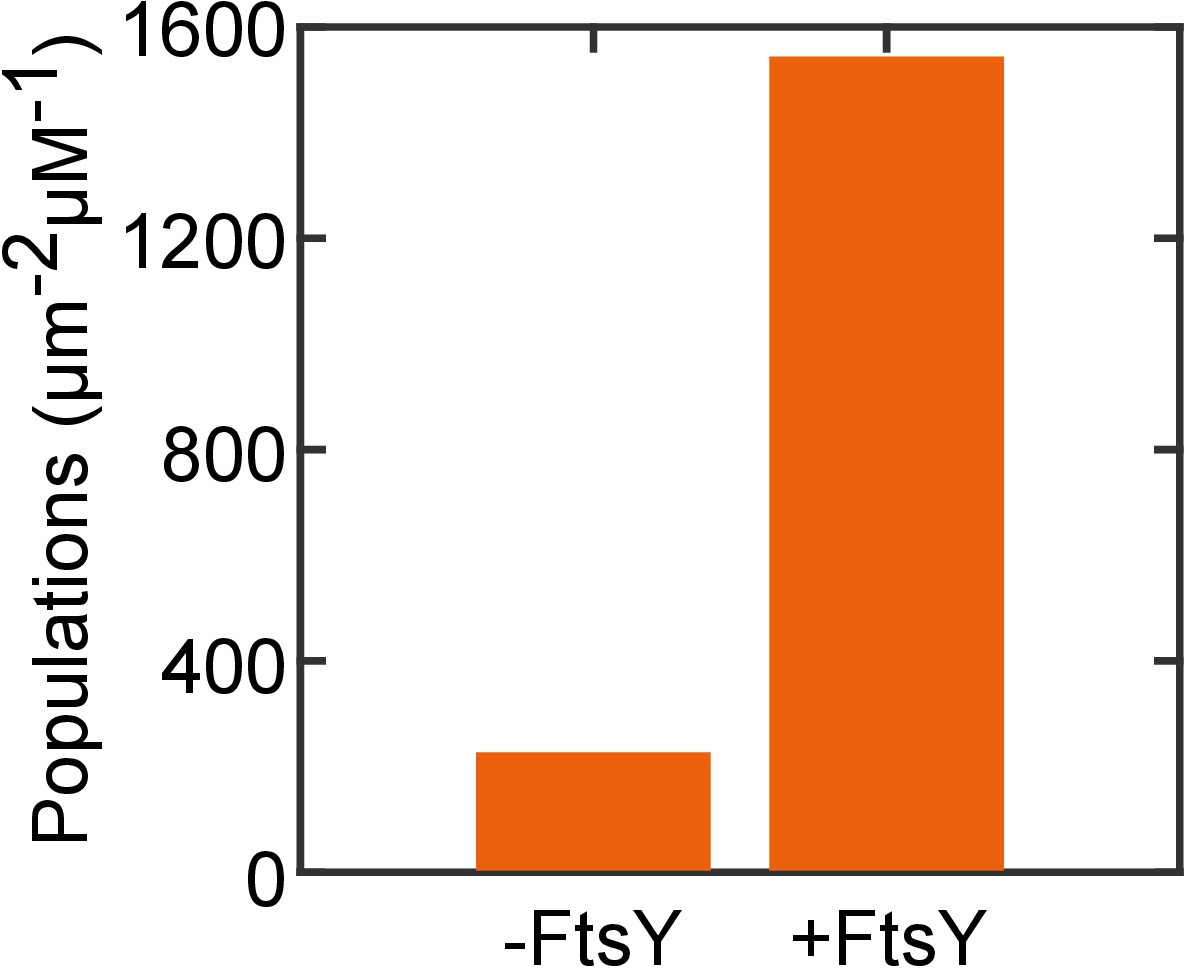
The targeting of RNCFtsQ•SRP to SLB is dependent on FtsY.
The amount of RNCFtsQ•SRP targeted to SLB without or with membrane tethered FtsY-dN1 (+FtsY) were tested and quantified.
Figure 8 with 1 supplement
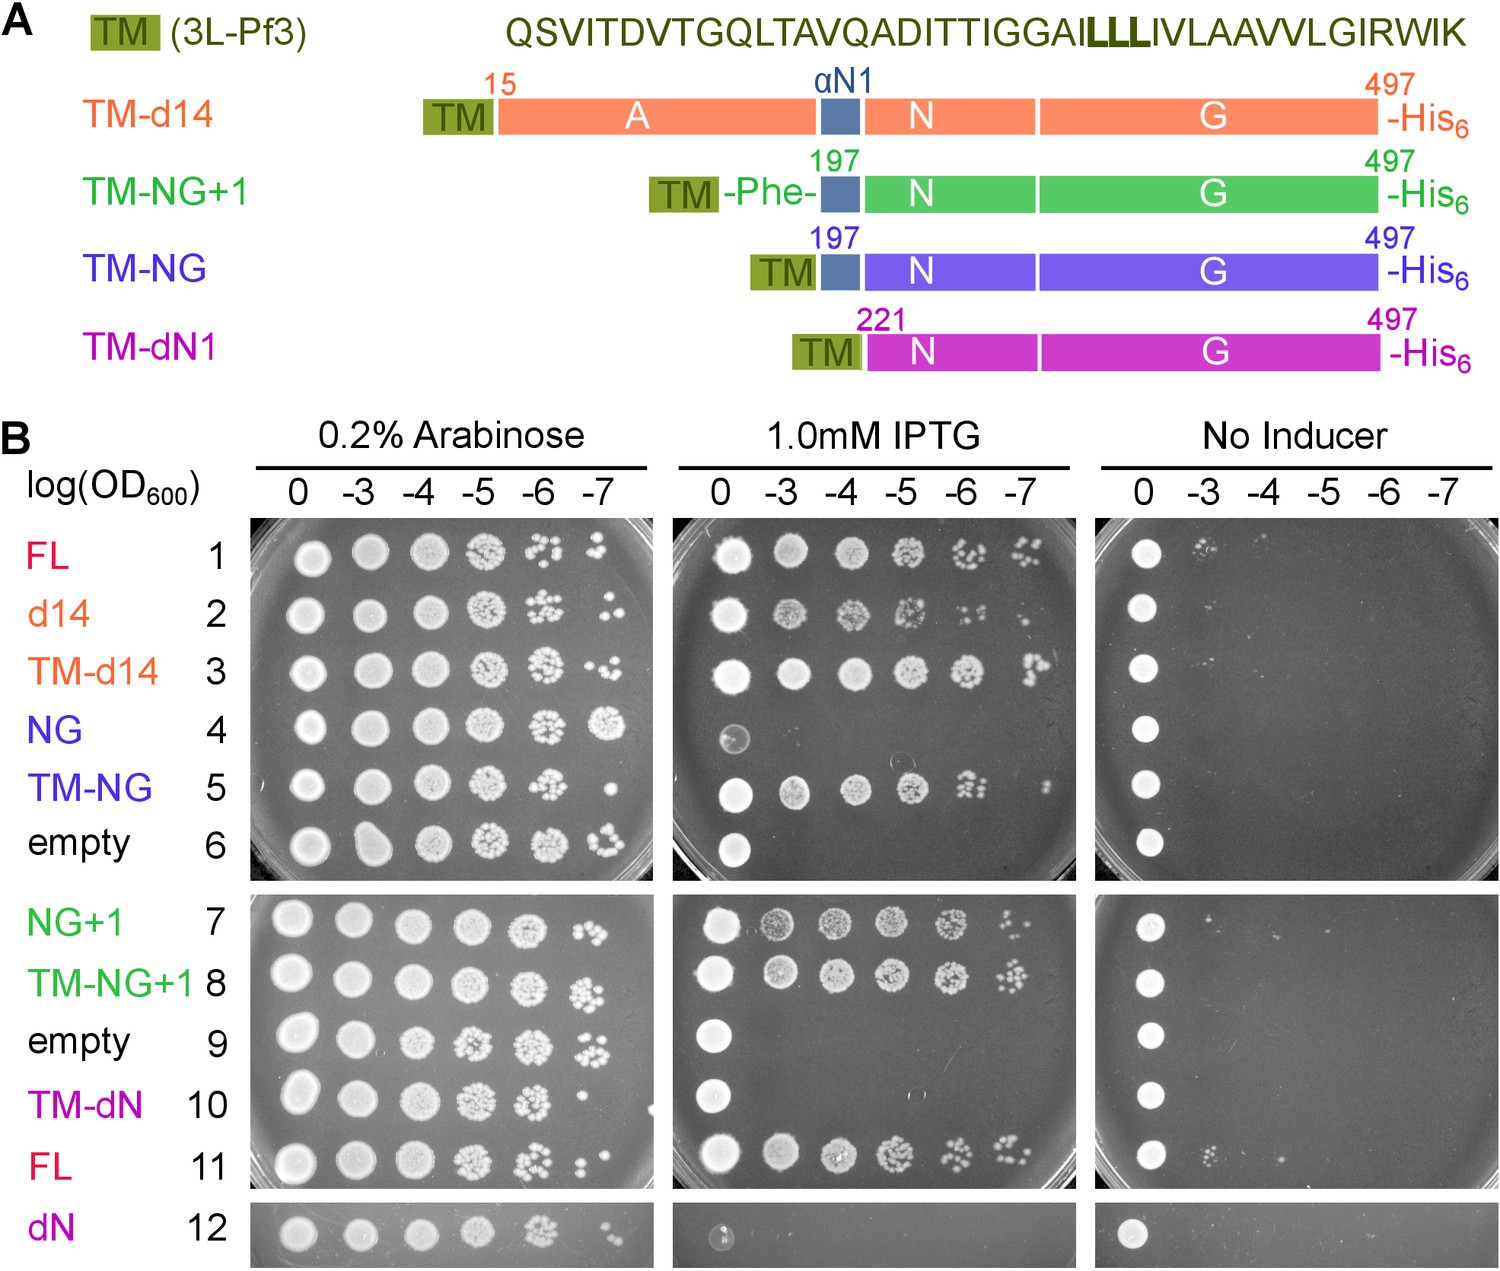
Pre-organization into the Stable mode disrupts FtsY function in vivo.
(A) The sequence of the 3L-Pf3 TMD anchor and domain structures of membrane-tethered FtsY mutants (TM-FtsY) used in the in vivo assay. (B) Frogging assays were carried out to test the ability of mutant FtsYs to complement the loss of genomic FtsY, as described in Methods. Replicates of the data are shown in Figure supplement.
Figure 8—figure supplement 1
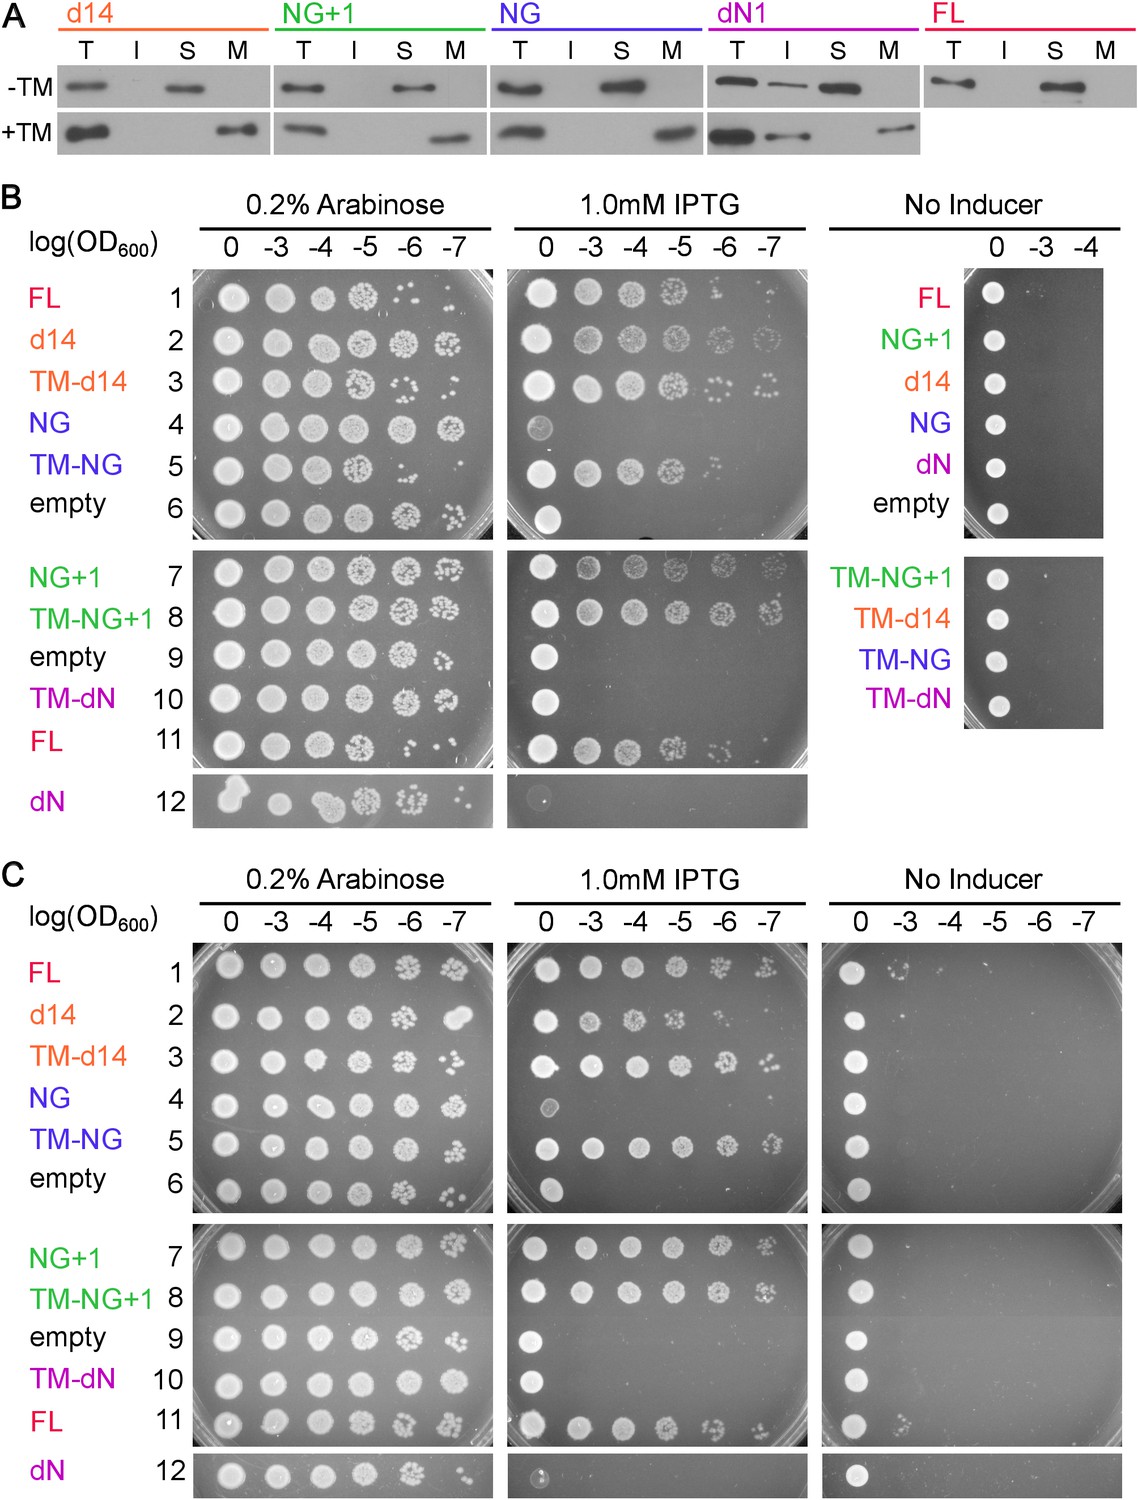
Cell fractionation analyses and replicates of the cell growth assay.
(A) Cell fractionation analysis to test the effectiveness of membrane tethering by the 3L-Pf3 motif. FtsY truncation mutants without (-TM) or with (+TM) the 3L-Pf3 fusion were expressed and fractionated as described in Methods. Proteins in total (T), inclusion body (I), soluble (S), and membrane (M) fractions were detected via Western-blotting against their C-terminal His6-tags. (B, C) Two independent replicates of the frogging assays (Figure 8B) to test the ability of mutant FtsYs to complement FtsY depletion.
Figure 9
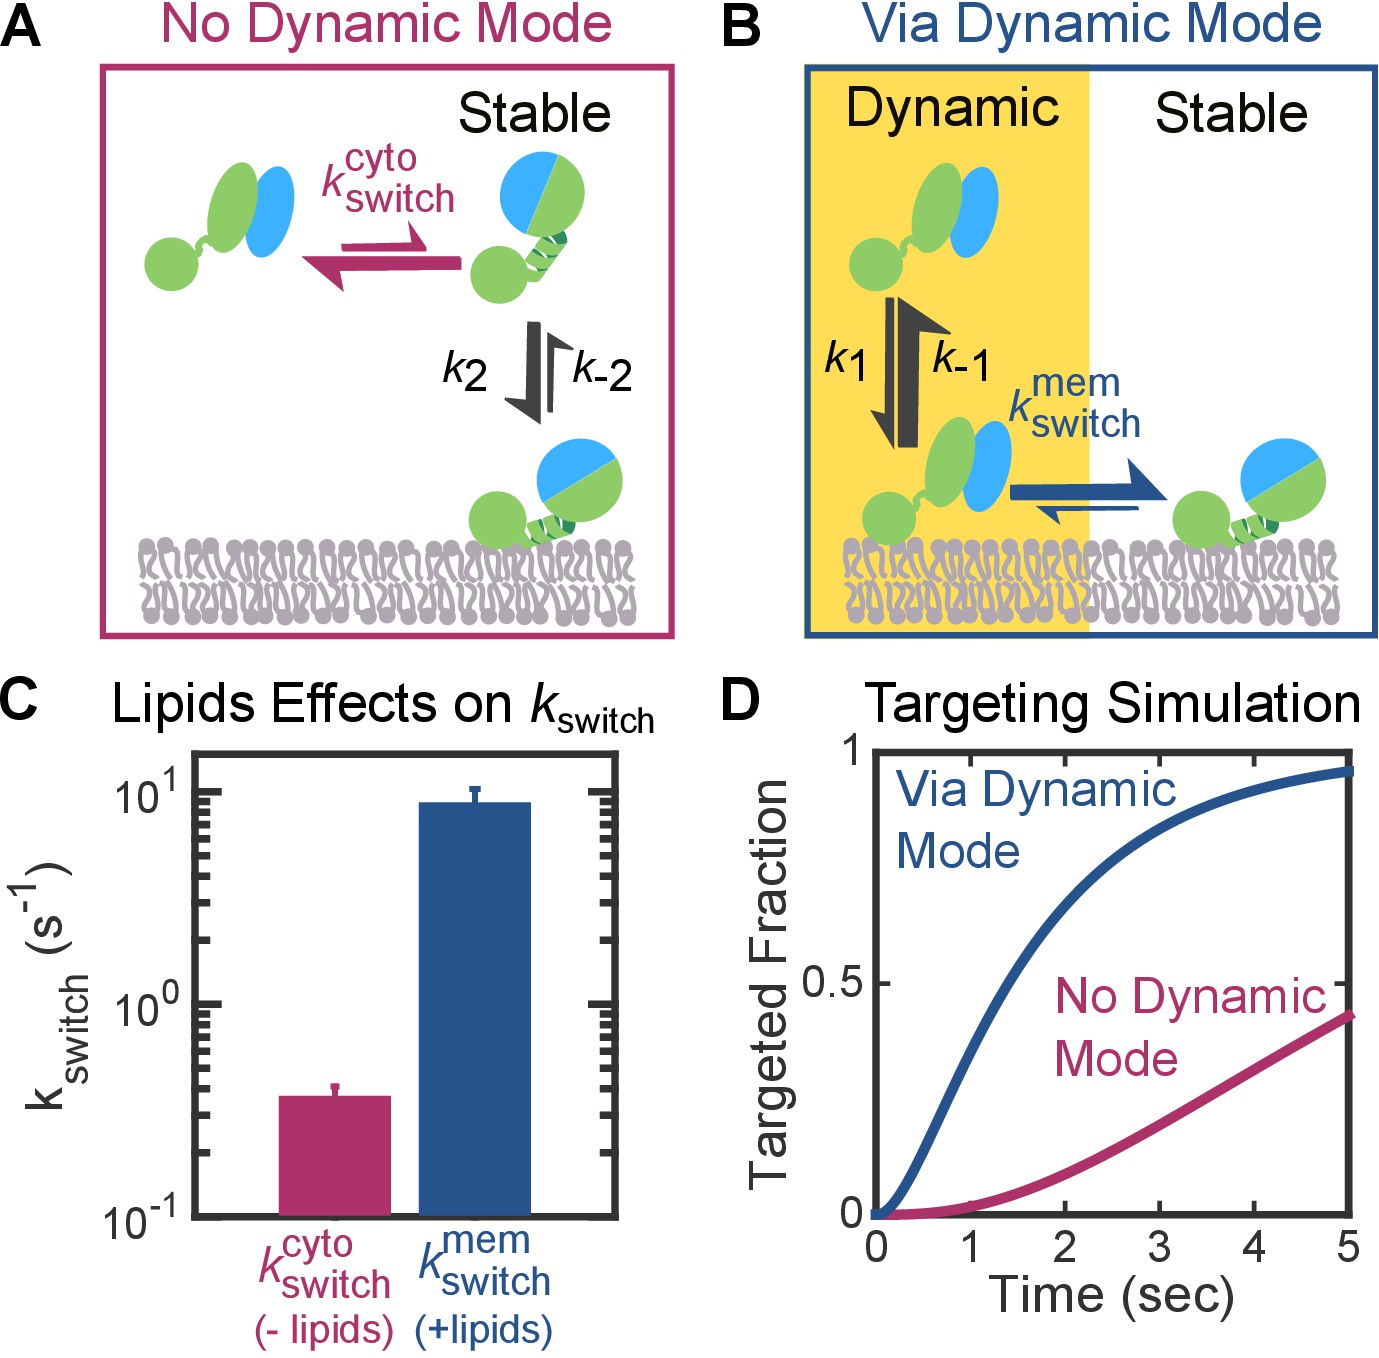
The Dynamic mode enables a faster targeting route for FtsY molecules not pre-activated at the membrane.
(A, B) Depiction of the two thermodynamically equivalent routes to attain the targeting complex bound at membrane in the Stable mode. (C) Rate constants for the early-to-closed rearrangement in the cytosol () and on the membrane (). Values were reported as mean ± S.D. with n = 3. (D) Simulation of the kinetics of RNC targeting to membrane via the routes depicted in parts A (magenta) and B (blue).
Figure 10
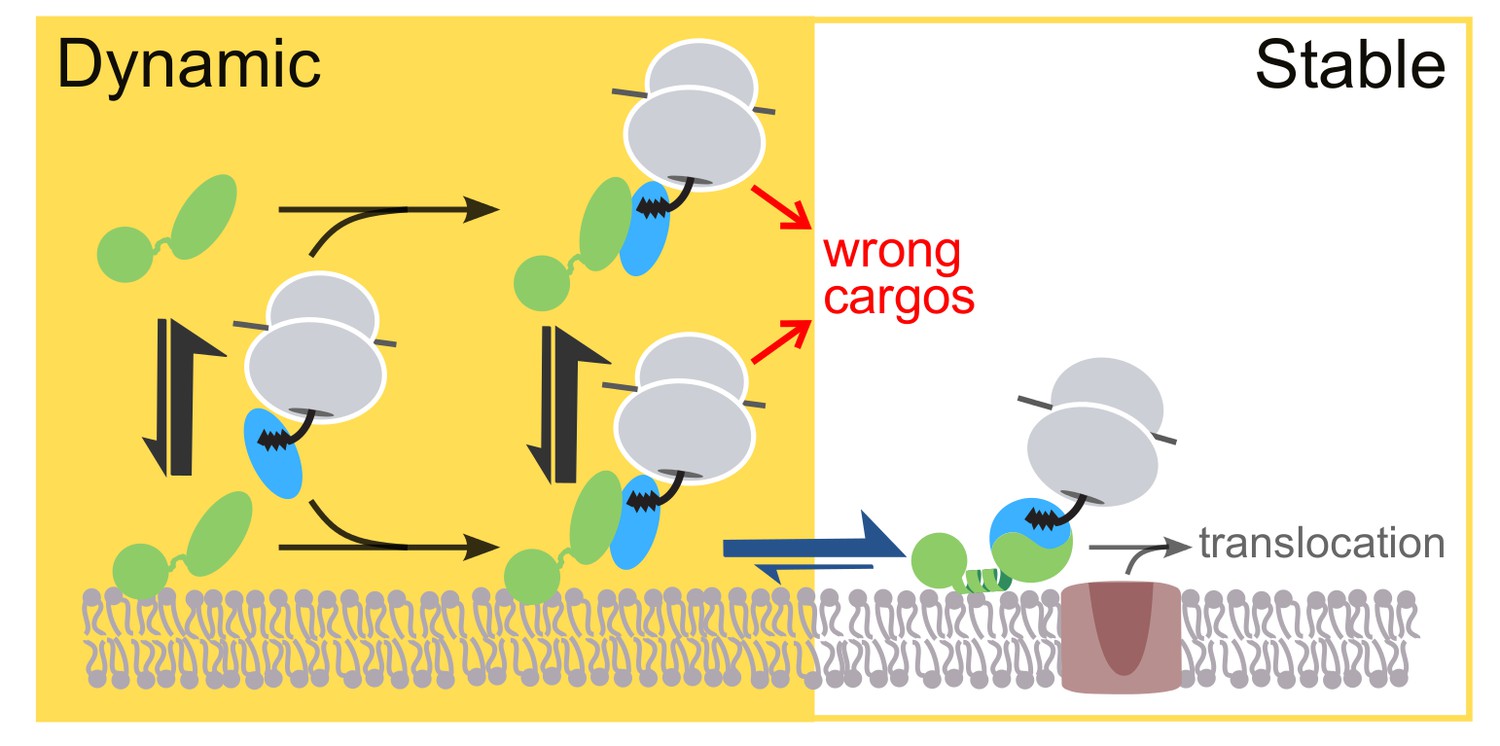
Model for the sequential membrane interaction of FtsY during protein targeting, which balances speed and specificity of the pathway.
The dynamic mode mediates initial membrane association of free FtsY and the early SRP•FtsY complex, followed by rearrangement of the early complex to the closed state/Stable mode at the membrane. The red arrows depict rejection of SRP-independent substrates before FtsY rearranges to the closed state/Stable mode.
Videos
Video 1
Interaction of Free FtsY with SLB.
A representative movie of free FtsY interacting with SLB is shown as raw data in (A) and processed data with colored trajectories in (B). The frame speed is slowed down by 2-fold (~40 ms/frame) for better visualization. Colors were randomly assigned to distinguish different molecules.
Video 2
Interaction of the SRP•FtsY complex with SLB.
A representative movie of SRP•FtsY complexes interacting with SLB is shown as raw data in (A) and processed data with colored trajectories in (B). The frame speed is slowed down by 2-fold (~40 ms/frame) for better visualization. Colors were randomly assigned to distinguish different molecules.
Video 3
Interaction of the SRP•FtsY-dN1 complex with SLB, as negative control.
A representative movie of SRP•FtsY-dN1 associating with SLB is shown as raw data in (A) and as processed data with colored trajectories in (B). The frame speed is slowed down by 2-fold (~40 ms/frame) for better visualization. Colors were randomly assigned to distinguish different molecules.
Download links
A two-part list of links to download the article, or parts of the article, in various formats.
Downloads (link to download the article as PDF)
Open citations (links to open the citations from this article in various online reference manager services)
Cite this article (links to download the citations from this article in formats compatible with various reference manager tools)
Two-step membrane binding by the bacterial SRP receptor enable efficient and accurate Co-translational protein targeting
eLife 6:e25885.
https://doi.org/10.7554/eLife.25885


