Oriented clonal cell dynamics enables accurate growth and shaping of vertebrate cartilage
- Karolinska Institutet, Sweden
- Medical University Vienna, Austria
- Brno University of Technology, Czech Republic
- Uppsala University, Sweden
- Masaryk University, Czech Republic
- University of Michigan School of Dentistry, United States
- Technische Universität Dresden, Germany
- University of Nebraska Medical Center, United States
- Royal Institute of Technology, Sweden
- John Innes Centre, United Kingdom
- National Institute of Diabetes and Digestive and Kidney Diseases, National Institutes of Health, United States
- Sechenov First Moscow State Medical University, Russia
Figures
Figure 1 with 2 supplements
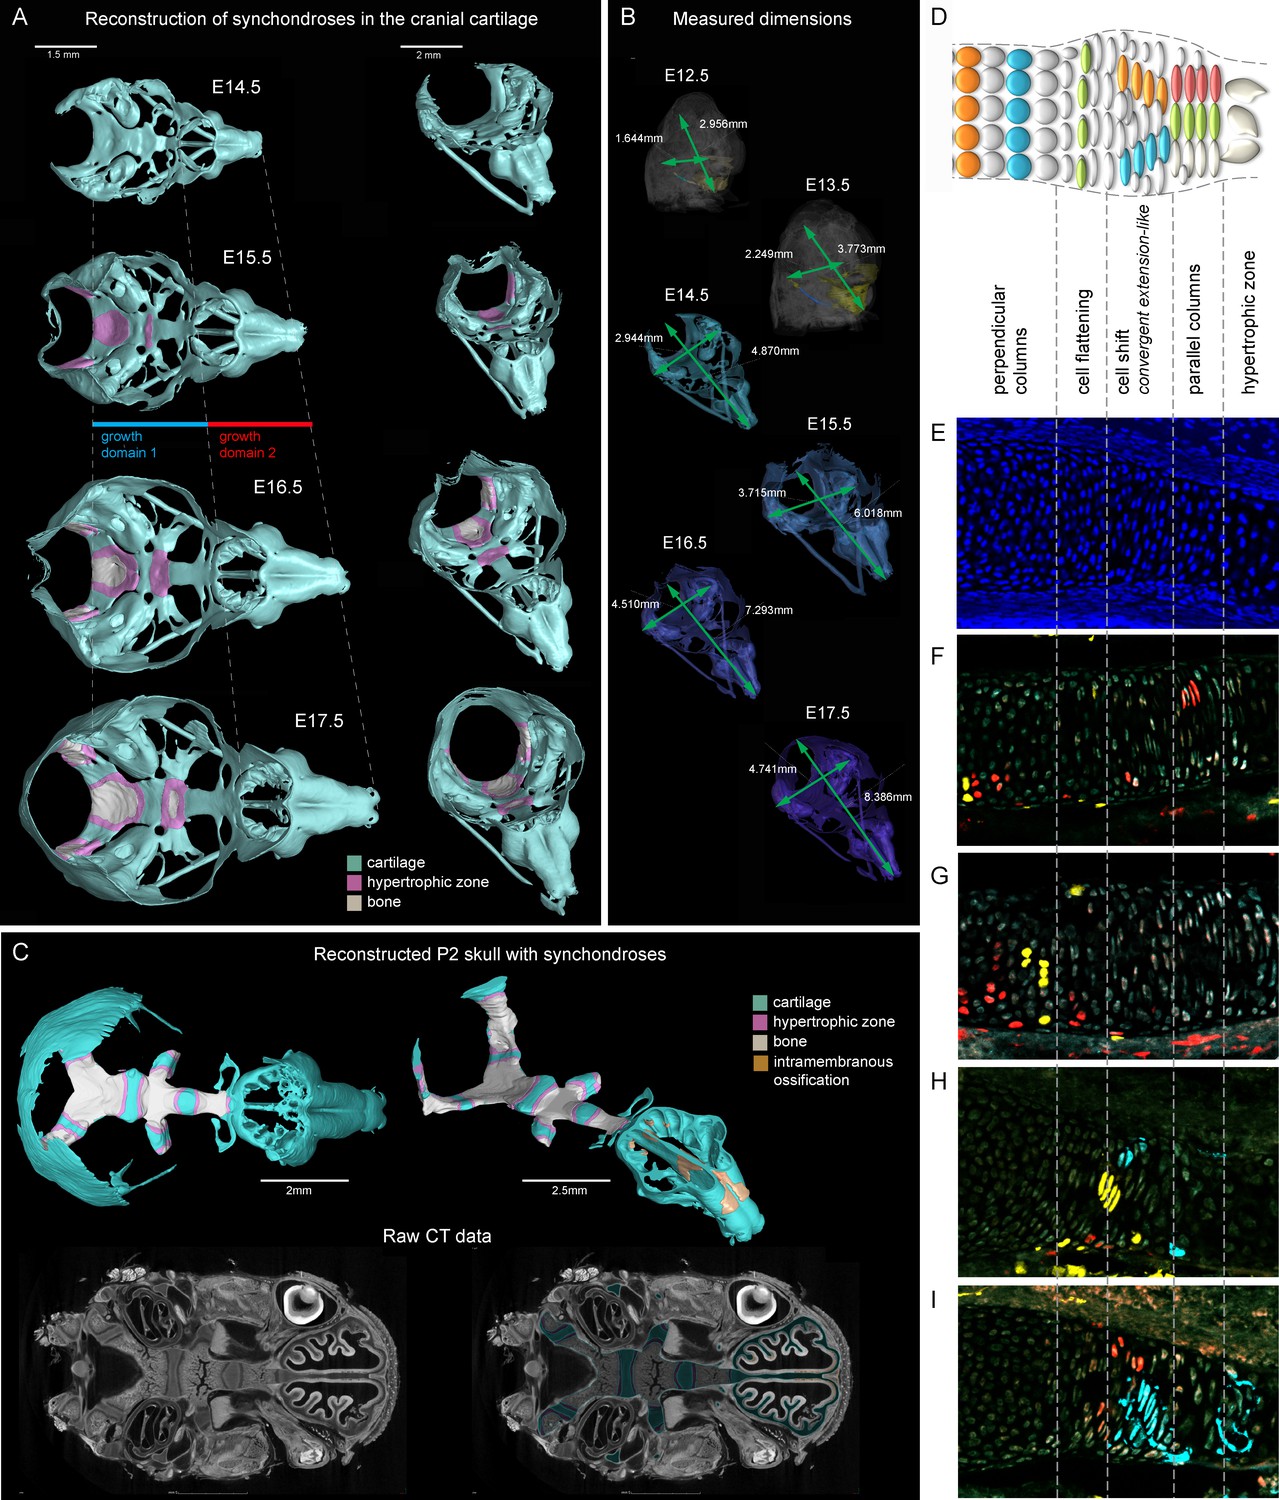
Visualizations of endochondrial ossifications in the chondrocranium during development.
(A) 3D models of chondrocrania with visualized bone and hypertrophic cartilage. Note the absence of endochondrial ossifications in the nasal capsule between E14.5–17.5. Intramembraneous ossifications are not shown. (B) Width and length of the chondrocranium in E12.5–17.5 stages. (C) P2 stage model with visualized bone formation, hypertrophic zones and intramembraneous ossification in the nasal capsule. Clipping planes are applied for better visualizations of synchondroses. Corresponding raw CT data are presented in the lower part. (D–I) Clonal genetic tracing in synchondroses with Sox10CreERT2/R26Confetti; injected at E12.5 and collected at E17.5. (D) Schematic of synchondroses, (E) DAPI stained nuclei, (F–I) different clonal arrangements in various zones of progressing synchondroses.
Figure 1—figure supplement 1
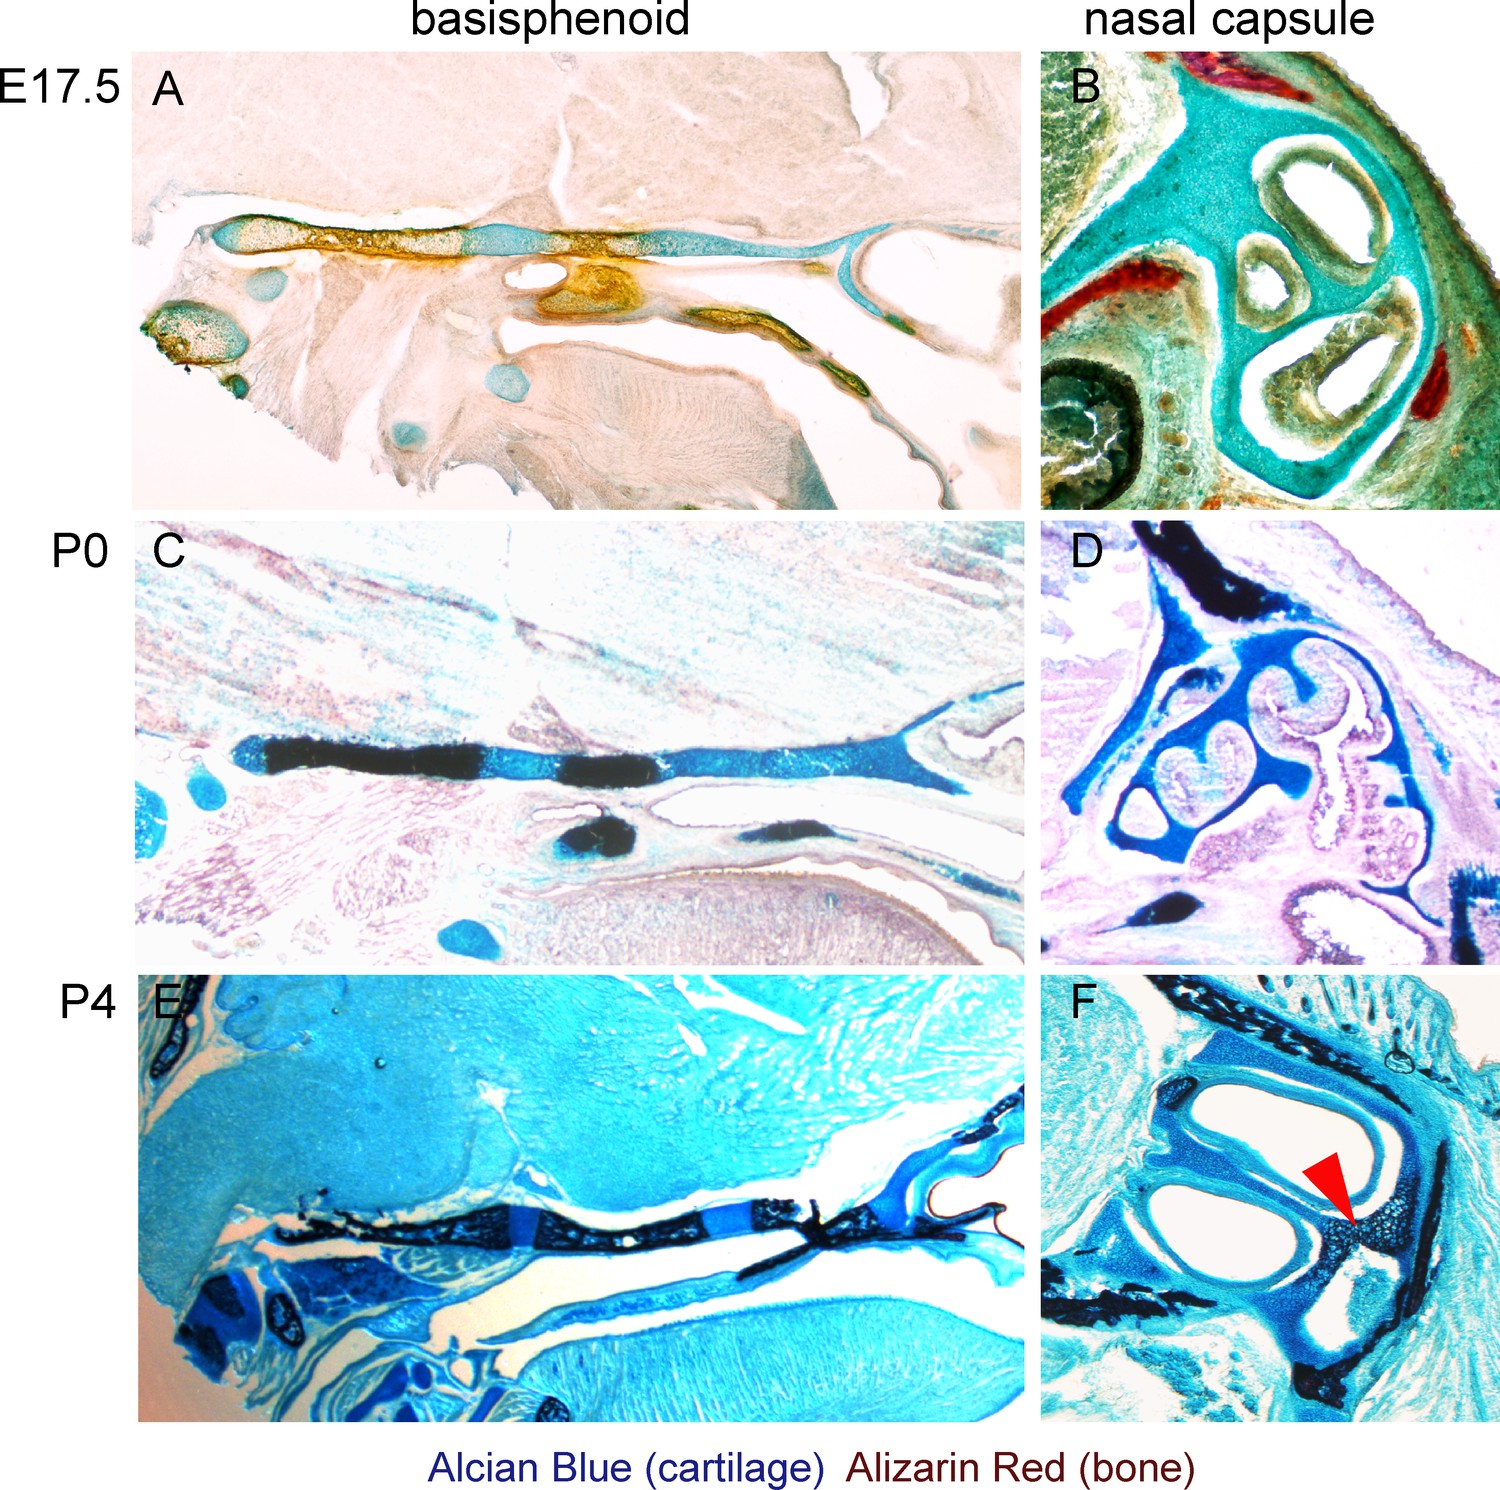
Histological confirmation of μ-CT results.
(A–F) Alcian blue (blue, stains for cartilage) and Alizarin red (red/dark brown, stains for bone) histological staining has been applied on thin sections of E17.5 (A,B), P0 (C,D) and P4 (E,F) heads. The left panel shows progression of ossification in the basisphenoid cartilage, and the right panel shows a lack of endochondrial ossification in the nasal capsule during the embryonic stages (B). The onset of endochondrial ossification in the nasal capsule has been detected only at the P4 stage and is indicated by the red arrow in (F).
Figure 1—figure supplement 2

Immuno- and histological validation of cartilage contrasting obtained from µ-CT analysis and subsequent 3D modelling.
(A) Raw µ-CT scan, a sagittal view through the head of an E15.5 mouse embryo. The yellow dotted line shows the area that is presented as a corresponding 3D model in (B) and the red dotted line shows the area that is magnified in (C), where the border of the nasal capsule cartilage can be clearly distinguished. Color-coded arrowheads in (A–C) mark the same areas of raw µ-CT scans (A,C) and of subsequently segmented 3D model (B). (D) A 3D model of E15.5 chondrocranium is presented inside the overall mouse embryo scan. (E,F) Immunohistological and (G,H) histological analysis and confirmation of obtained raw µ-CT results using various antibodies (Sox5, Sox9 stain for chondrocytes; ErbB3 stains for neuroepithelium and chondrocytes) routinely used for cartilage detection together with histological staining using typical cartilage markers Alcian Blue and Safranin O.
Figure 2 with 2 supplements
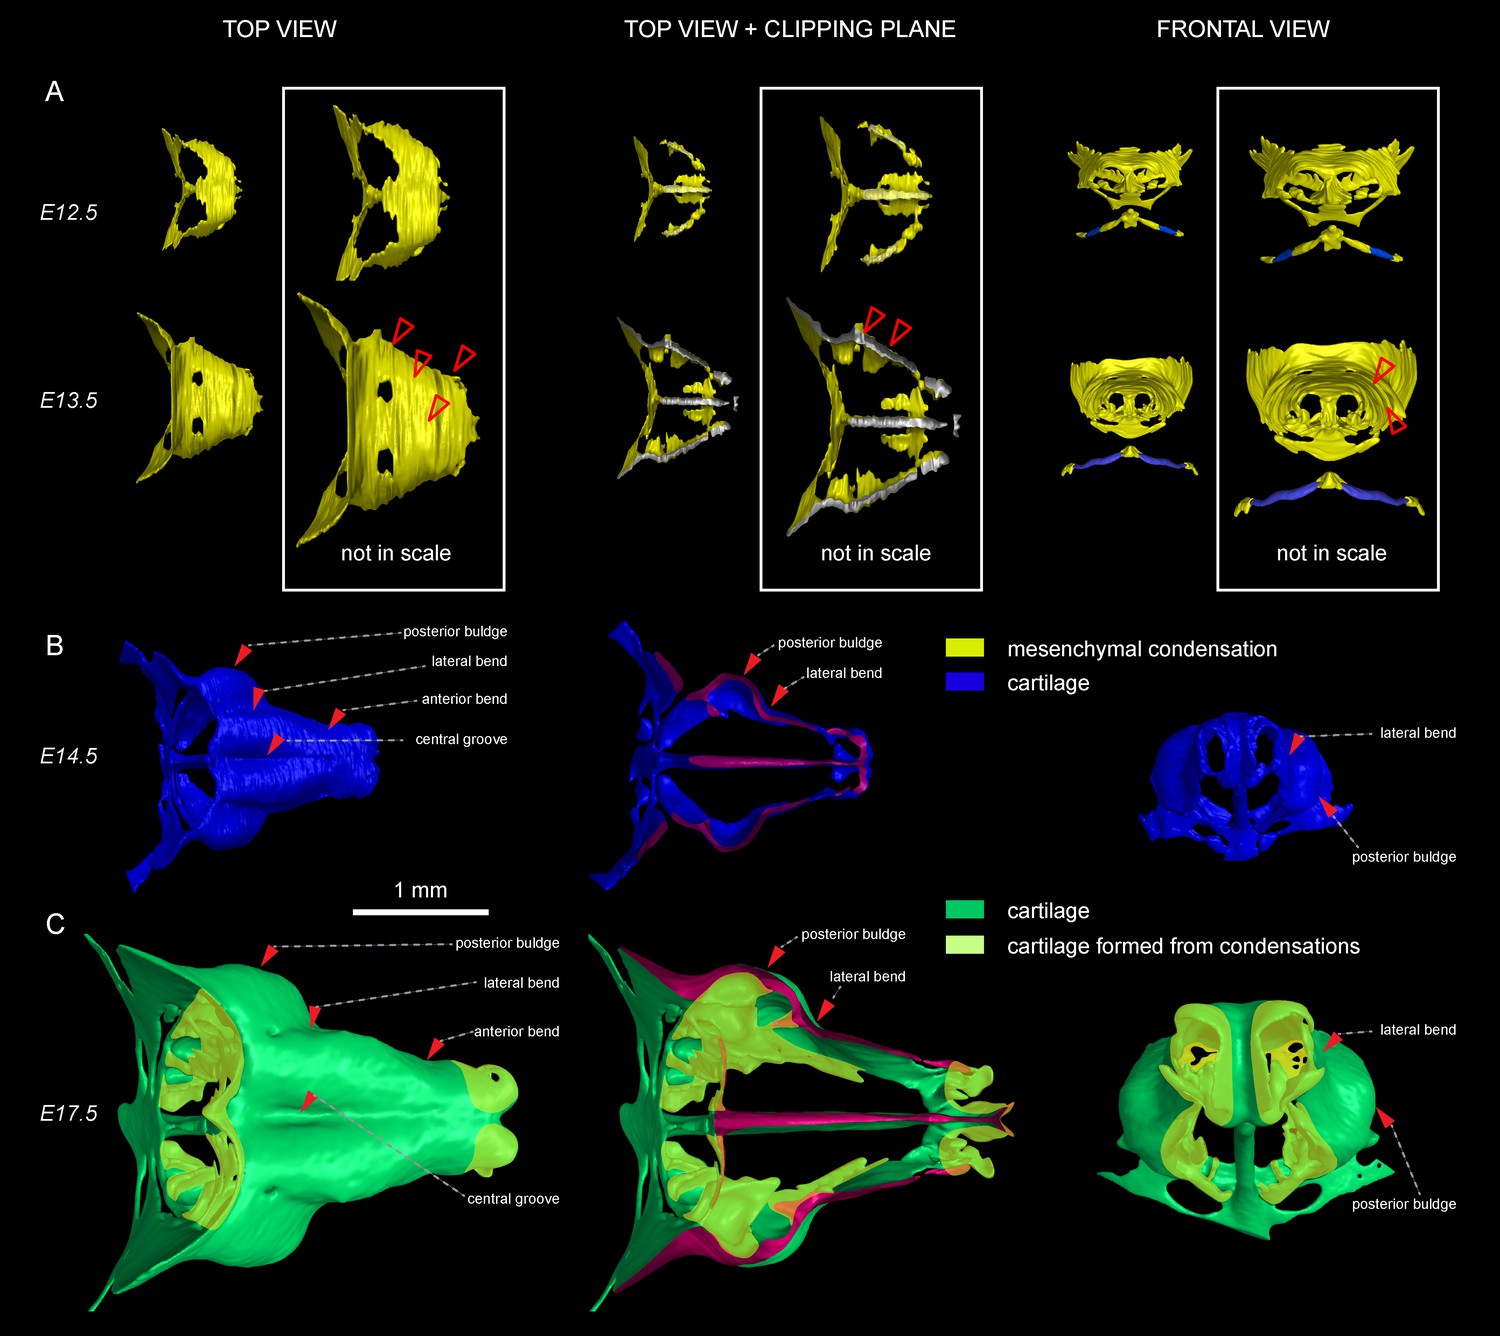
Induction of initial shape and geometrical transformations of the facial chondrocranium.
(A–C) µ-CT-based 3D reconstruction of chondrogenic mesenchymal condensations and cartilage in the face of E12.5, E13.5, E14.5 and E17.5 embryos. (A) Mesenchymal condensations (yellow) segmented from E12.5 and E13.5 embryos and presented in frontal and top projections. Note that the basics of the facial chondrocranium are already established at the stage of mesenchymal condensations during the early development, while general geometry and fine details are tuned during further transformations. (B–C) Top, clipping plane + top and frontal projections of E14.5 (B) and E17.5 (C) developing facial chondrocranium. (C) Yellow color highlights the results of cartilage birth-dating experiments and shows the areas produced from de novo mesenchymal condensations that appear in successional waves after the primary cartilage (shown in green) is produced at previous stages (E14.5). Note that the shape of the facial chondrocranium develops as a result of incremental formation and additive fusion of new mesenchymal condensation with pre-existing cartilage. Red arrows indicate areas of cartilage which bend at later developmental stages (B,C) and red-outlined arrows indicate the same areas within the mesenchymal condensations at E13.5, prior to bending (A, bottom).
Figure 2—figure supplement 1

Genetic tracing serves as a tool for birth-dating of the cartilage during the embryonic development.
(A–H) Genetic tracing was induced at E12.5 in Sox10-CreERT2/R26Confetti (A–F) and Col2a1-CreERT2/R26Confetti (G, H), and all samples were analyzed at E17.5 in sagittal and transversal sections. Cartilage structures are outlined with a white dashed line for better orientation. Parts of the structures that do not contain traced cells such as the front part of the nasal prominence, the cribriform plate or the fine inside parts of the olfactory labyrinth originated during later developmental stages as a result of a new placement of mesenchymal condensations and not as an outgrowth of the existing structures. (I, J, K) E14.5 and E15.5 embryos were analyzed 24 hr after the EdU (green) pulse. Immunostaining of Sox9 (to visualize cartilage) and ErbB3 (to visualize mesenchymal condensations) show that newly placed and fast proliferating mesenchymal condensations generate fine geometrical details inside of the nasal capsule (conchae, cribriform plate). (K, L) µ-CT analysis and segmentation show mesenchymal condensations originating at E15.5 on a raw µ-CT image (K), while comparisons of 3D-models at E14.5 and E17.5 highlight de novo formed cribriform plate (indicated with white lines).
Figure 2—figure supplement 2
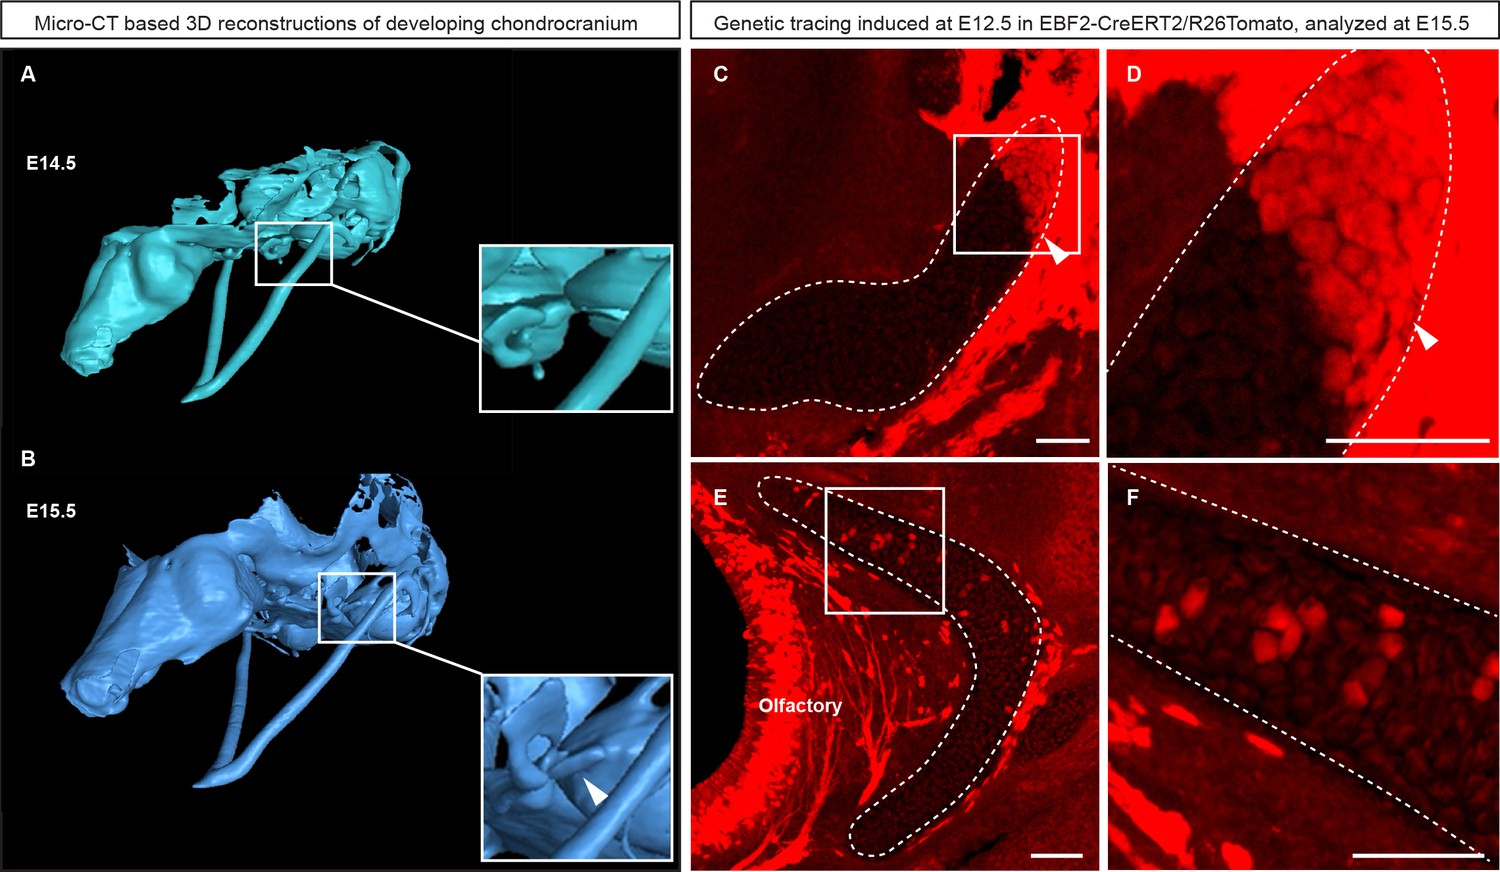
Genetic tracing based on Ebf2-CreERT2/R26Tomato serves as an indicator for structures developed from late mesenchymal condensations.
(A–B) 3D-models of chondrocranium segmented from µ-CT scans of E14.5 (A) and E15.5 (B) embryos. Frame and magnified inset in (A) show the location where the connector structure will develop during next 24 hr. Frame and magnified inset in (B) show successfully formed connector cartilage. (C–D) Sagittal cross-section of the connector showing the results of genetic tracing induced by tamoxifen injection at E12.5 and analyzed at E15.5 in EBF2-CreERT2/R26Tomato embryos. Note the sharp border (arrowheads) created by the traced chondrocytes. Taken together, these results highlight the direct origin of the traced connector part from late mesenchymal condensation, and its later fusion with pre-existing cartilage. (E–F) Traced Ebf2+ cells (Tomato+) contributed to the growth of pre-existing cartilage by producing new transversal columns of chondrocytes. Note the oriented organization of these columns in the olfactory cartilage.
Figure 3 with 2 supplements
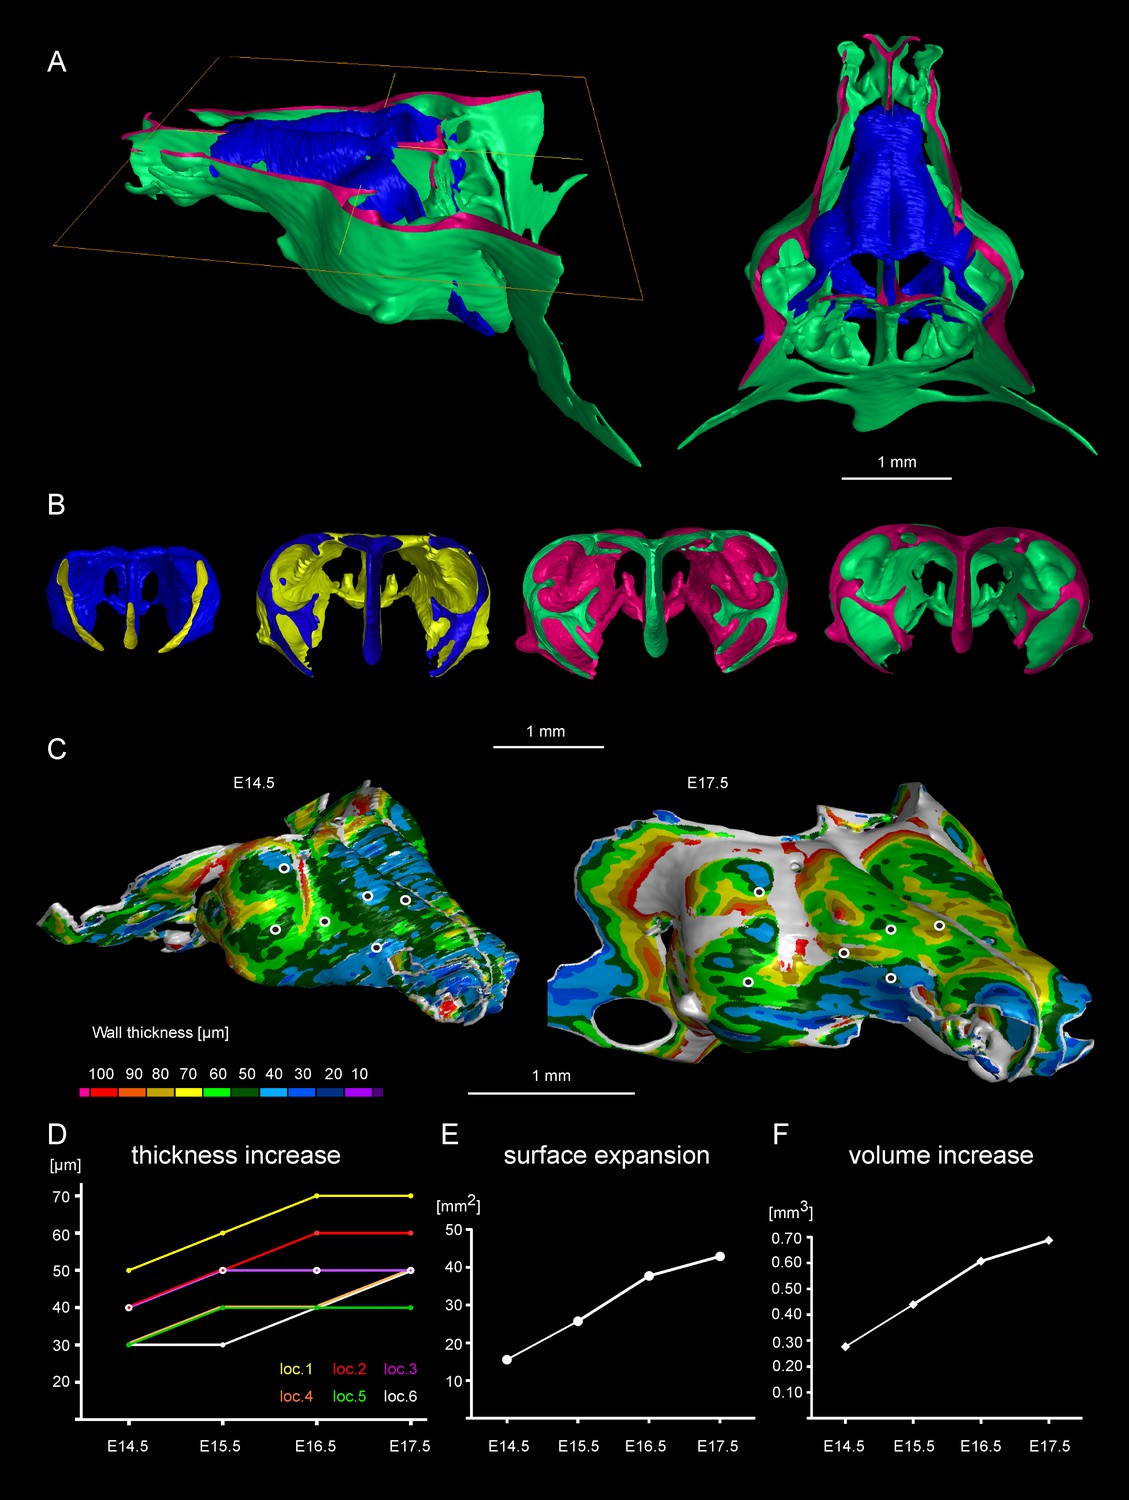
Facial chondrocranium undergoes major lateral expansion without extensive thickening during growth.
(A) The 3D-model of E14.5 nasal capsule (blue) is placed onto the E17.5 model (green) for better presentation of growth-related changes. (B) Frontal clipping planes of 3D-models of nasal capsules at E14.5, E15.5, E16.5 and E17.5 (from left to right). Notice the mild changes in cartilage thickness as compared to the lateral expansion of the whole structure during growth. (C) Cartilage thickness heat-maps at E14.5 and E17.5 developmental stages. Less thick locations (color-coded in blue) correspond to intense growth zones shown in Figure 11. Dots show individual positions selected for precise measurements and demonstration on the graph shown in (D). Note that after E16.5 cartilage thickness remains relatively stable. (E–F) Cartilage surface area (E) and volume (F) expansion has been measured and compared between above mentioned stages. Note that there is a much greater increase in surface and volume (approximately 3-fold) than in thickness of the cartilage (less than 50%).
Figure 3—figure supplement 1
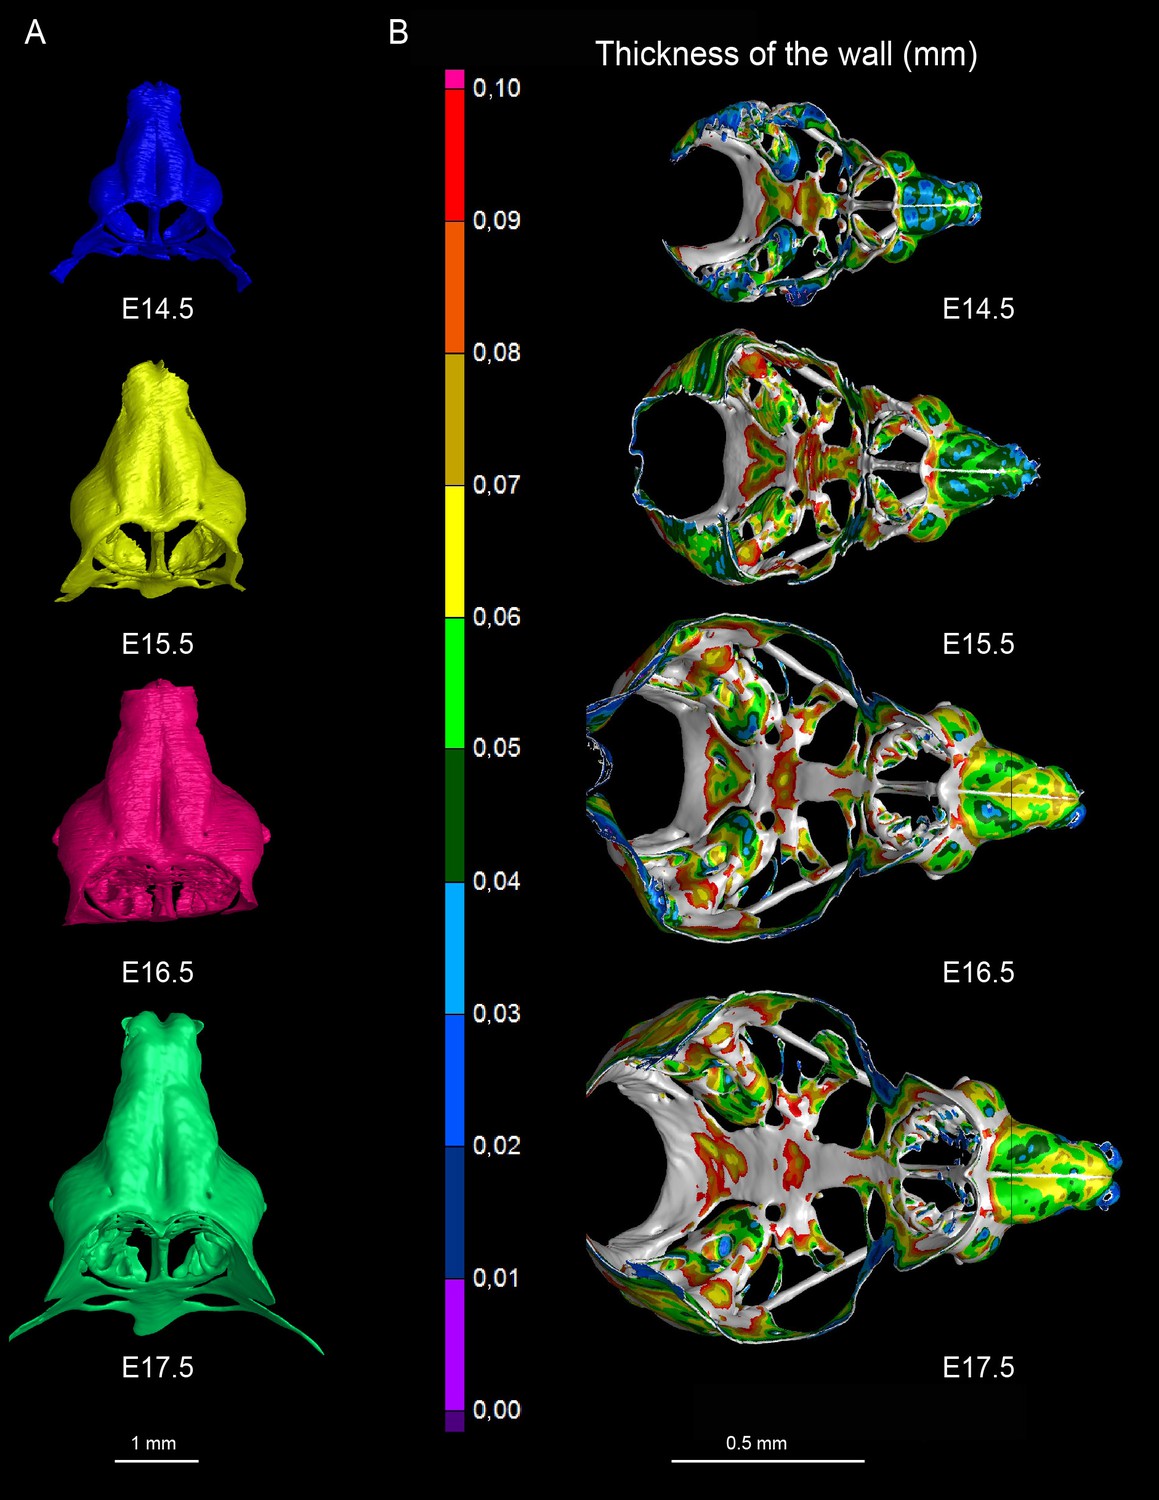
3D models and wall thickness analysis of chondrocraniums at different developmental stages.
(A) 3D models of nasal capsules created from segmentation of the raw µ-CT scans of mouse embryos at developmental stages E14.5 to E17.5. (B) Analysis of the cartilaginous wall thickness (shown by heatmap) of the whole chondrocraniums at E14.5-E17.5 developmental stages. Thin (blue color-coded) areas tend to correlate with the high proliferation zones presented in Figure 11.
Figure 3—figure supplement 2
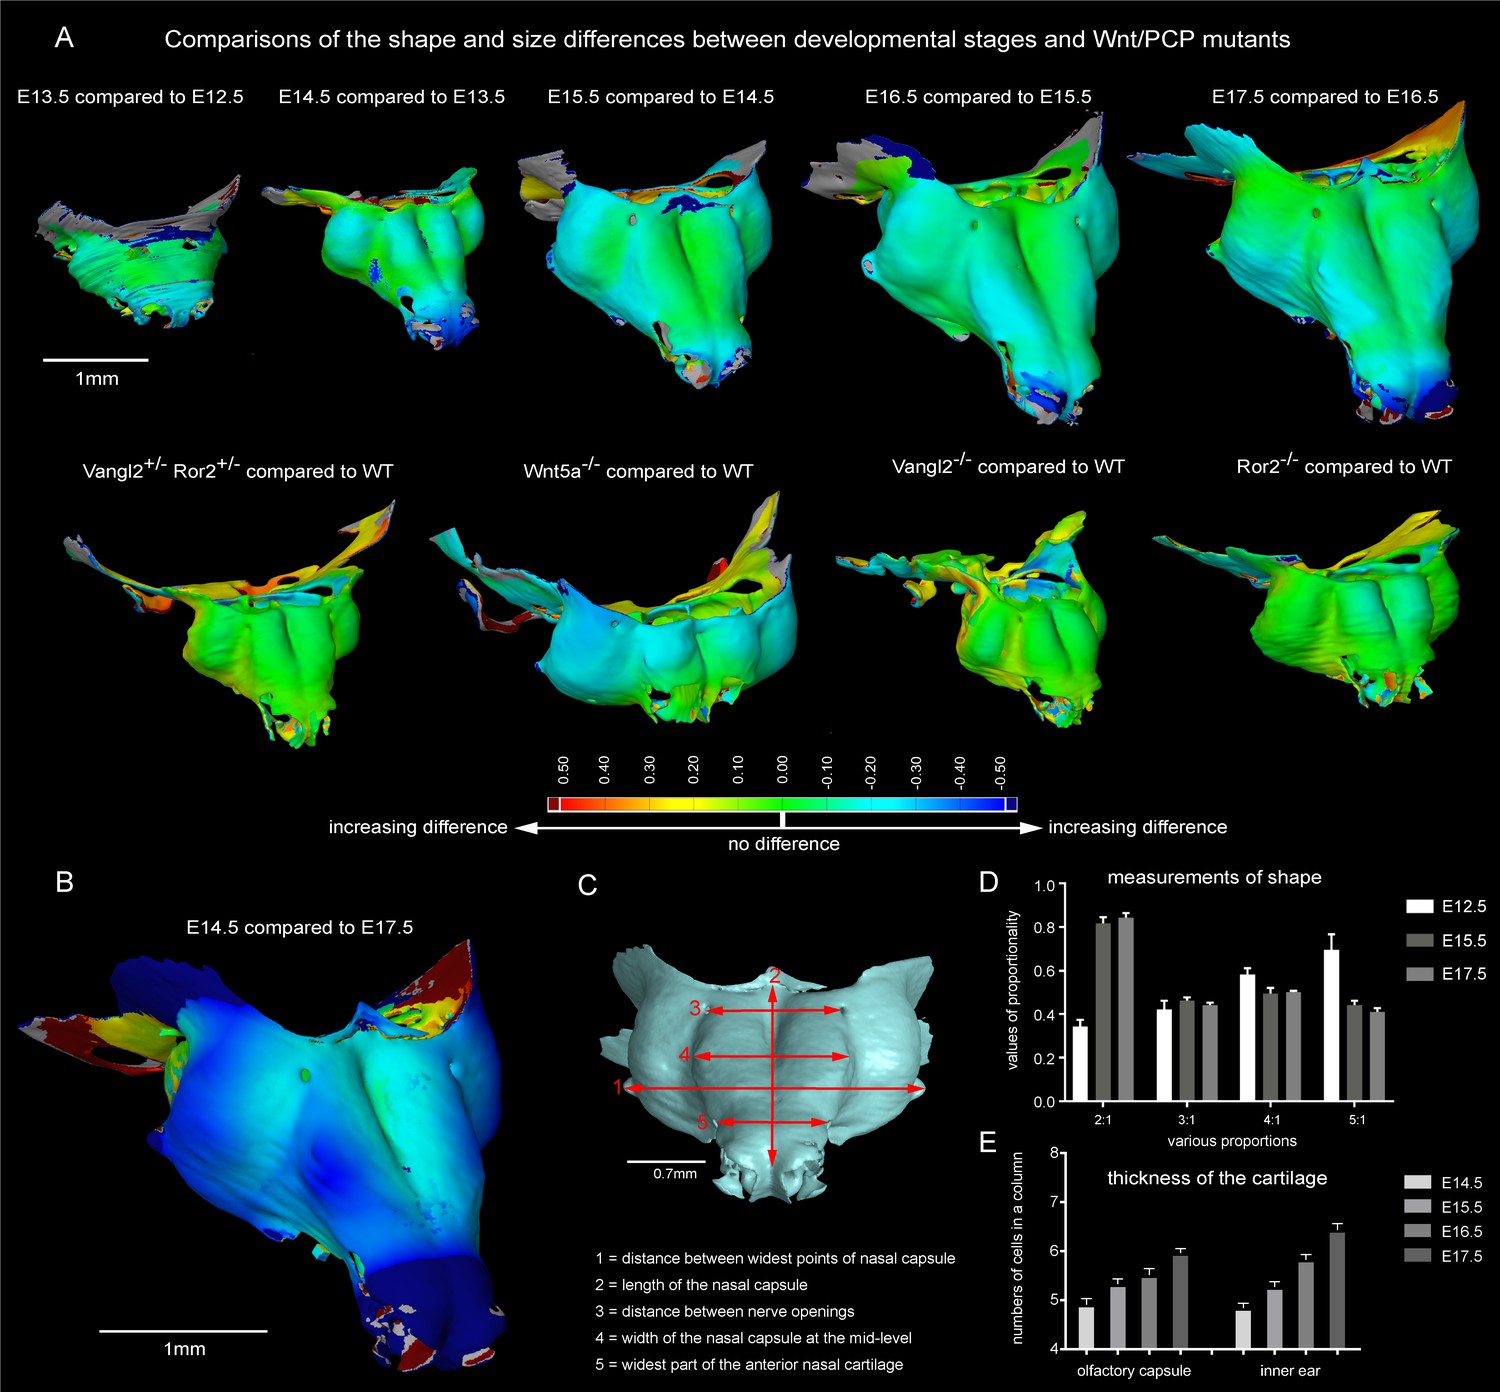
Comparisons of the shape and size differences between developmental stages and Wnt/PCP mutants.
(A) Developmental stages E13.5, E14.5, E15.5, E16.5 and E17.5 were compared to the previous developmental stage in a GOM Inspect Software. E15.5 Wnt/PCP mutants (Wnt5a-/-, Vangl2-/- and Ror2-/- together with Vangl2+/-Ror2+/- heterozygous control) have been compared to the same stage of a wild-type control embryo in the GOM Inspect Software. Coloration represents the incremental difference in shape of the compared samples from green towards red or blue color. (B) Shape comparison between E14.5 and E17.5 stages. Note that the differences in geometry of these two stages are far greater than differences between all other consecutive stages. (C) The dimensions used for morphometric analysis. (D) Morphometric analysis of E12.5, E15.5 and E17.5 stages. Proportions are used to compensate for individual shrinkage of the samples. Measurements are represented as mean ± SEM, n = 3. (E) Number of cells in a column in the olfactory capsule and in the inner ear is represented as the mean ± SEM, n ≥ 4.
Figure 4 with 2 supplements

Clones of chondrocytes show transversely oriented columnar structure in sheet-shaped facial cartilage.
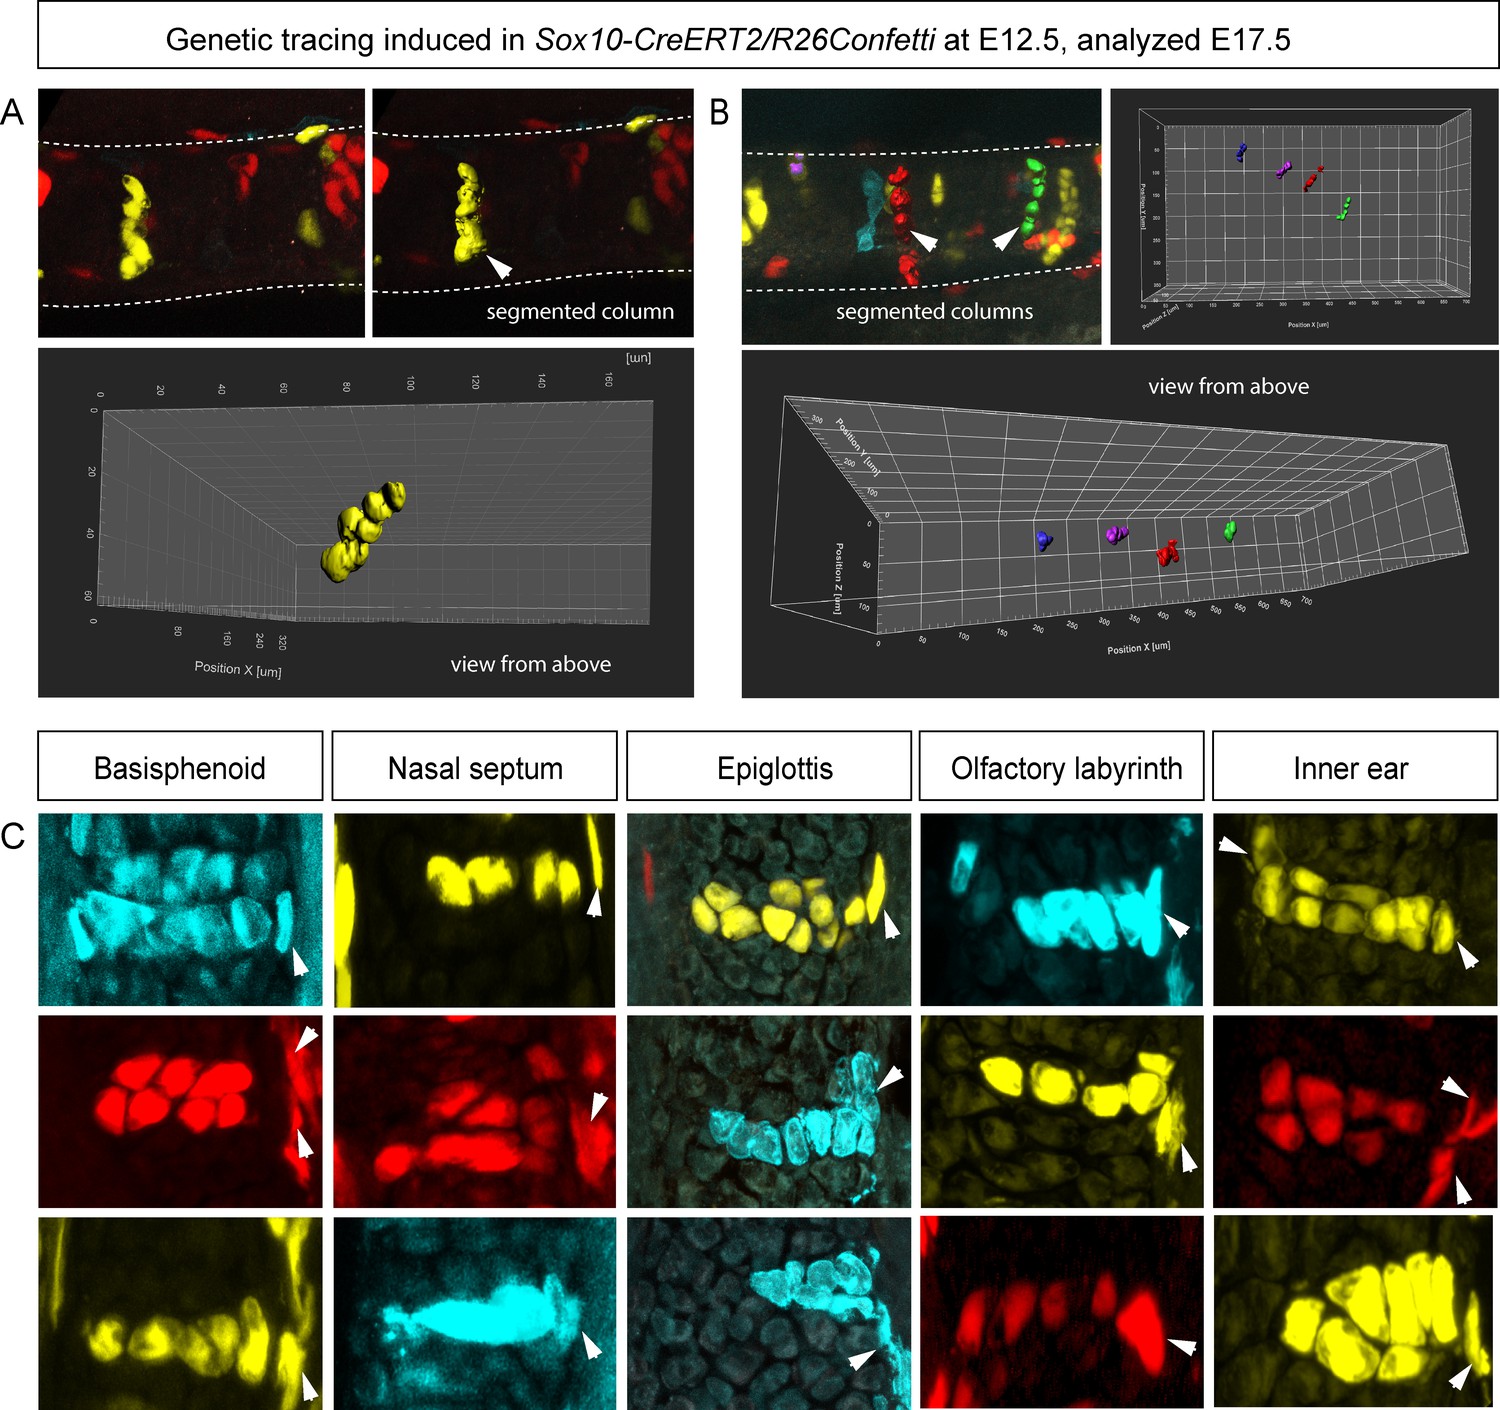
(A–C) Chondrocyte clones at E17.5 were genetically traced from neural crest cells (E8.5), sagittal sections. The cartilage is outlined with white dashed line. (D–F) Analysis of EdU incorporation (24 hr after the pulse) into growing cartilage at different stages. Arrowheads indicate sparse columnar arrangements of EdU+ cells. Rose diagrams show orientation of EdU+ clusters in the cartilage of embryos at E14.5 (D), E15.5 (E) and E16.5 (F). (G) Genetic tracing of chondrocytes initiated at 12.5 and analyzed at 15.5. The clipping plane of a 3D-model (side projection) is shown for better orientation in the analyzed region. Note the transverse orientation of clonal doublets and columns (arrowheads). (H–J) Genetic tracing induced at E15.5 and analyzed two days later in embryos of Sox10-CreERT2/R26YFP mouse strain. Arrowheads indicate clonal columns of chondrocytes that formed inside of the growing cartilage between E15.5 and E17.5. The orientations of clonal arrangements are shown in the rose diagram in (K). (L) Orientation of clonal doublets and columns in genetically traced cartilage (from E12 to E15) of Col2a1-CreERT2/R26Confetti embryos. Scale bars = 100 µm.
Figure 4—figure supplement 1
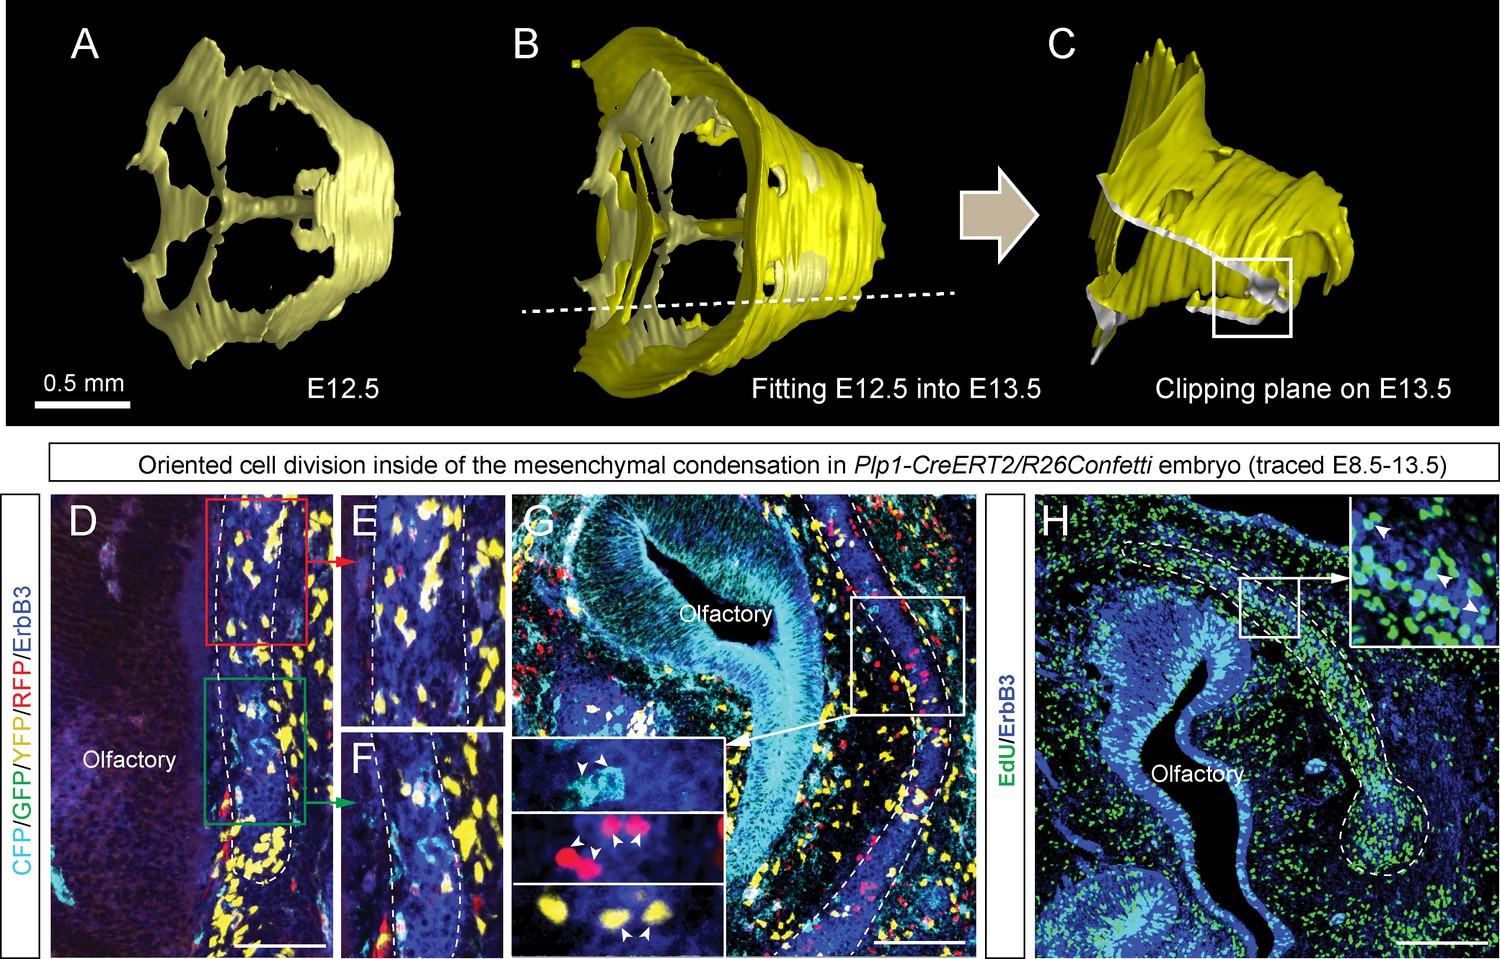
Oriented clonal dynamics in chondrogenic mesenchymal condensations.
(A–C) 3D-models of chondrogenic condensations at embryonic stages 12.5 (A–B) and 13.5 (B–C). (B) E12.5 model is fitted inside of the E13.5 model for size and geometry comparisons. (C) Clipping plane and the outlined area on the 3D model of E13.5 facial pre-chondrocranium shows the localities presented in panels D, E, F, G and H. (D–G) Genetic tracing of neural crest-derived clones shows transversally-oriented clonal doublets in the mesenchymal condensations (CFP, GFP, YFP and RFP colors are produced upon recombination of Confetti reporter). ErbB3 was utilized to visualize mesenchymal condensations. Outlined areas in D are shown magnified in (E, F). Arrowheads in (G) indicate oriented clonal doublets. (H) Analysis of EdU incorporation in dividing cells of the facial mesenchymal condensations six hours after the pulse. Notice the perpendicular orientation of cell doublets highlighted by arrowheads.
Figure 4—figure supplement 2
Clonal oriented clusters of chondrocytes contain closely associated perichondrial cell in flat facial cartilages.
(A,B) 3D visualizations of solitary clonal columns using 150 µm-thick sections. The dotted line indicates the border of the cartilage. (C) Examples of oriented clonal clusters and columns containing a single clone-derived perichondrial cell in various cartilaginous elements traced in Sox10-CreERT2/R26Confetti embryos. Arrowheads point at flat-shaped perichondrial cells.
Figure 5

Mathematical model of cell dynamics during sheet-shaped cartilage development and growth.
(A) Transversal (along z-axis) clipping plane showing conceptual arrangements of modelled cells within the layer as a result of a typical simulation. The degree of microstructure order, S, is measured by the sum of orthogonal projections on the unit vector in the z-direction, normalized by the number of cells. (B) Visualized and modelled one- and two-sided gradients used to direct oppositional growth of the clonal columns during computer simulations. (C) The degree of determinacy in the response to the external gradient is modeled by a parameter, b, where a high value results in near perfectly polarized cell divisions (pushing may still introduce randomness in the eventually chosen site) and where the limit b tends to zero results in completely random division directions. As can be seen, the degree of microstructure order, and hence columnar growth, increases with the strength of the polarization response. (D) For a strongly polarized cell, the model predicts that even a large variation in the individual cell division times results in only a moderate decrease in the columnar order. (E) Graph showing the dependence of cartilage thickness on the absence or presence of one- and two-sided polarizing gradients. (F) Graph showing how the regularity of the thickness depends on the presence of a polarizing gradient. Note that, based on (E–F), the conditions with polarization demonstrate higher regularity and thickness over multiple locations. (G–I) Snapshots of typical in silico simulations of cell dynamics during sheet-shaped cartilage development: layers of chondrogenic cells demonstrated in 3D before (G) or after simulations (H–J) shown together with 2D heatmap diagrams of cell layer thickness irregularity (below) represented as a view from above (x,y dimensions). Clonal progeny is represented as individually color-coded cellular clusters or columns in 3D visualizations. Note the high degree of thickness irregularity that corresponds to the variety of differently oriented clonal shapes in condition with no polarizing gradient (I). The highest geometrical regularity of the modelled cartilaginous sheet together with stereotypical columnar clonal arrangement is achieved in the condition with two-sided polarizing gradient (H).
Figure 6
Clonal arrangements of chondrocytes influence local geometry and cartilage surface.
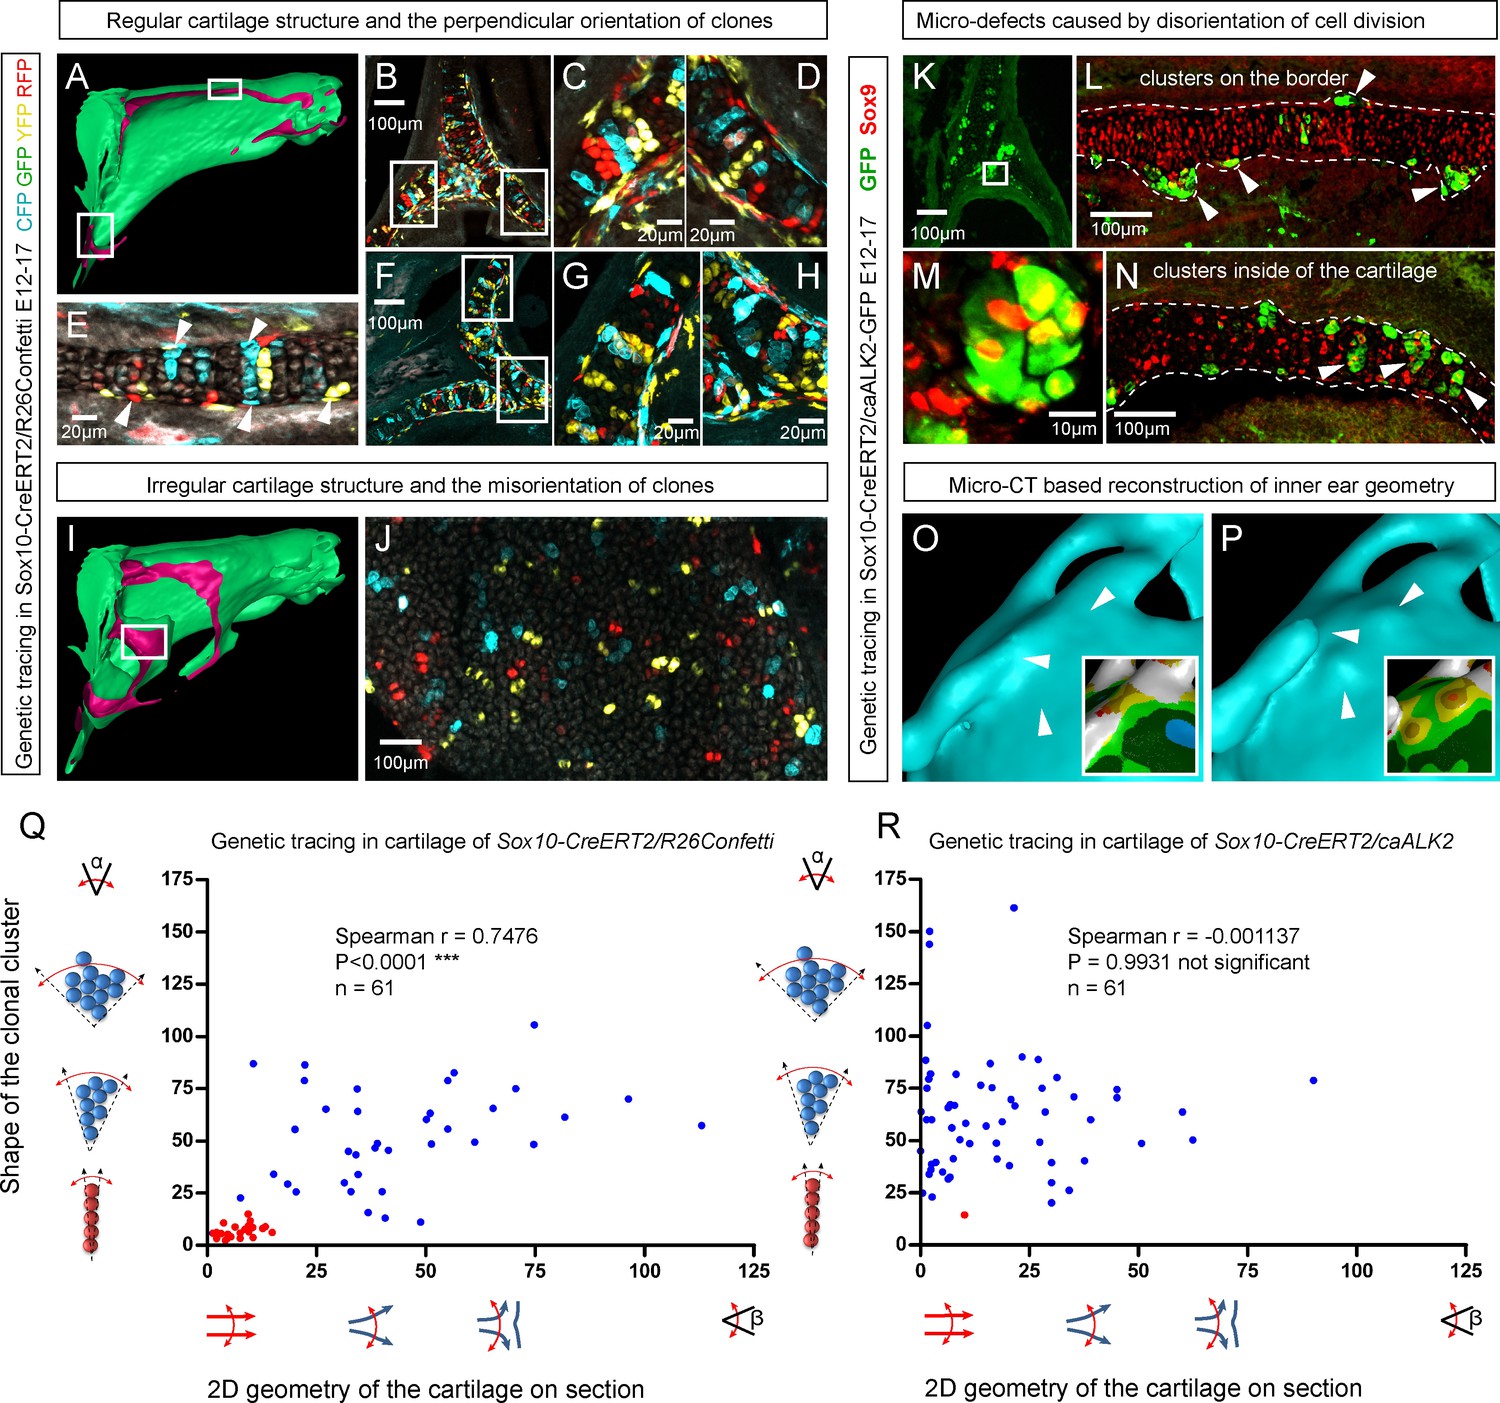
(A–H) Columnar clonal arrangements in sheet-shaped cartilages of facial chondrocranium visualized with genetic tracing in Sox10-CreERT2/R26Confetti embryos. (A) 3D-model with a clipping plane shown as a side projection. White frames show locations analyzed in (B–H). Panels (C,D) and (G,H) represent magnified areas outlined in (B) and (F), respectively. (E) Traced perichondrial cells at the base of chondrocyte columns that share a clonal origin and are indicated by arrowheads. Note that rich tracing in the perichondrium correlates with highly efficient tracing in the cartilage (compare, for example, (B–D and E). (I–J) Clonal clusters show no columnar structure in geometrically irregular elements such as junctions and fusion points of several cartilaginous elements (highlighted in 3D-model with frame). (K–P) Cre-based activation of ACVR1 in facial sheet-shaped cartilage elements of Sox10-CreERT2/stopfloxed/floxedcaAlk2-IRES-GFP embryos induced at E12.5 and analyzed at E17.5. Locations are the same as highlighted in (A). (K–N) Green clusters are sparse and clonal and show successful activation of ACVR1. Note the formation of spherical clusters of chondrocytes instead of transversely oriented columns. Spherical clusters bulging from the sheet-shaped cartilage are indicated by arrowheads in (L). Amorphous clusters caught inside of the structure are indicated by arrowheads in (N). The cartilage surface is outlined with a dotted line. (O–P) Despite low efficiency of Cre-based ACVR1 activation, the local disruptions of cartilage 3D geometry (analyzed with µ-CT) take place: the inner ear capsule is affected by bulges and the connecting junction is destroyed as indicated by arrowheads. Thickness heatmaps of analyzed location show local thickening of the cartilage as a result of non-oriented placement of chondrocytes with disrupted BMP signaling. (Q–R) Graphs showing how the regularity of the cartilage (flatness) correlates with orientation of clonal envelopes in the cartilage of Sox10-CreERT2/R26Confetti (Q) and Sox10-CreERT2/stopfloxed/floxedcaAlk2-IRES-GFP (R) embryos. The angle α characterizes the elongation of a clonal cluster consisting of multiple cells, as shown in a legend of a corresponding graph axis. Small values of α correspond to highly oriented clonal envelopes such as vertical clonal columns. Angle β is the angle between two opposite cartilage surfaces framing cartilage tissue in this locality. Sheet-shaped cartilages have almost parallel surfaces and angle β values are normally set between zero and 20 degrees. Note that the population of clonal columns (red dots) is almost completely eradicated from the cartilage when ACVR1 is activated in (R).
Figure 7
Deficiencies in Wnt/PCP pathway reshape the chondrocranium.
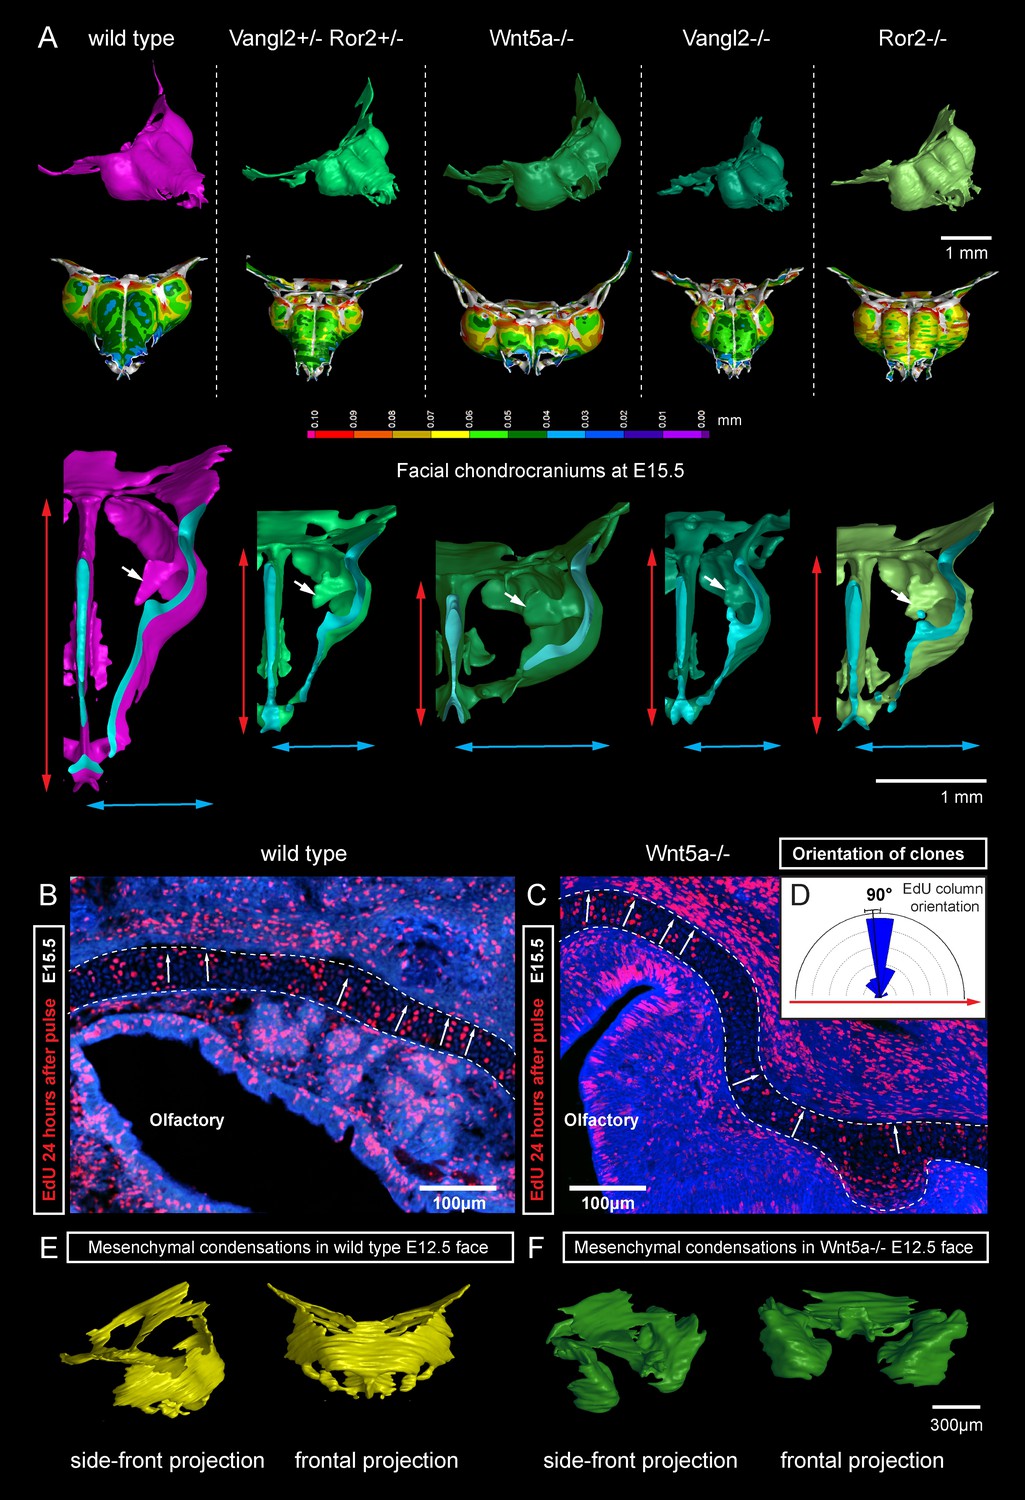
(A) µ-CT-based reconstructions of the facial chondrocranium of wild type control, Wnt5a-/-, Vangl2-/-, Ror2-/- and Vangl2-/+/Ror2-/+ embryos at E15.5, with wall-thickness analysis (the row below). Clipping planes in the top projections show that all major- and fine structures (indicated by white arrows) are in place in the Wnt/PCP mutants. Red and blue arrows help to compare the width and the length of the chondrocranium. (B–D) Analysis of EdU incorporation in the facial sheet-shaped cartilage, 24 hr after the pulse: control (B) and Wnt5a-/- mutant (C) embryos. Sparse clusters and columns of EdU+ cells correspond to clonal arrangements previously shown with genetic tracing in the same locations. Note that the orientation of chondrocyte placement in the cartilage is not affected in the mutant embryos. Quantification is presented in a rose diagram in (D). For control, we refer to the rose diagrams in Figure 3. (E, F) µ-CT-based 3D reconstruction of mesenchymal condensations at the developmental stage E12.5 in control (E) and Wnt5a-/- mutant (F) embryos shows their misplacement in a mutant.
Figure 8
Manipulation of cartilage thickness in GSα mutant embryos.
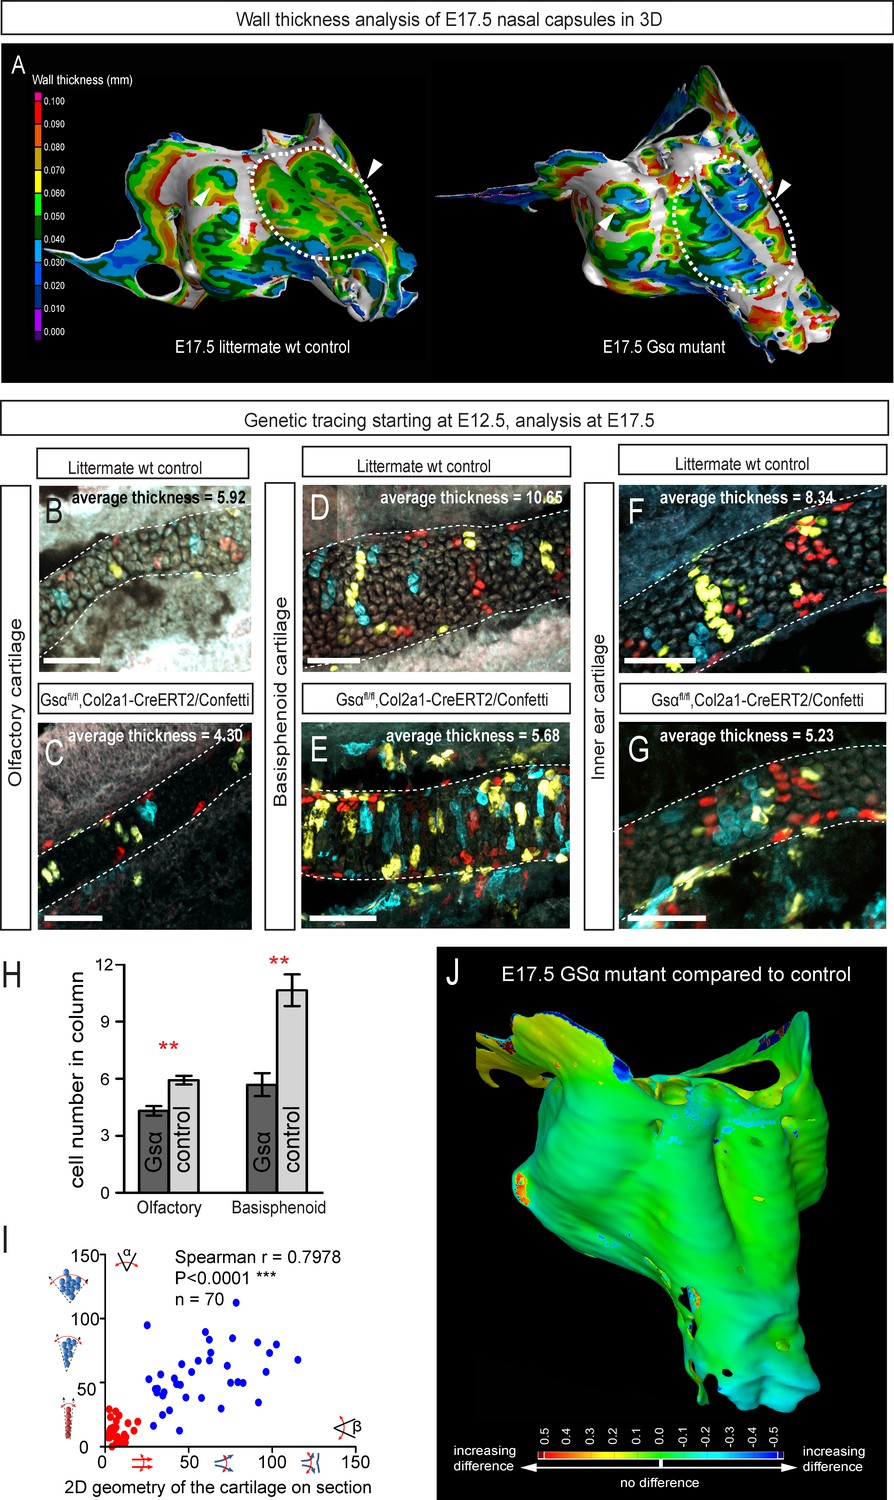
(A) Wall thickness was analysed in the µ-CT segmented olfactory system of control (left) and GSα (G-protein subunit alpha) mutant (right). Large areas with decreased cartilage thickness are highlighted with a dashed line and white arrows. (B–G) Clonal genetic tracing of chondrocyte progenitors and chondrocytes induced by tamoxifen injection at E12.5 in Col2a1-CreERT2/R26Confetti/GSα floxed/floxedembryos (C,E,G) and littermate controls (B,D,F) at E17.5. (H) Quantification of cartilage thickness in the olfactory system and basisphenoid from three independent experiments. Note the significant decrease of cartilage thickness in all analyzed locations. Oriented organization of the chondrocyte clones was not affected by GSα ablation. The difference between control (mean = 5.9, sem = ±0.23, n = 4) and mutant (mean = 4.3, sem = ±0.25, n = 3) olfactory cartilage thickness is significant (p=0.0053). The difference between control (mean = 10.6, sem = ±0.83, n = 3) and mutant (mean = 5.7, sem = ±0.61, n = 3) basisphenoid cartilage thickness is significant (p=0.0087). Scale bars = 100 µm. (I) Graph showing that the regularity (straightness) of the cartilage correlates with the orientation of chondrocyte clones in the cartilage of Col2a1-CreERT2/R26Confetti/GSα floxed/floxed embryos. Angle α characterizes the orientation of chondrocyte clones consisting of multiple cells as shown in a legend of a corresponding graph axis (y). Small values of α correspond to highly oriented chondrocyte clones such as transverse clonal columns. Angle β is the angle between two opposite cartilage surfaces. Since sheet-shaped cartilage elements have almost parallel surfaces the angle β was normally set between zero and 20 degrees. (J) GOM Inspect software was used to compare the shape of the nasal capsule between GSα mutant and control embryo at E17.5.
Figure 9
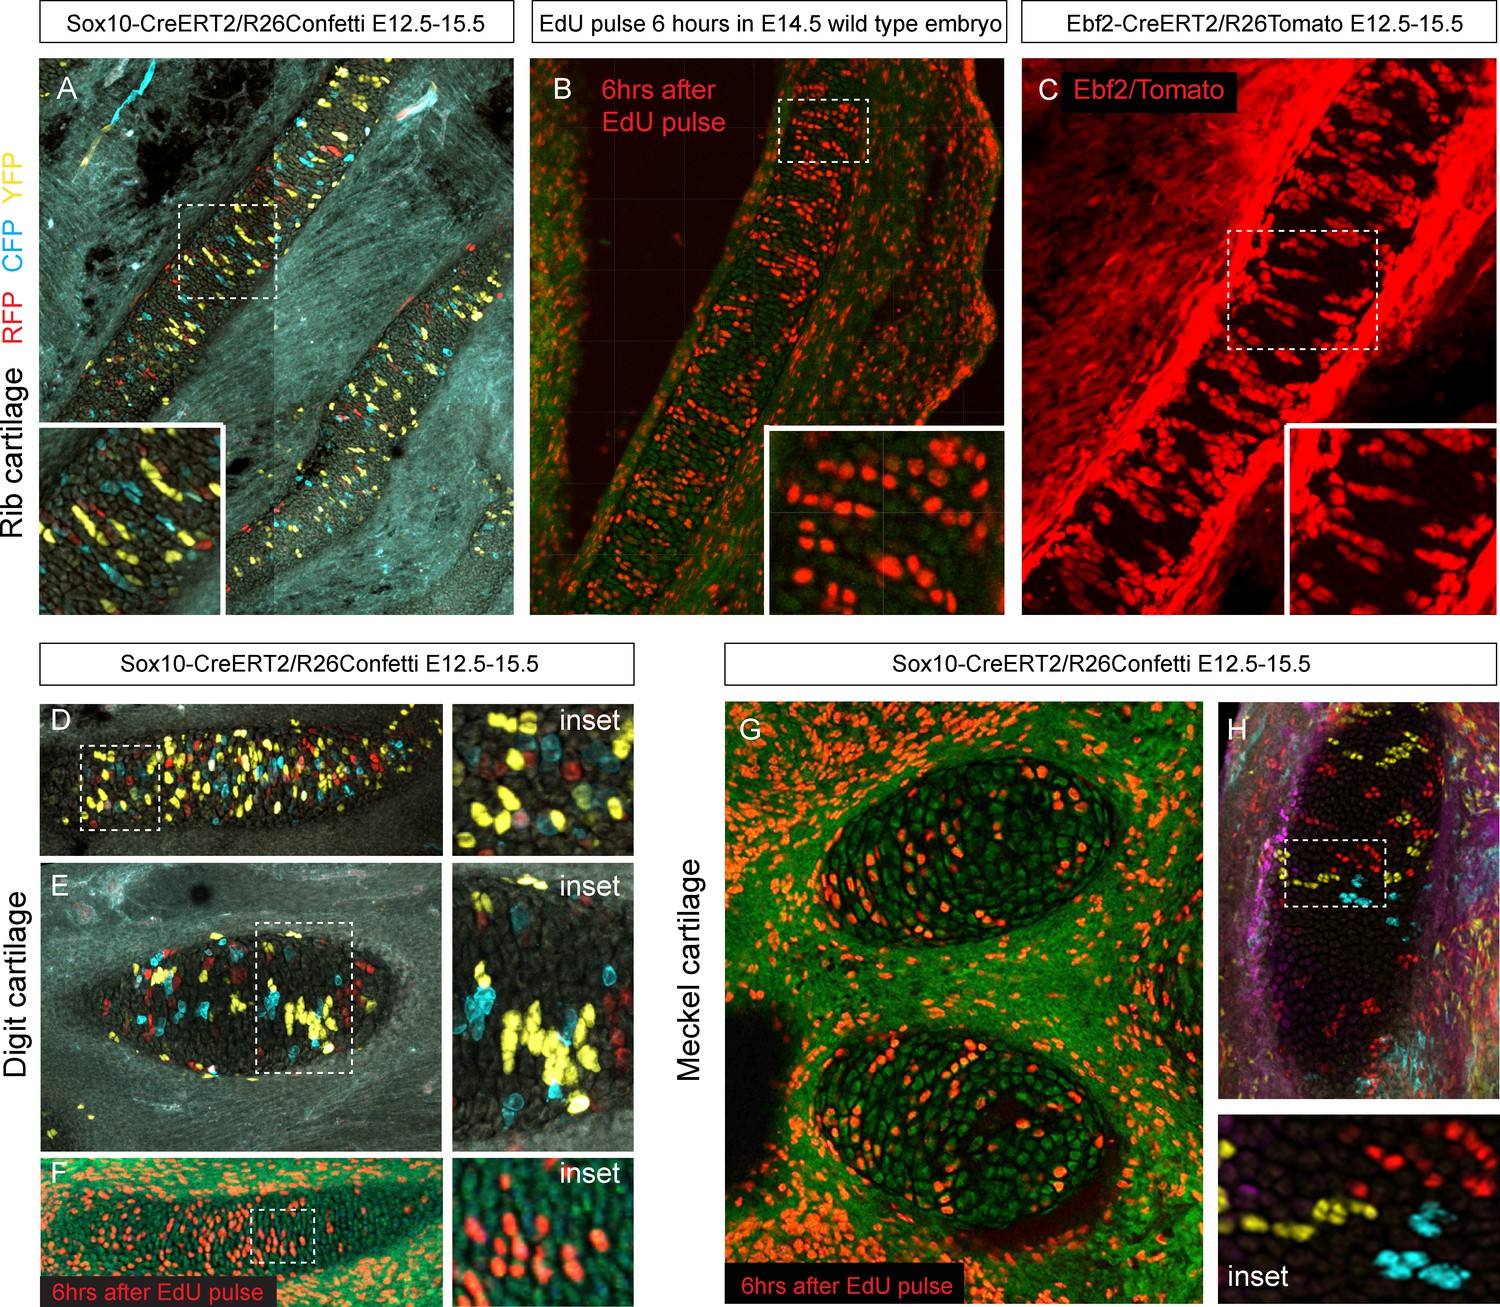
Oriented cell dynamics during development of rod-shaped cartilage elements.
(A) Genetic tracing in developing rib cartilage. Note the transverse pattern of chondrocyte clones. Dotted rectangle shows the area of magnified inset on bottom left. (B) 6 hr after EdU pulse in E14.5 embryo, transverse patterns were observed in ribs. Dotted rectangle shows the areas of magnified inset in bottom right corner. (C) Genetic tracing in developing rib cartilage shows transverse patterns. Dotted line represents area magnified in inset on the bottom right. (D–F) Genetic tracing (D,E) and 6 hr after EdU pulse (F) in developing digit cartilage of the upper limb. The areas of magnified insets (located on the right side) are outlined by dotted lines. (G) Transverse patterns in developing Meckel cartilage resulting from EdU pulse and analysis 6 hr after administration. (H) Genetic tracing shows transverse orientation of clonal chondrocytic columns in the Meckel cartilage. Dotted line shows the area magnified in the inset on the right.
Figure 10
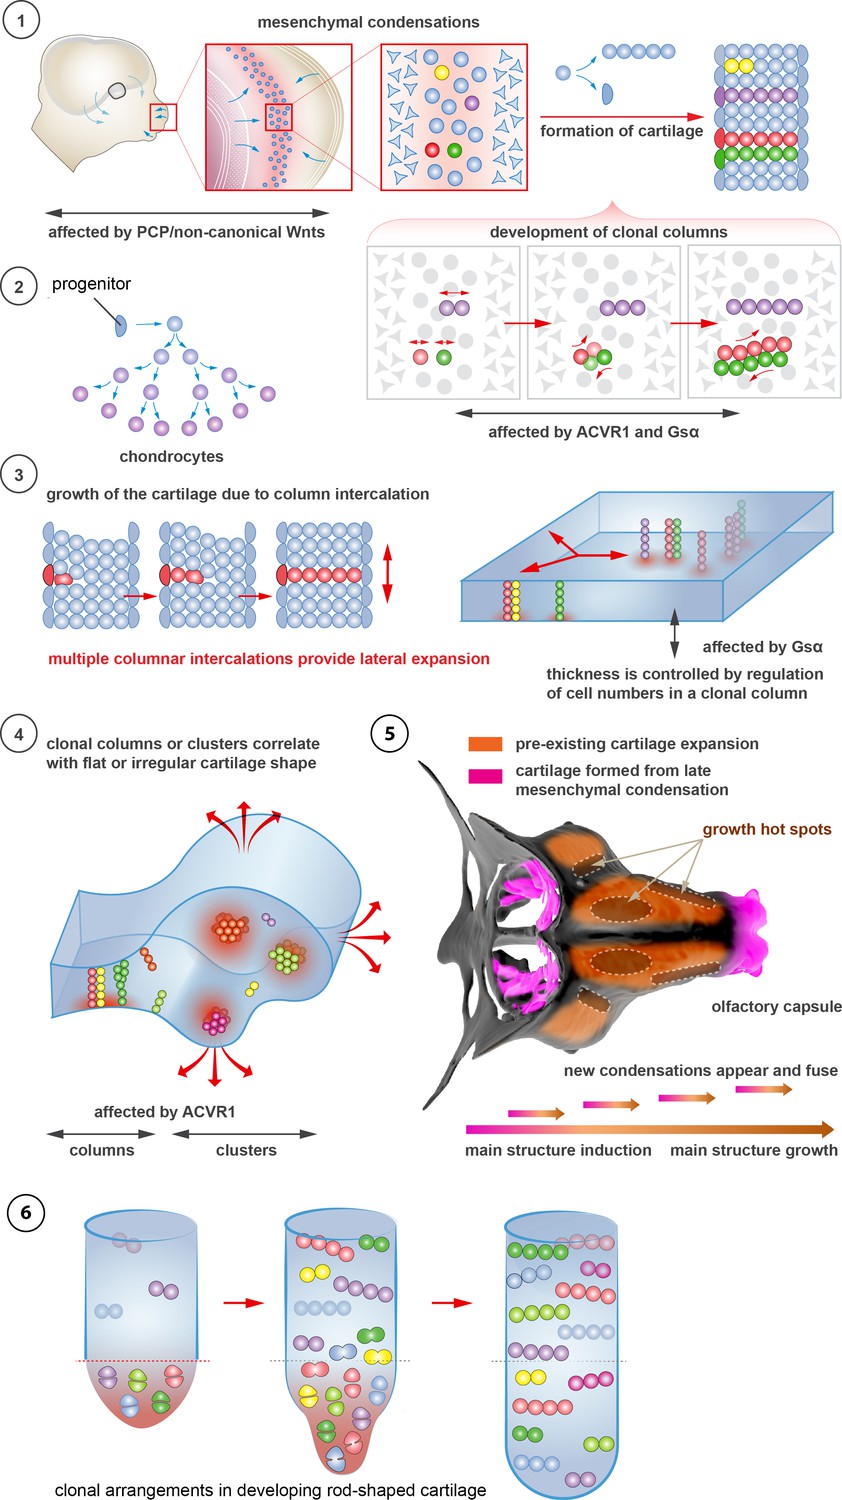
Schematic overview of cartilage shaping and scaling processes.
(1) Oriented cell divisions in the mesenchymal condensations give rise to the transverse columnar clones of chondrocytes. (2) Perichondrial cells may potentially give rise to chondrocytes. (3) Formation of new clonal columns and their integration into pre-existing cartilage leads to directed lateral expansion of the cartilage. The thickness of the sheet-shaped cartilage depends on the number of cells comprising the column, while the lateral expansion depends on the number of clonal columnar units engaged. (4) Geometry of the clonal unit corresponds to the overall macro-geometry of the cartilage. Regular clonal units correspond to regular shapes of the cartilage. (5) Chondrogenic mesenchymal condensations are sequentially induced to provide fine details and shape modifications during chondrocranium growth. Upon their maturation, they fuse with the main structure of the chondrocranium. Anisotropic proliferation and specifically positioned proliferative zones further assist the shaping process by imposing physical tensions and curves. (6) Rod-shaped cartilage elements also show the regular clonal patterns that result from the transverse orientation of cell divisions and daughter cell allocations that account for the diameter regulation.
Figure 11
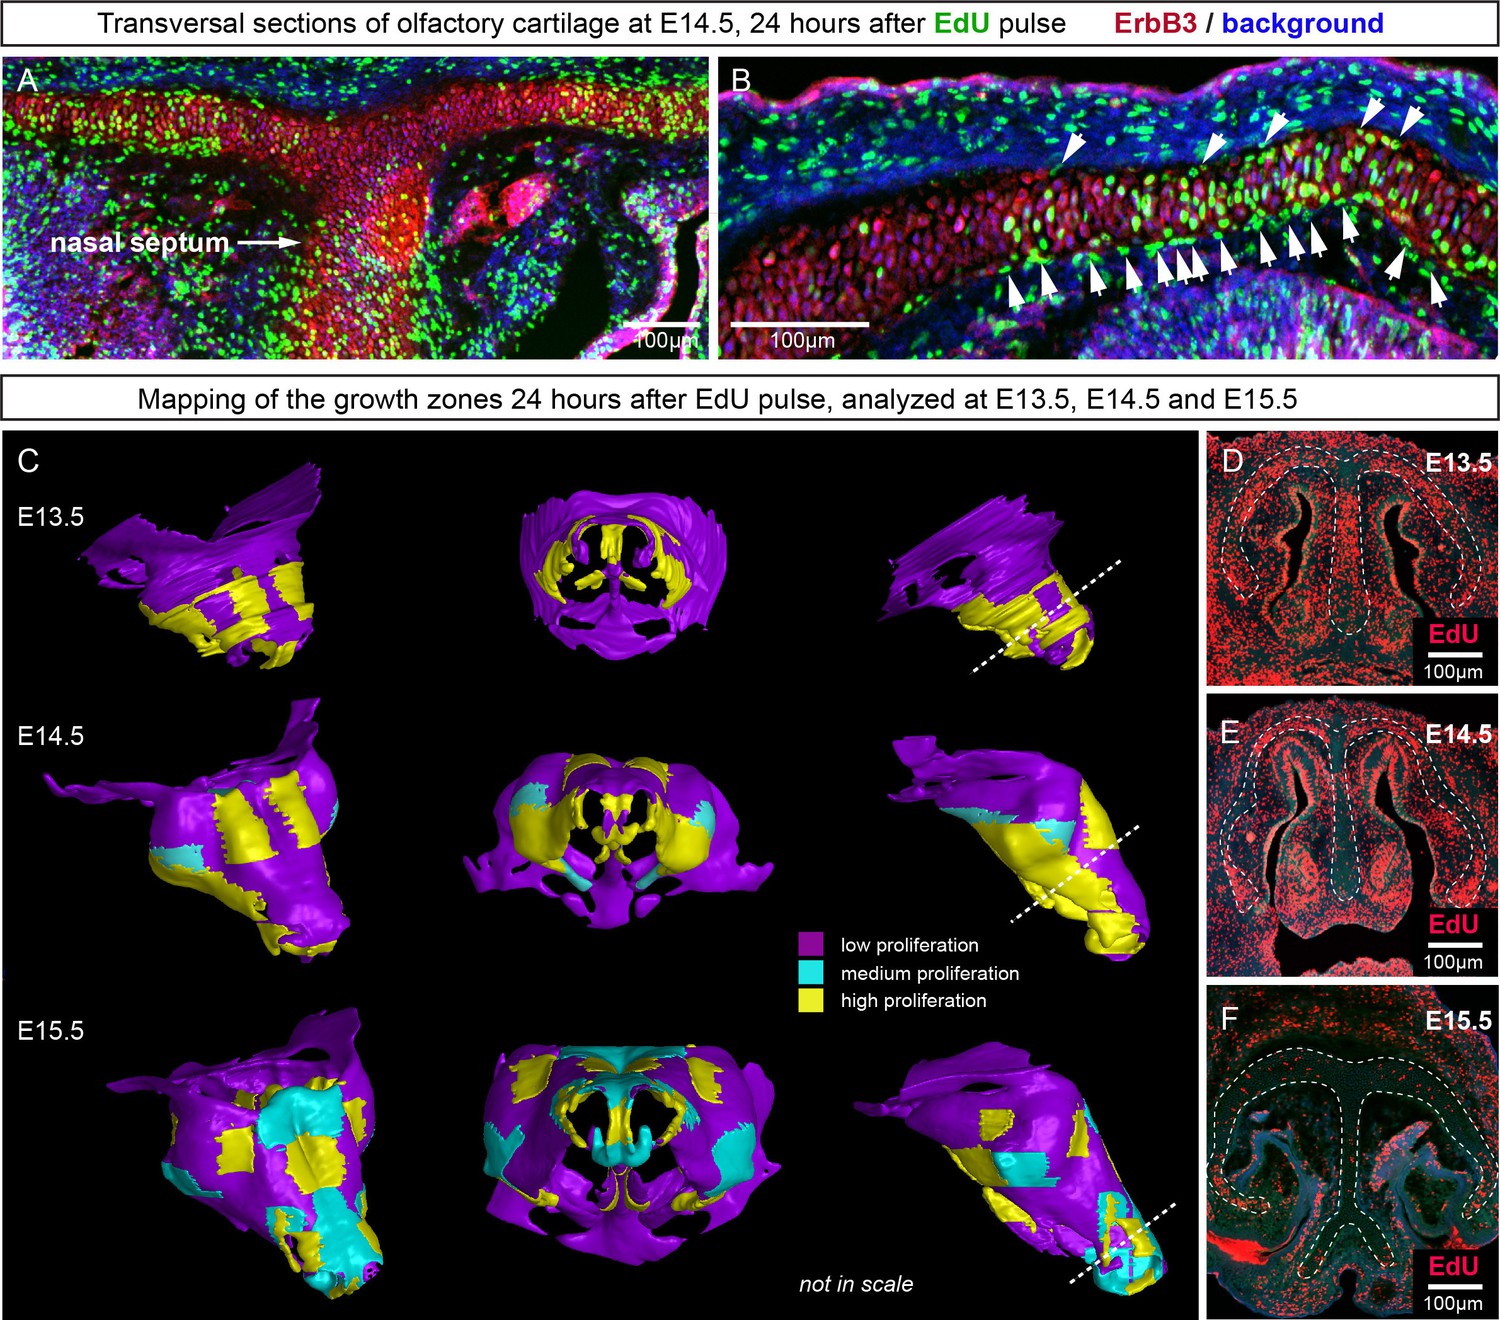
Analysis of proliferation identifies specific proliferative regions in nasal capsule.
(A–B) Analysis of EdU incorporation 24 hr after the pulse on a transversal section of the facial chondrocranium at E14.5. Notice the distinct proliferative zones in the cartilage that correlate with intense EdU labelling in perichondrial locations shown by arrowheads in (B). (C) Mapping of distinct growth zones onto 3D models of mesenchymal condensations (E13.5) and cartilage (E14.5-E15.5) in the developing face. (D–F) Frontal transversal sections at different developmental stages include proliferative zones within the chondrocranium with EdU incorporation. Scale bars = 100 µm.
Figure 12
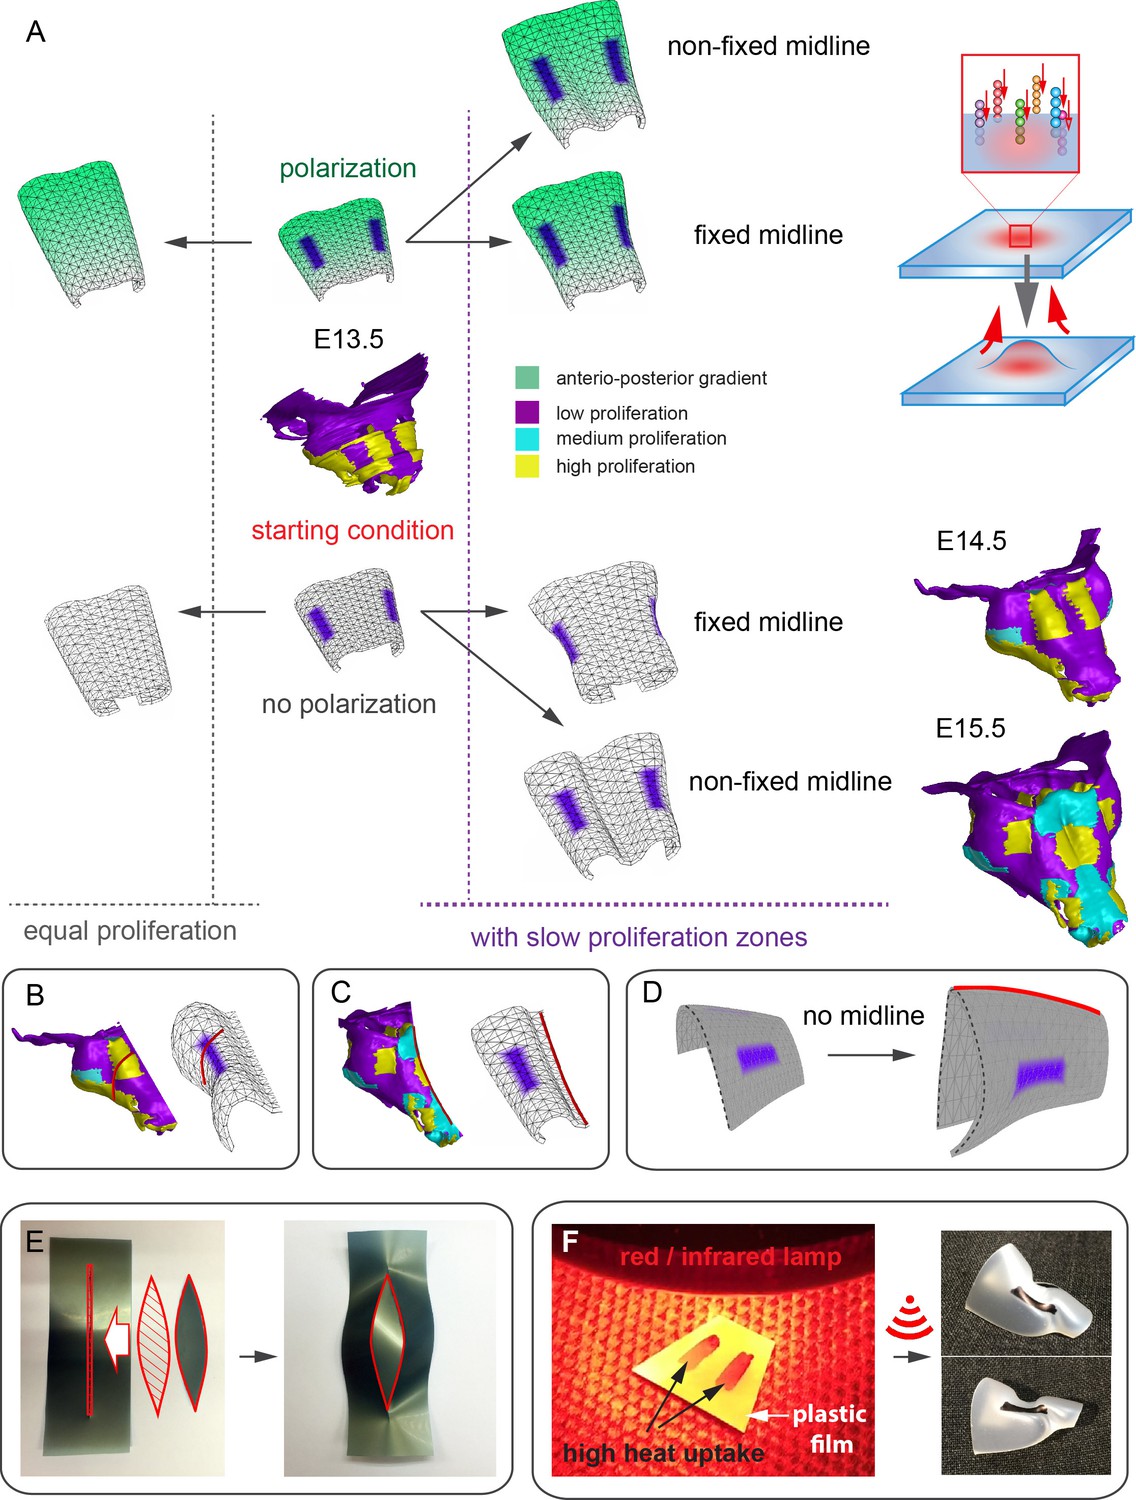
Modeling of uneven growth in the shaping of the nasal capsule.
(A) In silico geometrical transformations of the nasal capsule-like anlage at E13.5 following various scenarios including: anisotropic oriented growth (following polarization introduced by the anterio-posterior gradient shown in green), non-polarized isotropic growth (no anterio-posterior gradient), the presence of fixed midline (simulation of septum and central groove), condition with the unfixed midline (only central groove), conditions with or without slowly growing lateral regions (shown in purple). Note that in condition with polarized anterio-posterior growth the anterior elongation of the structure is more prominent and faster as compared to the condition with non-polarized isotropic growth. The lateral bends are induced by slow proliferating lateral regions. In the center and on the right, the real nasal capsules are shown with mapped fast and slow growing regions. (B) In the condition with isotropic growth and introduced slowly growing regions, we observe the formation of lateral bends (red line) analogous to the lateral bends in the real nasal capsule at E14.5 (shown on the left). In this condition the midline is fixed, and the ventral groove forms straight. (C) In conditions with no fixed midline we observe the formation of the central groove, correct bending of the central groove (red line) and overall flattening of the simulated structure similar to the real object (on the left). (D) Simulation with no midline and central groove. Note the inverted bend (red line) and the absence of the correct flattening of the structure. Despite the absence of the midline, the lateral bends are successfully induced by the slow growing regions (purple), analogous to the real nasal capsule. (E) Material elastic modelling shows how the third dimension (bending) emerges from changes and tensions in plain 2D structure during imitated anisotropic growth. (E, left panel) Initial modelling conditions: completely flat X-ray film with the cut slot in the middle for fitting the imitated flat growth zone, which is also made from X-ray film. (E, right panel) When the growth zone is inserted into the slit, the whole structure bends to accommodate the tensions. (F) Real material (plastic film)-based simulation of isotropic growth was based on uneven shrinking during intense heating. Black painted regions uptake heat more efficiently and shrink faster. The attached edges of the shrinking zone cause bending of the entire structure. Two lateral black stripes were painted on top of the trapezoid as an analog to lateral slowly proliferating zones in nasal capsule. Note the similarity of resulting bends to the lateral bends in real nasal capsule at E14.5.
Scheme 1
Starting shapes for the Fixed mid-ridge model (A) and Non-Fixed mid-ridge model (B).
Green colour indicates the values of POL which is highest at the proximal end. CHEEKS are shown in purple and MID is shown in grey.
Appendix 1—figure 1
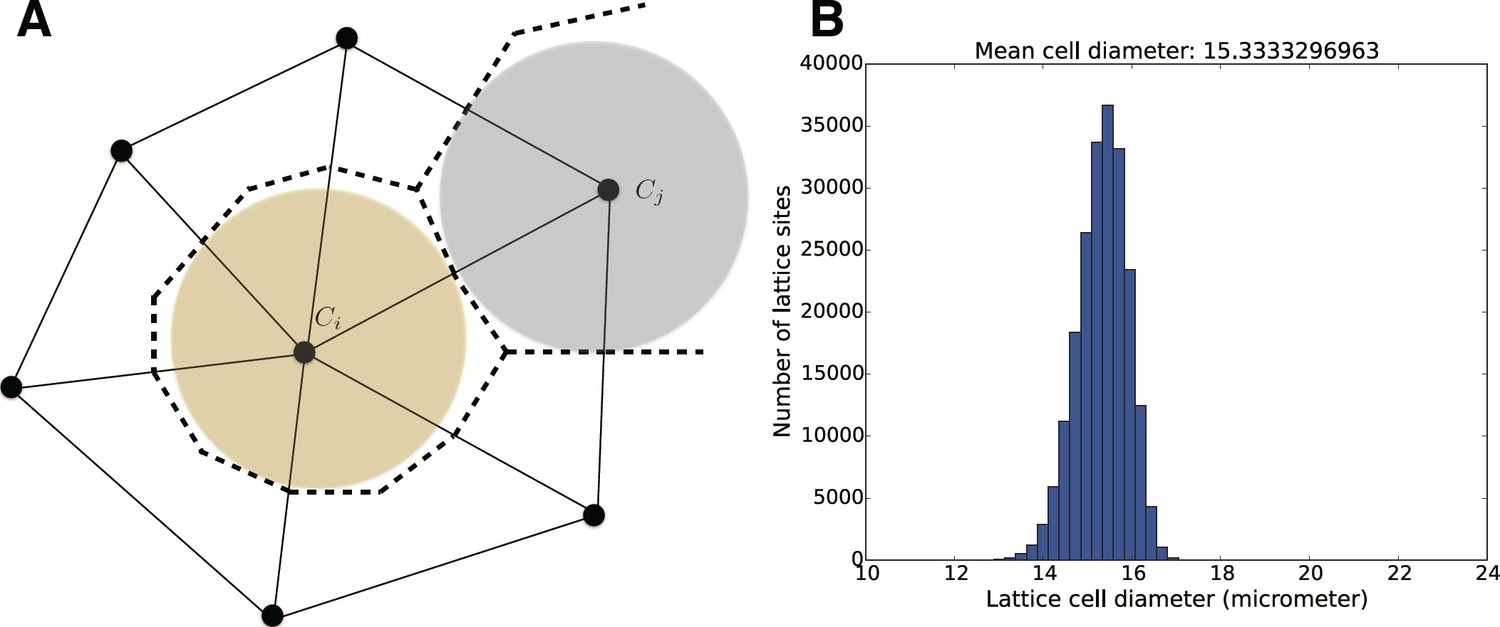
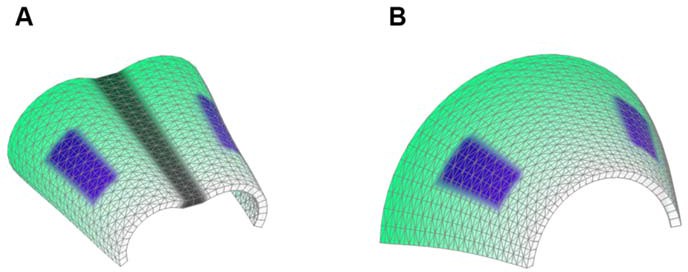
(A) Individual cells are modeled by a number of properties such as their color and distributions for cell division times.
The positions of cells in space are tracked on an underlying unstructured lattice, or grid. The edges in the primary mesh (solid lines) connect vertices (black dots). A biological cell is modeled by the volume made up of the dual elements (dashed lines), connecting triangle (2D) or tetrahedral (3D) centers and edge or face centers. For visualization purposes, in 3D space, we plot cell individuals as colored spheres with radius equal to the sphere with equal volume as the dual element. (B) Size distribution for the mesh elements for the geometry and mesh used in the simulations in the Figure 5.
Appendix 1—figure 2
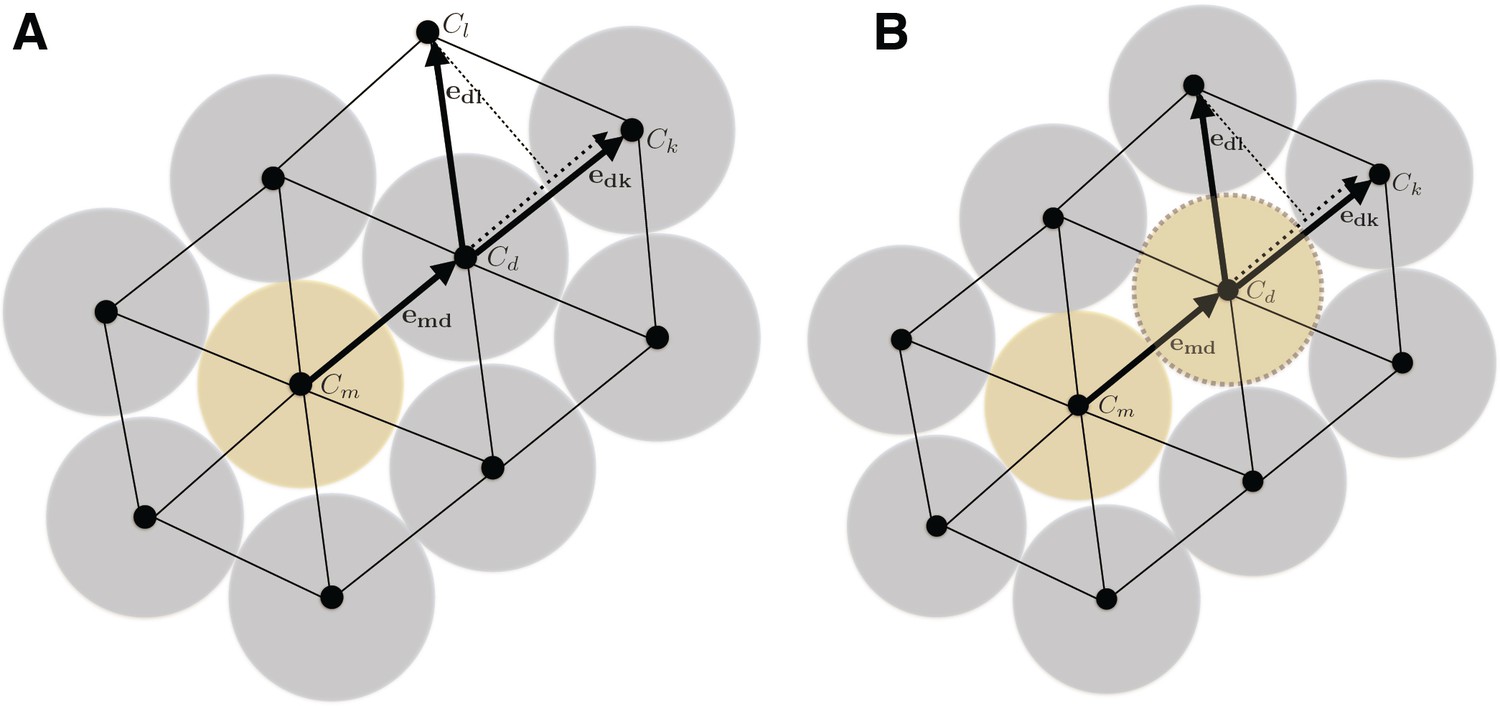
When a cell divides (yellow cell), the daughter cell will push surrounding cells (blue) to make room for the progeny (A).
The direction of pushing (and what cell to push) is determined by a combination of the directivity of the original division or pushing direction and of a penalty for pushing an occupied site. The penalty is governed by a parameter c that dictates how much to favor pushing into a free lattice site. In the figure, pushing the blue cell at location to will be favored over based on the penalty if , but the site if favored based on the directionality of the push. If is selected by the probabilistic algorithm, it will in turn complete a pushing event, leading to a pushing chain that continues until a cell is pushed into an empty site. After such a pushing chain has been completed, the site sampled for the daughter cell will be free, and the newly created daughter cell can be inserted (B).
Videos
Video 1
3D-models based on segmentation of mesenchymal condensations and mature cartilage from µ-CT tomographic data.
The first sequence illustrates wall thickness analysis results represented as a heat-map, starting from E12.5 (facial mesenchymal condensation) until E17.5 (facial cartilage). Cartilages and other soft tissues shrink during contrasting with phosphotungstic acid, and, thus, the reported metrics cannot be directly compared with biological samples treated in a different way. The following sequence shows facial chondrocranium models of Wnt/PCP mutants in comparison to the wild type. The last sequence shows the full chondrocranium at different embryonic stages, followed by 3D models of both the control embryo and Wnt5a mutant embryo at E17.5.
Video 2
Simulations of shape transitions of the nasal capsule-like 3D object under different growth conditions.
Notice the formation of the lateral bends corresponding to the real nasal capsule shape development from E13.5 to E14.5 occur only in the condition with slow growing purple zones. These bends form independently from isotropic or anisotropic modality of growth.
Download links
A two-part list of links to download the article, or parts of the article, in various formats.
Downloads (link to download the article as PDF)
Open citations (links to open the citations from this article in various online reference manager services)
Cite this article (links to download the citations from this article in formats compatible with various reference manager tools)
Oriented clonal cell dynamics enables accurate growth and shaping of vertebrate cartilage
eLife 6:e25902.
https://doi.org/10.7554/eLife.25902


