Topological analysis of multicellular complexity in the plant hypocotyl
- University of Birmingham, United Kingdom
Figures
Figure 1 with 2 supplements

Computational workflow.
(A) Pipeline for imaging, annotating, quantitatively analyzing, and visualizing global cellular interaction networks. (B) 3D layout of an annotated cellular connectivity network for the Arabidopsis Colombia hypocotyl. (C) Explanation of the network measures employed in this study. Nodes are colored to indicate values.
Figure 1—figure supplement 1
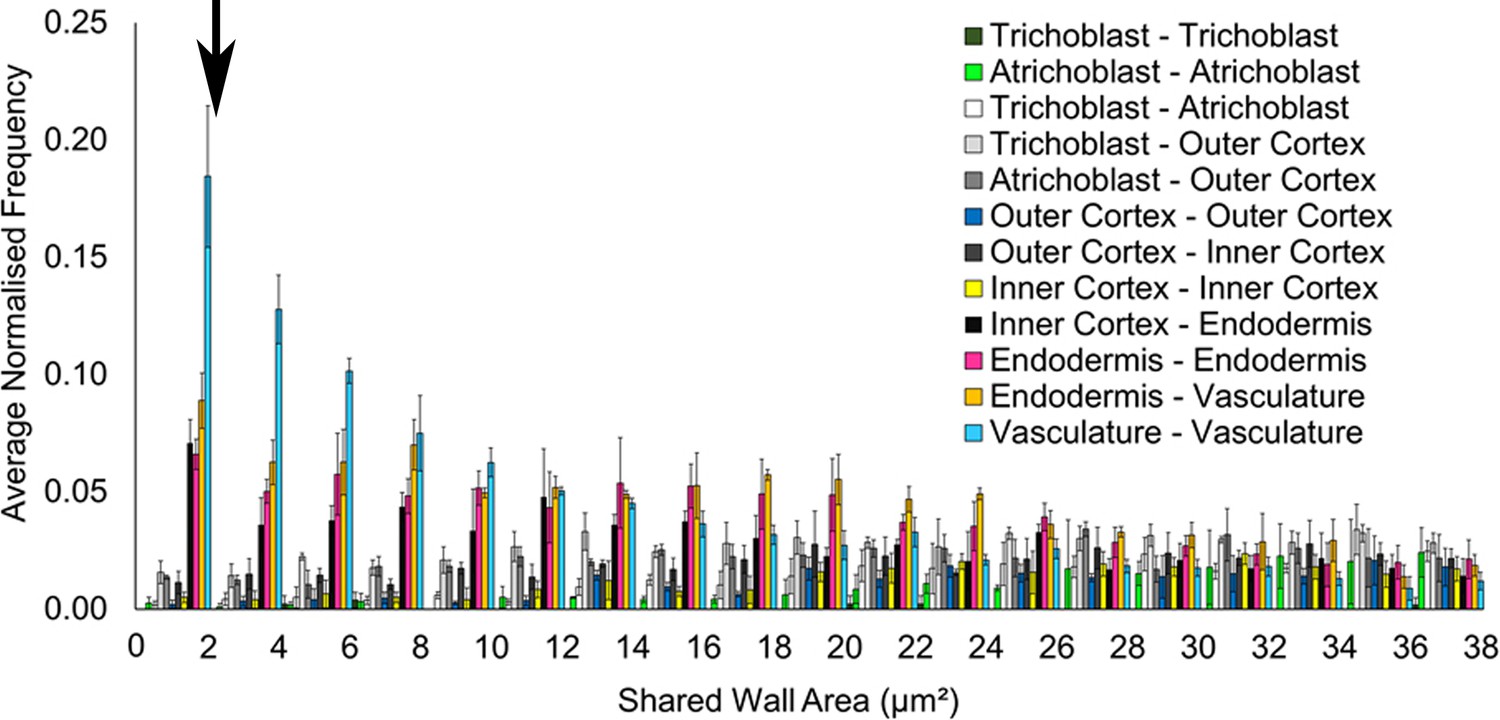
Filtering small edges in connectivity networks.
Distribution of absolute shared cell wall area (µm²) in connected cells across different cell types in the A. thaliana Col hypocotyl. The black arrow indicates where a cutoff was applied, below 2 μm2. Biological replicates were treated as individual samples and data represent the mean frequency of the bins across the triplicate samples. Error bars represent ± standard deviation within a bin.
Figure 1—figure supplement 2
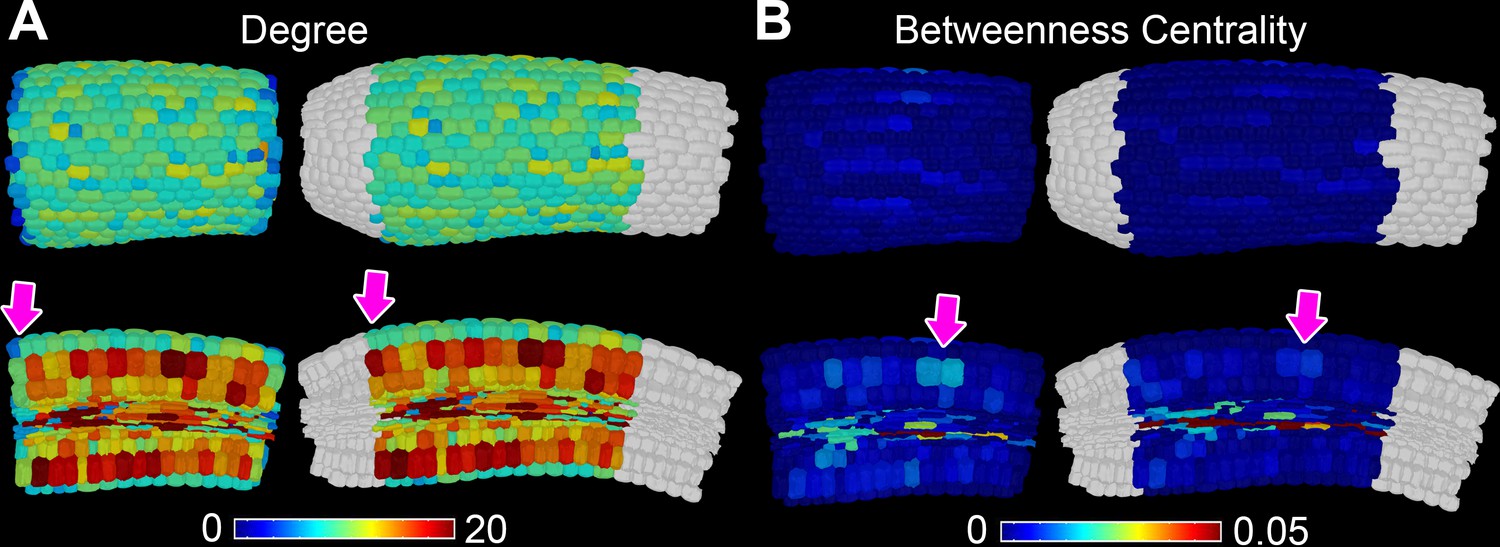
Topological buffering of sample boundaries.
(A) In situ false color degree measurements in the A. thaliana Col hypocotyl with and without a buffer region (in white). Pink arrows indicate a change in degree when using a cellular buffer region. (B) In situ false color betweenness centrality measurements in the A. thaliana Col hypocotyl with and without a buffer region (in white). Arrows indicate a change in betweenness centrality when using a buffer region.
Figure 2 with 3 supplements
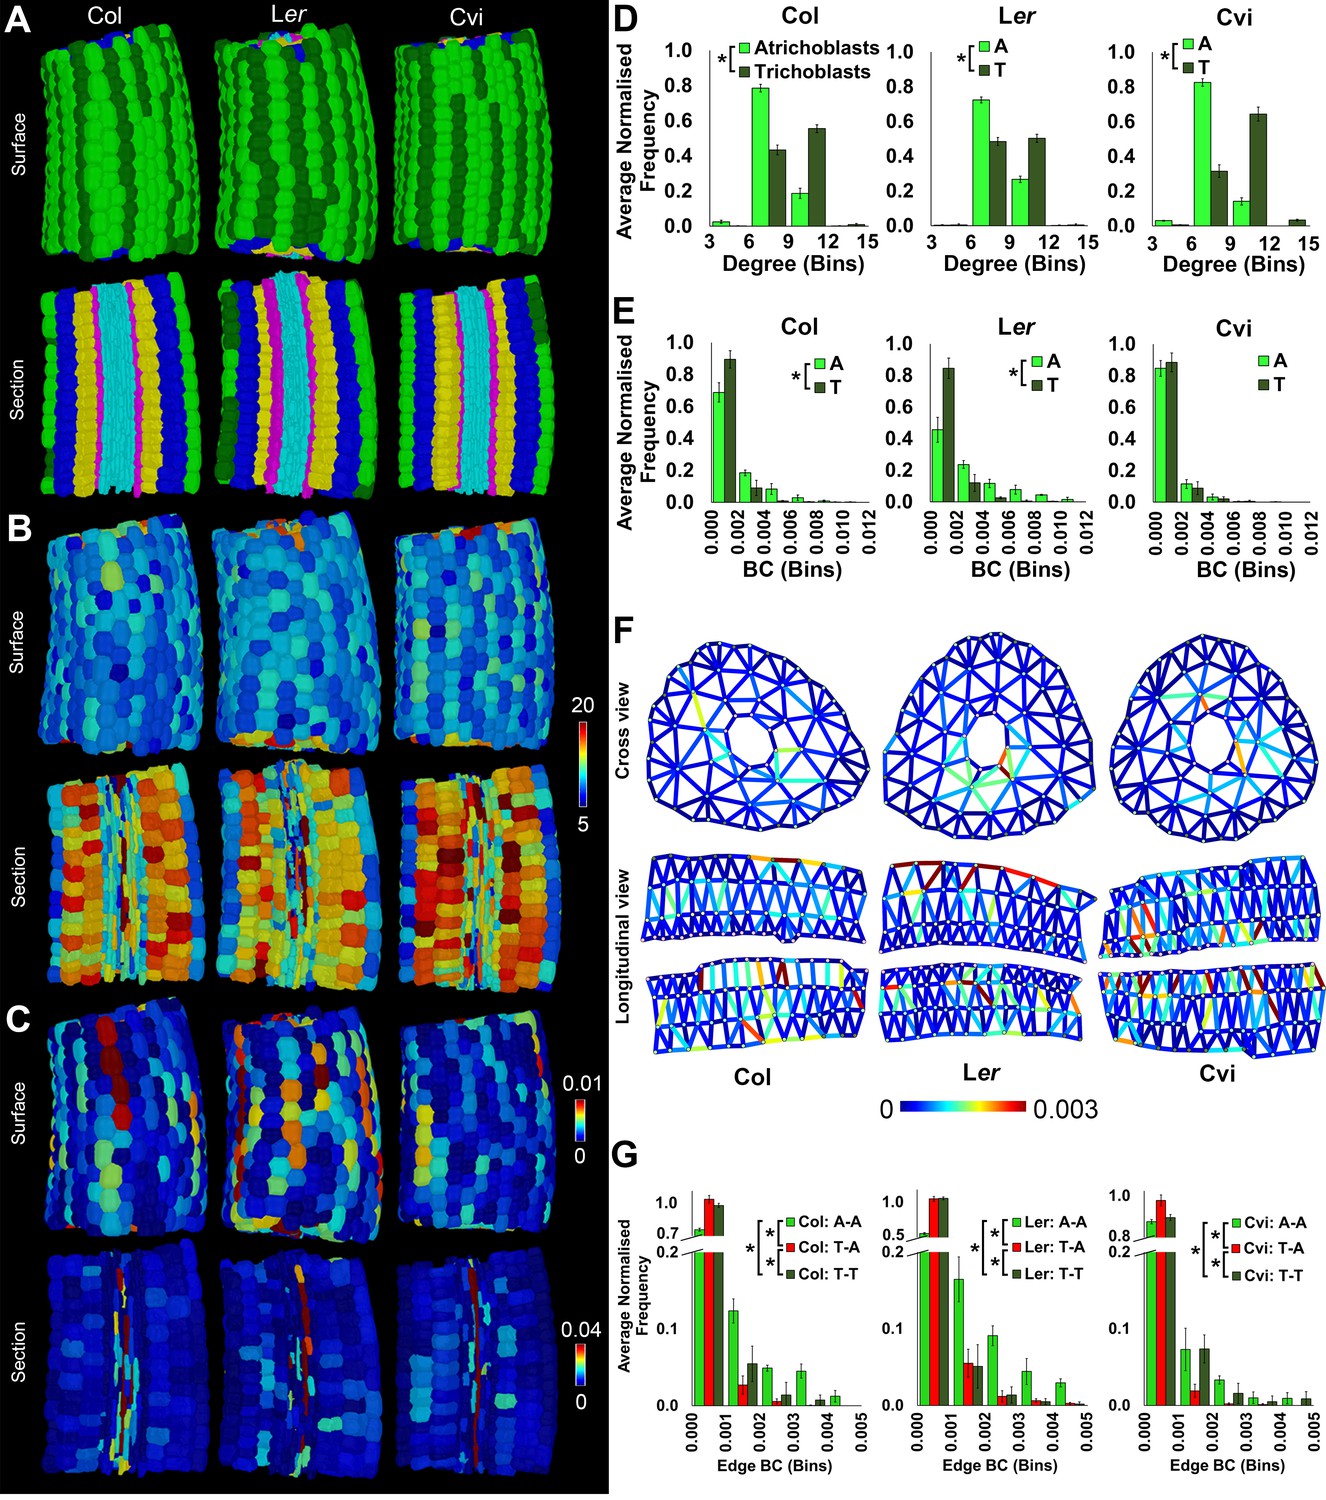
Cell type-specific quantification of the topological features of hypocotyl interaction networks in three Arabidopsis ecotypes: Colombia (Col), Landsberg erecta (Ler) and Cape Verdi Islands (Cvi).
(A) Surface and longitudinal-section meshes of the three ecotypes, with false color indicating cell type (dark green – trichoblast, light green – atrichoblast, blue – outer cortex, yellow – inner cortex, pink – endodermis, cyan – vasculature). (B–C) Hypocotyl meshes with false color heat maps of (B) degree and (C) betweenness centrality. (D–E) Average normalized frequency distributions of (D) degree and (E) BC across trichoblast and atrichoblast cell types. (F) Edge BC false colored onto edges of virtual cross and longitudinal sections of the hypocotyl networks of each ecotype. (G) Normalized frequency distributions of edge BC in different cell interfaces within different cell types (T – trichoblast, A – atrichoblast). (H) Schematic showing cells lying upon short path lengths within the Arabidopsis hypocotyl. Biological replicates were treated as individual samples and data represent the mean frequency of the bins across the triplicate samples. Error bars represent ± standard deviation within a frequency bin. Asterisks (*) indicate significant differences between distributions using the chi-squared test for degree and the Kolmogorov–Smirnov test for BC, at the p≤1.56×10⁻⁵ level (p≤0.05 after Bonferroni correction for 3200 distribution comparisons).
Figure 2—figure supplement 1
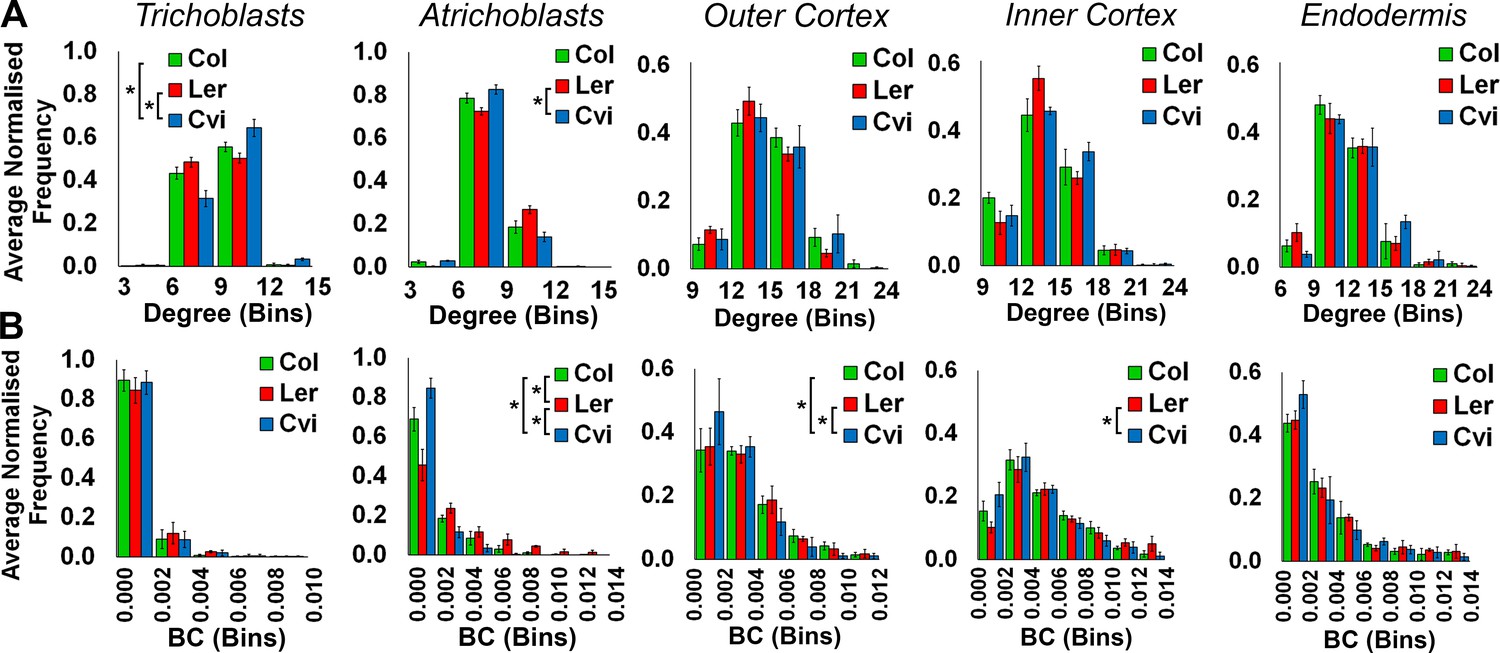
Comparisons of topological features of Arabidopsis hypocotyl cellular arrangements between Arabidopsis ecotypes.
Average normalized frequency distributions of (A) degree and (B) betweenness centrality (BC) in trichoblasts, atrichoblasts, the outer cortex, the inner cortex and the endodermis, in three A. thaliana ecotypes; Col, Ler and Cvi. Biological replicates were treated as individual samples and data represent the mean frequency of the bins across the triplicate samples. Error bars represent the standard deviation within a bin. An asterisk (*) represents significant difference between distributions using the chi-squared test for degree and the Kolmogorov–Smirnov test for BC, at the p≤1.56×10⁻⁵ level (p≤0.05 after Bonferroni correction for 3200 distribution comparisons used in this study).
Figure 2—figure supplement 2
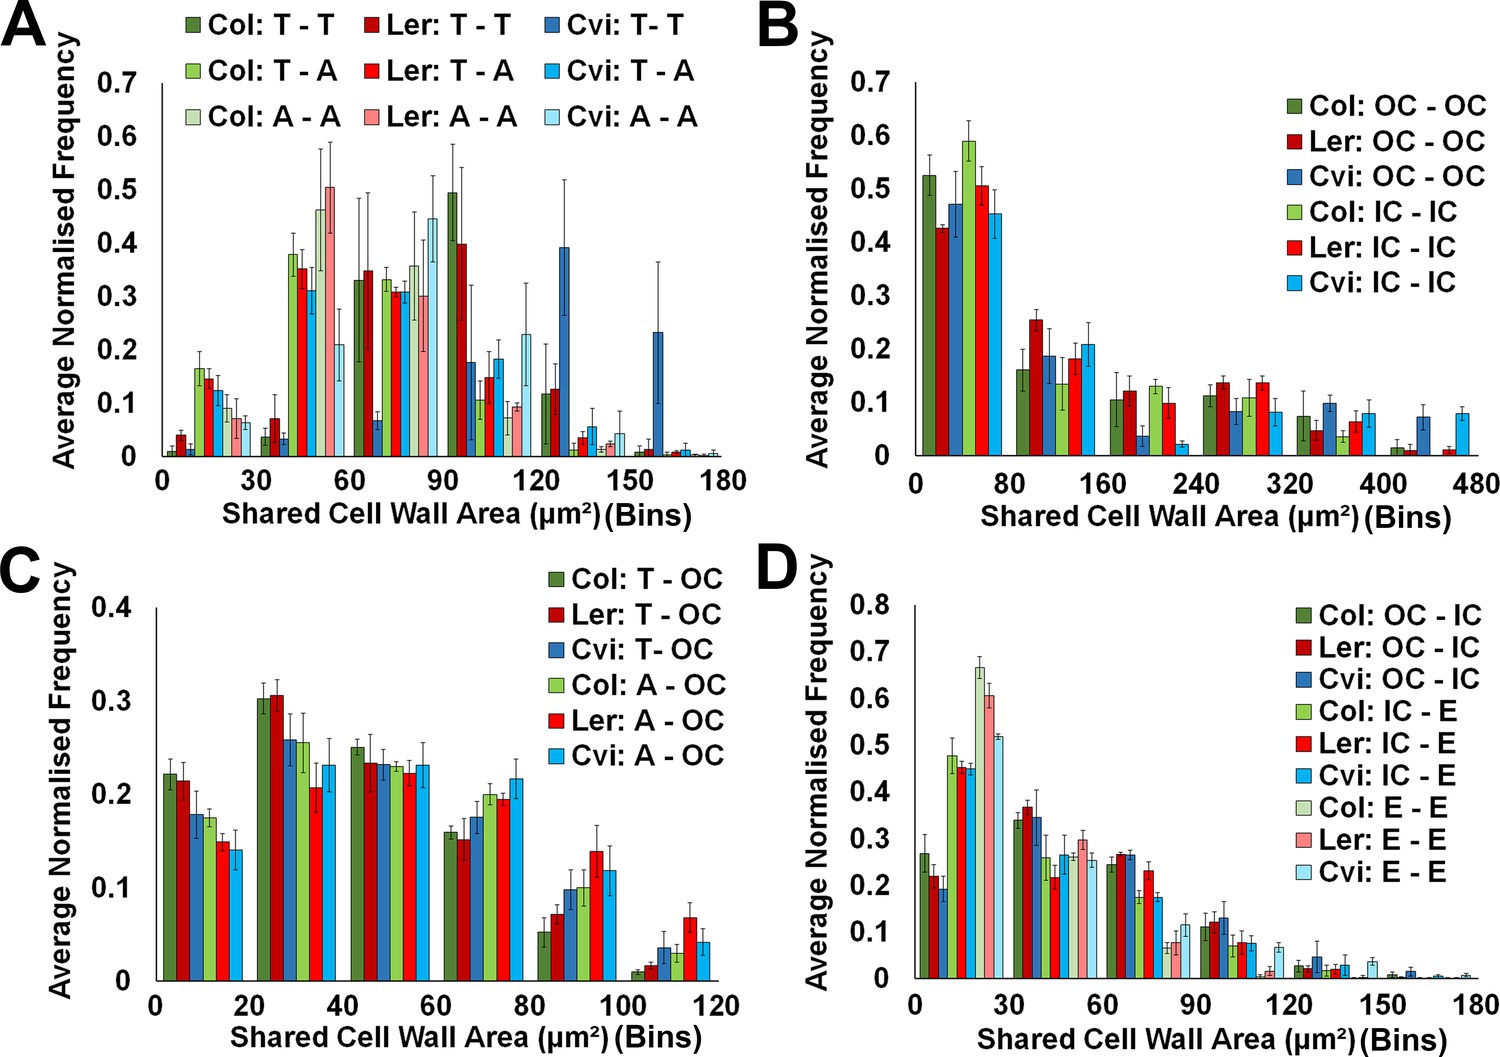
Cell interface sizes in unexpanded embryo hypocotyls.
(A) Shared cell wall areas between epidermal cells (T – trichoblast, A – atrichoblast) in Arabidopsis ecotypes, (B) within cells in the outer cortex (OC) and inner cortical layers (IC – inner cortex), (C) between epidermal cell types and the cortex, and (D) between cells in the cortical cell layers and with the endodermis. Biological replicates were treated as individual samples and data represent the mean frequency of the bins across the triplicate samples. Error bars represent ± the standard deviation within a bin.
Figure 2—figure supplement 3
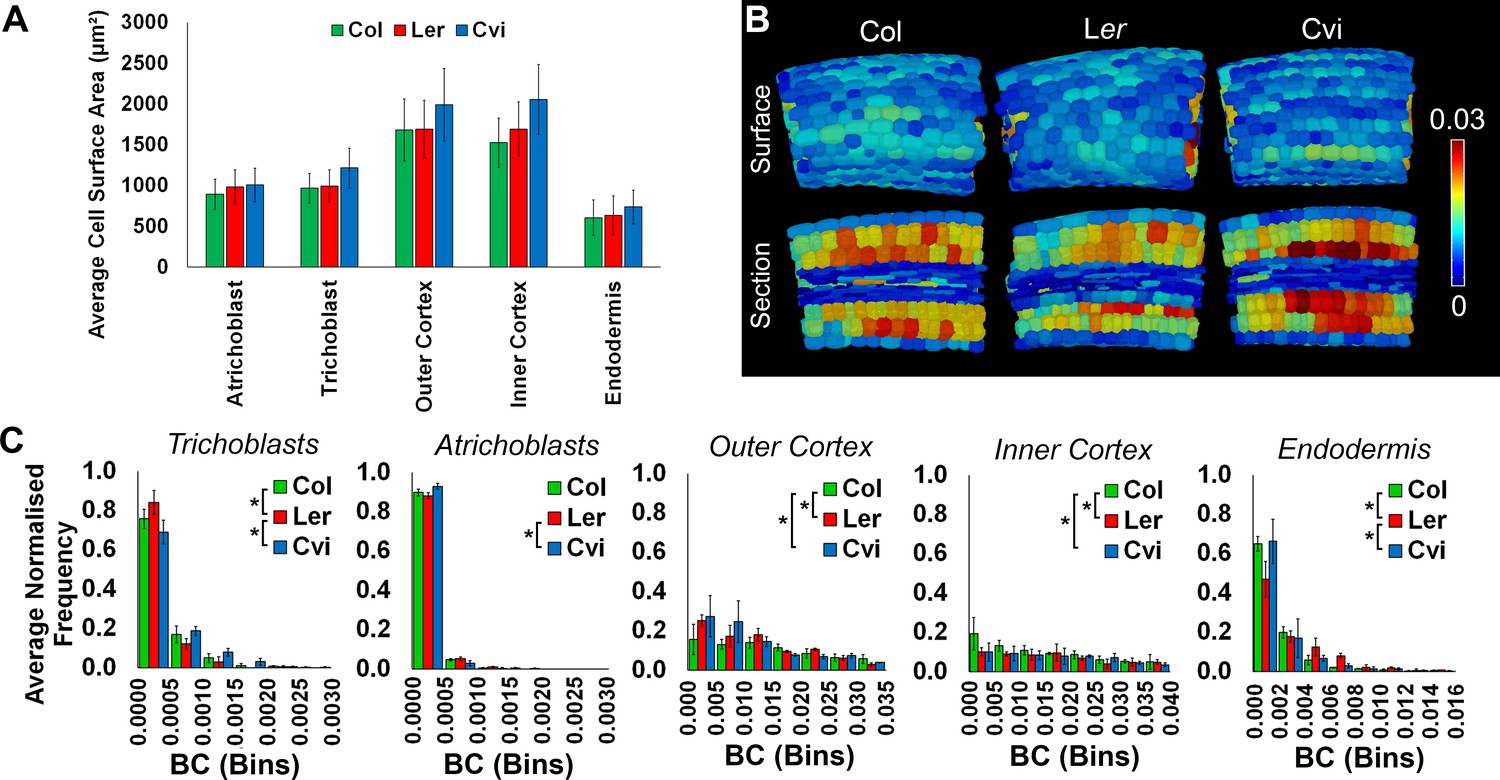
Cell surface area and weighted BC measurements.
(A) The average cell wall area (µm²) of specific cell types in the hypocotyl, comparing three Arabidopsis ecotypes, Col, Ler, and Cvi. Cells from biological replicates were grouped and data represent the mean across all cells within the triplicate samples. Error bars represent ± standard deviation of the mean. (B) In situ false color weighted betweenness centrality in the Arabidopsis ecotypes Col, Ler, and Cvi. (C) Distributions of weighted node betweenness centrality (BC) in different cell types of three Arabidopsis ecotypes. Biological replicates were treated as individual samples and data represent the mean frequency of the bins across the triplicate samples. Error bars represent ± the standard deviation within a bin. An asterisk (*) represents significant difference between distributions using the chi-squared test for degree and the Kolmogorov–Smirnov test for BC, at the p≤1.56×10⁻⁵ level (p≤0.05 after Bonferroni correction for 3200 distribution comparisons used in this study).
Figure 3

Transport of the small fluorescent molecule fluorescein in the hypocotyl epidermis of different Arabidopsis ecotypes.
(A) Illustration of the cells having reduced path length in the hypocotyls of Landsberg erecta (Ler), Colombia (Col) and Cape Verdi Islands (Cvi) ecotypes indicated in green. (B) Confocal image of the Ler hypocotyl (white) and fluorescein (red) imaged within the epidermis. (C) Same as (B) with Col. (D) Same and (B) with Cvi. (E) Quantification of fluorescein concentration within individual epidermal cells of the Ler hypocotyl epidermis. (F) Same as (E) with Col. (G) Same as (E) with Cvi. Atrichoblast and trichoblast cell types are indicated by an A or T above each cell. The scale bar in (E) indicates mean normalized values for the quantification of fluorescein concentration visualization in (E)-(G). (H) Violin plot of fluorescein concentration in each atrichoblast and trichoblast cells. The mean is indicated by a black bar. An asterisk (*) indicates a significant difference in fluorescein concentration between atrichoblasts and trichoblasts within an ecotype (t-test, p≤0.001). Normalized fluorescence concentration is indicated on the y-axis. Data from three biological replicates for each ecotype were pooled and mean normalized for comparison.
Figure 4 with 1 supplement
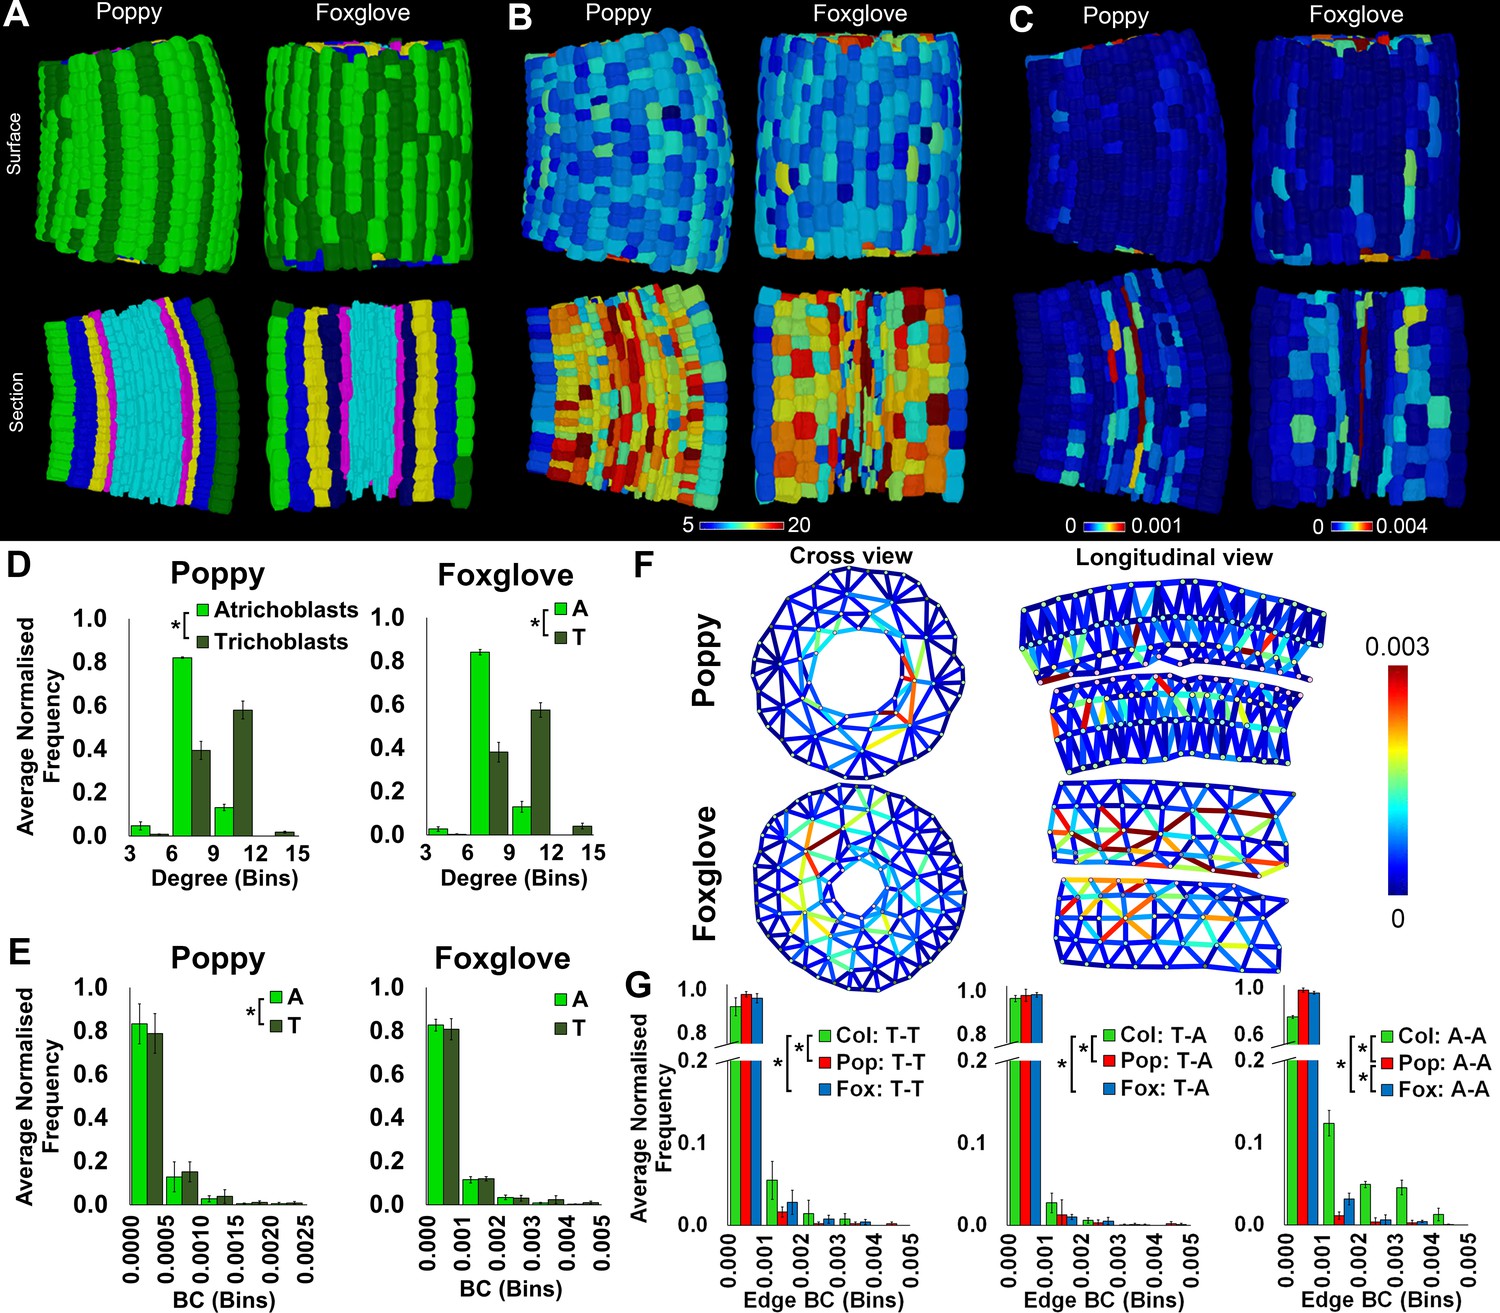
Cell type-specific topological characterization of hypocotyl cellular interaction networks from three plant species: Arabidopsis thaliana (Col), poppy and foxglove.
(A) Surface and longitudinal section meshes of poppy and foxglove hypocotyls, with false color denoting cell type (dark green – trichoblast, light green – atrichoblast, blue – outer cortex, yellow – inner cortex second layer, navy blue – inner cortex third layer, pink – endodermis, cyan – vasculature). (B–C) Hypocotyl meshes with false color heat maps of (B) degree and (C) betweenness centrality (BC). (D) Average normalized frequency distributions of degree and (E) BC in epidermal cell types. (F) Edges describing hypocotyl cellular interactions false colored by edge BC. (G) Normalized frequency distribution of edge BC in the interfaces between different epidermal cell types (T – trichoblast, A – atrichoblast). Biological replicates were treated as individual samples and data represent the mean frequency of the bins across the triplicate samples. Error bars represent the standard deviation within a bin. An asterisk (*) represents significant difference between distributions using the chi-squared test for degree and the Kolmogorov–Smirnov test for BC, at the p≤1.56×10⁻⁵ level (p≤0.05 after Bonferroni correction for 3200 distribution comparisons).
Figure 4—figure supplement 1

Cell type specific topological analysis of Arabidopsis, poppy and foxglove hypocotyl cellular arrangements.
Average normalized frequency distributions of (A) degree and (B) betweenness centrality (BC) in trichoblasts, atrichoblasts, the outer cortex, the inner cortex and the endodermis, A. thaliana Col, poppy and foxglove. Biological replicates were treated as individual samples and data represent the mean frequency of the bins across the triplicate samples. Error bars represent ± the standard deviation within a bin. An asterisk (*) represents significant difference between distributions using the chi-squared test for degree and the Kolmogorov–Smirnov test for BC, at the p≤1.56×10⁻⁵ level (p≤0.05 after Bonferroni correction for 3200 distribution comparisons used in this study).
Figure 5 with 1 supplement
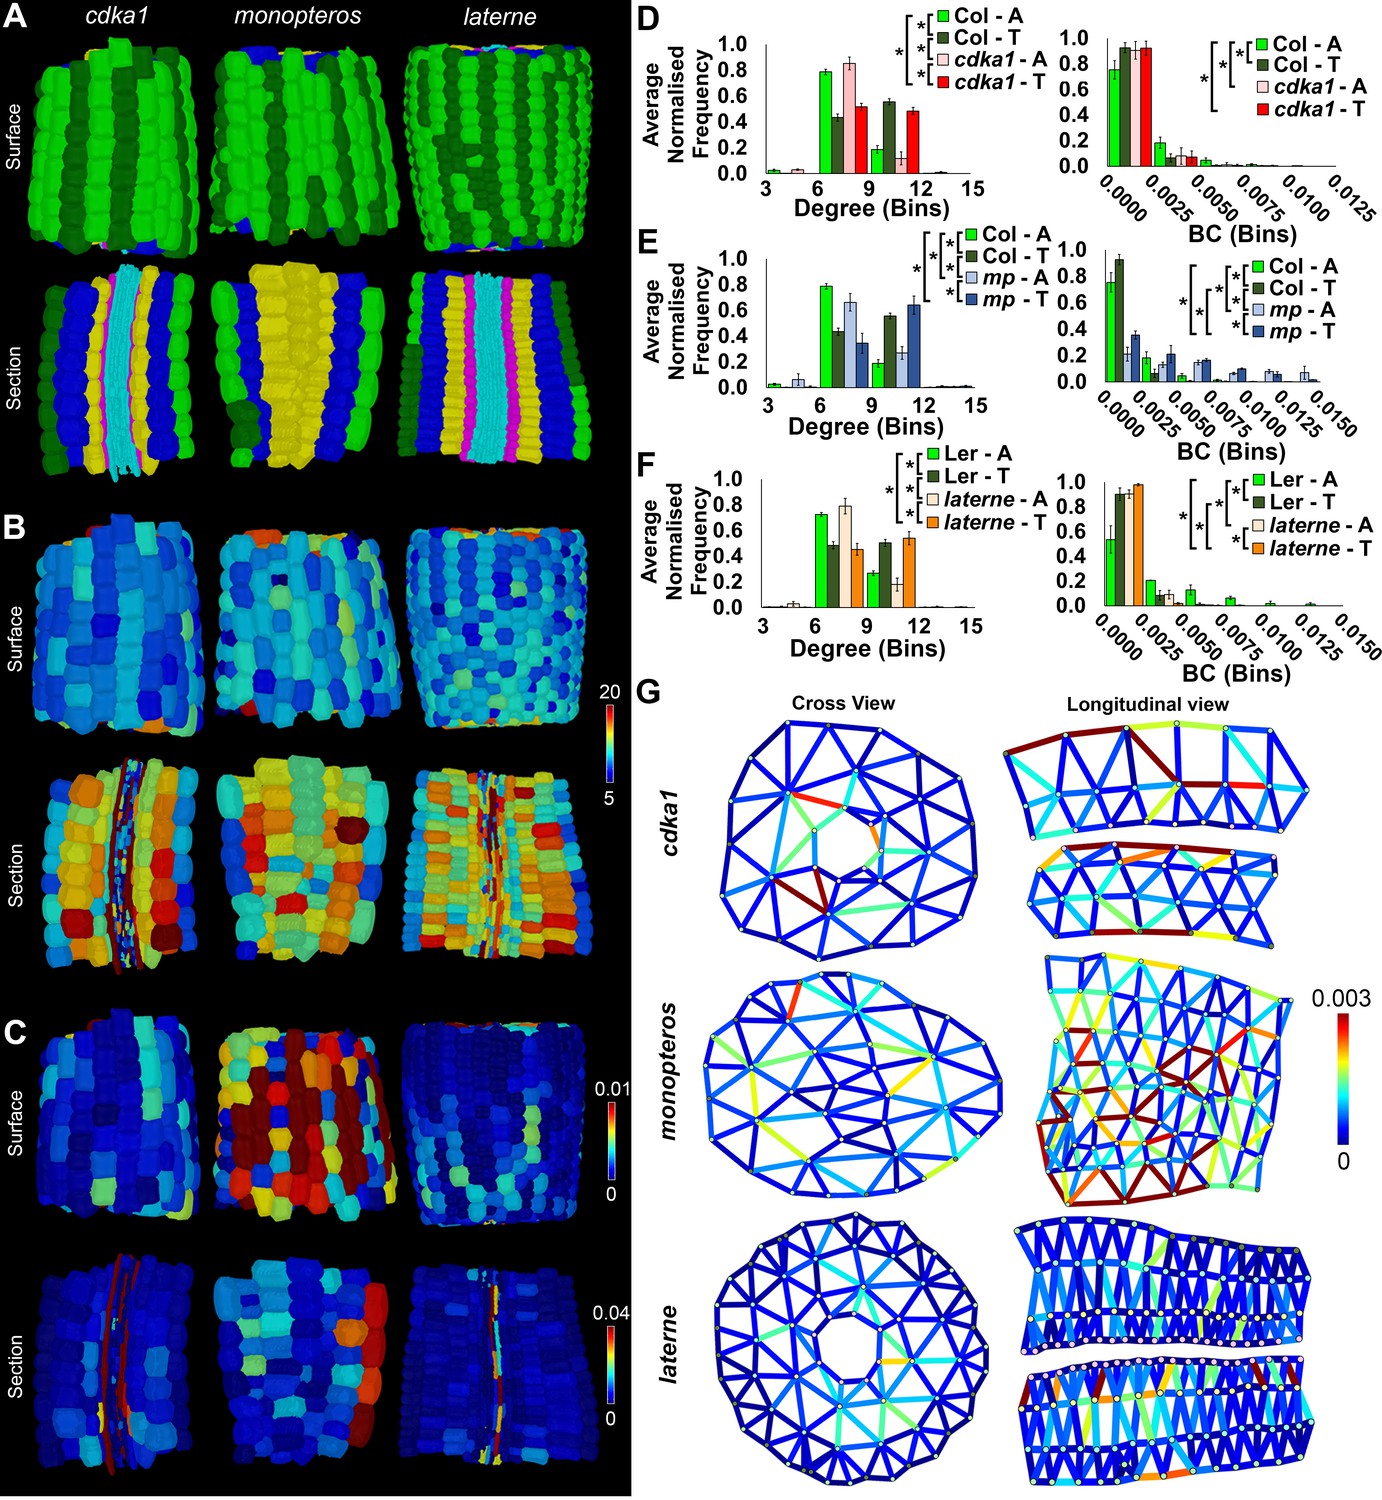
Comparisons of cell type-specific patterning and path length in the hypocotyls of wild-type A. thaliana (Col) and three A. thaliana mutants: cdka1;1, monopteros and laterne.
(A) Surface and longitudinal section meshes of the three mutants, with false color cell type annotation as in Figure 2. (B–C) Mutant hypocotyl meshes with false color heat maps of (B) degree and (C) betweenness centrality (BC). (D) Degree and BC in the cdka1;1 mutant and corresponding Col wild-type control. (E) Degree and BC in the mp mutant and corresponding Col wild-type control. (F) Degree and BC in the laterne mutant and corresponding Ler wild-type control. (G) Edges describing cellular interactions false colored by edge BC in mutant hypocotyls. Biological replicates were treated as individual samples and data represent the mean frequency of the bins across the triplicate samples. Error bars represent the standard deviation within a bin. An asterisk (*) represents significant difference between distributions using the chi-squared test for degree and the Kolmogorov–Smirnov test for BC, at the p≤1.56×10⁻⁵ level (p≤0.05 after Bonferroni correction for 3200 distribution comparisons).
Figure 5—figure supplement 1
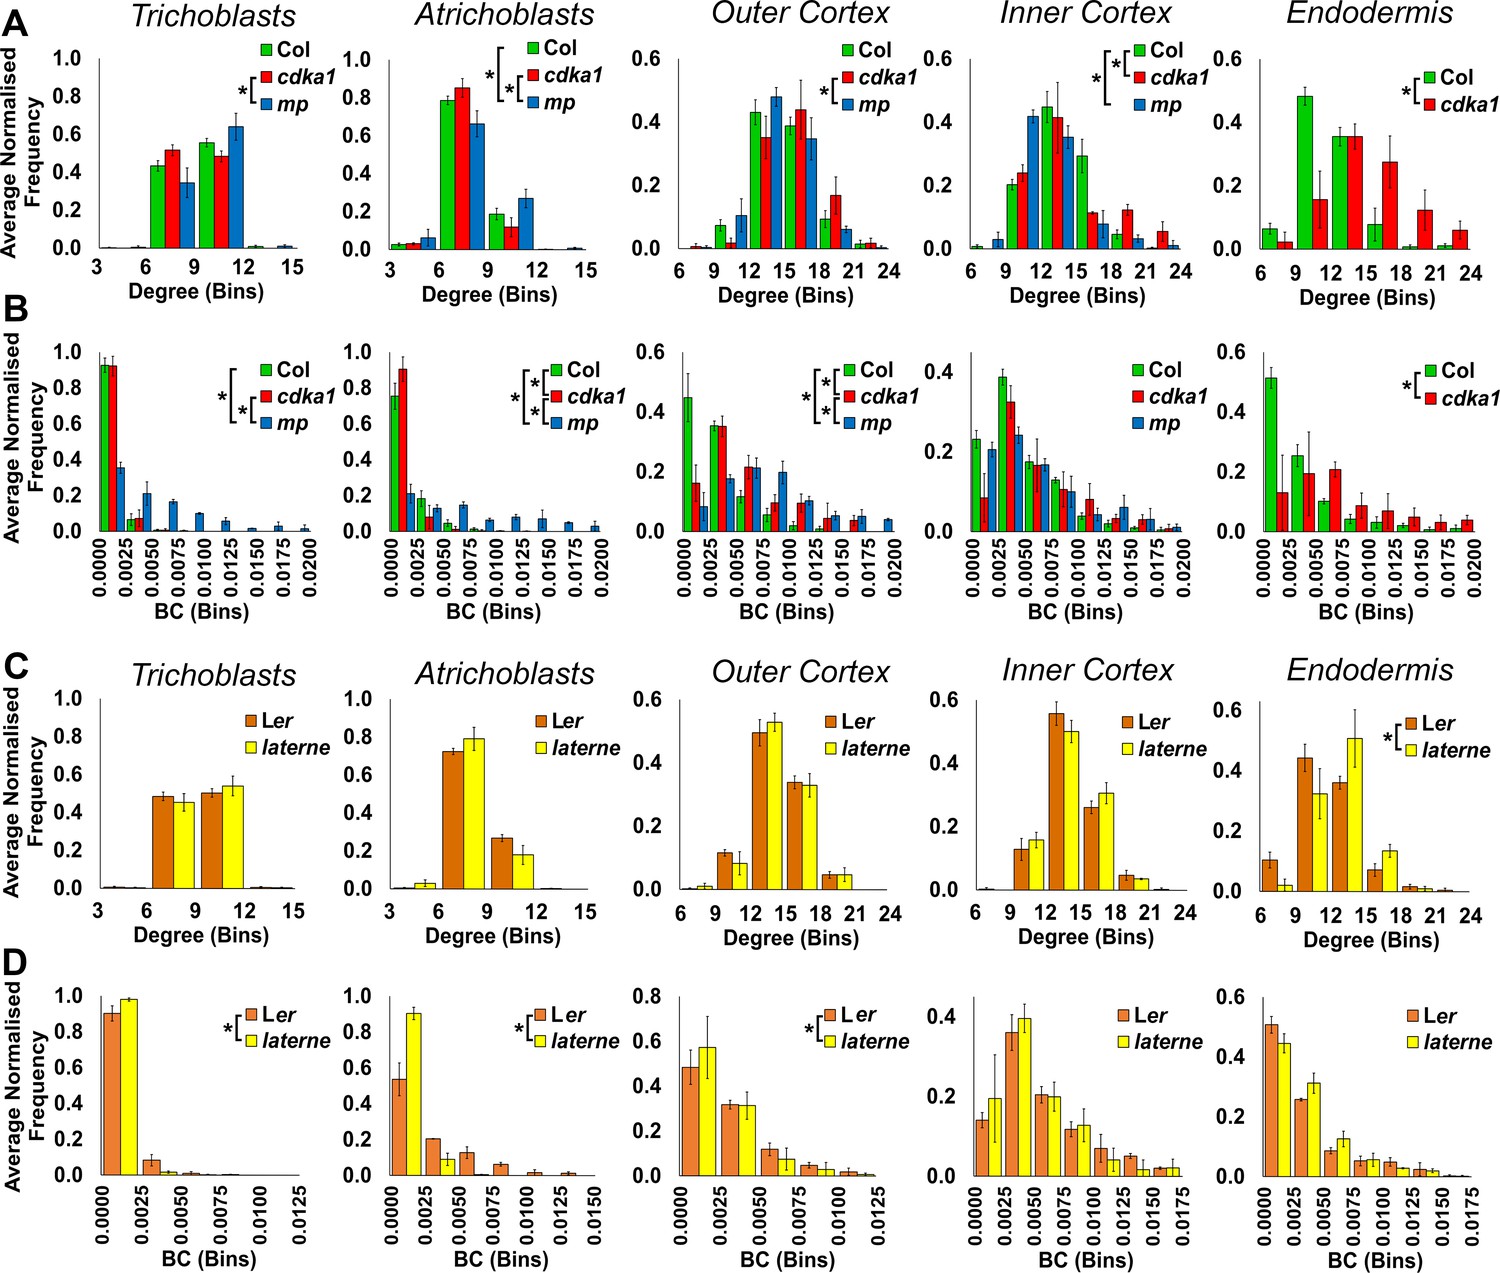
Cell type specific topological analysis of mutant Arabidopsis hypocotyl cellular arrangements.
(A–B) Average normalized frequency distributions of (A) degree and (B) betweenness centrality (BC) in trichoblasts, atrichoblasts, the outer cortex, the inner cortex and the endodermis, in three Arabidopsis genetic backgrounds: wild type Col, cdka1;1 and monopteros. (C–D) Average normalized frequency distributions of (C) degree and (D) betweenness centrality in trichoblasts, atrichoblasts, the outer cortex, the inner cortex and the endodermis, in two Arabidopsis genetic backgrounds: Ler and laterne. Biological replicates were treated as individual samples and data represent the mean frequency of the bins across the triplicate samples. Error bars represent ± the standard deviation within a bin. An asterisk (*) represents significant difference between distributions using the chi-squared test for degree and the Kolmogorov–Smirnov test for BC, at the p≤1.56×10⁻⁵ level (p≤0.05 after Bonferroni correction for 3200 distribution comparisons used in this study).
Figure 6 with 3 supplements
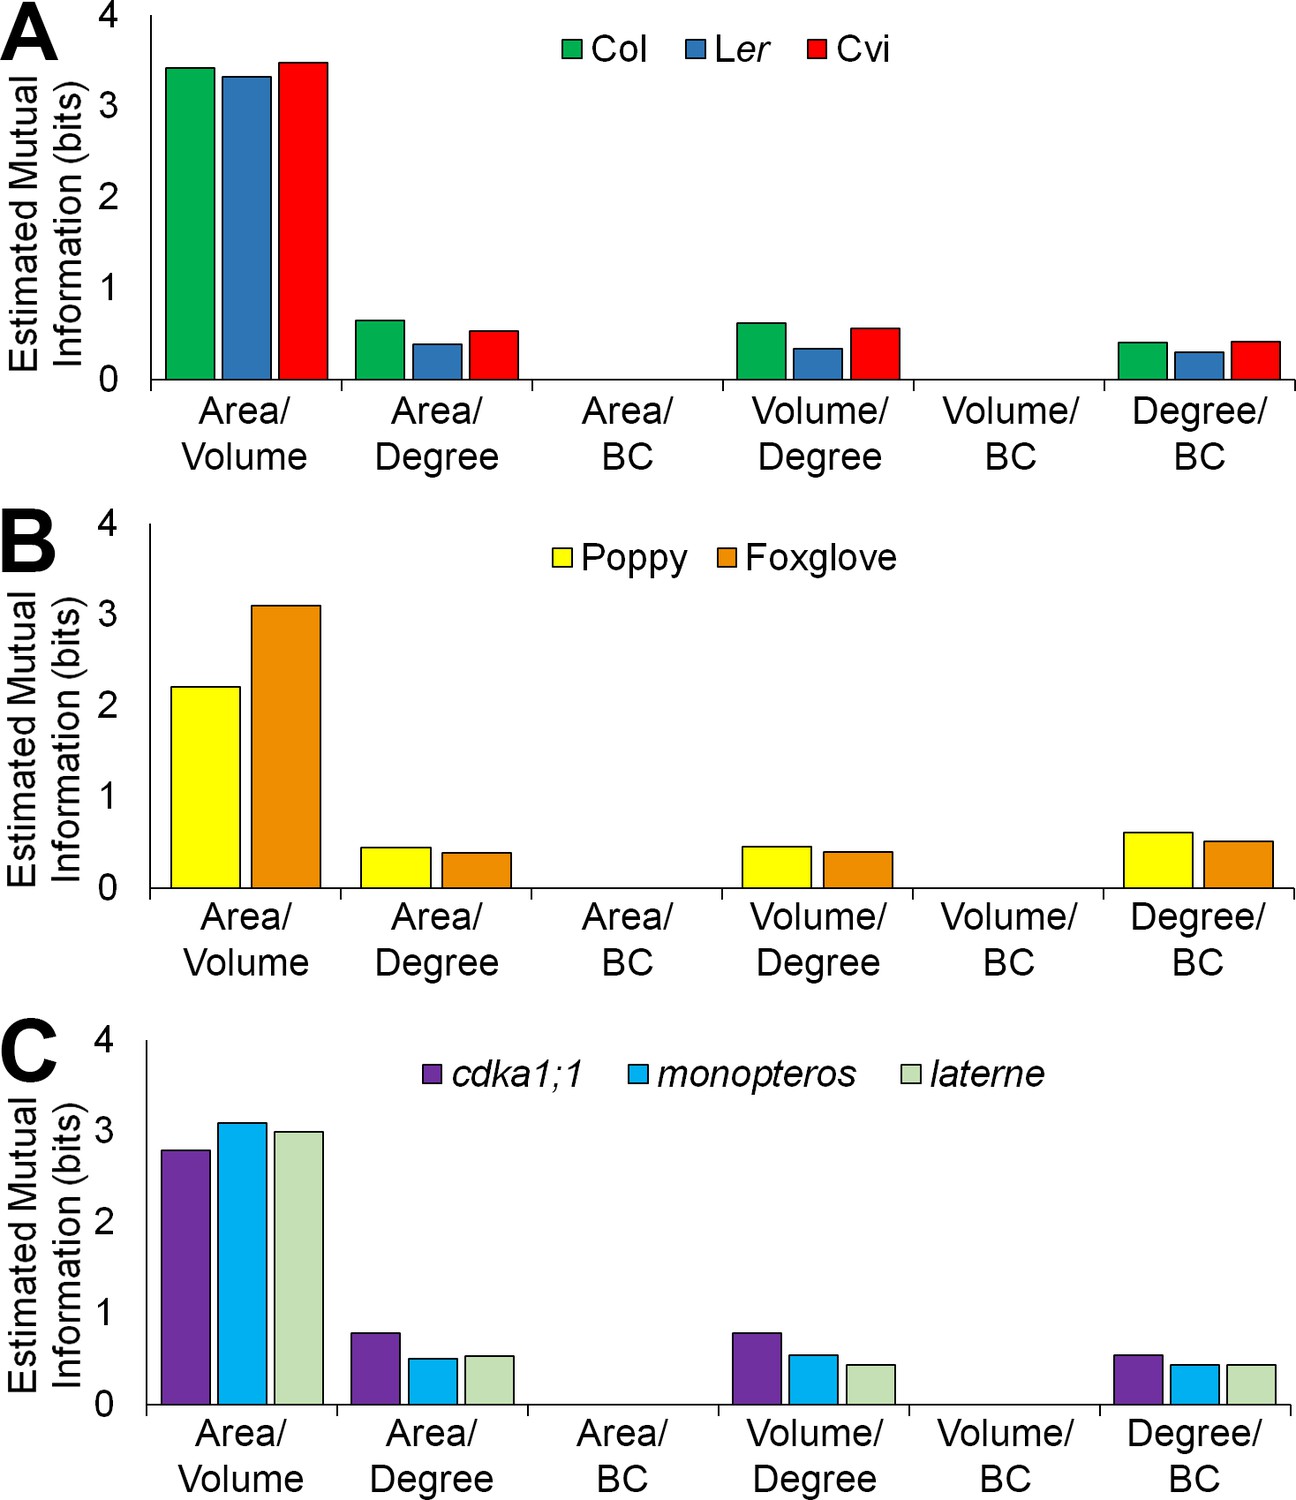
Mutual information between geometric and topological cell features in the hypocotyl epidermis.
(A–C) Estimated mutual information between area, volume, degree and betweenness centrality of epidermal cells in (A) three A. thaliana ecotypes, Col, Ler and Cvi, (B) poppy and foxglove, and (C) three A. thaliana mutants, cdka1;1, monopteros and laterne. Mutual information was measured using bits of Shannon entropy and is plotted along the y-axis.
Figure 6—figure supplement 1
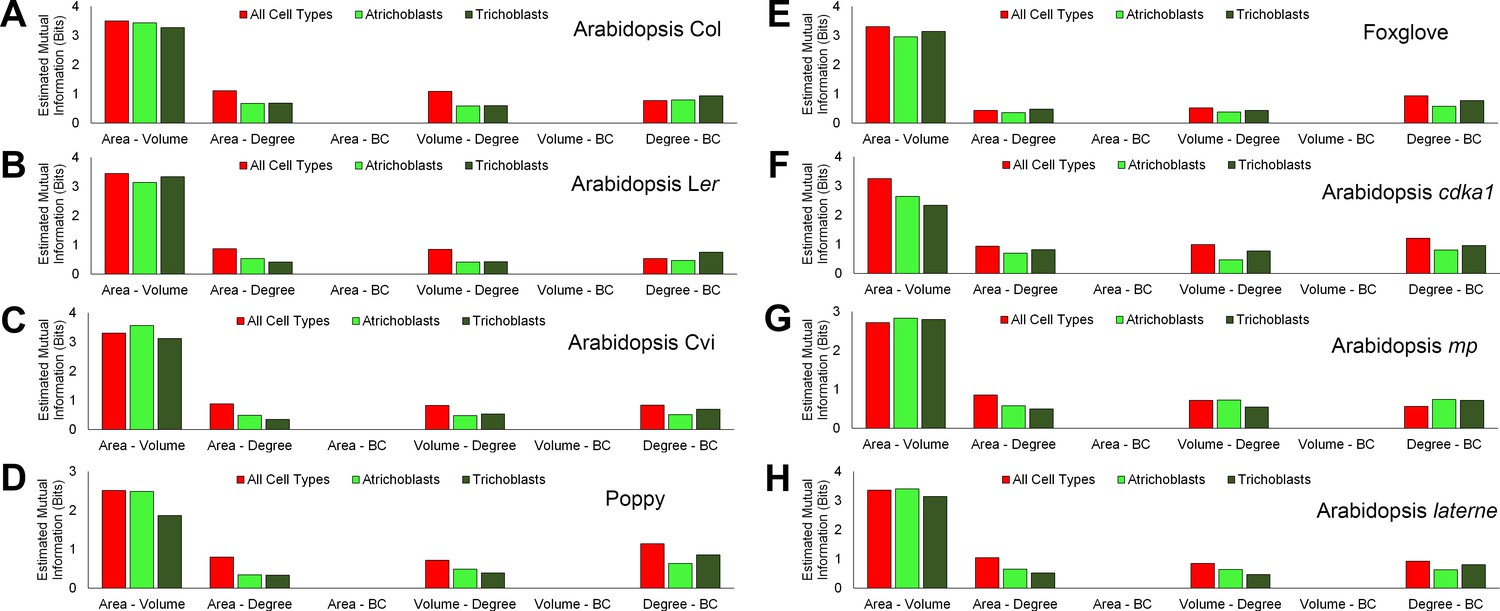
Mutual information between geometric and topological hypocotyl cell features in all cell types, atrichoblasts, and trichoblasts.
Estimated mutual information between area (µm2), volume (µm3), degree and betweenness centrality in hypocotyls of (A) A. thaliana Col, (B) A. thaliana Ler, (C), A. thaliana Cvi, (D) poppy, (E) foxglove, (F) A. thaliana cdka1;1, (G) A. thaliana monopteros and (H) A. thaliana laterne.
Figure 6—figure supplement 2
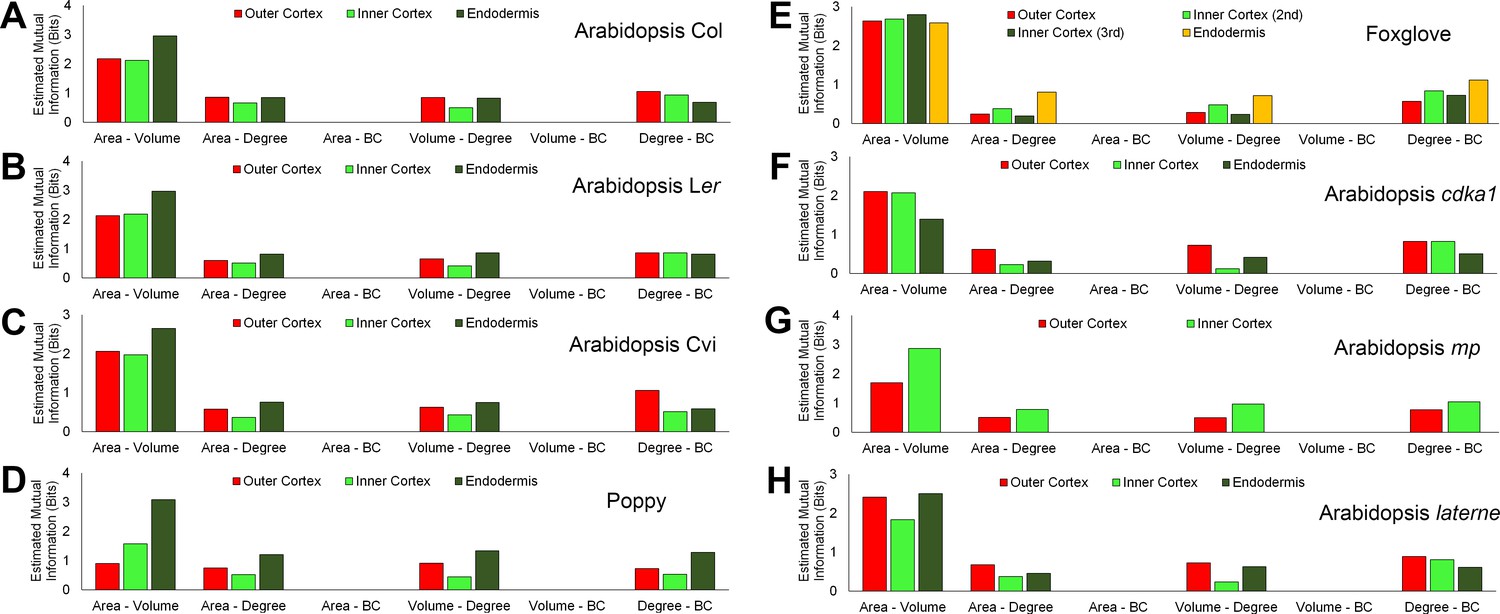
Mutual information between geometric and topological hypocotyl cell features in the outer cortex, inner cortex and endodermis.
Estimated mutual information between area (µm2), volume (µm3), degree and betweenness centrality in hypocotyls of (A) A. thaliana Col, (B) A. thaliana Ler, (C), A. thaliana Cvi, (D) poppy, (E) foxglove, (F) A. thaliana cdka1;1, (G) A. thaliana monopteros and (H) A. thaliana laterne.
Figure 6—figure supplement 3
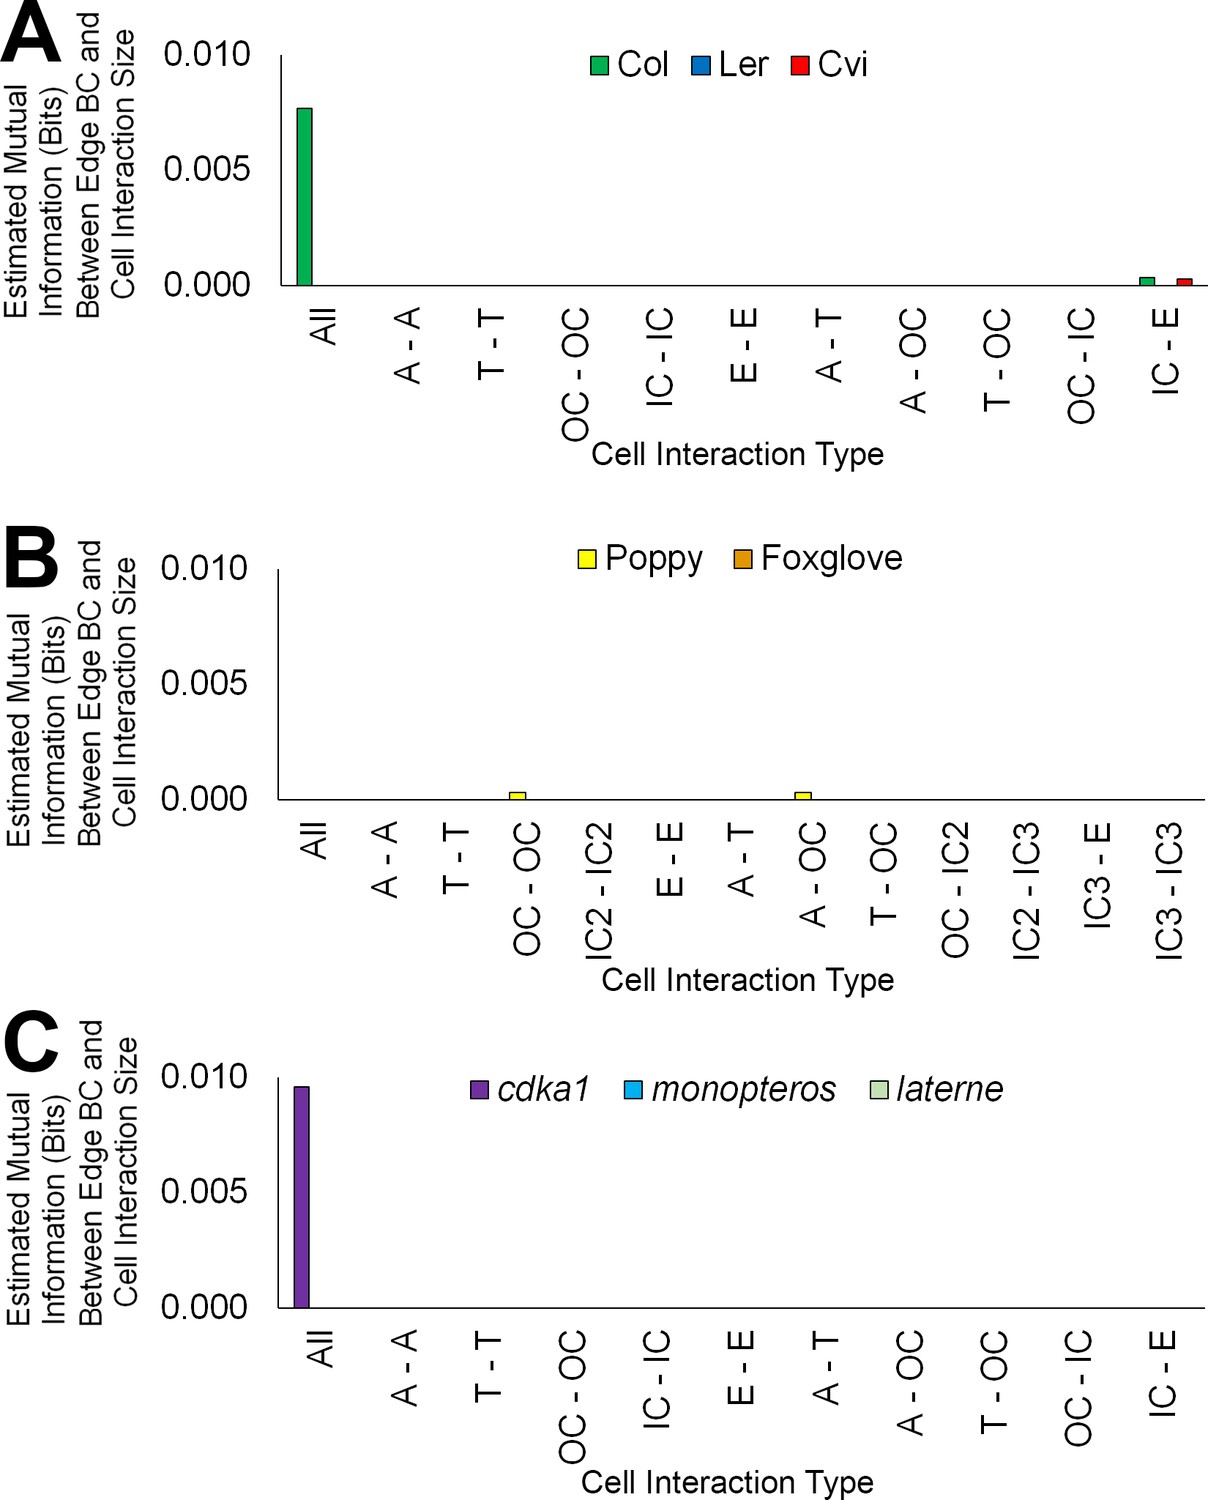
Mutual information between edge features across the hypocotyl cell connectivity network.
Estimated mutual information between shared cell wall surface area and edge betweenness centrality in (A) three A. thaliana ecotypes: Col, Ler and Cvi, (B) other plant species: poppy and foxglove, and (C) three A. thaliana mutants: cdka1;1, monopteros and laterne.
Figure 7 with 1 supplement
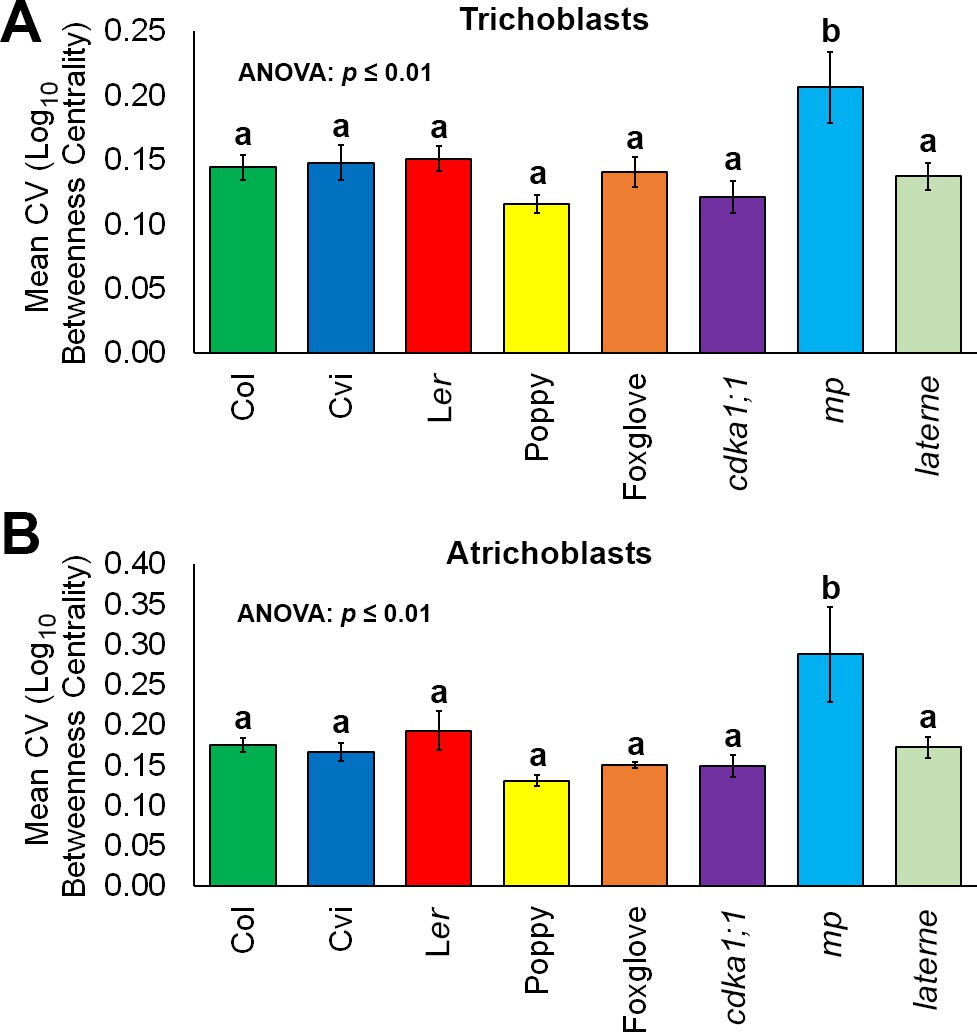
Robustness in cellular patterning and topological properties in the plant hypocotyl.
Comparisons of the coefficient of variation (CV) of betweenness centrality in different cell types of hypocotyls from A. thaliana ecotypes (Col, Ler and Cvi), mutants (cdka1;1, monopteros and laterne) and other plant species (poppy and foxglove). (A) Mean CV in trichoblast cells. (B) Mean CV in atrichoblast cells. Data represented are the means and standard deviation of three biological replicates. ANOVA tests suggested significant differences between groups (p≤0.01) and an asterisk (*) indicates significant difference to all other groups (Tukey’s test, p≤0.01).
Figure 7—figure supplement 1
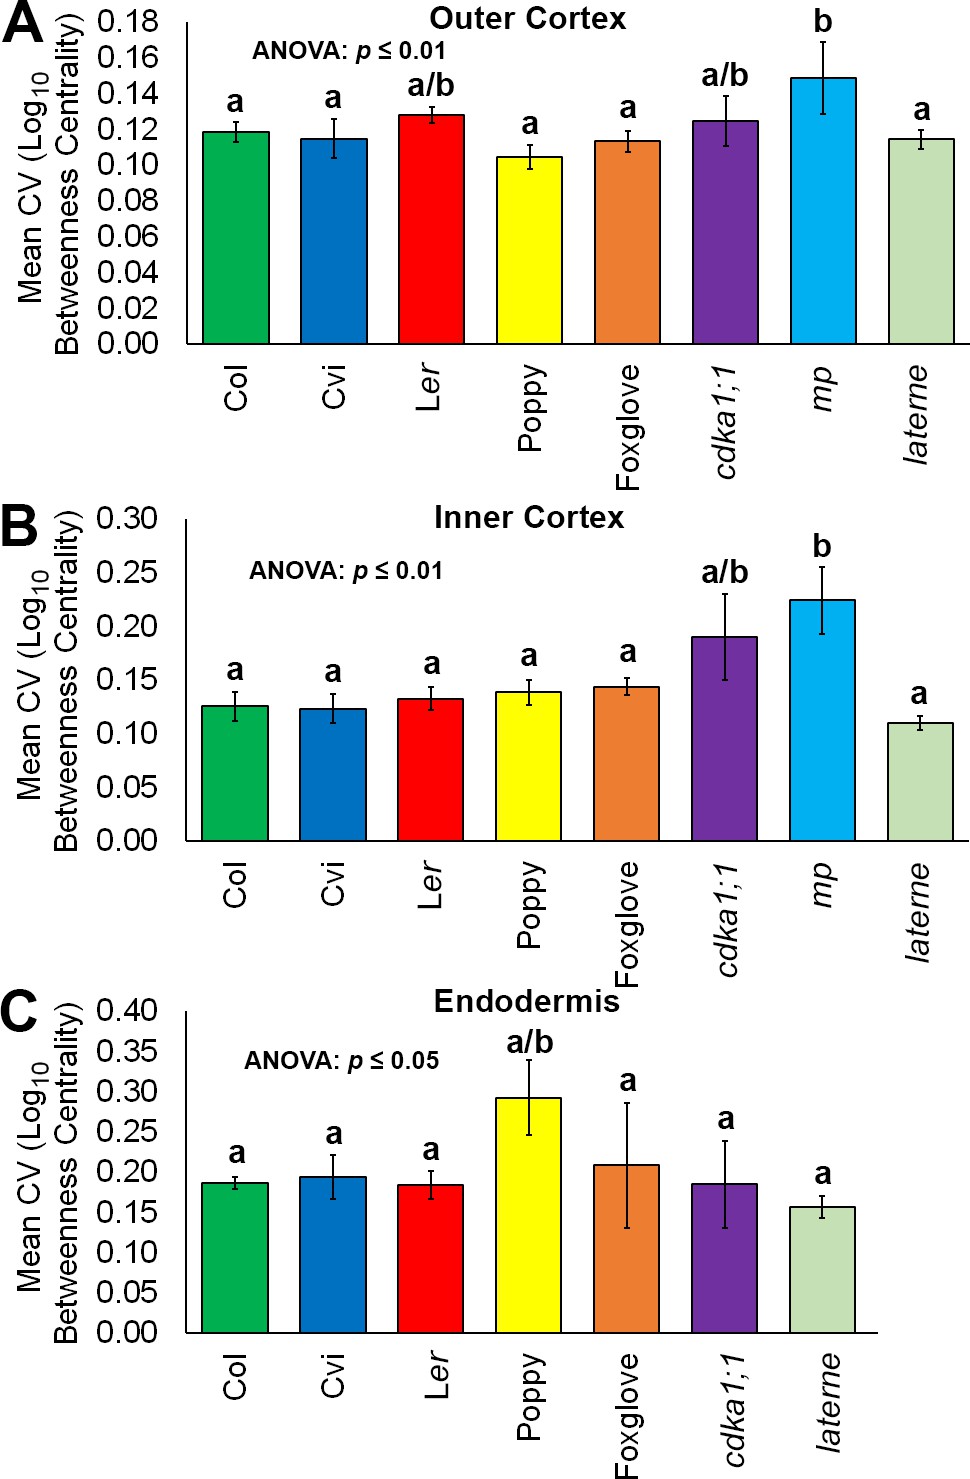
Variability in hypocotyl betweenness centrality.
Relative variability is measured using the coefficient of variation (CV), which is the standard deviation of a group divided by the mean. (A) The mean coefficient of variability of log10betweenness centrality in all hypocotyl connectivity network samples, in outer cortical cells. (B) The mean coefficient of variability of log10betweenness centrality in all hypocotyl connectivity network samples, in inner cortical cells. (C) The mean coefficient of variability of log10betweenness centrality in all hypocotyl connectivity network samples, in the endodermis. Error bars represent ± the standard deviation in CV measurements (n = 3 for each ecotype, species or mutant hypocotyl). ANOVA tests suggested significant differences between groups (outer cortex, inner cortex: p≤0.01, endodermis p≤0.05) and different lowercase letters represent statistically significant differences between means (Tukey’s HSD, p≤0.05).
Figure 8
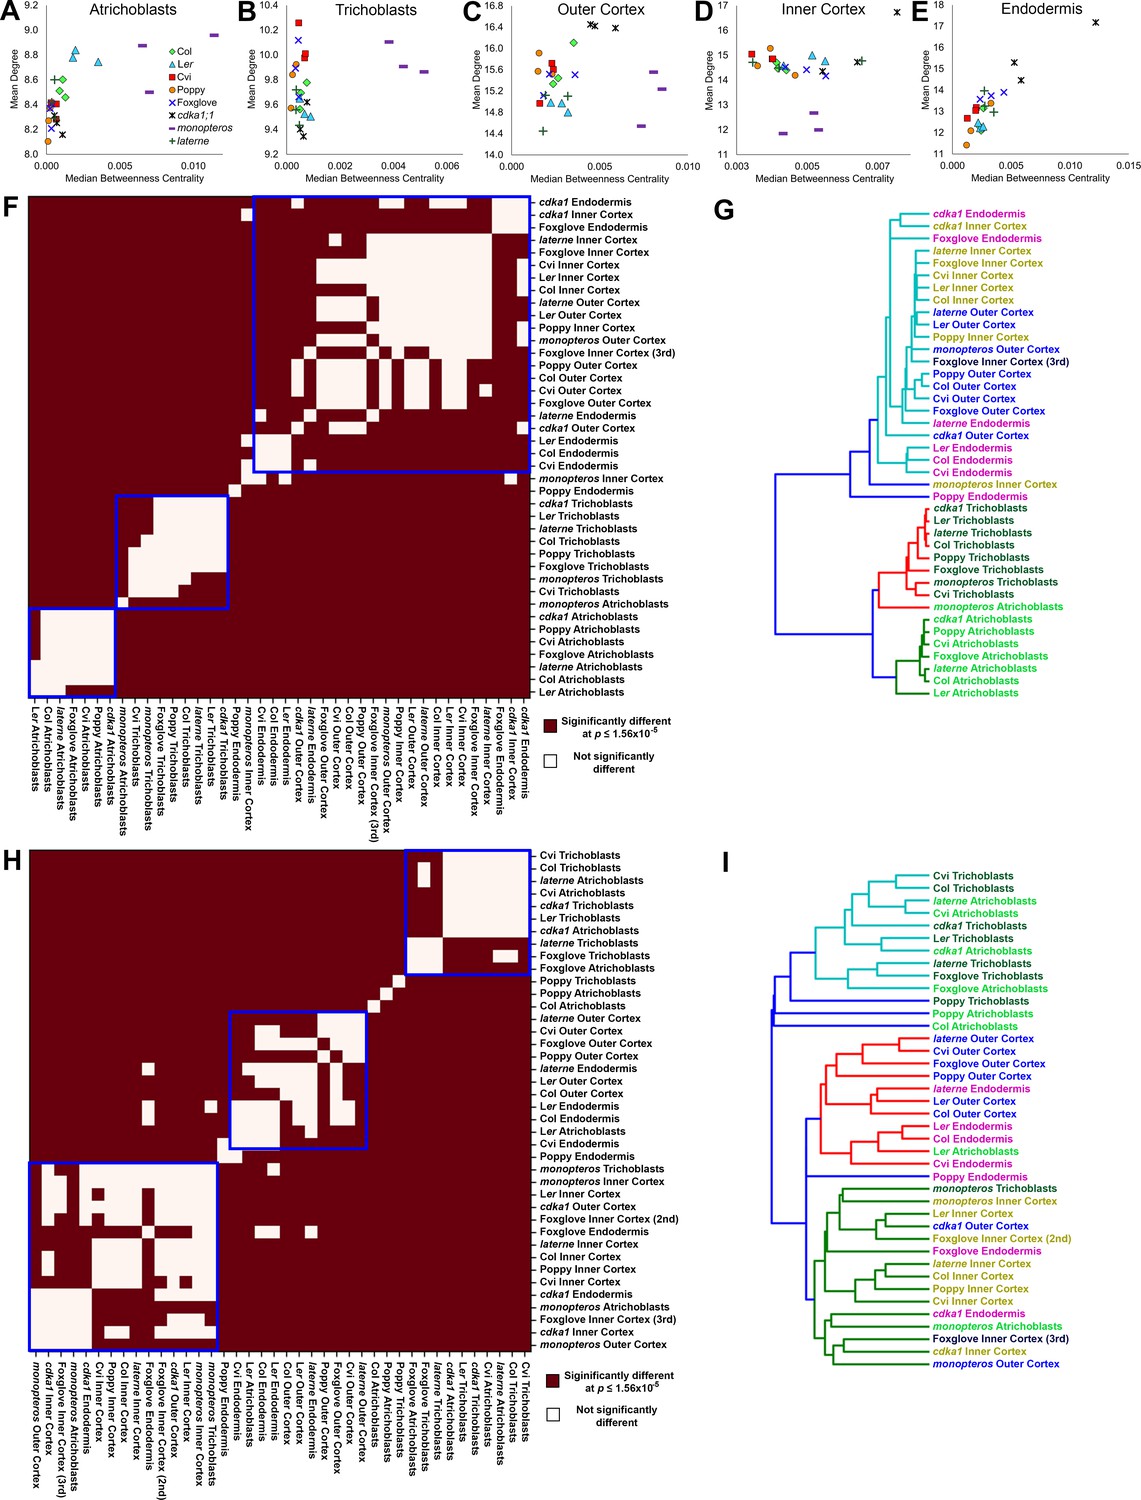
Cell type-specific topological principles of hypocotyl multicellular architecture.
(A–E) Scatterplots of mean degree and median betweenness centrality in (A) trichoblasts, (B) atrichoblasts, (C), the outer cortex, (D) the inner cortex and (E) the endodermis for each sample used in this study. (F–G) Analysis of degree distribution relationships using the inverse of the chi-squared test statistic as a measure of distance. (F) pairwise significance tests for degree distribution and (G) a dendrogram of the data from (F). (H–I) Analysis of betweenness centrality distributions using the inverse of the Kolmogorov–Smirnov test statistic as a measure of distance, with (H) pairwise significance tests and (I) a dendrogram of the data from (H).
Videos
Video 1
Hypocotyl cell connectivity network of Arabidopsis thaliana Col.
Cell types are gradually removed to allow internal visualisation of the network.
Video 2
Hypocotyl cell connectivity network of the epidermis of Arabidopsis thaliana Col.
Edge colour represents the edge random walk betweenness centrality (scale 0–0.0015, blue to red).
Video 3
Comparison of the hypocotyl cell connectivity networks of Arabidopsis thaliana Col (left), poppy (centre) and foxglove (right).
Edge colour represents the edge random walk betweenness centrality (scale 0–0.0015, blue to red).
Video 4
Comparison of the hypocotyl cell connectivity networks of wild-type Arabidopsis thaliana Col (left), and the mutant cdka1;1.
Edge colour represents the edge random walk betweenness centrality (scale 0–0.0015, blue to red).
Video 5
Comparison of the hypocotyl cell connectivity networks of wild-type Arabidopsis thaliana Col (left), and the mutant monopteros.
Edge colour represents the edge random walk betweenness centrality (scale 0–0.0015, blue to red).
Video 6
Comparison of the hypocotyl cell connectivity networks of wild-type Arabidopsis thaliana Col (left), and the mutant laterne.
Edge colour represents the edge random walk betweenness centrality (scale 0–0.0015, blue to red).
Additional files
-
Supplementary file 1
Source dataset: Text files of network data (edge lists) describing cell connectivity and cell type annotations used in this study.
Cells are represented by arbitrary labels, and interaction size (μm2) and cell types for each cell-cell interaction are included in additional columns. Details are explained in the associated readme file. Biological triplicate samples for each genetic background are labelled sequentially.
- https://doi.org/10.7554/eLife.26023.028
Download links
A two-part list of links to download the article, or parts of the article, in various formats.
Downloads (link to download the article as PDF)
Open citations (links to open the citations from this article in various online reference manager services)
Cite this article (links to download the citations from this article in formats compatible with various reference manager tools)
Topological analysis of multicellular complexity in the plant hypocotyl
eLife 6:e26023.
https://doi.org/10.7554/eLife.26023


