wtf genes are prolific dual poison-antidote meiotic drivers
- Stowers Institute for Medical Research, United States
- Fred Hutchinson Cancer Research Center, United States
- University of Kansas Medical Center, United States
- Howard Hughes Medical Institute, Fred Hutchinson Cancer Research Center, United States
Figures
Figure 1 with 1 supplement

A complex meiotic drive landscape on Sk and Sp chromosome 3 is revealed by recombination mapping.
(A) A cross between Sk and Sp generates a heterozygote that has low fertility and preferentially transmits Sk alleles on all three chromosomes into viable gametes (Zanders et al., 2014). (B) Generation of chromosome 3 introgression diploids 1–8. Sk-derived DNA is shown in purple while Sp-derived DNA is shown in green. The origin of the Sp/Sk mosaic chromosome is depicted in Figure 1—figure supplement 1. (C) Phenotypes of rec12∆/rec12∆ introgression/Sk diploids. See Figure 1—source data 1 for breakpoints between Sk-derived DNA (purple) and Sp-derived DNA (green). Chromosome transmission was followed using the heterozygous markers at the ade6 locus: hph is short for the hphMX4 marker gene which confers resistance to hygromycin (HygR). The percentage of gametes that inherit both markers (heterozygous disomes, likely aneuploids and diploids) and (after excluding the heterozygous disomes) the percent of gametes that inherit the marker from the pure Sk chromosome are shown. Over 100 viable gametes were tested for each diploid; raw data can be found in Figure 1—source data 2. * indicates p-value<0.01 (G-test) compared to rec12∆/rec12∆ Sk control (from Zanders et al. (2014)). (D) Fine-scale mapping of the drive locus starting with the introgression from diploid 1. Strains that were recombinant between the ura4 locus and an introduced kanMX4 marker gene were selected and their phenotypes were tested in crosses to Sk. The recombinant strain with the smallest amount of Sp DNA that retained the phenotype (sensitivity to drive by an Sk chromosome) is shown in detail. This introgression strain was mated to Sk to generate diploid 9. These analyses identified a ~30 kb candidate region (see blow up) containing a drive locus. In Sp, this region contains wtf4 and the wtf3 pseudogene. The syntenic region in Sk contains only one wtf gene, wtf4.
-
Figure 1—source data 1
Breakpoints between Sp and Sk-derived DNA sequences.
The introgression strains used in diploids 1–8 were sequenced and genotyped for single-nucleotide polymorphisms (SNPs) that reliably distinguish Sk and Sp as in (Zanders et al., 2014). The SNPs flanking the recombination event (left and right boundaries) that generated each breakpoint between Sp and Sk DNA for each introgression strain are shown. The coordinates refer to the position of the SNP on Sp chromosome 3. For the introgression used in diploid 9, SNPs were genotyped via PCR and Sanger sequencing.
- https://doi.org/10.7554/eLife.26033.004
-
Figure 1—source data 2
Raw data underlying Figure 1C.
Diploids 1–10 (column 1) were generated by crossing the indicated haploid strains (columns 2 and 4). The diploid numbers correspond to those in Figure 1 and the text. All strains are rec12∆ and transmission of chromosome 3 was followed using heterozygous markers at the ade6 locus (columns 3 and 5). hphMX4 confers resistance to hygromycin (HygR). The number of viable progeny inheriting one or both ade6 markers is indicated (columns 6–8), as are the percentage of the progeny that inherited both markers (column 10). These strains have two copies of chromosome 3, so we refer to them as disomes, although other homozygous disomes could be present in the Ade+ HygS and Ade- HygR classes as well. Amongst the progeny that inherit only one ade6 marker, we show the percent that inherit allele 2 (column 12), which is the allele from the pure Sk chromosome. For the statistical analyses (G-tests), we compared the observed heterozygous disomy and allele 2 transmission to the values observed in diploid 10, which is a pure Sk rec12∆ control (columns 11 and 13). The last column indicates the number of independent diploids that were generated and assayed of each genotype.
- https://doi.org/10.7554/eLife.26033.005
Figure 1—figure supplement 1

Generation of mosaic chromosome 3 used in Figure 1B.
The goal of these crosses was to generate a strain containing mostly Sp-derived DNA on chromosome 3 in an otherwise Sk background. This effort was complicated by the different karyotypes of Sp and Sk chromosomes 2 and 3 (Zanders et al., 2014). We used rec12∆ strains to limit recombination, but rare recombinants (e.g. SZY239 and SZY247) can still be obtained via selection. Markers derived from the Sk parent are shown in purple, while Sp-derived markers are green. We first isolated hybrids in which Sk and Sp markers on chromosomes 2 and 3 were uncoupled, suggesting rare recombination events had occurred between Sk and Sp chromosomes 2 and 3. Such events have the potential to generate chromosome 3 variants with mostly Sp DNA, but with an Sk karyotype, as occurred in SZY247. We then performed the illustrated crosses to move that chromosome into a different strain background with pure Sk chromosomes 1 and 2. We finally sequenced SZY558 and verified the strain has Sk chromosomes 1 and 2 and Sp DNA on chromosome 3 until between SNPs at positions 1,804,477 and 1,810,659.
Figure 2

Sk wtf4 is a self-sufficient meiotic driver that kills gametes that do not inherit the gene.
(A) Allele transmission and propidium iodide (PI) staining phenotypes of diploids 11–19. Sk-derived DNA is purple, Sp-derived DNA is green. The cartoons depict chromosome 3. Chromosomes 1 and 2 are derived from Sk in diploids 11–15, but are from Sp in diploids 16–19. For diploids 11–15, allele transmission was monitored by following heterozygous markers at the ura4 locus, which is tightly linked to wtf4 (estimated 7–17 cM based on physical distance [Young et al., 2002]). PI dye is excluded from living spores, but not dead spores that have lost membrane integrity, such as those destroyed by drive. The percent of spores that exclude PI is shown as a proxy of fertility (Figure 2—source data 1). The PI phenotypes and ura4 locus allele transmission for diploids 11, 12, 14 and 15 were compared to those of the wild-type Sk control (diploid 13). * indicates p-value<0.01 (G-test). For diploids 16–19, allele transmission was followed using markers at the ade6 locus, which is where the empty vector or wtf gene constructs are integrated. The integrations introduced a dominant drug resistance gene and mutated ade6+. Because these diploids all had codominant alleles at ade6, we could detect progeny that inherited both ade6 alleles (less than 10% of the total population). These progeny are excluded from the data presented above, but all the raw data are presented in Supplementary file 1. The PI phenotypes and allele transmission for diploids 17–19 were compared to the empty vector control (diploid 16) and * indicates p-value<0.01 (G-test). See Supplementary file 1 for the markers used for each diploid and the raw data for allele transmission and Supplementary file 2 for the PI staining raw data. Over 200 viable gametes were scored for allele transmission and over 200 spores (>50 4-spore asci) were assayed for PI staining. (B) Images of PI staining and transmitted light (TL) in an ascus with no drive containing all alive spores (top) and in an ascus with drive where two of the four spores are dead (bottom). Scale bar represents three microns.
-
Figure 2—source data 1
PI staining correlates with viable spore yield as a measure of fertility in wild-type and wtf heterozygous crosses.
The fertility of the indicated diploids was assayed using both the established viable spore yield assay and by PI staining. We avoided tetrad dissection because we found that it was complicated by disintegration of spores destroyed by drive. The viable spore yield assay is a plating assay that measures the number of viable spores produced per viable diploid induced to undergo meiosis (Smith, 2009). PI is excluded from viable spores, but enters those destroyed by wtf drivers (Figure 2B). Although PI staining likely will not detect spore death by other causes that do not disrupt membrane integrity, the percent of PI-excluding cells correlates with viable spore yield in wild-type and wtf heterozygous crosses. Diploids of four genotypes are shown. Three of the diploids are used elsewhere in the paper (diploids 17, 22, and 27) and the diploid number (column 1) corresponds to the diploid numbers used in the main text and figures. The two strains that were mated to generate the diploids are shown in columns 2 and 4. The drive-relevant genotypes of these parental strains is shown in columns 3 and 5. The last two columns show the PI-staining and viable spore yield phenotypes of each diploid.
- https://doi.org/10.7554/eLife.26033.008
Figure 3 with 1 supplement
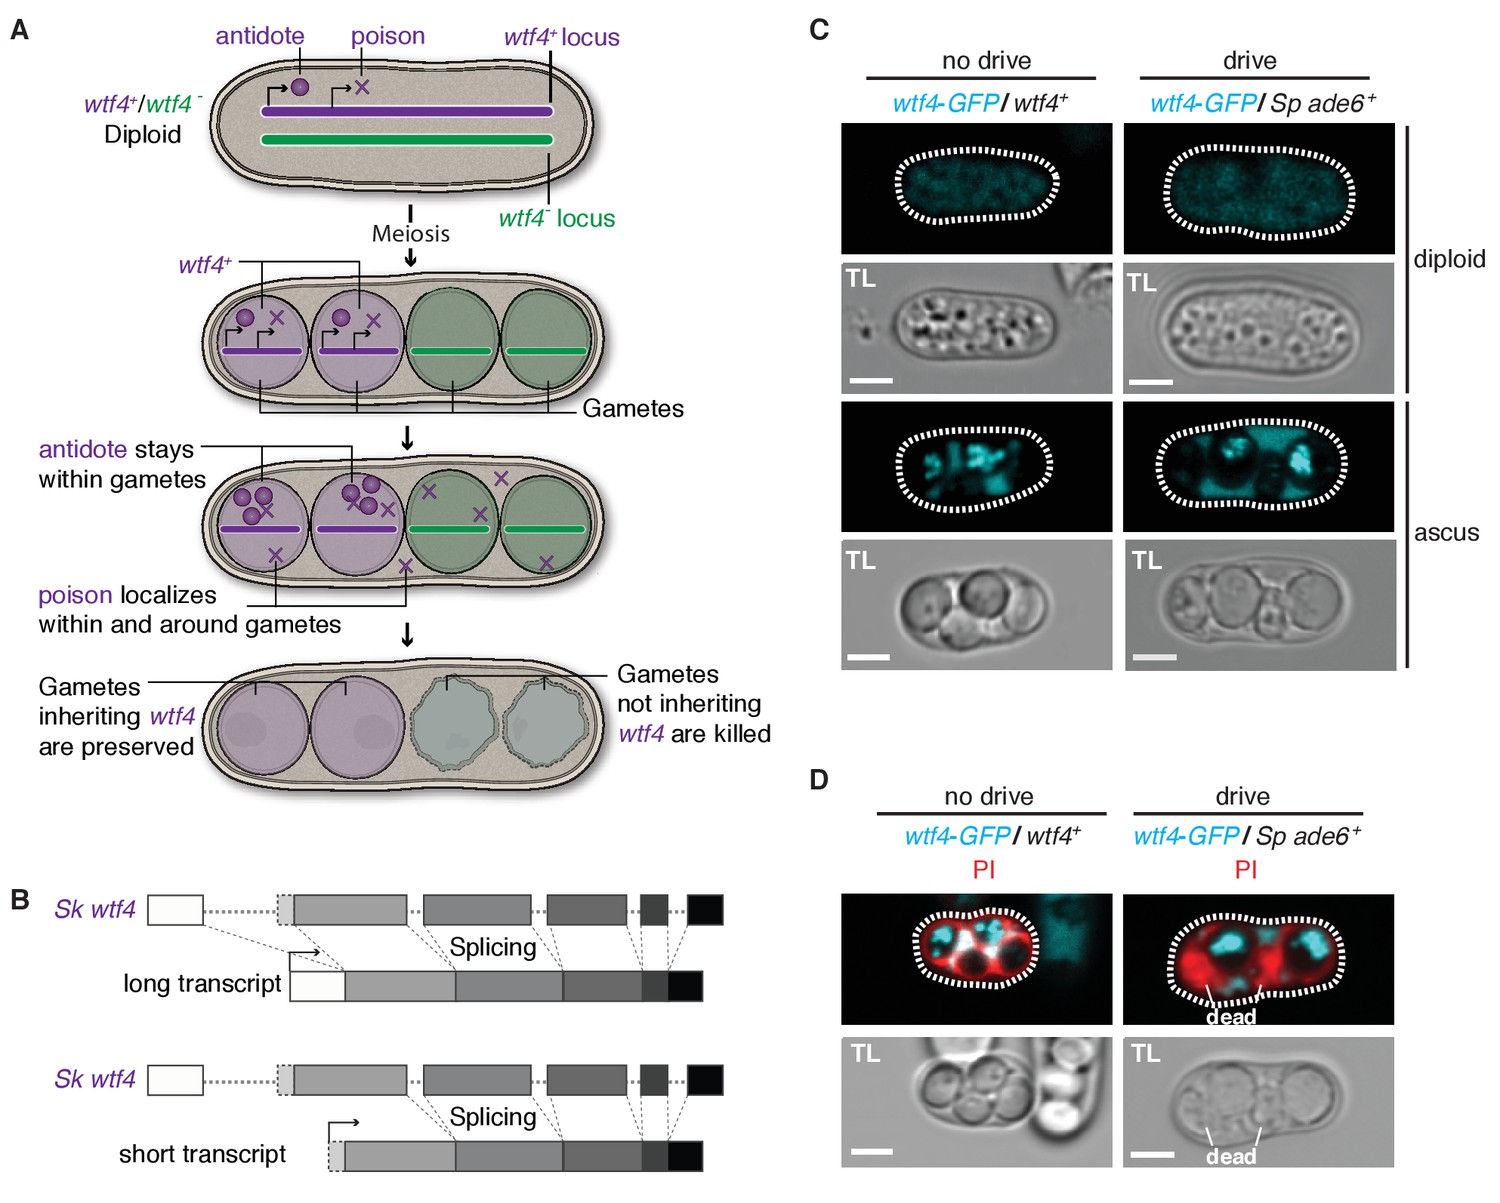
Sk wtf4 has the capacity to make two proteins and Wtf4-GFP shows a dual localization pattern.
(A) Model for meiotic drive of Sk wtf4 via a poison-antidote mechanism. (B) wtf4 creates a long and an alternative short transcript. See Figure 3—figure supplement 1 for a depiction of the long-read RNA sequencing data on which this model is based (Kuang et al., 2017). (C) Sk Wtf4-GFP localization in diploids where drive does [right] or does not occur [left]. Cells were imaged prior to the first meiotic division [top] and as mature asci [bottom]. (D) Asci generated by diploids of the same genotypes as in (C) stained with PI to label dead cells (those lacking wtf4).
Figure 3—figure supplement 1
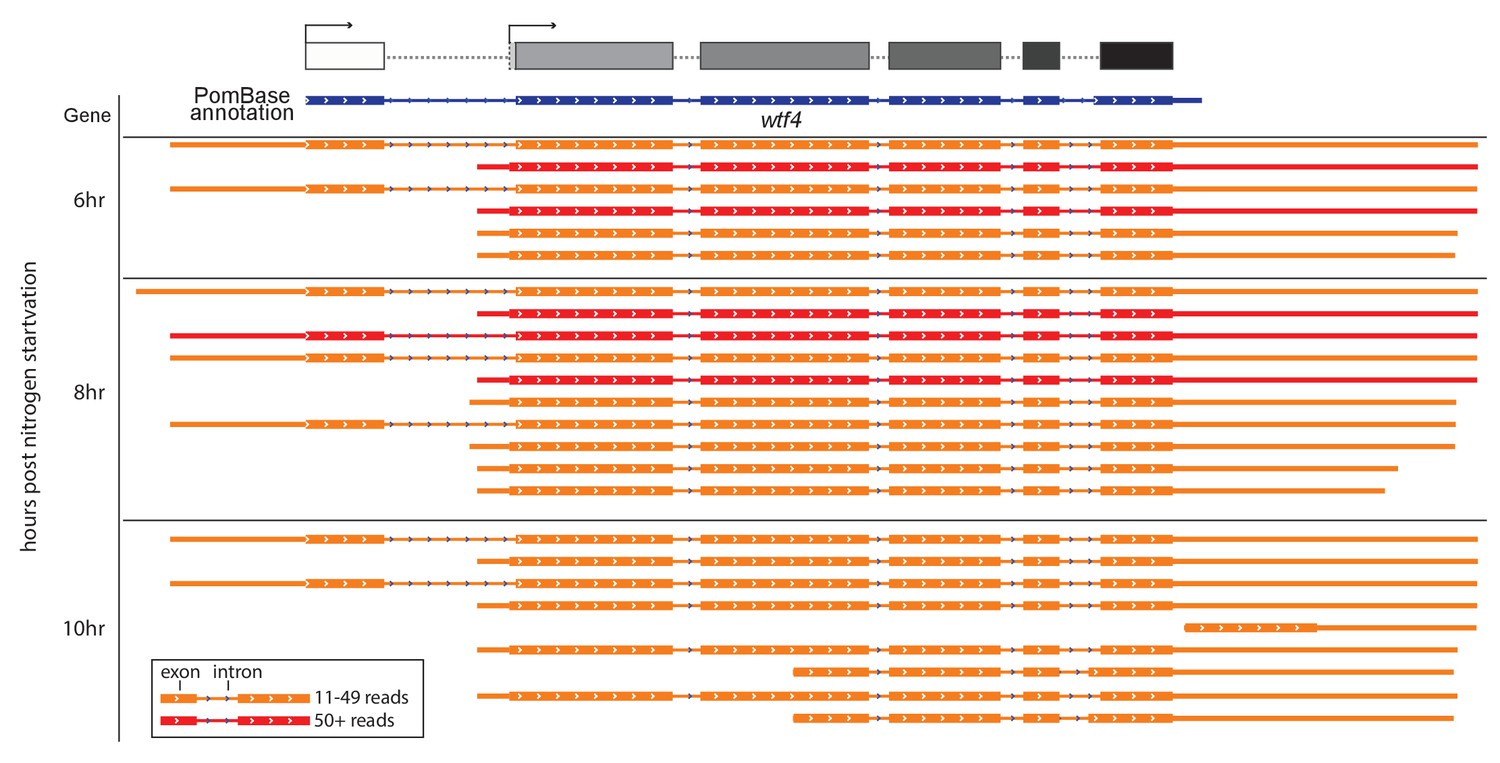
Sp wtf4 has alternate transcriptional start sites.
Our annotation of the wtf4 gene with alternate start sites predicted is shown at the top in the same format as Figures 3–5. The PomBase annotation for Sp wtf4 is shown below that in blue. The transcript locations from one replicate of the meiotic transcript time courses sequenced by Kuang et al. (2017) are shown below in red and orange. The IsoSeq consensus reads shown should represent full-length transcripts, and each represents a number of individual sequencing reads. Only transcripts represented by 11 or more reads are displayed. Many of the transcripts vary by only a few nucleotides at the 5’ or 3’ ends and appear identical in the image. The time the samples were taken after meiotic induction are shown on the left. No transcripts with 11 or more reads were observed at earlier time points. Introns are represented by thin lines with blue arrows and the coding sequences are represented by the thick boxes. There are two major transcriptional start sites and the splice sites of intron 5 are different from those in the PomBase annotation. We did not verify two possible additional transcript types observed only at 10 hr, or explore their possible functional relevance. The data were visualized using IGV (Thorvaldsdottir et al., 2013).
Figure 4
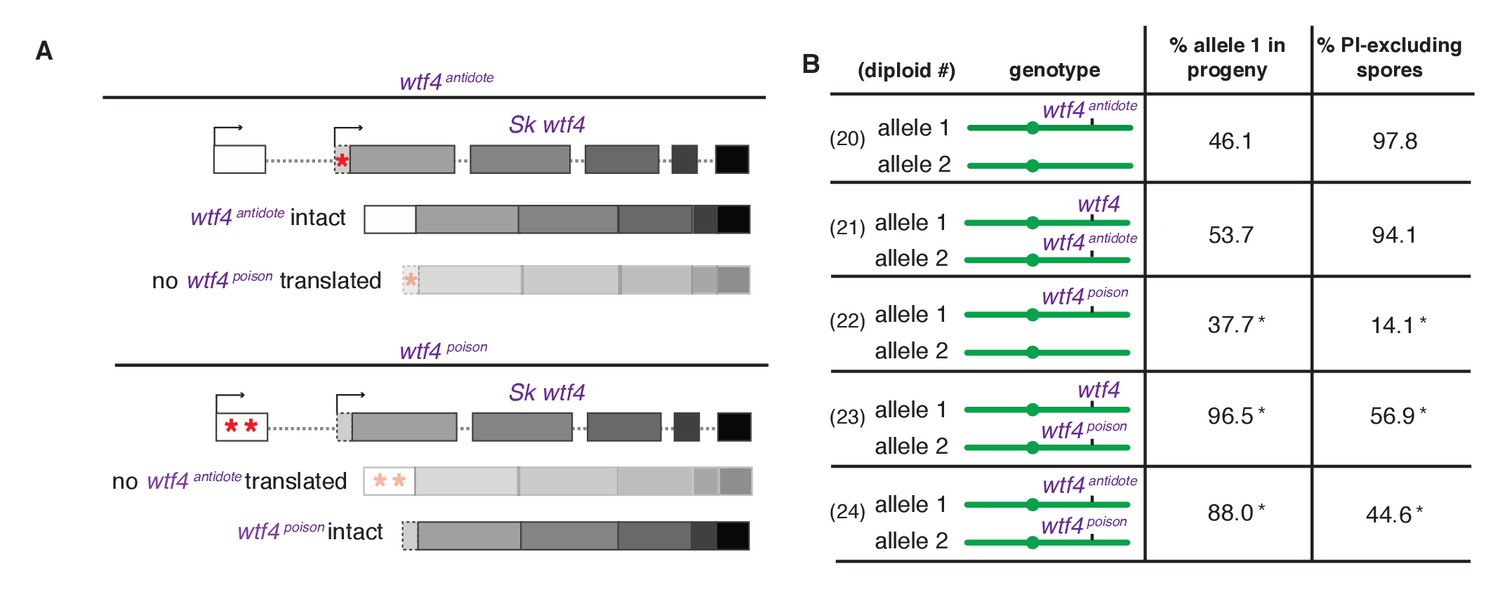
Sk wtf4 creates two proteins using alternate transcripts: an antidote and a gamete-killing poison.
(A) Separation of function wtf4 alleles. The red stars indicate start codon mutations. (B) Allele transmission and PI staining phenotypes of Sp diploids with the indicated Sk wtf4 alleles integrated at ade6 on chromosome 3, as in diploids 16–19 in Figure 2A. Spores that inherited both alleles at ade6 are eliminated from the data presented above, but the complete data are found in Supplementary file 1. * indicates p-value<0.01 (G-test) compared to empty vector (or wild-type control) for allele transmission and fertility as assayed by PI staining. See Supplementary file 1 for raw data and the markers used to monitor allele transmission for each diploid and Supplementary file 2 for the PI staining raw data. Over 200 viable gametes were scored for allele transmission for all diploids except diploid 24, from which we genotyped 50. Over 200 spores (>50 4-spore asci) were assayed for PI staining of each diploid.
Figure 5 with 1 supplement
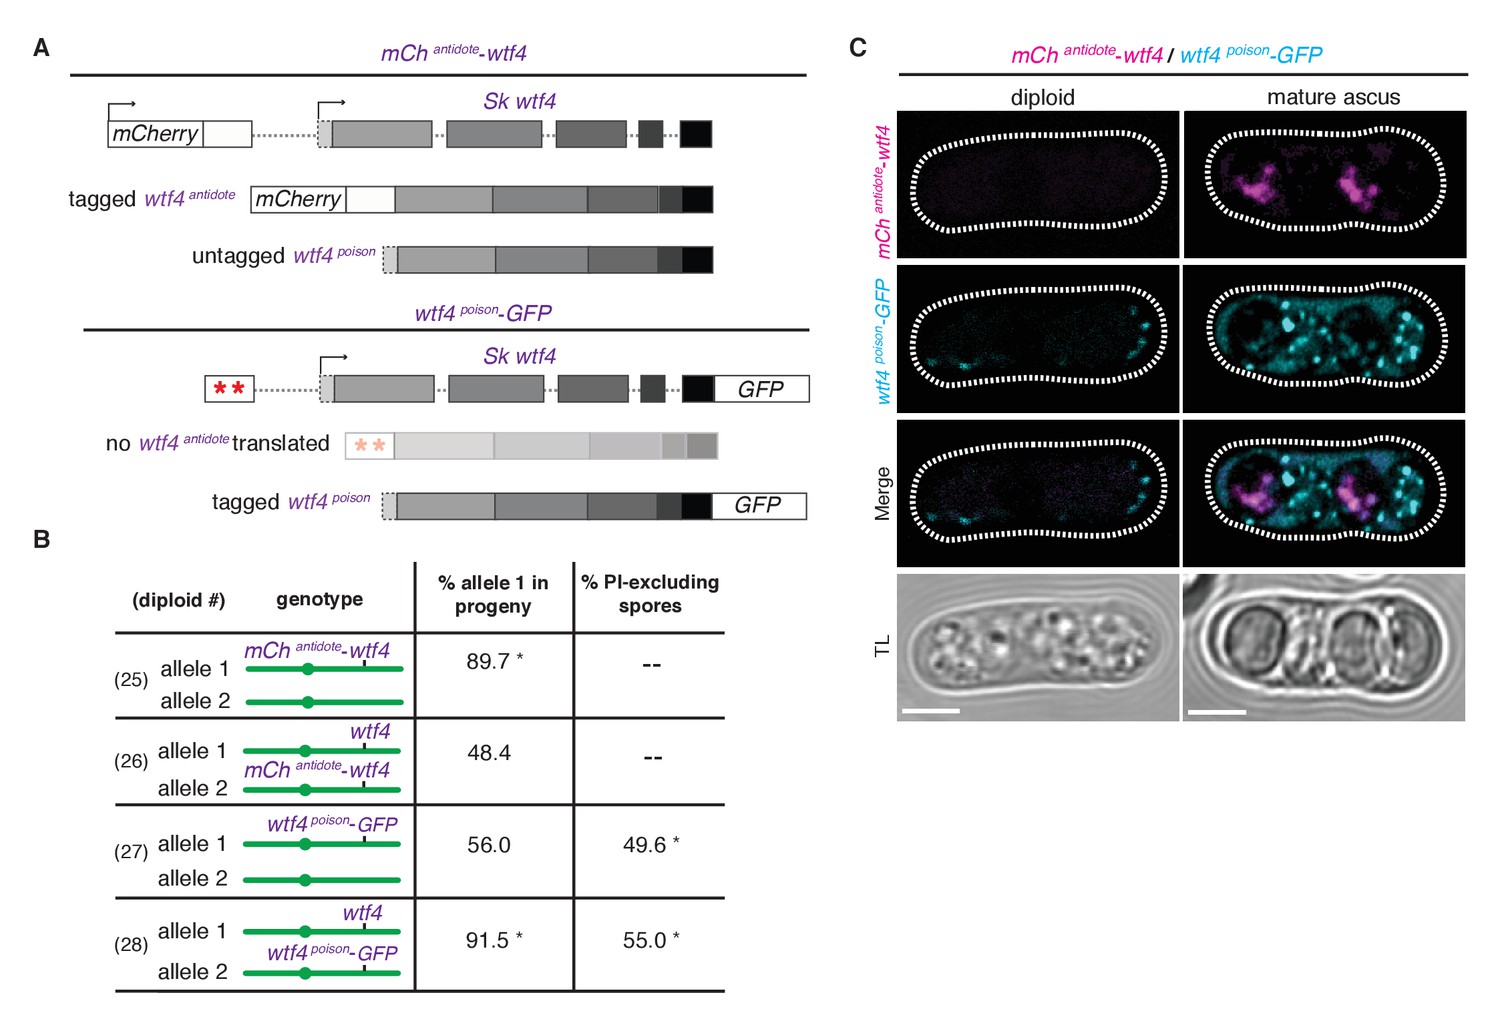
Wtf4 antidote is spore-specific and Wtf4 poison spreads throughout the ascus.
(A) Constructs tagging either the Wtf4 antidote (top) or poison (bottom) proteins. The red stars indicate start codon mutations. (B) Allele transmission and PI staining phenotypes for tagged alleles, as in Figure 4B. See Supplementary file 1 for raw data and the markers used to monitor allele transmission for each diploid and Supplementary file 2 for the PI staining raw data. We could not reliably use PI to assay fertility of mCherry-tagged strains because of color similarity, but in viable spore yield assays the mCherryantidote-wtf4 allele gave a similar phenotype to wtf4. * indicates p-value<0.01 (G-test) compared to empty vector (or wild-type control). Over 200 viable gametes were scored for allele transmission and over 200 spores (>50 4-spore asci) were assayed for PI staining. (C) Wtf4 poison (cyan) and antidote (magenta) protein localization prior to the first meiotic division (left) and in a mature ascus (right). Scale bar represents three microns. TL, transmitted light.
Figure 5—figure supplement 1
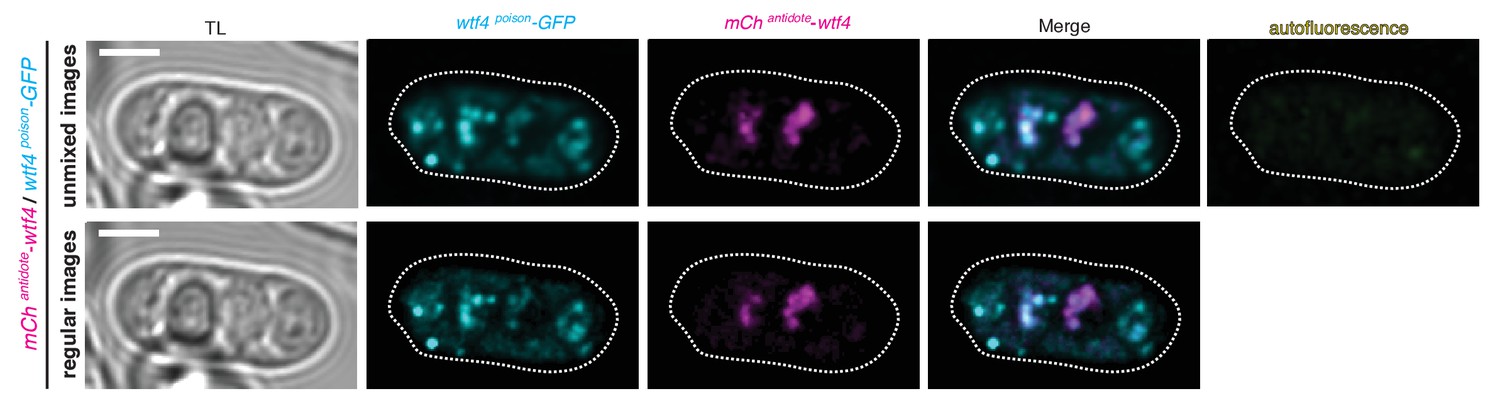
Spectral unmixing verifies true signal.
Wtf4 poison (cyan) and antidote (magenta) protein localization in a mature ascus processed using linear unmixing [top] and unprocessed [bottom]. Scale bar represents three microns.
Additional files
-
Supplementary file 1
Raw data of allele transmission from Figures 2–5.
Each horizontal entry represents the relevant genotype and allele transmission of the indicated diploids. The first column represents the diploid number, which matches the numbers shown in Figures 2–5. In columns 2–5, the two haploid parent strains (SZY#s) are indicated as are the alleles contributed by those parent strains at the experimental locus monitored for drive. Alleles derived from Sp are green whereas those from Sk are purple. For diploids 11–15, transmission of the wtf4 locus was followed using alleles of ura4, which is fortuitously closely linked to wtf4. Columns 9 and 10 indicate which phenotypes were followed at the drive loci and the number of progeny that displayed each phenotype. Some progeny inherited both alleles at a given drive locus and when the markers were codominant we could detect those disomes. The number of those disomes, which are likely heterozygous diploids or aneuploids, are shown in column 11 and their overall frequency is shown in column 12. If we did not have codominant markers, columns 11 and 12 are filled with ---. Column 13 is a measure of meiotic drive. It shows the fraction of the non-disomic progeny that inherited allele 1 (column 3). Column 14 shows the total number of progeny assayed for each diploid and column 15 is the p value calculated from a G-test comparing the allele transmission of allele 1 to a control. Diploid 13 served as the control for diploids 11, 12, 14 and 15. Diploid 16 served as the control for the rest of the diploids. Columns 6–8 are internal controls for each diploid. These controls represent an additional heterozygous locus unlinked to the meiotic drive locus that should undergo Mendelian allele transmission. The lys locus is lys4, the ade locus is ade6, and the ura locus is ura4. The final column indicates the number of independently generated diploids that were tested for each genotype.
- https://doi.org/10.7554/eLife.26033.014
-
Supplementary file 2
Raw data for PI-staining phenotypes from Figures 2–5.
Each horizontal entry represents the relevant genotype and allele transmission of the indicated diploids. The first column represents the diploid number, which matches the numbers shown in Figures 2–5. In columns 2–5, the two haploid parent strains (SZY#s) are indicated as are the alleles contributed by those parent strains at the experimental locus monitored for drive. Alleles derived from Sp are green whereas those from Sk are purple. Columns 6 and 7 indicate the number of spores that stained with PI (dead spores) and those that did not (likely living spores) and column 8 shows the percentage of spores that did not stain with PI. Column 9 shows the number of stained asci that were scored for each diploid type. Spores not contained within 4-spore asci were not scored. Column 10 shows the p value from a G test comparing the number of stained and unstained spores for each diploid to a control diploid. Diploid 13 served as a control for diploids 11, 12, 14 and 15. Diploid 16 served as a control for all other diploids. The number of independently generated diploid strains that were tested is indicated in the last column.
- https://doi.org/10.7554/eLife.26033.015
-
Supplementary file 3
Yeast strains.
- https://doi.org/10.7554/eLife.26033.016
-
Supplementary file 4
Plasmids.
- https://doi.org/10.7554/eLife.26033.017
-
Supplementary file 5
Oligos.
- https://doi.org/10.7554/eLife.26033.018
Download links
A two-part list of links to download the article, or parts of the article, in various formats.
Downloads (link to download the article as PDF)
Open citations (links to open the citations from this article in various online reference manager services)
Cite this article (links to download the citations from this article in formats compatible with various reference manager tools)
wtf genes are prolific dual poison-antidote meiotic drivers
eLife 6:e26033.
https://doi.org/10.7554/eLife.26033


