SOXF factors regulate murine satellite cell self-renewal and function through inhibition of β-catenin activity
- INSERM U955-E10, France
- Faculté de Medecine, France
- Ecole Nationale Veterinaire d'Alfort, France
- Sorbonne Université, INSERM U974, Center for Research in Myology, France
- King's College London, United Kingdom
- Etablissement Français du Sang, France
- Centre de Référence des Maladies Neuromusculaires GNMH, France
Figures
Figure 1 with 1 supplement

SoxF genes are induced at onset of satellite cell emergence and regulate adult myogenesis.
(A,B) Expression levels of SoxF genes (Sox7, Sox17, Sox18) in FACS-isolated Pax3GFP/+ cells from Affymetrix expression analysis (A) and RT-qPCR (B). E, Embryonic day; P, Postnatal day; MO, age in months. (C) Representative immunolabeling of a satellite cell (PAX7+) co-expressing SOX17 on a freshly isolated adult myofiber (T0). Scale bar, 10 μm. Nuclei are counterstained with DAPI. (D) Expression profile of fresh FACS-sorted and cultured satellite cells for quiescence (Pax7), activation/commitment (Myod, Myog), proliferation (Ki67), terminal differentiation (Myh1), and for SoxF (Sox7, Sox17, Sox18) transcripts. Quiesc., quiescence; Prolif., proliferation; Diff., differentiation conditions. n = 3 mice (each quantified in triplicate) for all experiments. Data expressed as mean ± s.e.m.
Figure 1—figure supplement 1
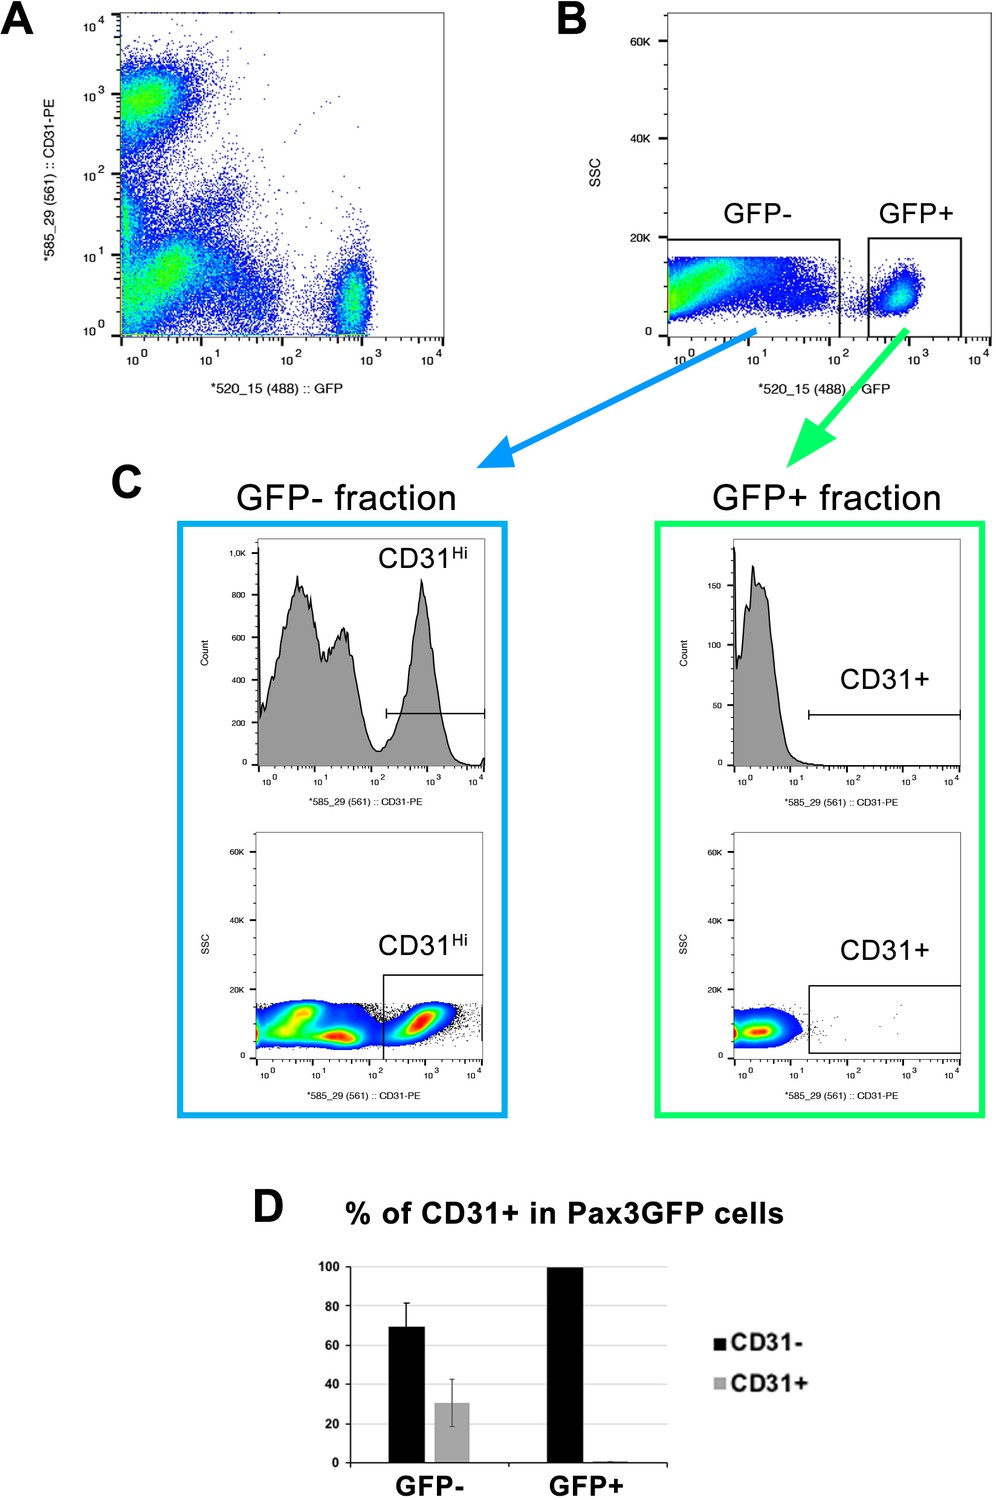
Minimal CD31+ cell contamination in FACS-isolated skeletal muscle stem cells.
Pax3GFP/+ trunk muscles from adult mice were digested in a solution of collagenase/dispase, filtered, and immunolabeled for the endothelial cell marker CD31-PE (Phycoerythrin fluorochrome) before FACS. (A) Gating for CD31-PE/GFP. (B) Gating for single cell (SSC-side scatter)/GFP. (C) Histograms and gating for cell number/CD31+ cells in GFP- and GFP+ cell fractions. (D) Graphic illustrating the proportion of CD31+ cells. n = 3. Data expressed as mean ± s.e.m.
Figure 2 with 1 supplement
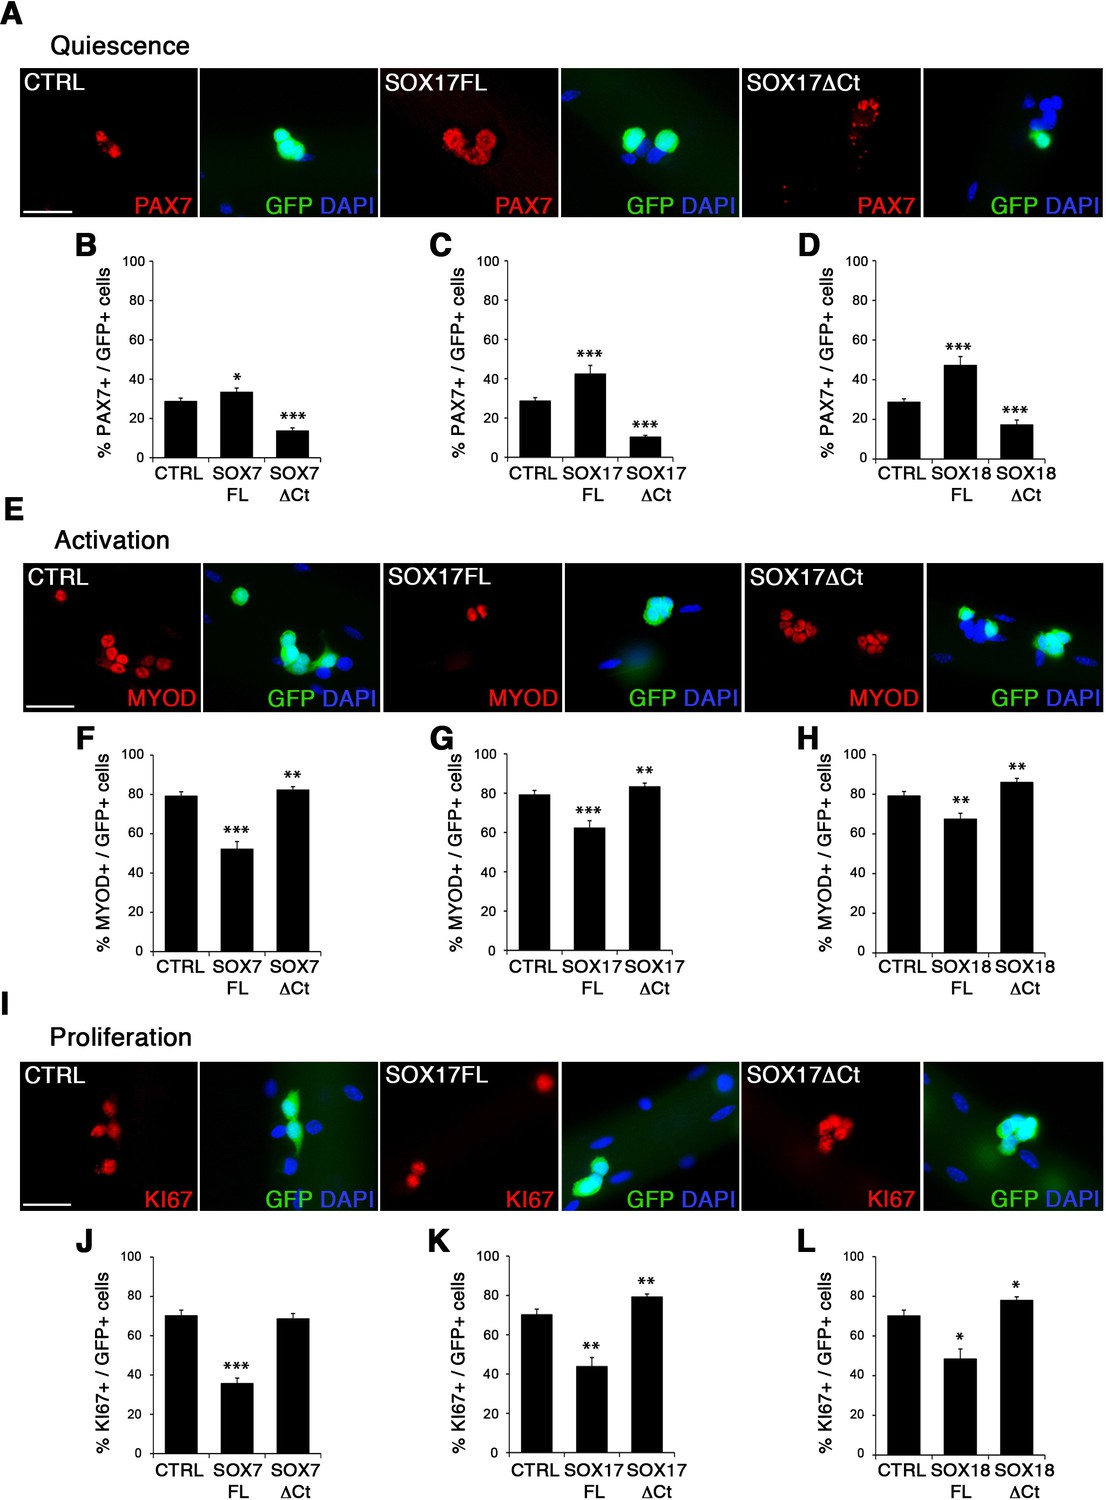
SOXF factors modulate satellite cell behavior.
(A–E–I) Immunofluorescence of satellite cells transduced with SOXF-encoding retroviruses after 72 hr in culture on isolated adult wild type EDL myofibers. SOXF-FL, construct overexpressing SOXF; SOXFΔCt, altered construct lacking the C-terminus (preserving the HMG DNA binding domain); CTRL, encoding just eGFP. GFP marks transduced cells. Nuclei are counterstained with DAPI (blue). Scale bars, 20 μm. (B–D, F–H, J–L) Quantification of the transduced satellite cells illustrated in (A–E–I) for quiescence (PAX7), activation (MYOD), and proliferation (KI67), compared to CTRL. n ≥ 50 fibers/EDL per condition; ≥1000 satellite cells/EDL. Data expressed as mean ± s.e.m., statistically analyzed with Student’s unpaired t-test: *, p<0.05; **, p<0.01; ***, p<0.001, compared to CTRL.
Figure 2—figure supplement 1
SoxF gene function in satellite cell homeostasis.
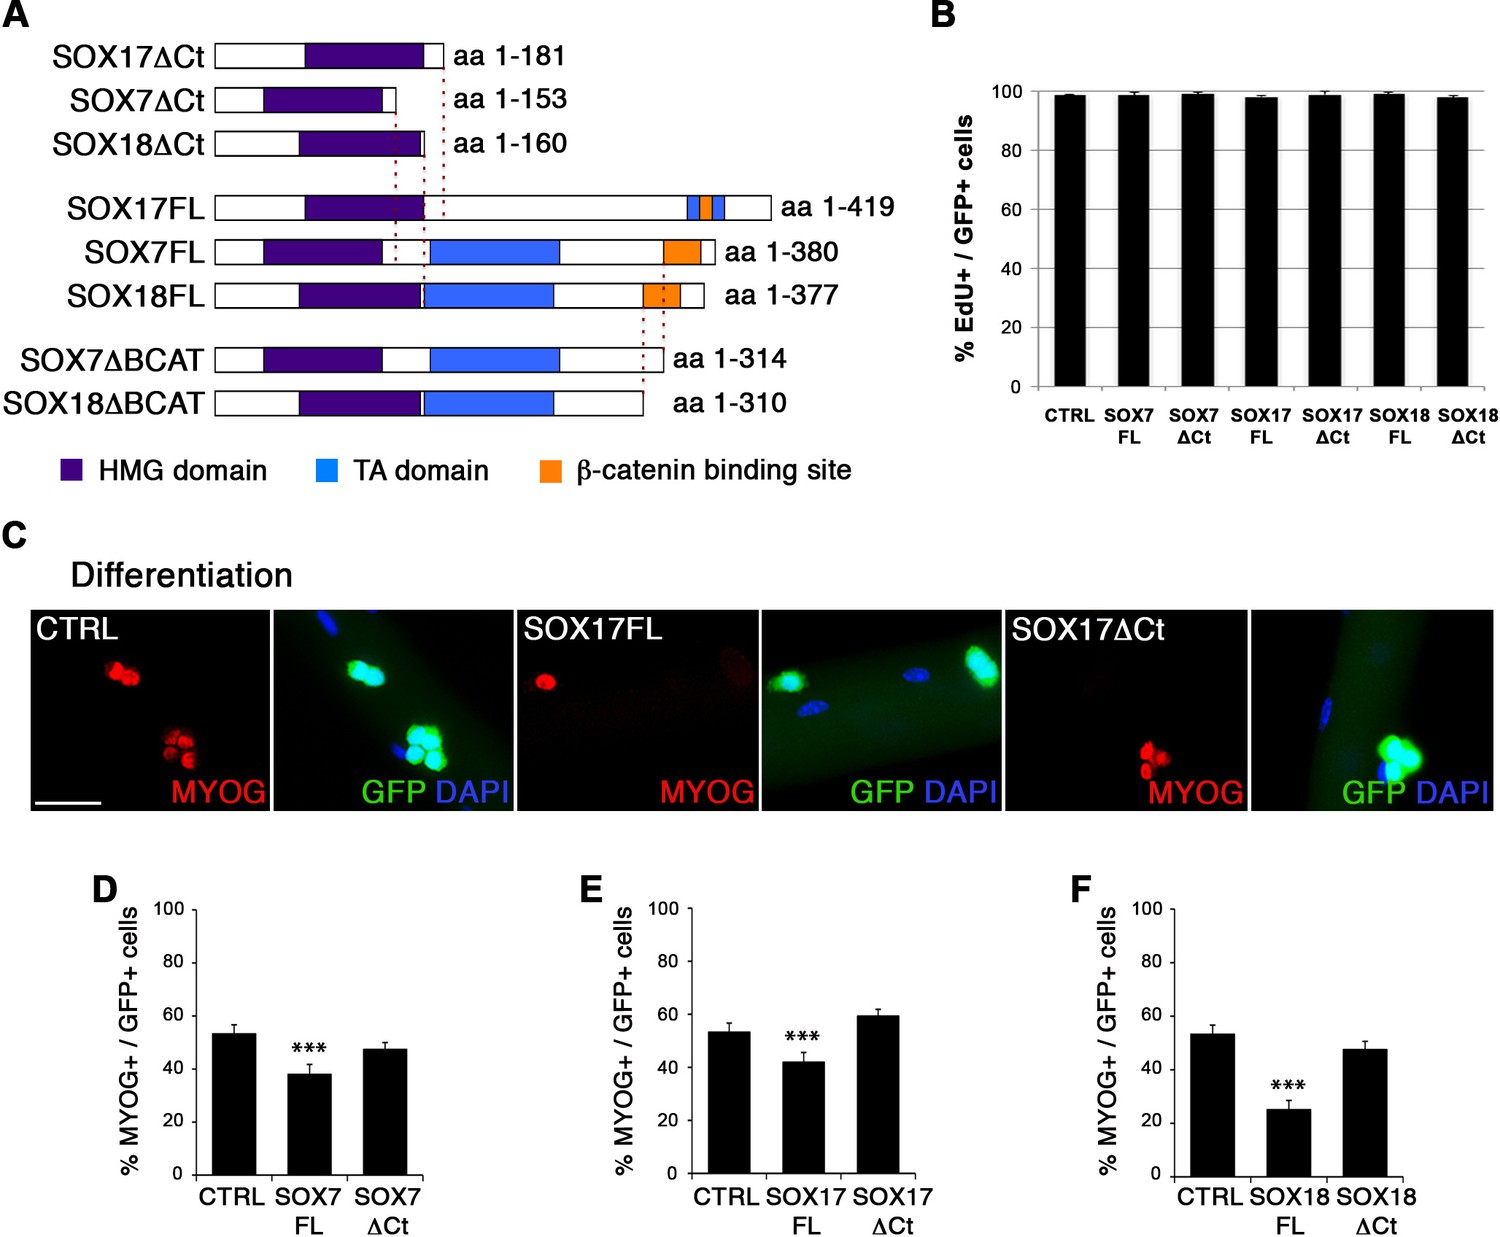
(A) Protein structure of SOXF constructs. SOXF-FL refers to full-length protein; SOXFΔCt to C-terminal deletion of the protein retaining only the DNA binding site (HMG domain); and SOXFΔBCAT to deletion of the β-catenin binding site, conserving the HMG and transactivation (TA) domains of the protein. aa, amino acids. (B) Quantification of transduced satellite cells on myofibers with SOXF-FL and SOXFΔCt-encoding retroviruses, after 48 hr in culture, treated with EdU for 72 hr. (C) Representative images of satellite cells on myofibers overexpressing SOX17 (SOX17FL) or the mutant SOX17ΔCt, after 72 hr in culture (T72). Scale bar, 20 μm. CTRL, retrovirus econding just eGFP. GFP indicates transduced cells. Nuclei are counterstained with DAPI (blue). (D–F) Quantification of the transduced satellite cells illustrated in (C) showing the effects on differentiation (MYOG; myogenin). n ≥ 50 fibers/EDL per condition; ≥1000 satellite cells/EDL. Data expressed as mean ± s.e.m., statistically analyzed with Student’s unpaired t-test: ***, p<0.001, compared to CTRL.
Figure 3 with 2 supplements
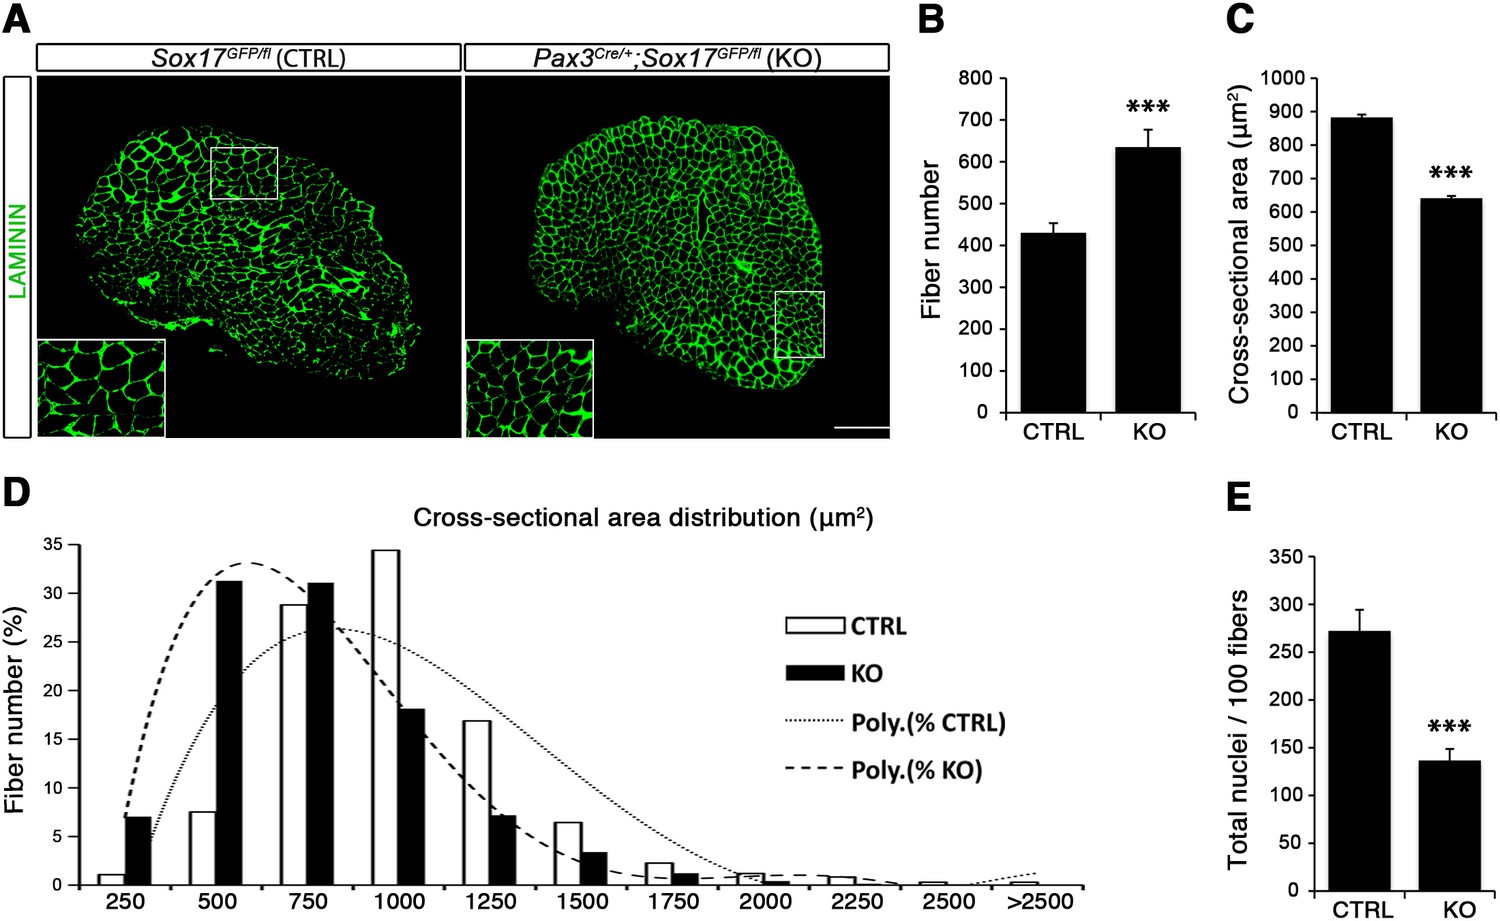
Sox17-knockout during prenatal establishment of satellite cells modifies adult myofiber content and morphology.
(A) Representative Soleus muscle cryosection images of adult control and Sox17 mutant mice. Immunofluorescence was performed with LAMININ to identify the myofibers. Higher magnification is shown in the boxed area. Scale bar, 200 µm. (B–C) Quantification of myofiber number (B) and cross-sectional area in µm2 (C). (D) Distribution of the cross-sectional myofiber area in µm2. ‘Poly.’, polynomial curve fitting the distribution of myofiber size. (E) Quantification of myonuclei number per 100 fibers in adult Soleus cross-sections from control and Sox17-knockout mice. CTRL, Sox17GFP/fl; KO, Pax3Cre/+;Sox17GFP/fl. n ≥ 4 mice (each quantified in triplicate) for all experiments. Data expressed as mean ± s.e.m., statistically analyzed with Student’s unpaired t-test: ***, p<0.001, compared to CTRL.
Figure 3—figure supplement 1
Muscle characterization in control and Sox17-knockout mice.
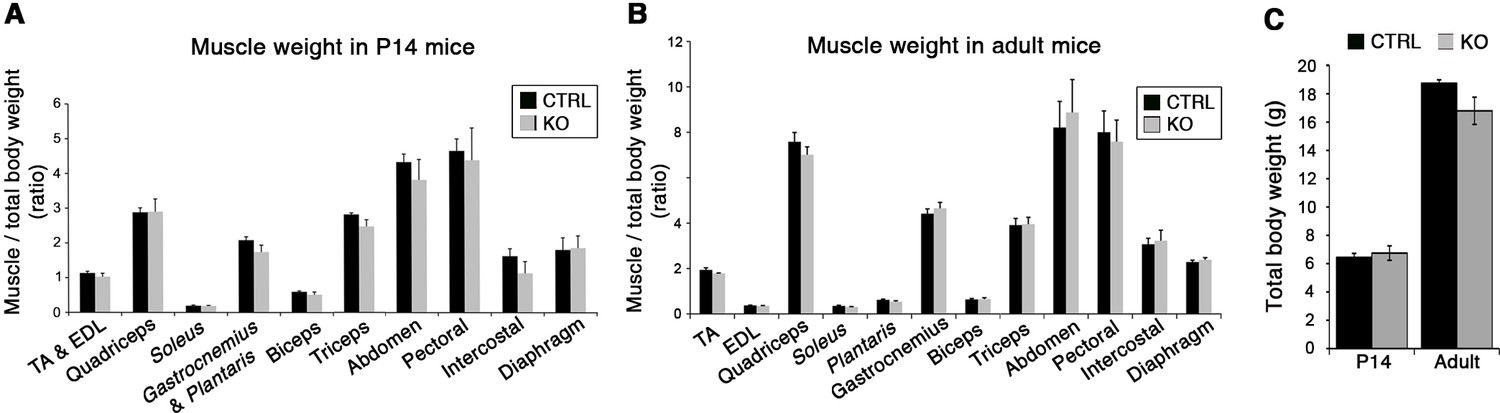
(A–C) Relative weight of different muscles (muscle weight/total body weight) in two-week-old (P14) (A) and two-month-old adult (B) male mice, and total body weight in grams (C). TA, Tibialis anterior, EDL; Extensor digitorum longus. CTRL, Sox17GFP/fl; KO, Pax3Cre/+;Sox17GFP/fl. n ≥ 4 mice (each quantified in triplicate) for all experiments. Data expressed as mean ± s.e.m., statistically analyzed with Student’s unpaired t-test: *, p<0.05; **, p<0.01; ***, p<0.001, compared to CTRL.
Figure 3—figure supplement 2
Muscle characterization in control and Sox17-conditional knockout mice.
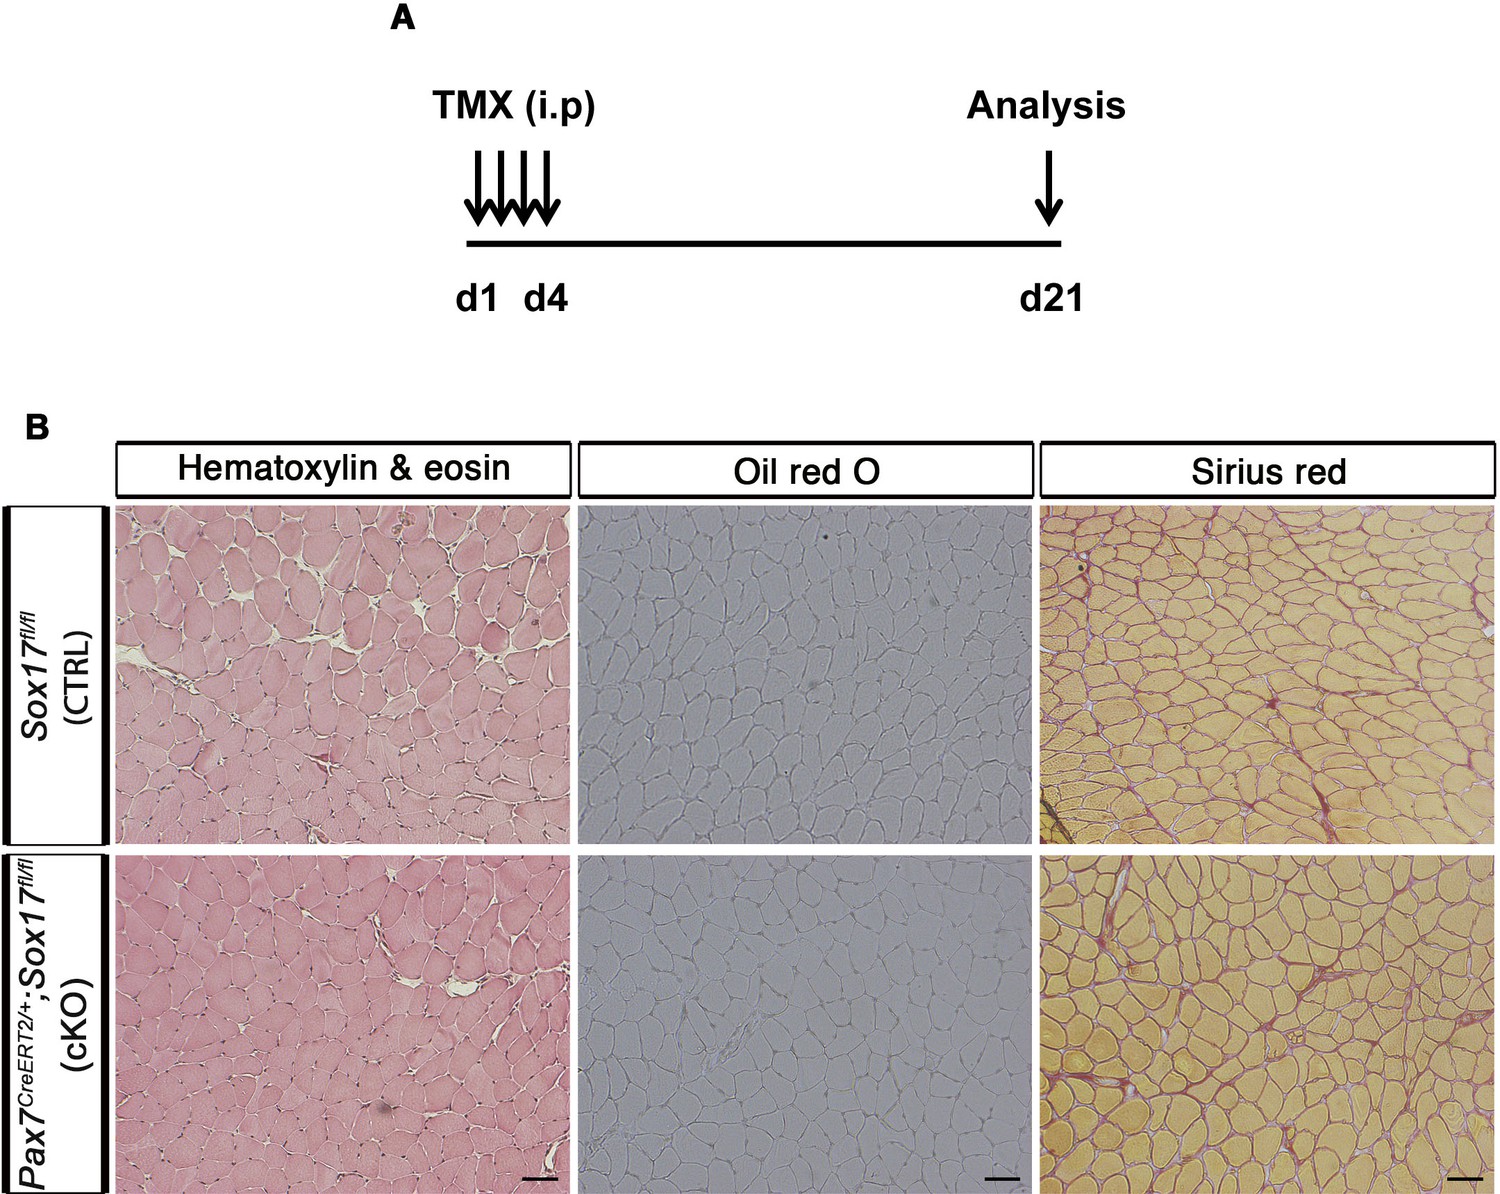
(A) Schematic outline of the experimental procedure for tamoxifen (TMX) injection (i.p., intraperitoneal). d, days. (B) Representative images of the histological characterization from adult resting Soleus muscles at d21 after TMX treatment: Hematoxylin and eosin (left panel), Oil red O (middle panel), and Sirius red (left panel) staining. Scale bars, 100 μm. CTRL, Sox17fl/fl; cKO, Pax7CreERT2/+;Sox17fl/fl. n ≥ 3 mice.
Figure 4 with 1 supplement
SOX17 is necessary to maintain satellite cell quiescence in adult muscles.
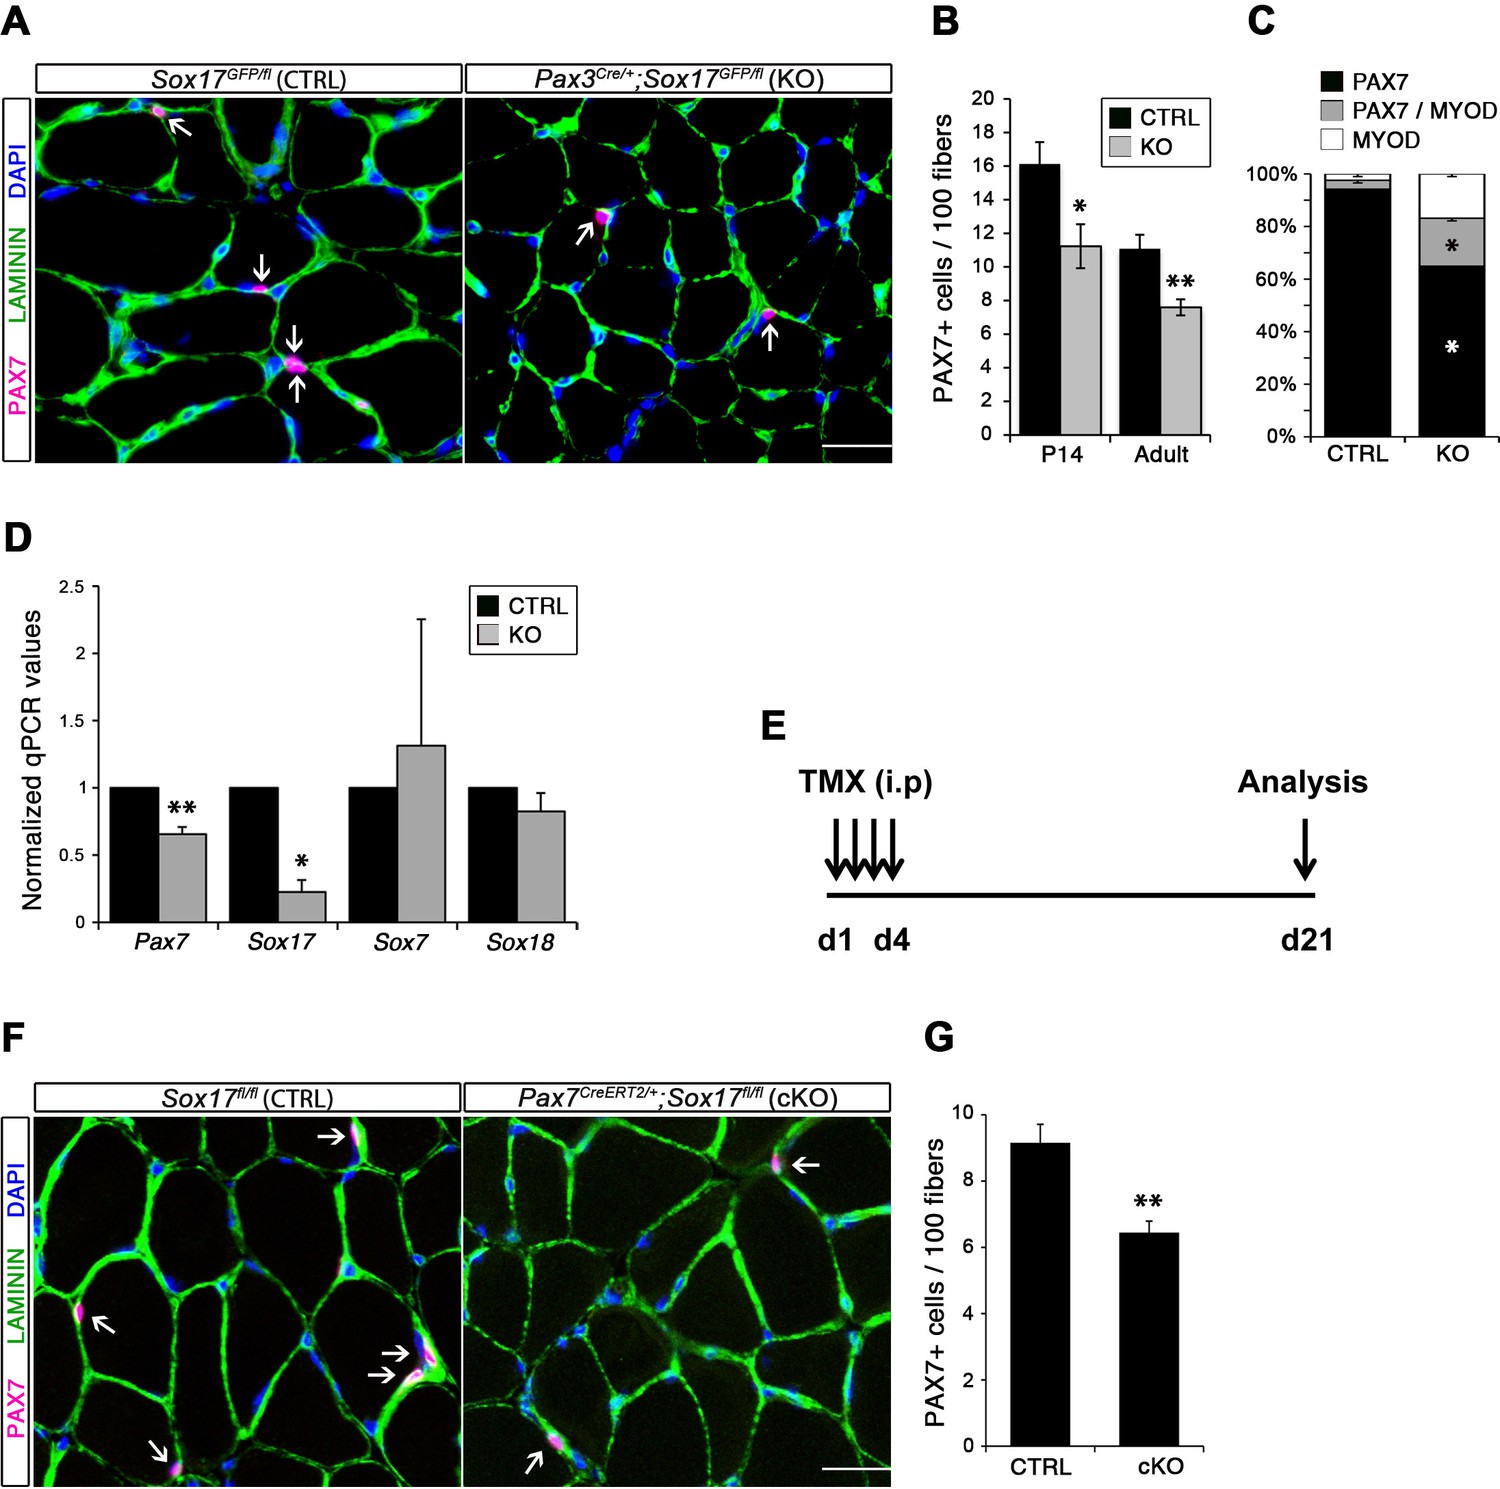
(A,F) Representative Soleus cryosection images showing immunofluorescence for satellite cells (PAX7+, arrows) in Pax3Cre/+;Sox17GFP/fl and Pax7CreERT2/+;Sox17fl/fl mice, with appropriate controls. Scale bars, 25 μm. Fibers are identified by LAMININ and nuclei are counterstained with DAPI. (B,G) Quantification of satellite cell number during postnatal growth (P14) and in adult. (C) Quantification of the ratio PAX7/MYOD+ satellite cells in P14 Soleus cryosections. (D) RT-qPCR analysis on adult TA muscles for Pax7 and SoxF genes in fresh FACS-isolated satellite cells from control and Sox17-knockout mice. (A–D) CTRL, Sox17GFP/fl; KO, Pax3Cre/+;Sox17GFP/fl. (E) Schematic outline of the experimental procedure for tamoxifen (TMX) injection (i.p., intraperitoneal) in Sox17fl/fl (CTRL) and Pax7CreERT2/+;Sox17fl/fl (cKO) mice. d, days. (E–G) CTRL, Sox17fl/fl; cKO, Pax7CreERT2/+;Sox17fl/fl. Quantification was performed in whole cross-sections. n ≥ 4 mice (each quantified in triplicate) for all experiments. Data expressed as mean ± s.e.m., statistically analyzed with Student’s unpaired t-test: *, p<0.05; **, p<0.01, compared to CTRL.
Figure 4—figure supplement 1

Satellite cells characterization of control and Sox17-knockout mice.
(A) Immunofluorescence of satellite cells (MCAD; M-cadherin) in adult Soleus cryosections from control and Sox17 mutant mice. Scale bar, 25 μm. (B) Quantification of satellite cell number illustrated in (A). CTRL, Sox17GFP/fl; KO, Pax3Cre/+;Sox17GFP/fl. n ≥ 4 mice (each quantified in triplicate) for all experiments. Data expressed as mean ± s.e.m., statistically analyzed with Student’s unpaired t-test: *, p<0.05, compared to CTRL.
Figure 5 with 2 supplements
SOX17 regulates adult muscle regeneration after injury in Pax3Cre/+;Sox17GFP/fl mutant mice.
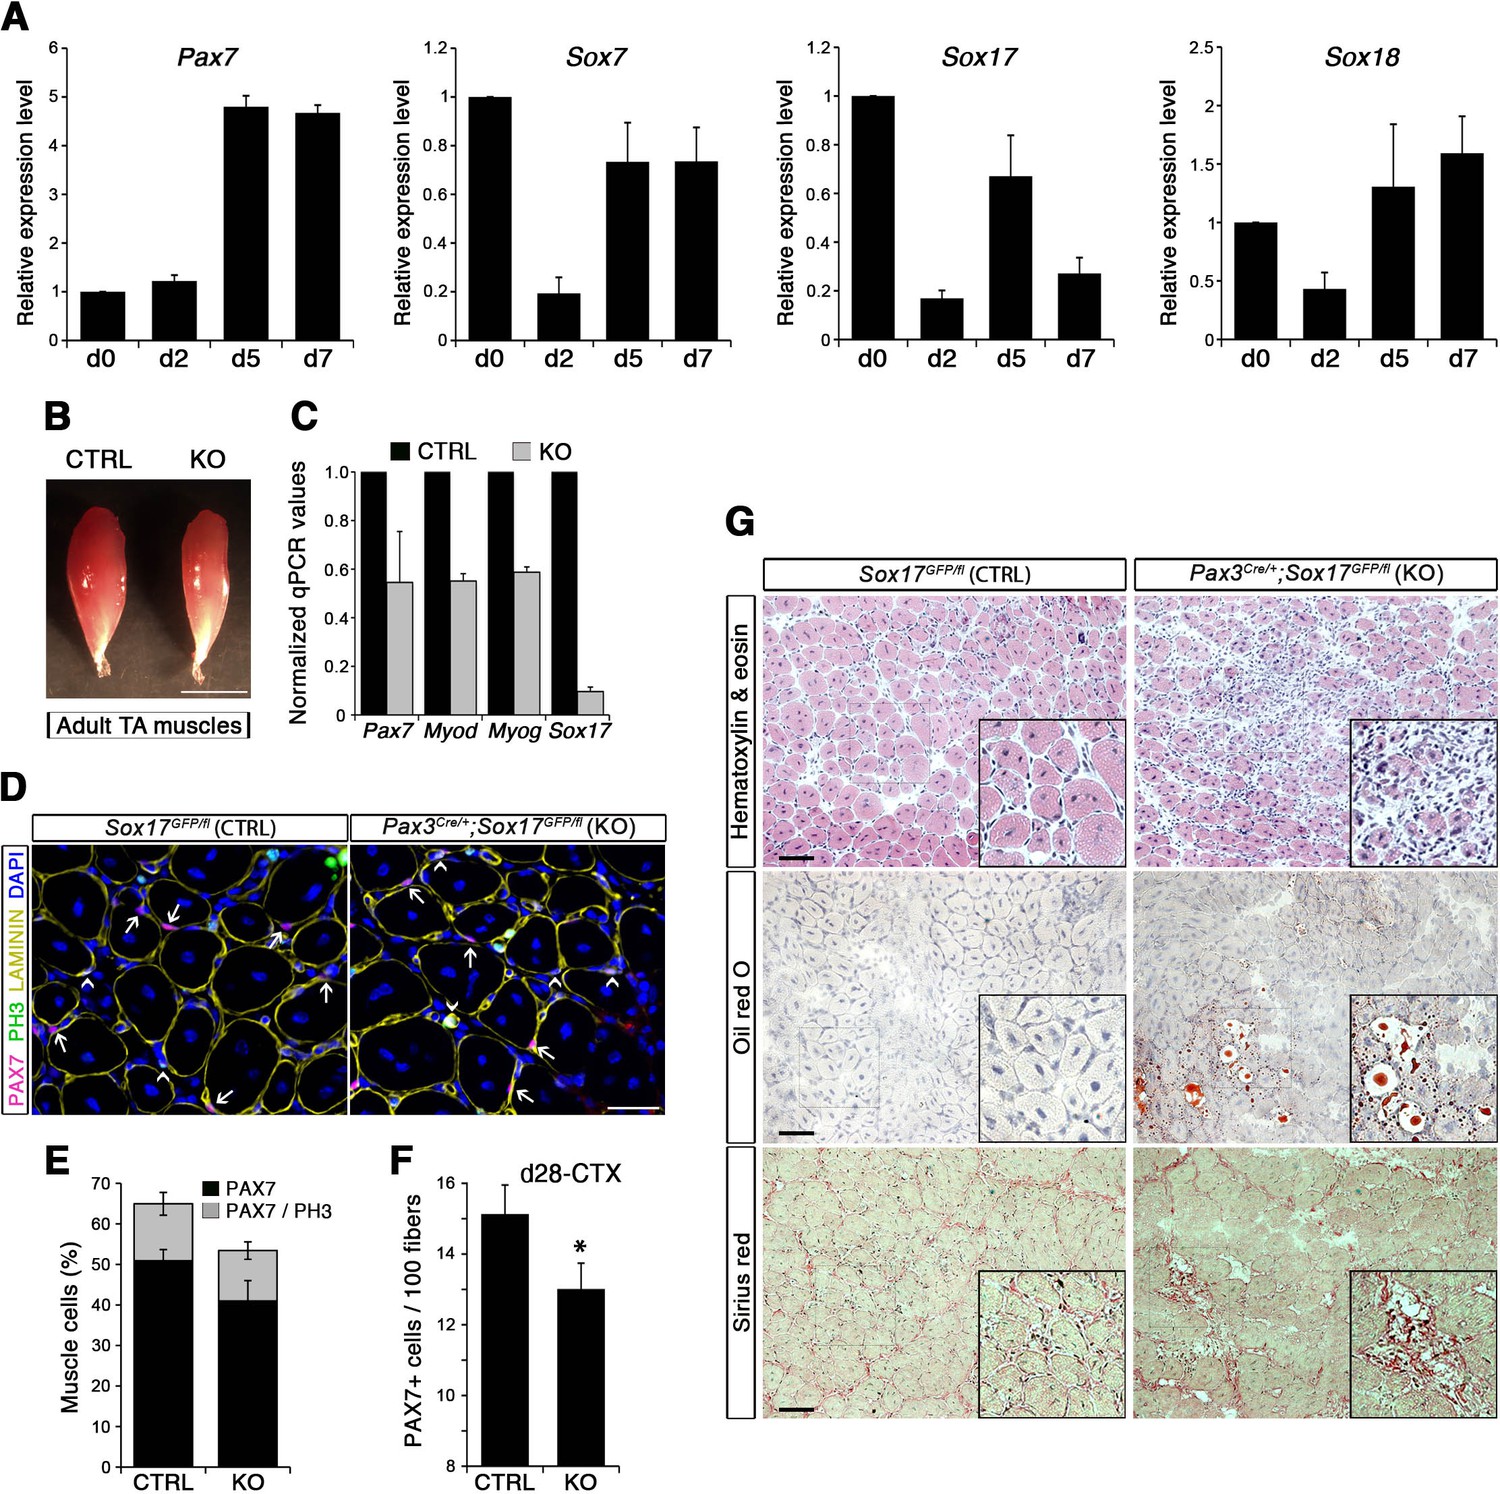
(A) RT-qPCR analysis of Pax7 and SoxF genes in satellite cells isolated during CTX-induced regeneration in adult wild type TA muscles. d; days post-injury. (B) Representative images of TA muscles 10 days after CTX injection. Scale bar, 5 mm. (C) RT-qPCR of muscle markers 10 days after CTX injection. (D) Representative images of cryosections from regenerating adult TA muscles seven days after injury showing immunofluorescence for PAX7+ cells (quiescent; arrows) and PH3+PAX7+ cells (proliferating, arrowheads). Scale bar, 25 μm. (E) Quantification of satellite cells as illustrated in (D). (F) Quantification of satellite cells (PAX7+) by the end of the regeneration process (d28-CTX). (G) Representative images of the histological characterization of adult TA muscles seven days after injury with Hematoxylin and eosin (cell infiltration; upper panel), Oil red O (fat infiltration; middle panel), and Sirius red (fibrosis; bottom panel) staining. Insets: enlargement of the indicated regions. Scale bars, 100 μm. CTRL, Sox17GFP/fl; KO, Pax3Cre/+;Sox17GFP/fl. n ≥ 3 mice (each quantified in triplicate) for all experiments. Data expressed as mean ± s.e.m., statistically analyzed with Student’s unpaired t-test: *, p<0.05, compared to CTRL.
Figure 5—figure supplement 1
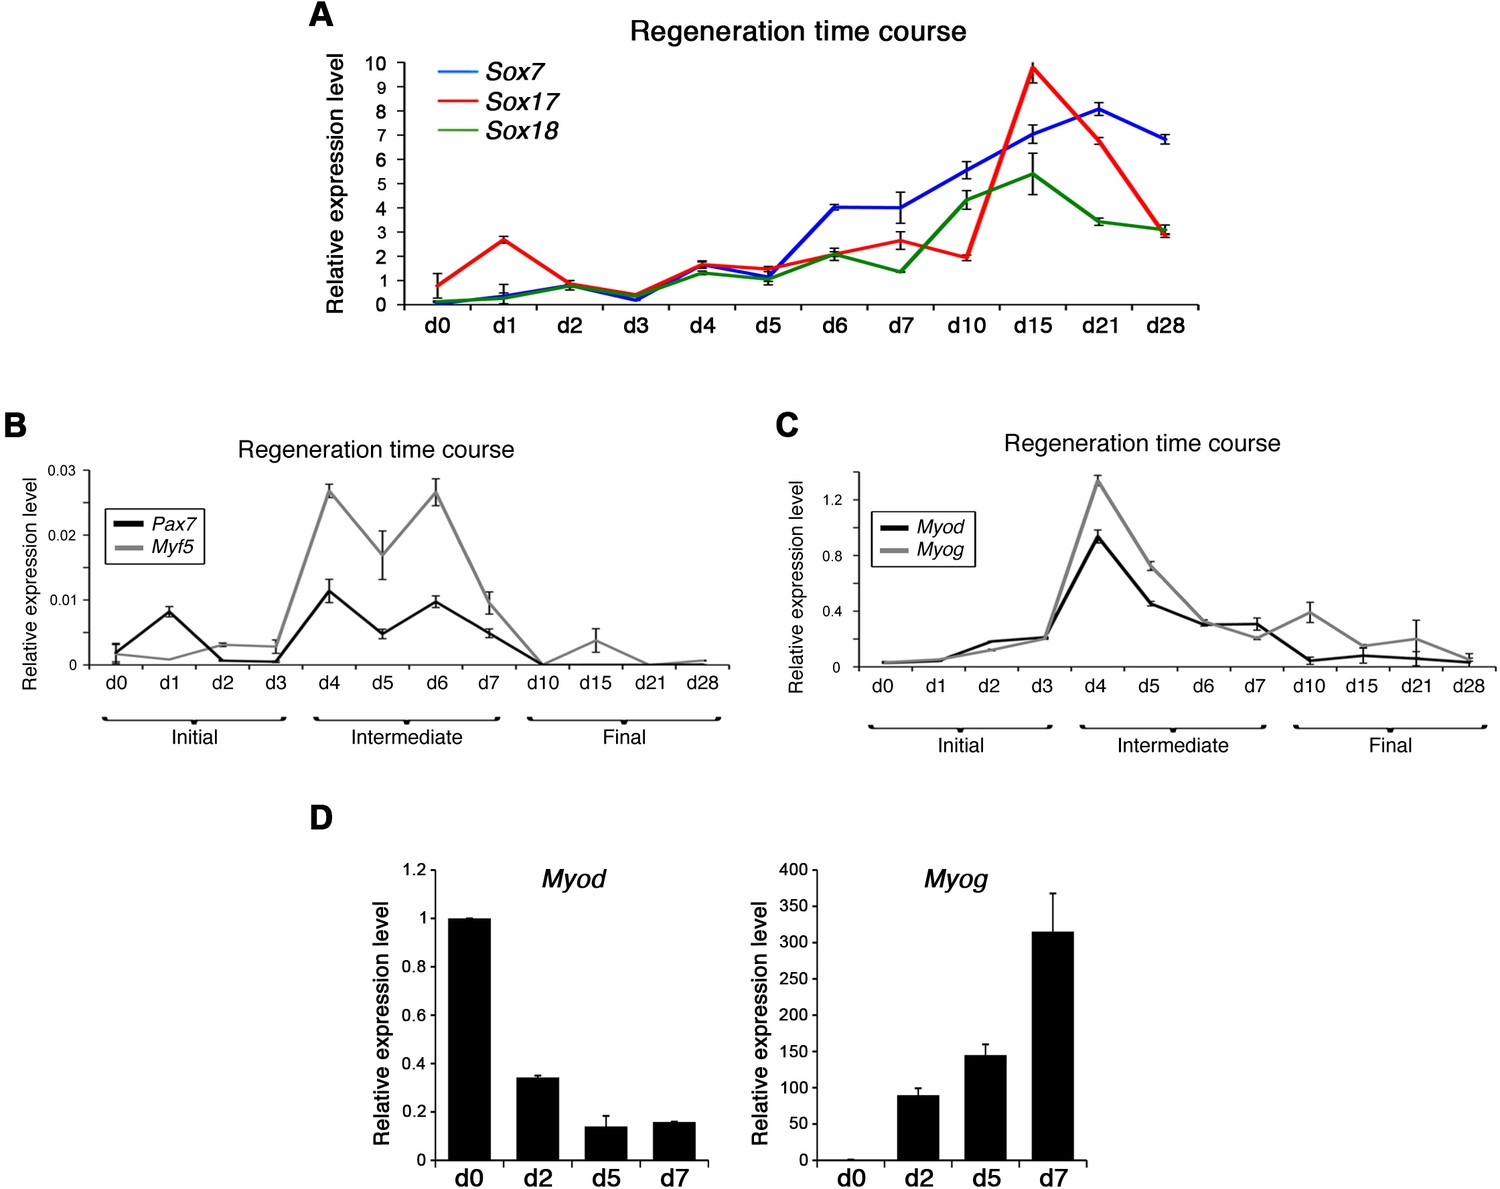
Gene expression profile during CTX-induced regeneration in adult wild type TA muscles and satellite cells.
(A) SoxF transcripts, (B) specific transcripts of satellite cells, and (C) transcripts marking activation and early differentiation profiling of this stem cell population. Total RNA was extracted on days (d) 0–7, 10, 15, 21, and 28 covering initial, intermediate, and final steps of muscle regeneration from whole muscle (A–C) or FACS-isolated satellite cells (d0–d2–d5–d7) (D). n ≥ 3 mice (each quantified in triplicate) for all experiments. Data expressed as mean ± s.e.m.
Figure 5—figure supplement 2
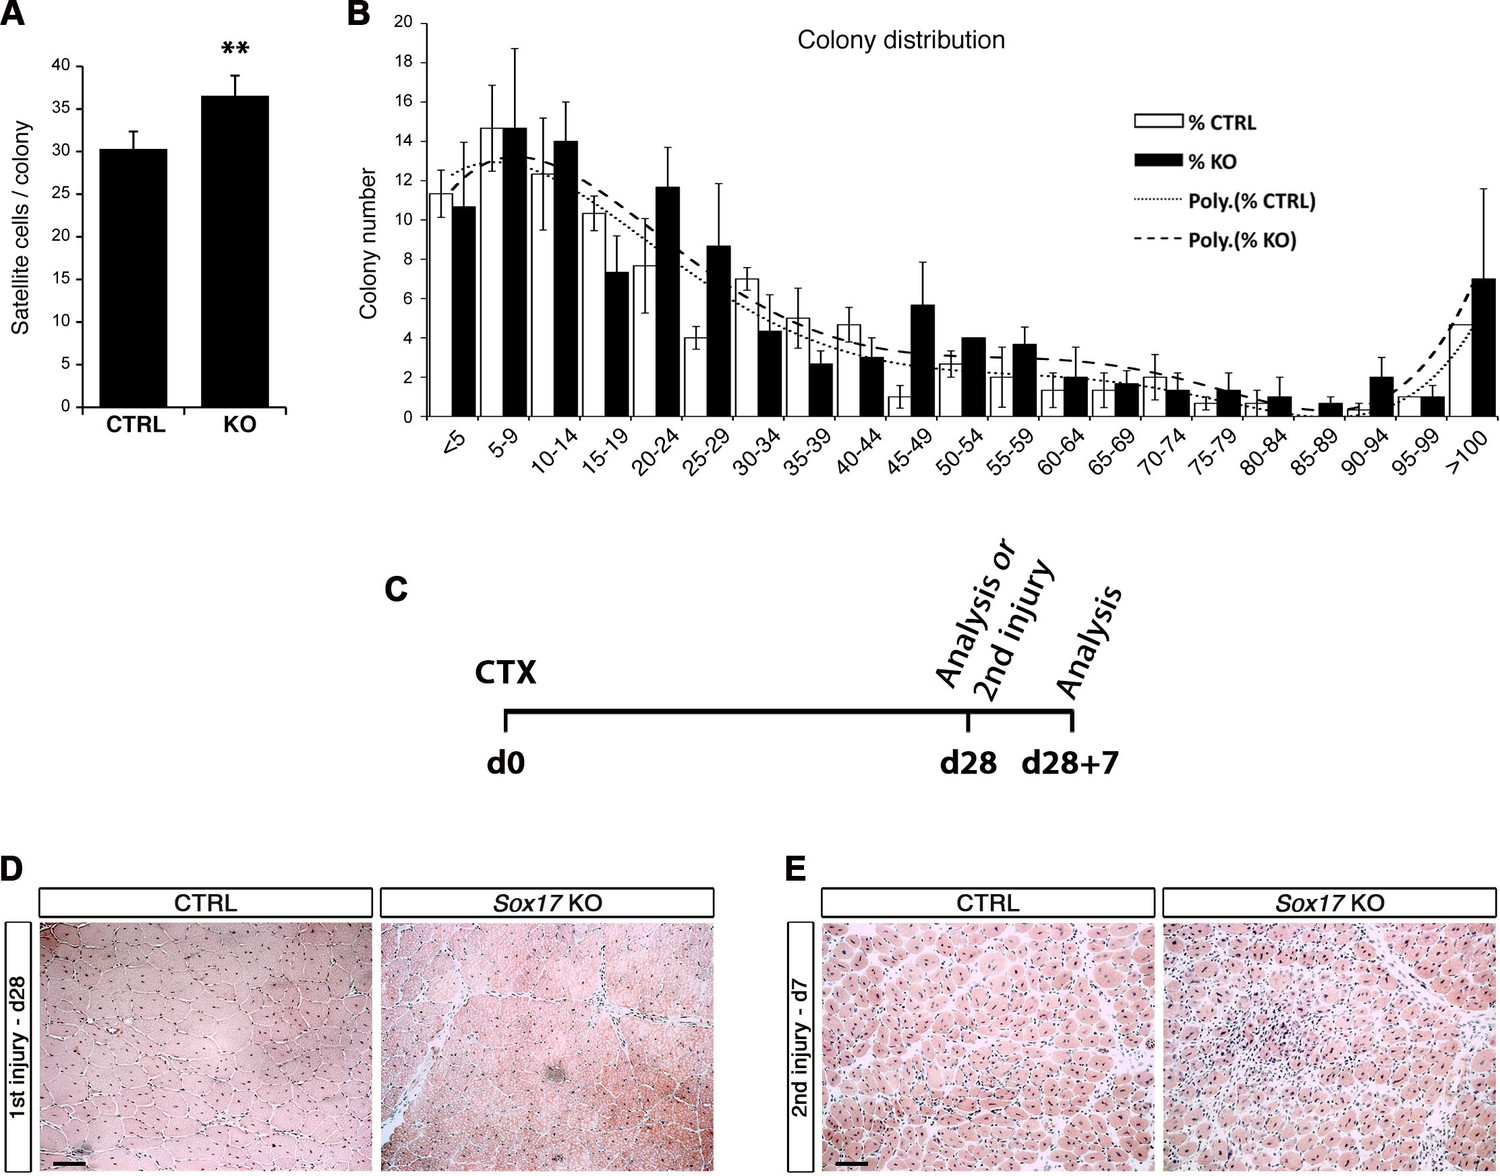
Impaired clonogenic and regenerative potential of Sox17-knockout muscle stem cells.
(A) Quantification of cells per colony in a clonal assay of FACS-isolated satellite cells, from adult control and Sox17-knockout hindlimb muscles, after four days in proliferation conditions. (B) Distribution of the number of colonies of FACS-isolated satellite cells, from adult control and Sox17-knock hindlimb muscles, as in (A). Poly., polynomial curve fitting the distribution of cell colonies. (C) Schematic outline of the experimental procedure. (D–E) Representative images of the Hematoxylin and eosin (cell infiltration) staining of adult TA muscles 28 days after injury (D), and seven days after second injury (E). Scale bars, 100 μm. CTRL, Sox17GFP/fl; KO, Pax3Cre/+;Sox17GFP/fl. n ≥ 3 mice (each in triplicate) for all experiments. Data expressed as mean ± s.e.m., statistically analyzed with Student’s t-test: **, p<0.01, compared to CTRL.
Figure 6
SOX17 regulates adult muscle regeneration after injury in Pax7CreERT2/+;Sox17fl/fl mutant mice.
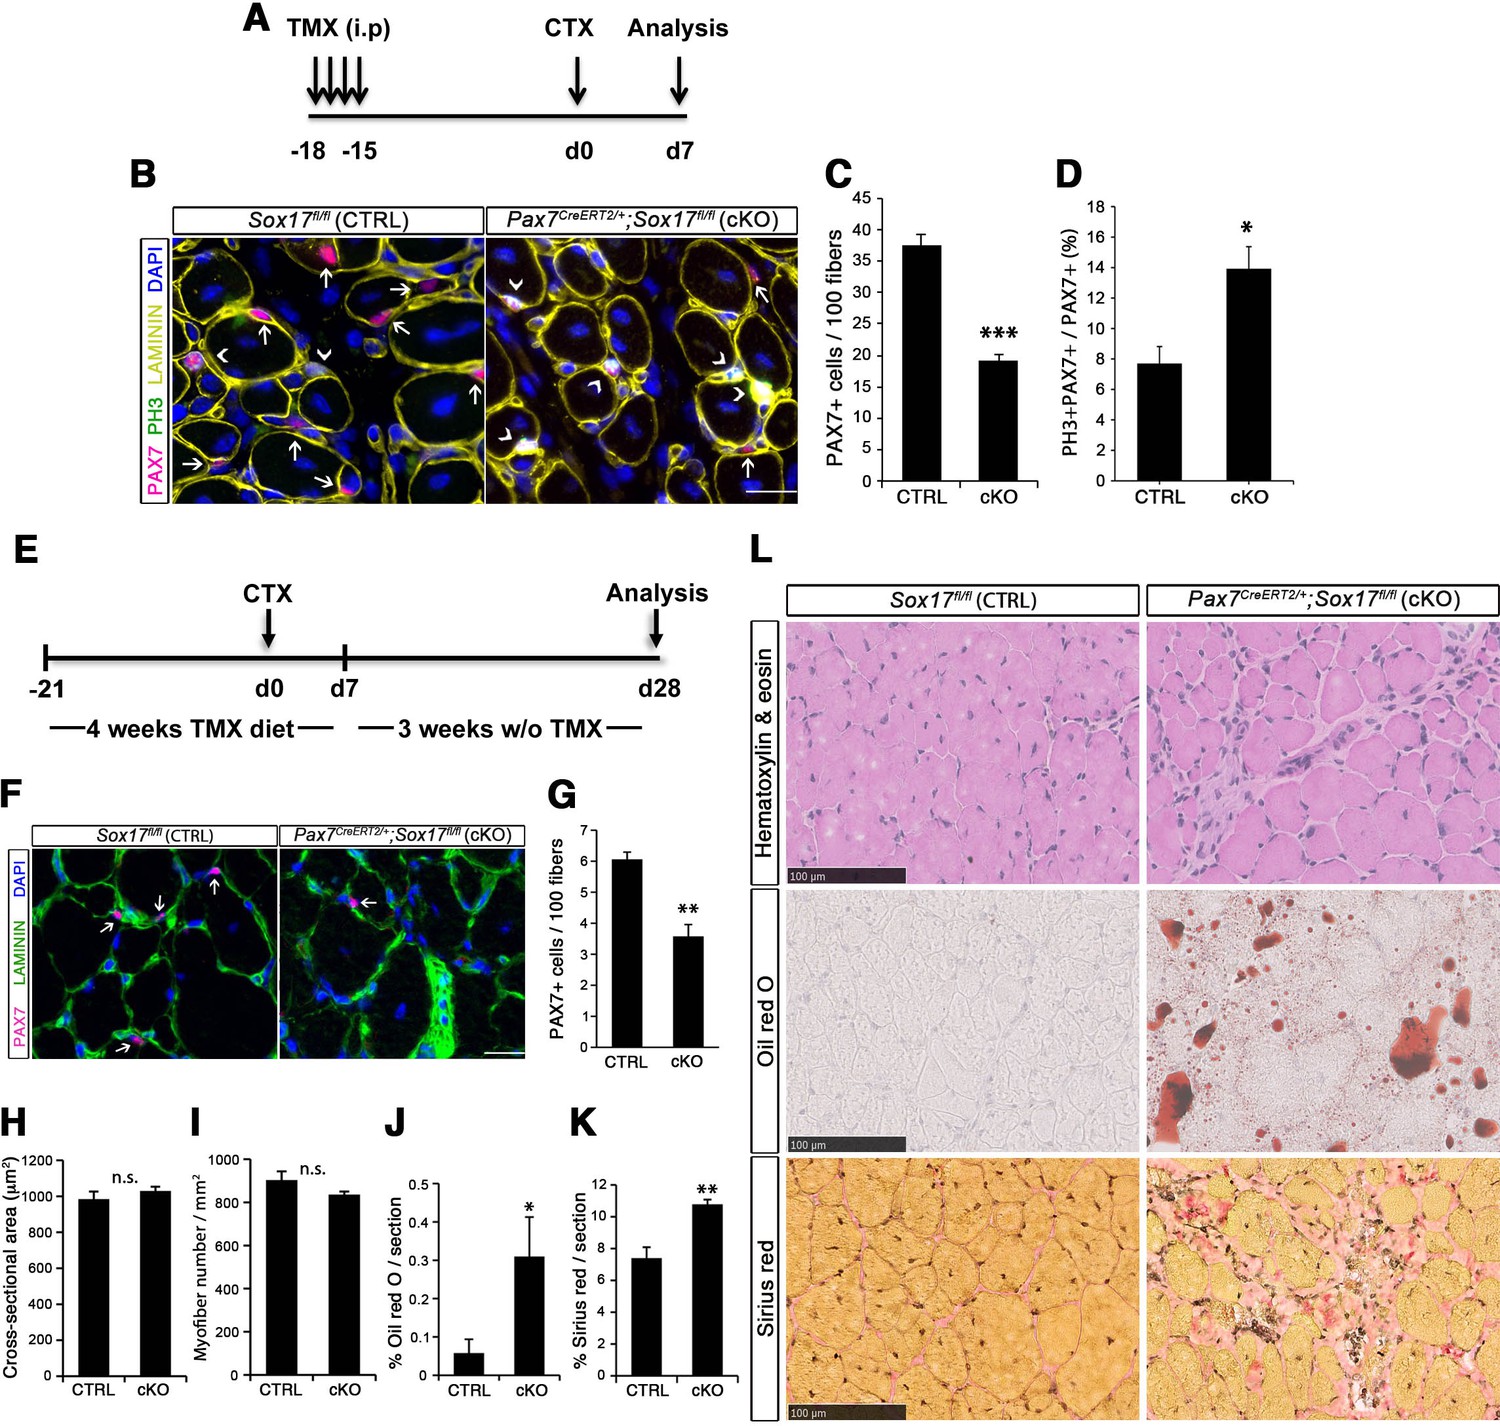
(A) Schematic outline of the experimental procedure for tamoxifen (TMX) injection (i.p., intraperitoneal). CTX, cardiotoxin injection; d, days. (B) Representative images of cryosections from regenerating adult TA muscles d7 after injury, showing immunofluorescence for PAX7+ (quiescent, arrows) and PH3+PAX7+ (proliferating, arrowheads) cells. Scale bar, 25 μm. (C–D) Quantification of satellite cells as illustrated in (B). (E) Schematic outline of the experimental procedure for TMX diet. CTX, cardiotoxin injection; d, days. (F) Representative images of cryosections from regenerating adult TA muscles d28 after injury, showing immunofluorescence for PAX7+ (quiescent, arrows) cells. Scale bar, 25 µm. (G) Quantification of satellite cells as illustrated in (F). (H–I) Quantification of the cross-sectional area in µm2 (H) and myofiber number per mm2 (I). (J–K) Quantification of fat infiltration (Oil red O) (J) and fibrosis (Sirius red) (K) indicated as proportion of the stained section (average of five sections per muscle). (L) Representative images of the histological characterization of adult TA muscles 28 days after injury with Hematoxylin and eosin (cell infiltration; upper panel), Oil red O (fat infiltration; middle panel), and Sirius red (fibrosis; bottom panel) staining. Scale bars, 100 µm. CTRL, Sox17fl/fl; cKO, Pax7CreERT2/+;Sox17fl/fl. n ≥ 3 mice (each quantified at least in triplicate) for all experiments. Data expressed as mean ± s.e.m., statistically analyzed with Student’s unpaired t-test (C,D,G) and Mann-Whitney ranking test (H–K): n.s., not significant; *, p<0.05; **, p<0.01; ***, p<0.001, compared to CTRL.
Figure 7 with 1 supplement
Compensatory effect of SOXF factors in satellite cells on ex vivo culture and in vivo injury-induced regeneration.
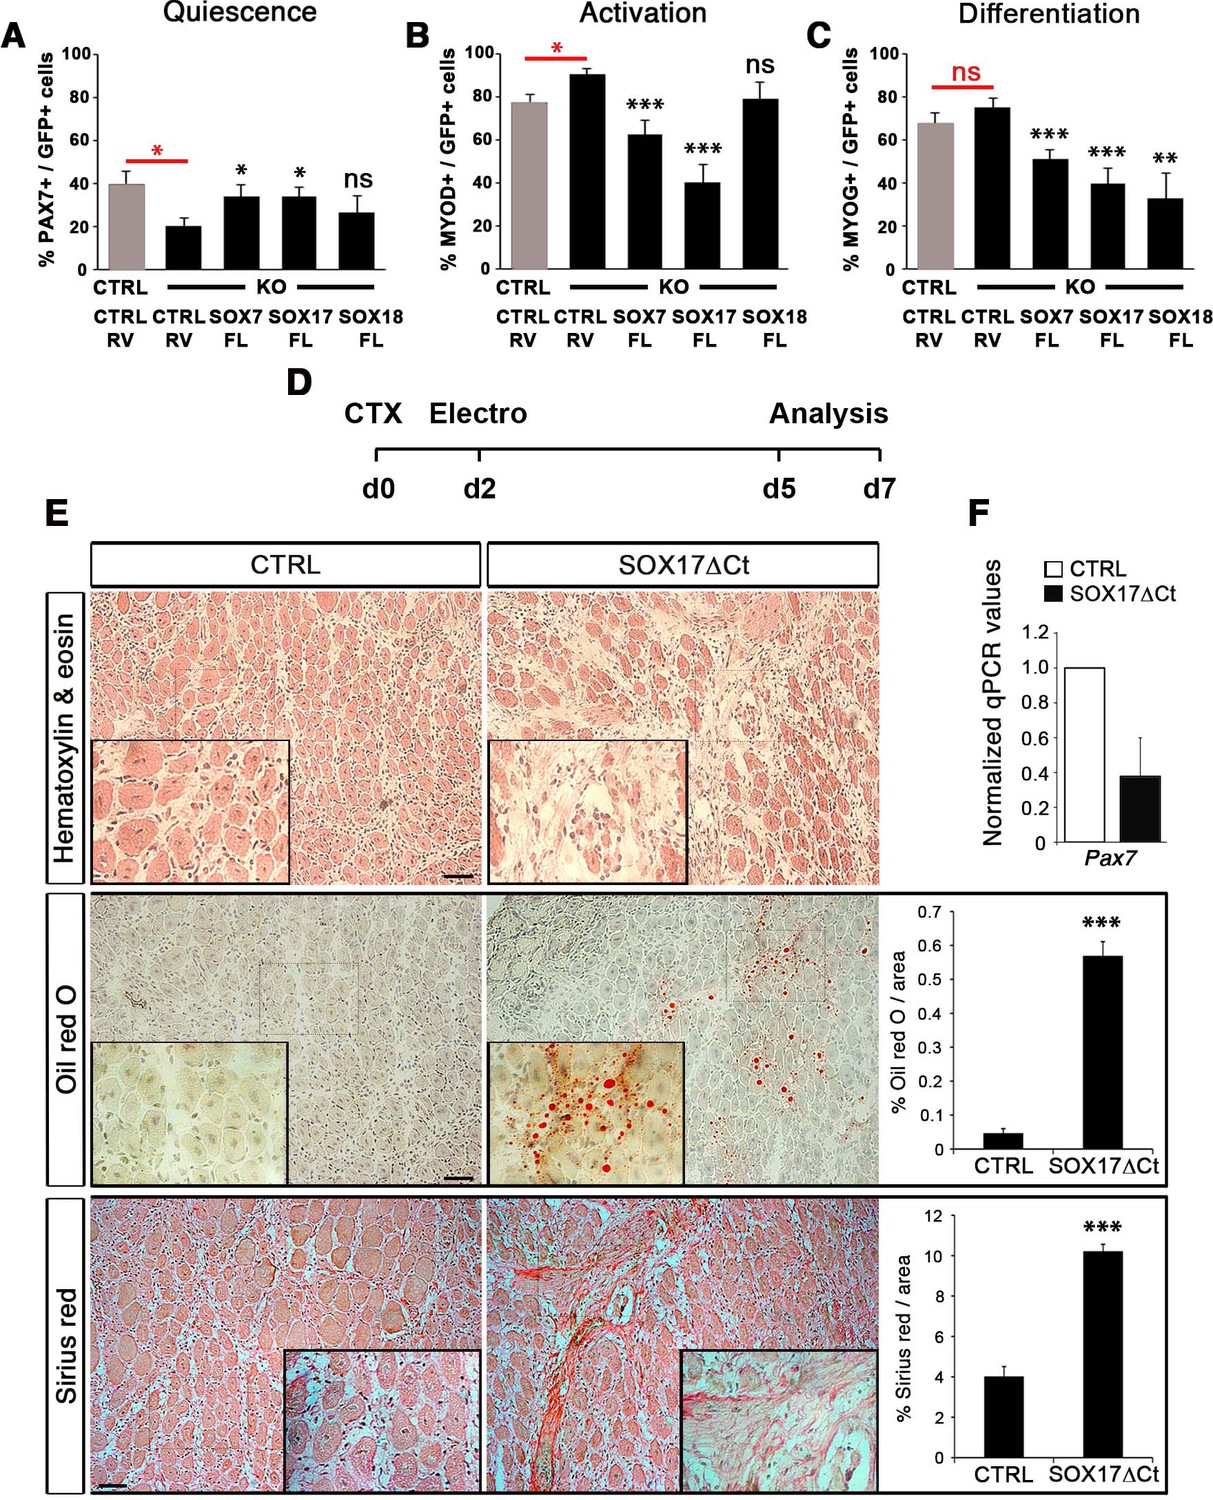
(A–C) Quantification of transduced satellite cells with SOXF-encoding retroviruses after 72 hr in culture on EDL isolated myofibers. Adult control satellite cells were transduced with the eGFP-encoding retrovirus (CTRL-RV) and Sox17-knockout cells with CTRL-RV or SOXF-FL. Quiescence (A; PAX7), activation (B; MYOD), and differentiation (C; MYOG) were measured. In red, CTRL vs. KO comparison; in black, KO transduced with CTRL-RV vs. KO transduced with SOXF-FL. n ≥ 30 fibers/EDL per condition; ≥1000 satellite cells/EDL. CTRL, Sox17GFP/fl; KO, Pax3Cre/+;Sox17GFP/fl. (D) Schematic outline of the experimental procedure for electroporation into regenerating TA muscle of wild type mice. CTX, cardiotoxin; d, days. (E) Histology characterization by Hematoxylin and eosin (cell infiltration, top panel), Oil red O (fat infiltration, middle panel), and Sirius red (fibrosis, bottom panel) staining of cryosections from electroporated wild type adult TA muscles five days after injury. TA muscles were electroporated with control (CTRL, left) or dominant negative SOX17 construct (SOX17ΔCt, right). Insets show enlarged images of the indicated regions. Quantification of fat infiltration (Oil red O) and fibrosis (Sirius red) are indicated as proportion of stained area. Scale bars, 100 μm. (F) RT-qPCR analysis seven days after CTX injection. n ≥ 3 mice (≥ 5 different areas). Data expressed as mean ± s.e.m., statistically analyzed with Student’s unpaired t-test: ns, not significant; *, p<0.05; **, p<0.01; ***, p<0.001, compared to CTRL-RV in CTRL (red asterisks in A-C), CTRL-RV in KO (black asterisks in A-C) or CTRL (E).
Figure 7—figure supplement 1
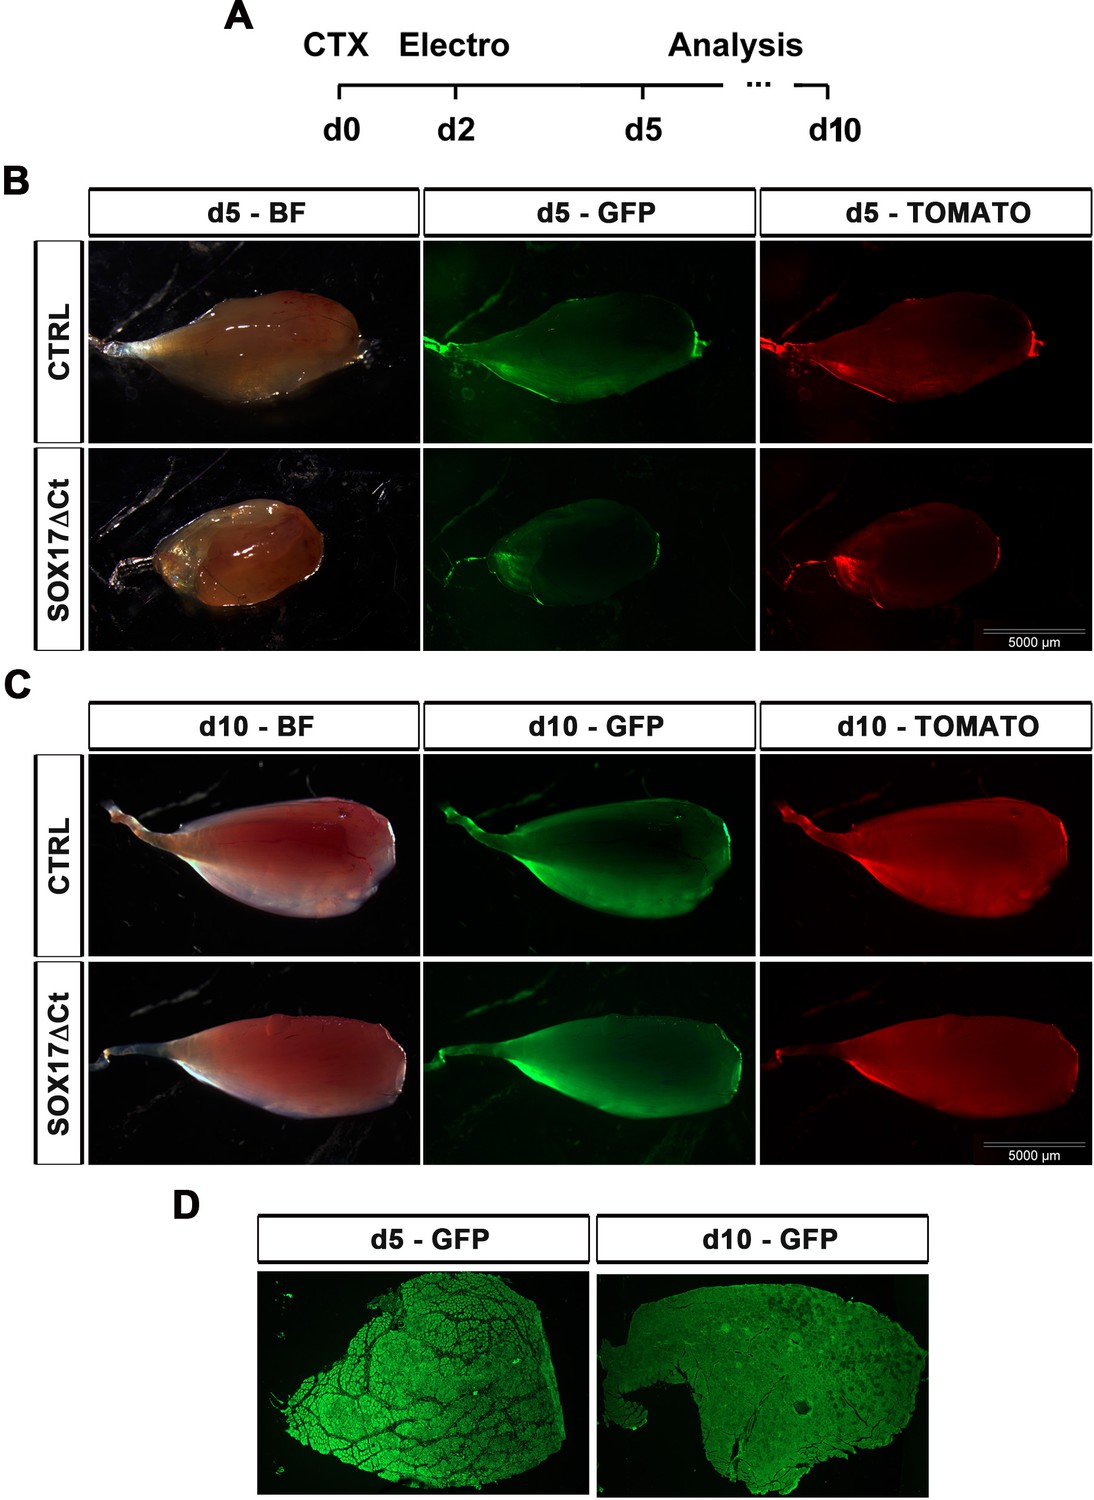
Muscle electroporation during injury-induced muscle regeneration.
(A) Schematic outline of the experimental procedure. (B–C) Representative images of electroporated wild type adult TA muscles five (B) and ten (C) days (d) after cardiotoxin (CTX) injection. TA muscles were injected with either pCIG (CTRL; green) or pCIG-expressing a dominant negative SOXF construct (SOX17ΔCt; green) (Figure 7), together with TdTomato (red) to identify the electroporated area. Scale bars, 5 mm. (D) Representative images of electroporated muscle cryosections five (left) and ten (right) days after CTX injection. BF, brightfield. n = 3 mice.
Figure 8 with 1 supplement
SoxF genes inhibit β-catenin transcriptional activity to regulate satellite cell behavior.
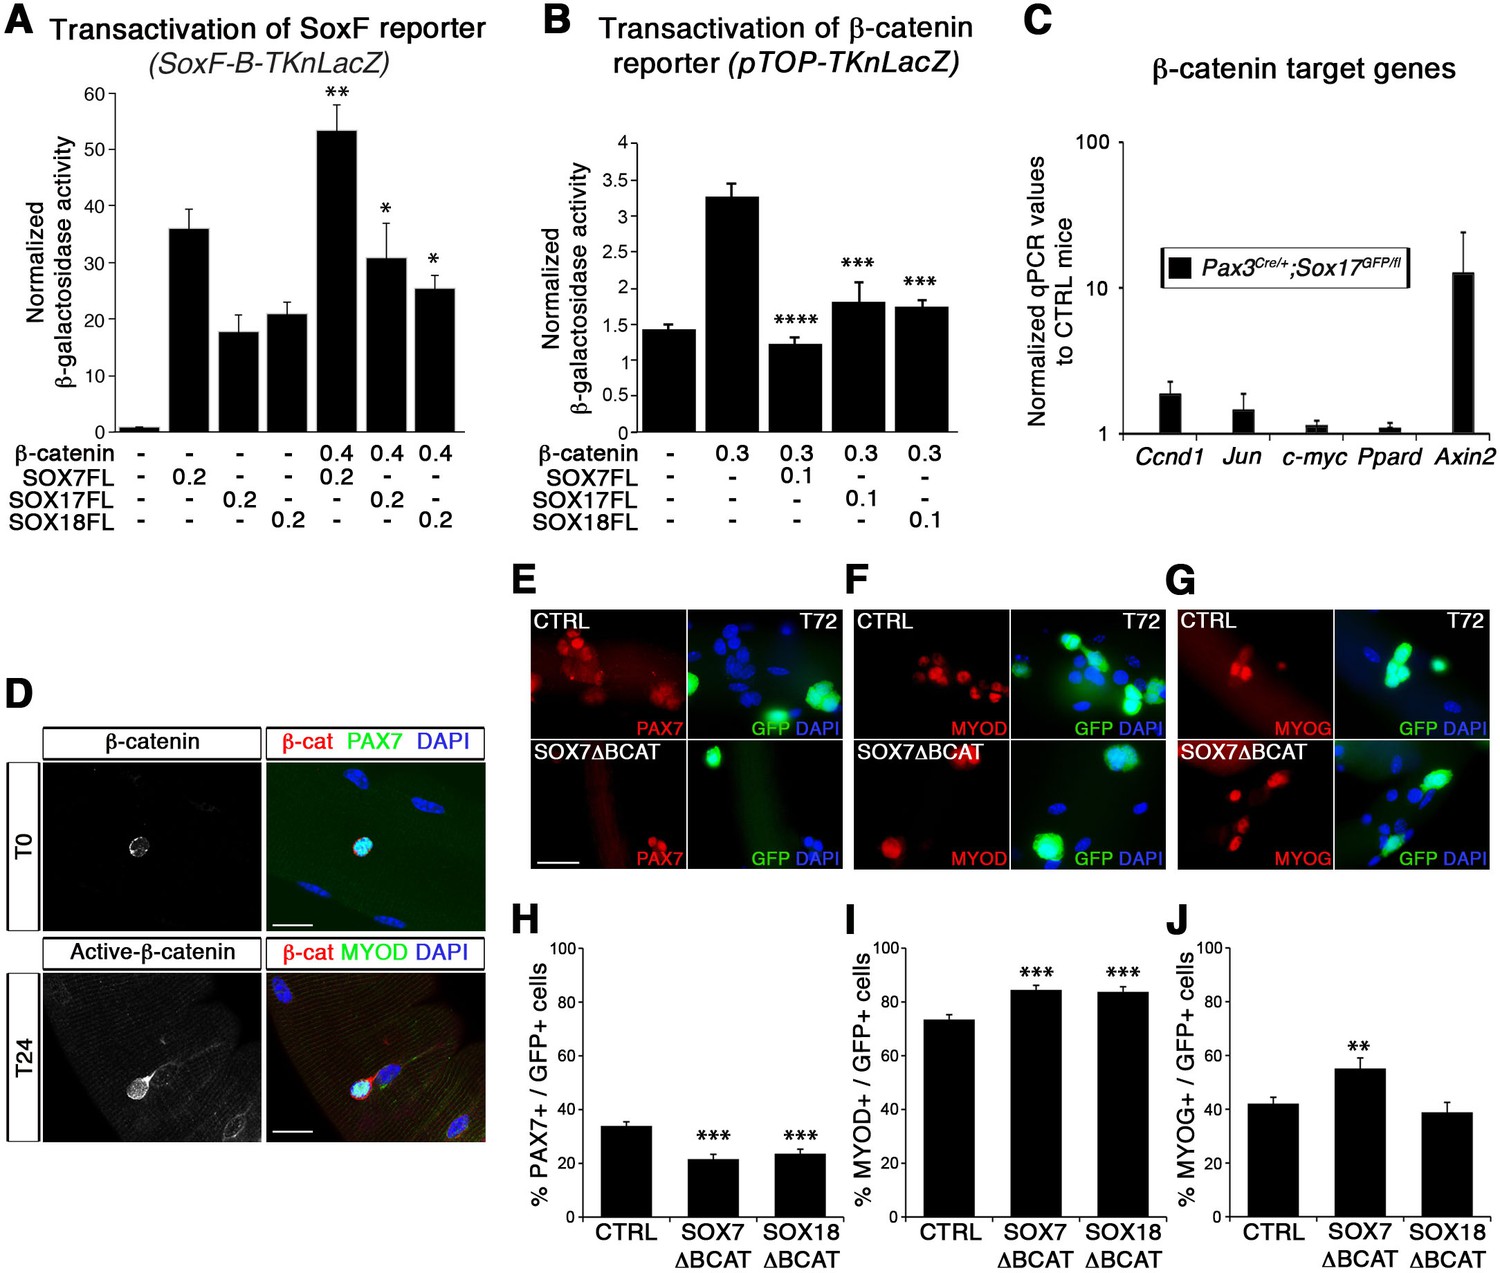
(A–B) Transactivation of SoxF-B-TKnLacZ (A) and pTOP-TKnLacZ (B) reporters by SOXF and β-catenin in LiCl-treated C2C12 myoblasts. Quantification is expressed as mean of the amount (nmoles) of hydrolyzed ONPG normalized to control (first bar). Comparison of activity with or without β-catenin (A) or with and without SOXF co-expression (B). Relative amounts of transfected DNA are listed below the chart (ng). n ≥ 4 (A); n ≥ 6 (B). (C) Expression profile of β-catenin target genes in adult control and Sox17 mutant TA muscles. Ccnd1, Cyclin-D1. n ≥ 4 mice (each in triplicate). (D) Immunolabeling for β-catenin (β-cat, red) in quiescent (T0, PAX7+, green) and activated (T24, MYOD+, green) satellite cells from adult wild type EDL isolated myofibers. Nuclei are counterstained with DAPI (blue). Scale bar, 50 μm. (E–G) Immunofluorescence of satellite cells transduced with SOXFΔBCAT constructs after 72 hr in culture (T72) in adult wild type EDL isolated myofibers. SOXFΔBCAT, SOXF-encoding retroviruses lacking the binding site for β-catenin; CTRL, encoding just eGFP. GFP indicates transduced cells. Nuclei are counterstained with DAPI (blue). Scale bars, 20 μm. (H–J) Quantification of the transduced satellite cells illustrated in (E–G) for quiescence (PAX7), activation (MYOD), and differentiation (MYOG; myogenin). n ≥ 50 fibers/EDL; ≥1000 satellite cells/EDL. Data expressed as mean ± s.e.m., statistically analyzed with Mann-Whitney ranking test (A–B) or Student’s unpaired t-test (H-J): *, p<0.05; **, p<0.01; ***, p<0.001; ****, p<0.0001, compared to absence of β-catenin (A), presence of β-catenin (B) or CTRL retrovirus (H-J).
Figure 8—figure supplement 1
Validation of SOXF constructs.
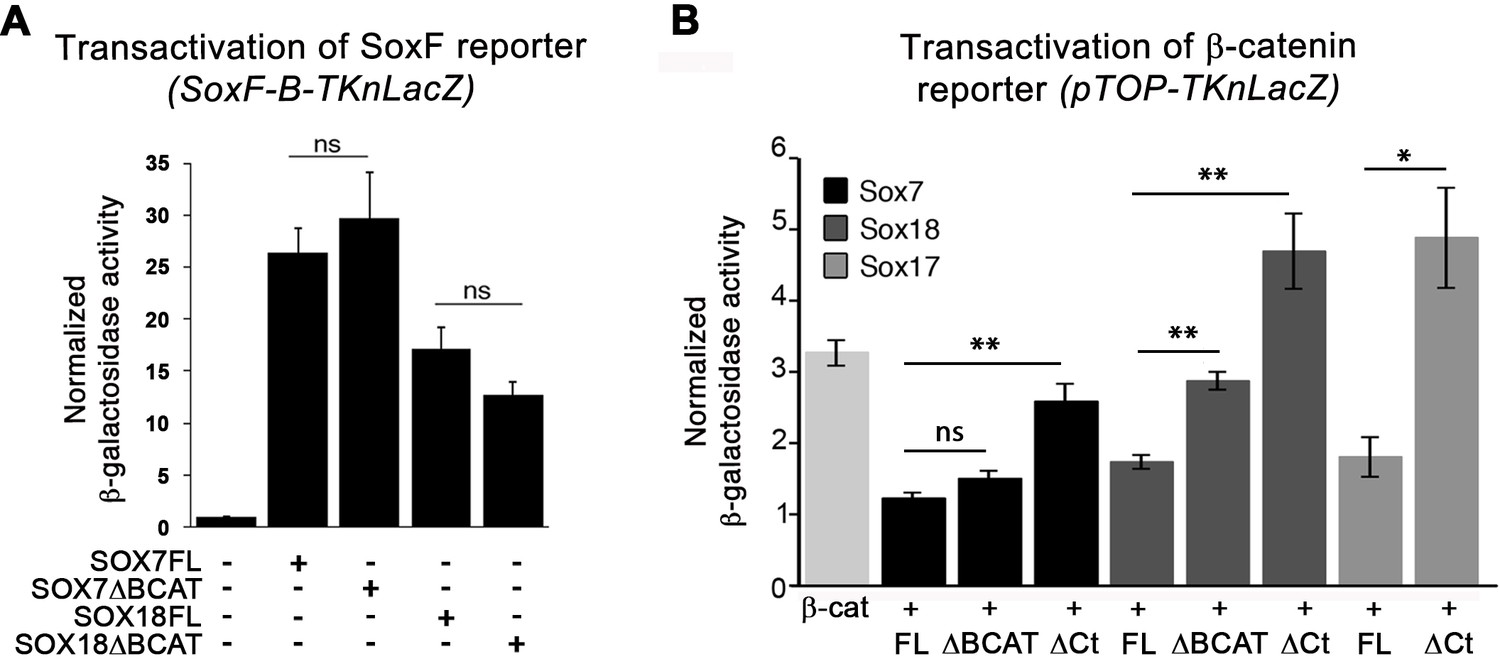
(A–B) Transactivation of SoxF-B-TKnLacZ reporter by SOXFΔBCAT constructs (A; n ≥ 5) and pTOP-TKnLacZ reporter by SOXF constructs (B; n ≥ 4) in LiCl-treated C2C12 myoblasts. Quantification is expressed as mean of the amount (nmoles) of hydrolyzed ONPG normalized to control (first bar). Data expressed as mean ± s.e.m., statistically analyzed with Student’s unpaired t-test to the respective FL form: ns, not significant; *, p<0.05; **, p<0.01.
Figure 9
SOXF factors inhibit β-catenin target genes.
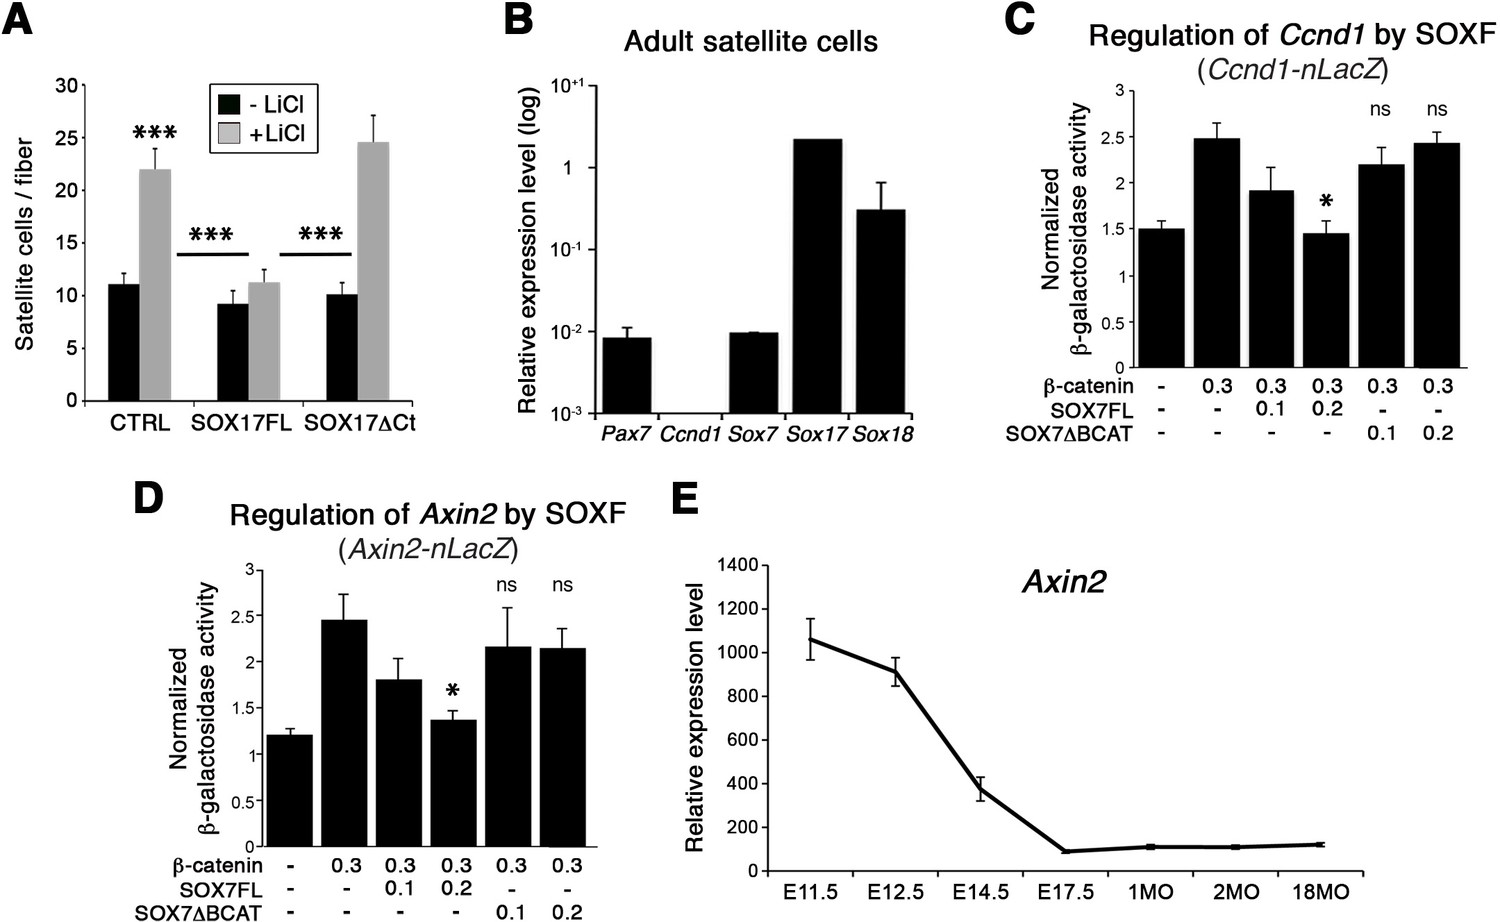
(A) Effect of β-catenin stabilizer LiCl in adult wild type EDL myofiber cultures, to analyze satellite cell proliferation rate upon transduction with the indicated retroviral constructs. SOXF-FL, construct overexpressing SOXF; SOXFΔCt, SOXF proteins C-terminal deletions preserving the HMG DNA binding domain. n ≥ 50 fibers/EDL; ≥1000 satellite cells/EDL. (B) RT-qPCR of adult quiescent satellite cells. Pax7 is the marker of this stem cell population. SoxF transcripts were detected but not Ccnd1 (Cyclin-D1). n = 3. (C–D) Fold transactivation of Ccnd1 (Ccnd1-nLacZ) (C; n = 3) or Axin2 (Axin2-nLacZ) (D; n = 4) proximal promoters by β-catenin in C2C12 myoblasts co-transfected with SOX7 constructs in presence versus absence of LiCl. Quantification is expressed as mean of the amount (nmoles) of hydrolyzed ONPG normalized to control (first bar). Comparison is related to β-catenin only transfection. Relative amounts of transfected DNA are listed below the chart (ng). (E) Expression levels of Axin2 in FACS-isolated Pax3GFP/+ cells from Affymetrix expression analysis. E, Embryonic day; P, Postnatal day; MO, age in months. Data expressed as mean ± s.e.m., statistically analyzed with Student’s unpaired t-test (A) or Mann-Whitney ranking test (C–D): ns, not significant; *, p<0.05; ***, p<0.001, compared to absence of LiCl (A, CTRL), SOX17FL (A, LiCL treated CTRL and SOXFΔCt) or β-catenin only transfection (C-D).
Author response image 1
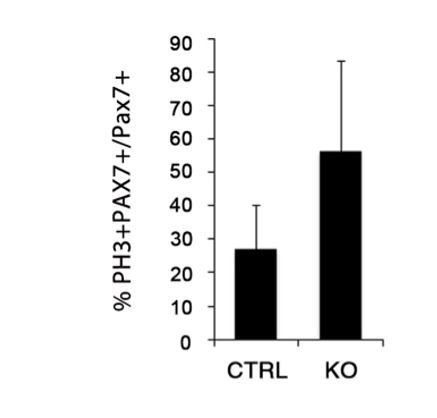
Evaluation of cycling and self-renewal status.
Quantification of the cycling (PH3+) satellite cells (PAX7+) at P14. Data expressed as mean ± s.e.m.
Author response image 2

Effect of Sox17 deletion on myofiber type distribution.
Quantification of the slow-type MyHCI+ myofibers expressed as percentage of all fibers in whole adult Soleus (A), TA (B), and EDL (C) cross-sections from control and Sox17 mutant mice. CTRL, Sox17GFP/fl; KO, Pax3Cre/+;Sox17GFP/fl. n≥4 mice (each in triplicate) for all experiments. Data expressed as mean ± s.e.m, statistically analyzed with Student’s unpaired t-test: ***, p<0.001.
Author response image 3
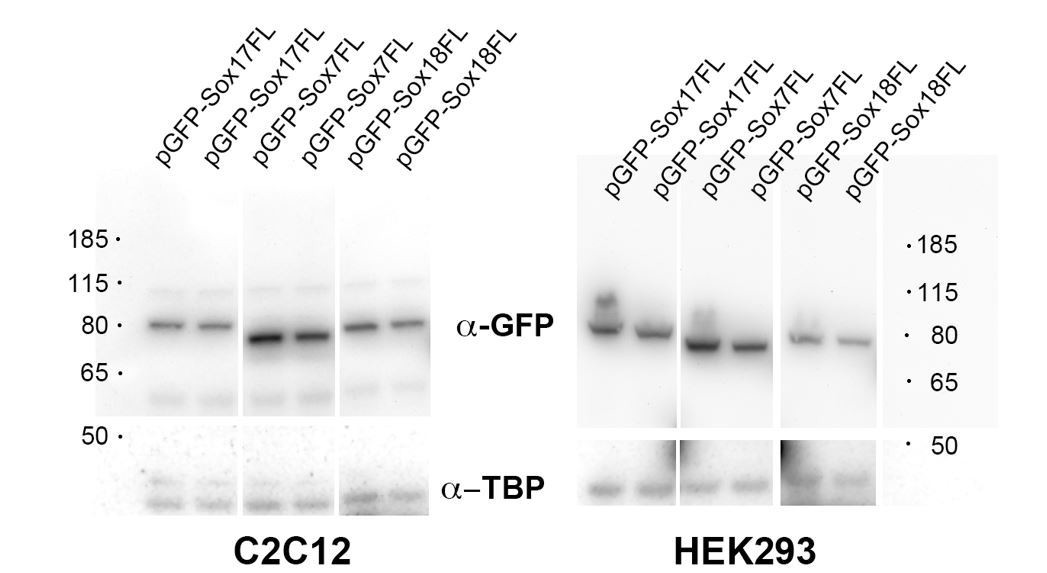
Overexpression levels of SOX-FL proteins.
C2C12 and HEK293 cells were transfected with GFP-tagged SOXF constructs for 48h. After lysis, 10 µg of proteins were loaded on a 4-12% gradient acrylamide gel. Overexpressed proteins were probed with anti-GFP antibody (Abcam). Loading is controlled using an anti-TBP antibody (Cell Signaling).
Tables
Key resources table
| Reagent type (species) or resource | Designation | Source or reference | Identifiers | Additional information |
|---|---|---|---|---|
| Gene (Mus musculus) | Sox7 | I.M.A.G.E. clone | 40131228 | N/A |
| Gene (Mus musculus) | Sox18 | I.M.A.G.E. clone | 3967084 | N/A |
| Strain, strain background (Mus musculus) | Pax3GFP/+ | PMID: 15843801 DOI: 10.1038/nature03594 | N/A | Mouse line maintained in F. Relaix lab |
| Strain, strain background (Mus musculus) | Pax3Cre/+ | The Jackson Laboratory PMID: 15882581 DOI: 10.1016/j.ydbio.2005.02.002 | B6;129-Pax3tm1(cre)Joe/J MGI: J:96431 RRID:IMSR_JAX:005549 | Mouse line obtained from J. A. Epstein |
| Strain, strain background (Mus musculus) | Pax7CreERT2/+ (Pax7+/CE) | The Jackson Laboratory PMID: 19554048 PMCID: PMC2767162 DOI: 10.1038/nature08209 | B6;129-Pax7tm2.1(cre/ERT2)Fan/J MGI: J:150962 RRID:IMSR_JAX:012476 | Mouse line obtained from C.M. Fan |
| Strain, strain background (Mus musculus) | Tg:Pax7-nGFP | PMID: 22265406 DOI: 10.1016/j.cell.2011.11.049 | Tg(Pax7-EGFP)#Tajb MGI:5308730 RRID:MGI:5308742 | Mouse line obtained from S. Tajbakhsh |
| Strain, strain background (Mus musculus) | Sox17GFP/+ | The Jackson Laboratory PMID: 17655922 PMCID: PMC2577201 DOI: 10.1016/j.cell.2007.06.011 | BKa.Cg-Sox17tm1Sjm Ptprcb Thy1a/J MGI: J:123050 RRID:IMSR_JAX:007687 | Mouse line obtained from S. J. Morrison |
| Strain, strain background (Mus musculus) | Sox17fl/+ | The Jackson Laboratory PMID: 17655922 PMCID: PMC2577201 DOI: 10.1016/j.cell.2007.06.011 | BKa.Cg-Sox17tm2Sjm Ptprcb Thy1a/J MGI: J:123050 RRID:IMSR_JAX:007686 | Mouse line obtained from S. J. Morrison |
| Cell line (Mus musculus) | C2C12 | American Type Culture Collection (ATCC) PMID: 28966089 PMCID: PMC5640514 DOI: 10.1016/j.cub.2017.08.031 | CRL-1772 RRID: CVCL_0188 | Cell line maintained in E. Gomes lab |
| Antibody | anti-GFP (rabbit polyclonal) | Life Technologies | A11122 RRID:AB_221569 | 1:500 |
| Antibody | anti-GFP (chicken polyclonal) | Abcam | ab13970 RRID:AB_300798 | 1:500 |
| Antibody | anti-Ki67 (mouse monoclonal) | BD Pharmingen | 556003 RRID:AB_396287 | 1:100 |
| Antibody | anti-Ki67 (rabbit polyclonal) | Abcam | ab15580 RRID:AB_443209 | 1:100 |
| Antibody | anti-Laminin (rabbit polyclonal) | Sigma-Aldrich | L9393 RRID:AB_477163 | 1:100 |
| Antibody | anti-Laminin (AlexaFluor647) | Novus Biological | NB300-144AF647 | 1:200 |
| Antibody | anti-M-Cadherin (mouse monoclonal) | nanoTools | MCAD-12G4 | 1:50 |
| Antibody | anti-MyoD1 (5.8A) (mouse monoclonal) | DAKO | M3512 RRID:AB_2148874 | 1:50 |
| Antibody | anti-MyoD (M-318) (rabbit polyclonal) | Santa Cruz | sc-760 RRID:AB_2148870 | 1:20 |
| Antibody | anti-Myogenin (mouse monoclonal) | DSHB | F5D | 1:100 |
| Antibody | anti-Pax7 (mouse monoclonal) | DSHB | PAX7-c | 1:20 |
| Antibody | anti-Pax7 (mouse monoclonal) | Santa Cruz | sc-81648 RRID:AB_2159836 | 1:20 |
| Antibody | anti-Phospho-Histone H3 (Ser10) (rabbit polyclonal) | Merck Millipore | 06–570 RRID:AB_310177 | 1:500 |
| Antibody | anti-Sox17 (goat polyclonal) | R and D Systems | AF1924 RRID:AB_355060 | 1:50 |
| Antibody | Alexa 488 goat anti-mouse IgG (H + L) | Life Technologies | A-11017; RRID:AB_143160 A-21121; RRID:AB_141514 | 1:400 |
| Antibody | Alexa 546 goat anti-mouse IgG (H + L) | Life Technologies | A-11018 RRID:AB_2534085 | 1:400 |
| Antibody | Alexa 555 goat anti-mouse IgG (H + L) | Life Technologies | A-21425 RRID:AB_2535846 | 1:400 |
| Antibody | Alexa 594 goat anti-mouse IgG (H + L) | Life Technologies | A-11020. RRID:AB_141974 A-21125; RRID:AB_141593 | 1:400 |
| Antibody | Alexa 488 goat anti-rabbit IgG (H + L) | Life Technologies | A-11070 RRID:AB_142134 | 1:400 |
| Antibody | Alexa 594 goat anti-rabbit IgG (H + L) | Life Technologies | A-11072 RRID:AB_142057 | 1:400 |
| Antibody | Alexa 594 donkey anti-goat IgG (H + L) | Life Technologies | A-11058 RRID:AB_142540 | 1:400 |
| Antibody | Alexa 488 goat anti-Chicken IgY (H + L) | Life Technologies | A-11039 RRID:AB_142924 | 1:400 |
| Antibody | Cy5-goat anti-rabbit IgG (H + L) | Jackson ImmunoResearch | 111-175-144 RRID:AB_2338013 | 1:200 |
| Antibody | Rat anti-mouse CD45-PE-Cy7 | BD Pharmingen | 561868 RRID:AB_10893599 | 10 ng/ml |
| Antibody | Rat anti-mouse Ter119-PE-Cy7 | BD Pharmingen | 557853 RRID:AB_396898 | 10 ng/ml |
| Antibody | Rat anti-mouse CD34-BV421 | BD Pharmingen | 562608 RRID:AB_11154576 | 10 ng/ml |
| Antibody | Rat anti-mouse integrin-α7-A700 | R and D Systems | FAB3518N RRID:AB_10973483 | 10 ng/ml |
| Antibody | Rat anti-mouse Sca1-FITC | BD Pharmingen | 553335 RRID:AB_394791 | 10 ng/ml |
| Antibody | Rat anti-mouse CD31-PE | BD Pharmingen | 553373 RRID:AB_394819 | 10 ng/ml |
| Sequence-based reagent (Pax7_foward primer) | 5’ – AGGCCTTCGAGAGG ACCCAC – 3’ | Eurogentec | N/A | N/A |
| Sequence-based reagent (Pax7_reverse primer) | 5’ – CTGAACCAGACCTG GACGCG – 3’ | Eurogentec | N/A | N/A |
| Sequence-based reagent (Sox7_foward primer) | 5’ – CTTCAGGGGACAA GAGTTCG – 3’ | Eurogentec | N/A | N/A |
| Sequence-based reagent (Sox7_reverse primer) | 5’ – GGGTCTCTTCTGG GACAGTG – 3’ | Eurogentec | N/A | N/A |
| Sequence-based reagent (Sox17_foward primer) | 5’ – GCCAAAGACGAACGC AAGCGGT – 3’ | Eurogentec | N/A | N/A |
| Sequence-based reagent (Sox17_reverse primer) | 5’ – TCATGCGCTTCACCT GCTTG – 3’ | Eurogentec | N/A | N/A |
| Sequence-based reagent (Sox18_foward primer) | 5’ – AACAAAATCCGGATC TGCAC – 3’ | Eurogentec | N/A | N/A |
| Sequence-based reagent (Sox18_reverse primer) | 5’ – CGGTACTTGTAGTTGGG ATGG – 3’ | Eurogentec | N/A | N/A |
| Sequence-based reagent (Ccnd1_foward primer) | 5’ – TTCCTCTCCTGCTA CCGCAC – 3’ | Eurogentec | N/A | N/A |
| Sequence-based reagent (Ccnd1_reverse primer) | 5’ – GACCAGCCTCTTCCTC CACTTC – 3’ | Eurogentec | N/A | N/A |
| Sequence-based reagent (Axin2_fowardprimer) | 5’ – AAGAGAAGCGACCCAGT CAA – 3’ | Eurogentec | N/A | N/A |
| Sequence-based reagent (Axin2_reverse primer) | 5’ – CTGCGATGCATCTCTC TCTG – 3’ | Eurogentec | N/A | N/A |
| Sequence-based reagent (SoxF binding site) | 5' – CAACAATCATCATTGTTGG GGCCAACAATCTACATTGTT CAGA – 3' | Eurogentec | N/A | N/A |
| Sequence-based reagent (SoxF binding site) | 5' – TCTGAACAATGTAGATTGT TGGCCCCAACAATGATGATT GTTG – 3' | Eurogentec | N/A | N/A |
| Commercial assay or kit | LIVE/DEAD Fixable Blue Dead Cell Stain Kit | Life Technologies | L23105 | N/A |
| Commercial assay or kit | RNasy Micro Kit | QIAGEN | 74004 | N/A |
| Commercial assay or kit | RNeasy Fibrous Tissue Midi Kit | QIAGEN | 75742 | N/A |
| Commercial assay or kit | Transcriptor First Strand cDNA Synthesis Kit | Roche-Sigma-Aldrich | 04897030001 | N/A |
| Commercial assay or kit | LightCycler 480 SYBR Green I Master | Roche-Sigma-Aldrich | 04887352001 | N/A |
| Commercial assay or kit | Lipofectamine LTX PLUS reagent | Life Technologies | 15338–100 | N/A |
| Chemical compound, drug | Cardiotoxin | Latoxan | L8102 | 10 µM |
| Chemical compound, drug | bFGF | Peprotech | 450–33 | 20 ng/ml |
| Chemical compound, drug | Chicken embryo extract | MP-Biomedical | 2850145 | 0.5–1% |
| Chemical compound, drug | Collagenase A | Roche-Sigma-Aldrich | 10103586001 | 2 μg/ml |
| Chemical compound, drug | Collagenase type I | Sigma-Aldrich | C0130 | 0.2% |
| Chemical compound, drug | 4’,6-diamidino-2-phenylindole dihydrochloride (DAPI) | Life Technologies | D1306 | N/A |
| Chemical compound, drug | Dispase II | Roche-Sigma-Aldrich | 10103586001 | 2.4 U/ml |
| Chemical compound, drug | DNaseI | Roche-Sigma-Aldrich | 1284932 | 10 ng/mL |
| Chemical compound, drug | Dulbecco’s modified Eagle’s medium (DMEM) | Life Technologies | 41966 | N/A |
| Chemical compound, drug | DMEM with GlutaMAX | Life Technologies | 61965–026 | N/A |
| Chemical compound, drug | EdU | Thermo Fisher Scientific | C10340 | 2 μM |
| Chemical compound, drug | Fetal bovine serum (FBS) | Life Technologies | 10270 | 20% |
| Chemical compound, drug | Fluoromount-G | Southern Biotech | 0100–01 | N/A |
| Chemical compound, drug | Gelatin | Sigma-Aldrich | G1890 | 0.1% |
| Chemical compound, drug | Horse serum | Life Technologies | 26050088 | 5–10% |
| Chemical compound, drug | Penicillin/streptomycin | Life Technologies | 15140–122 | 1X |
| Chemical compound, drug | Tamoxifen | Sigma-Aldrich | T5648 | 5–10 µg/day |
| Software, algorithm | Metamorph Software | Molecular Devices | RRID: SCR_002368 | N/A |
| Software, algorithm | ImageJ | https://imagej.nih.gov/ij/ | RRID:SCR_003070 | N/A |
Table 1
List of primary antibodies used in this study for immunolabeling.
GFP, Green Fluorescent Protein; Ki67, Marker Of Proliferation Ki-67; MyoD1, Myogenic Differentiation 1; Pax7, Paired Box 7; Phospho-Histone H3 (Ser10), for detection of Histone H3 phosphorylated at serine 10; and Sox17, SRY-Box 17.
| Genes | Sequences |
|---|---|
| Pax7 | 5’ – AGGCCTTCGAGAGGACCCAC – 3’ 5’ – CTGAACCAGACCTGGACGCG – 3’ |
| Myf5 | 5’ – TGAGGGAACAGGTGGAGAAC – 3’ 5’ – AGCTGGACACGGAGCTTTTA – 3’ |
| Myod | 5’ – GGCTACGACACCGCCTACTA – 3’ 5’ – GAGATGCGCTCCACTATGCT – 3’ |
| Myog | 5’ – AGTGAATGCAACTCCCACAG – 3’ 5’ – ACGATGGACGTAAGGGAGTG – 3’ |
| Myh1 | 5’ – CCAGGAGGCCCCACCCC – 3’ 5’ – CACAGTCCTCCCGGCCCC – 3’ |
| Ki67 | 5’ – CCTGTGAGGCTGAGACATGG – 3’ 5’ – TCTTGAGGCTCGCCTTGATG – 3’ |
| Sox7 | 5’ – CTTCAGGGGACAAGAGTTCG – 3’ 5’ – GGGTCTCTTCTGGGACAGTG – 3’ |
| Sox17 | 5’ – GCCAAAGACGAACGCAAGCGGT – 3’ 5’ – TCATGCGCTTCACCTGCTTG – 3’ |
| Sox18 | 5’ – AACAAAATCCGGATCTGCAC – 3’ 5’ – CGGTACTTGTAGTTGGGATGG – 3’ |
| Ccnd1 | 5’ – TTCCTCTCCTGCTACCGCAC – 3’ 5’ – GACCAGCCTCTTCCTCCACTTC – 3’ |
| Jun | 5’ – TCCCCTATCGACATGGAGTC – 3’ 5’ – TTTTGCGCTTTCAAGGTTTT – 3’ |
| c-myc | 5’ – GATTCCACGGCCTTCTCTCC – 3’ 5’ – GCCTCTTCTCCACAGACACC – 3’ |
| Axin2 | 5’ – AAGAGAAGCGACCCAGTCAA – 3’ 5’ – CTGCGATGCATCTCTCTCTG – 3’ |
| Ppard | 5’ – ATTCCTCCCCTTCCTCCCTG – 3’ 5’ – ACAATCCGCATGAAGCTCGA – 3’ |
| Hprt1 | 5’ – AGGGCATATCCAACAACAAACTT – 3’ 5’ – GTTAAGCAGTACAGCCCCAAA – 3’ |
| TBP | 5’ – ATCCCAAGCGATTTGCTG – 3’ 5’ – CCTGTGCACACCATTTTTCC – 3’ |
Table 2
List of qPCR oligonucleotides used in this study
Pax7, Paired Box 7; Myf5, Myogenic Factor 5; Myod1, Myogenic Differentiation 1; Myog, Myogenin; Myh1, Myosin Heavy Chain 1; Ki67, Marker Of Proliferation Ki-67; Sox7, SRY-Box 7; Sox17, SRY-Box 17; Sox18, SRY-Box 18; Ccnd1, Cyclin D1; Jun, Jun Proto-Oncogene, AP-1 Transcription Factor Subunit; c-myc, MYC Proto-Oncogene, BHLH Transcription Factor; Axin2, Axin2; Ppard, Peroxisome Proliferator Activated Receptor Delta; Hprt1, Hypoxanthine Phosphoribosyltransferase 1; and TBP, TATA Box Protein.
| Antigen | Reference | Company | Ig type | Dilution |
|---|---|---|---|---|
| GFP | A11122 | Life Technologies | Rabbit IgG | 1:500 |
| GFP | ab13970 | Abcam | Chicken IgY | 1:500 |
| Ki67 | 556003 | BD Pharmingen | Mouse IgG1 | 1:100 |
| Ki67 | ab15580 | Abcam | Rabbit IgG | 1:100 |
| Laminin | L9393 | Sigma-Aldrich | Rabbit IgG | 1:100 |
| Laminin (AlexaFluor647) | NB300-144AF647 | Novus Biological | Rabbit IgG | 1:200 |
| M-Cadherin | MCAD-12G4 | nanoTools | Mouse IgG1 | 1:50 |
| MyoD1, 5.8A | M3512 | DAKO | Mouse IgG1 | 1:50 |
| MyoD, M-318 | sc-760 | Santa Cruz | Rabbit IgG | 1:20 |
| Myogenin | F5D | DSHB | Mouse IgG1 | 1:100 |
| Pax7 | PAX7-c | DSHB | Mouse IgG1 | 1:20 |
| Pax7 | sc-81648 | Santa Cruz | Mouse IgG1 | 1:20 |
| Phospho-Histone H3 (Ser10) | 06–570 | Merck Millipore | Rabbit IgG | 1:500 |
| Sox17 | AF1924 | R and D Systems | Goat IgG | 1:50 |
Additional files
-
Transparent reporting form
- https://doi.org/10.7554/eLife.26039.022
Download links
A two-part list of links to download the article, or parts of the article, in various formats.
Downloads (link to download the article as PDF)
Open citations (links to open the citations from this article in various online reference manager services)
Cite this article (links to download the citations from this article in formats compatible with various reference manager tools)
SOXF factors regulate murine satellite cell self-renewal and function through inhibition of β-catenin activity
eLife 7:e26039.
https://doi.org/10.7554/eLife.26039


