PPP1R15A-mediated dephosphorylation of eIF2α is unaffected by Sephin1 or Guanabenz
- University of Cambridge, United Kingdom
- University of Nottingham, United Kingdom
Figures
Figure 1
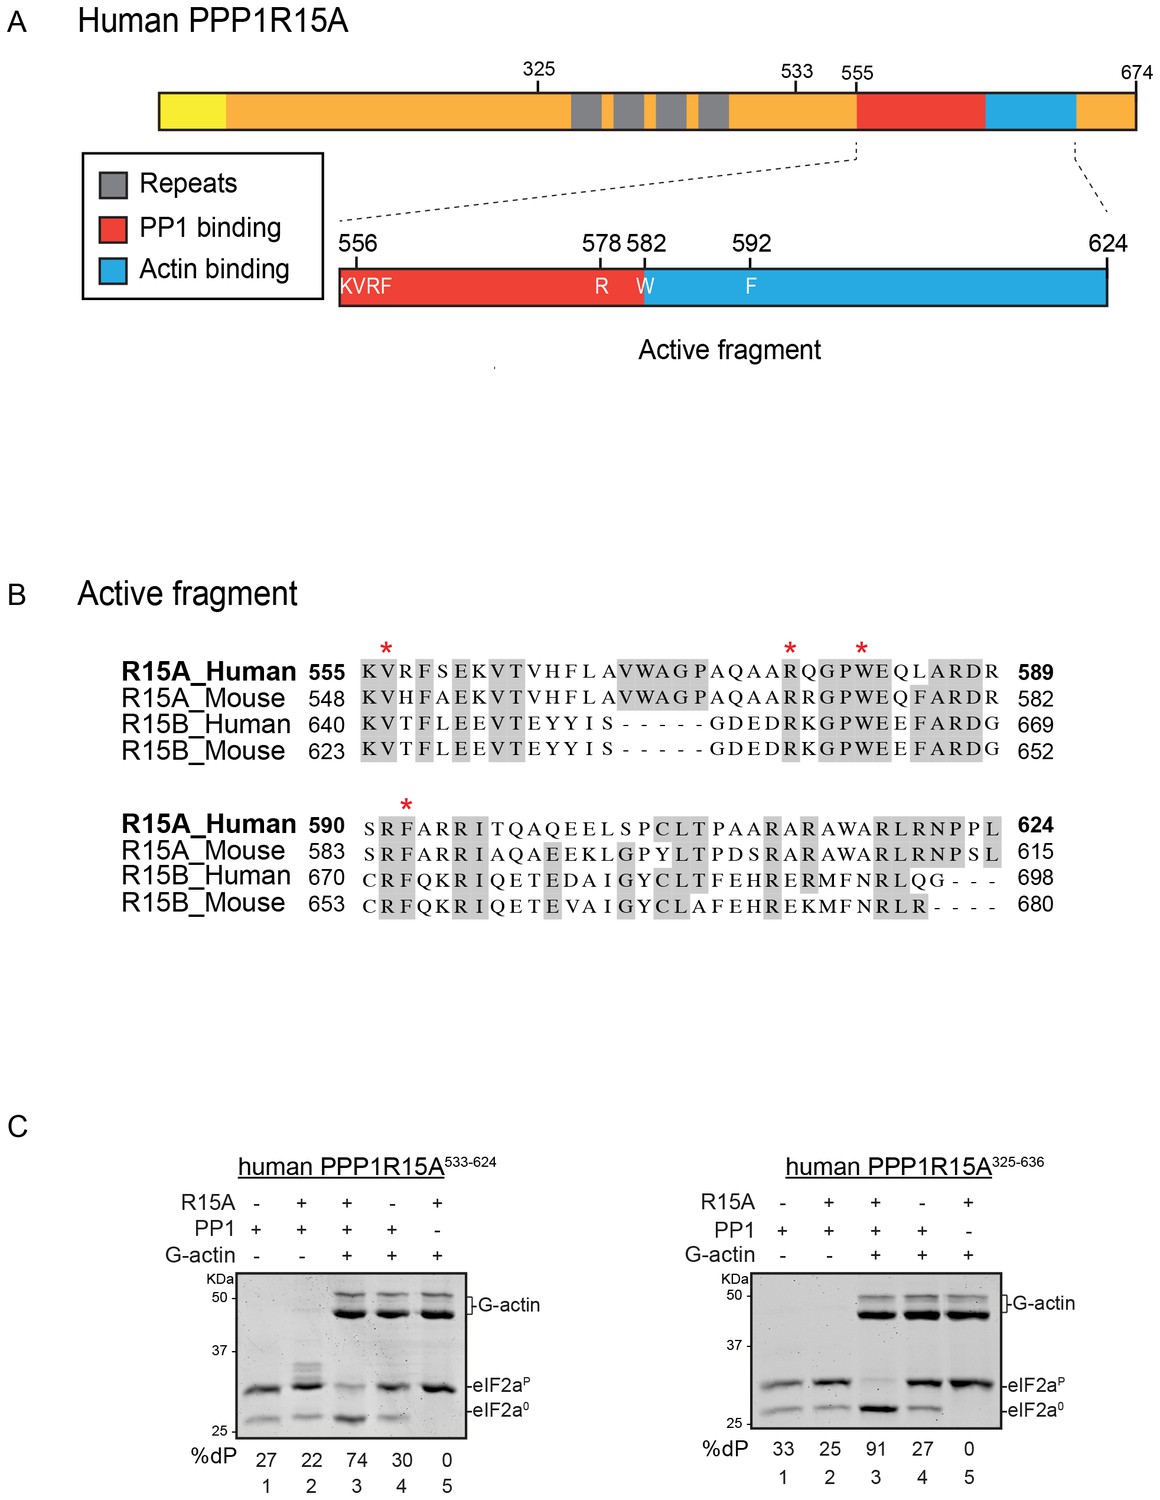
A tripartite assay for human PPP1R15A-dependent eIF2α-P dephosphorylation.
(A) Cartoon representation of human PPP1R15A (GADD34). The minimal C-terminal peptide required for eIF2α-P dephosphorylation is outlined (‘active fragment’) and key residues in the PP1 and G-actin binding regions are annotated. (B) Alignment of C-terminal active fragments of mammalian PPP1R15A and PPP1R15B (CREP) using ClustalX. Grey highlighted residues represent conserved or highly similar residues. Red asterisks highlight key residues that are analysed in further detail. (C) Image of Coomassie-stained PhosTag-SDS-PAGE on which phosphorylated (eIF2αP) and non-phosphorylated (eIF2α0) forms of eIF2α from 20 min dephosphorylation reactions were resolved. The composition of the reaction, PPP1R15A533-624 [80 nM], PPP1R15A325-636 [400 nM], PP1c [12.5 nM] and G-actin [750 nM] are noted above and the fraction of dephosphorylated eIF2α is noted underneath each lane (%dP). The migration of molecular weight markers and G-actin are noted (the signal from the PPP1R15A and PP1c is undetectable on these gels).
Figure 2
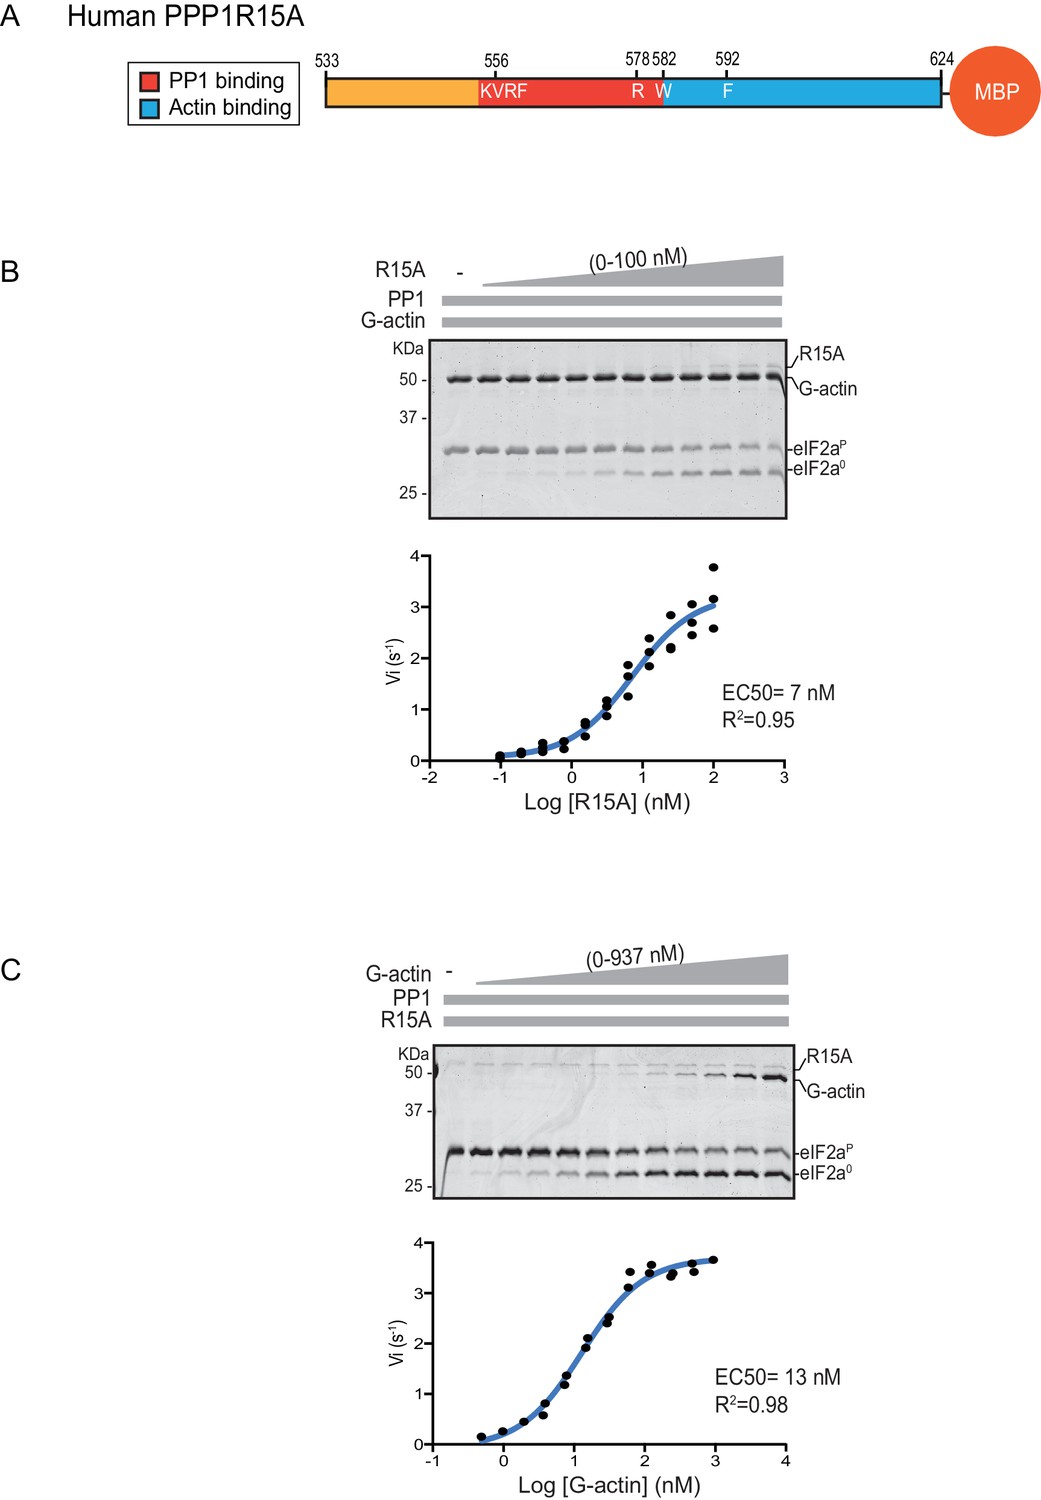
eIF2α-P dephosphorylation kinetics as a function of human PPP1R15A533-624 and G-actin concentration.
(A) Schema of the human PPP1R15A533-624 construct used. The C-terminal Maltose Binding Protein (MBP) component, which stabilizes the fusion protein, is noted. (B) Upper panel. Coomassie-stained PhosTag-SDS-PAGE tracking the dephosphorylation of eIF2αP to eIF2α0 in 20 min dephosphorylation reactions constituted with eIF2αP [2 µM], PP1 [0.625 nM], G-actin [1.5 µM] and an escalating concentration of PPP1R15A533-624. Shown is a representative of three independent experiments performed. Lower panel: Semi-log10 plot of the initial velocity of eIF2αP dephosphorylation as a function of PPP1R15A533-624 concentration derived from three repeats (one shown above). The EC50 for PPP1R15A533-624 was calculated using the agonist fitting function on GraphPad Prism V7. (C) Upper panel. As in ‘B’ but dephosphorylation of eIF2αP to eIF2α0 was carried out in the presence of a fixed concentration of PPP1R15A533-624 [50 nM] and an escalating concentration of G-actin. Shown is a representative of two independent experiments performed. Lower panel: Semi-log10 plot of initial velocity as a function of G-actin concentration derived from two repeats (one shown above).
Figure 3
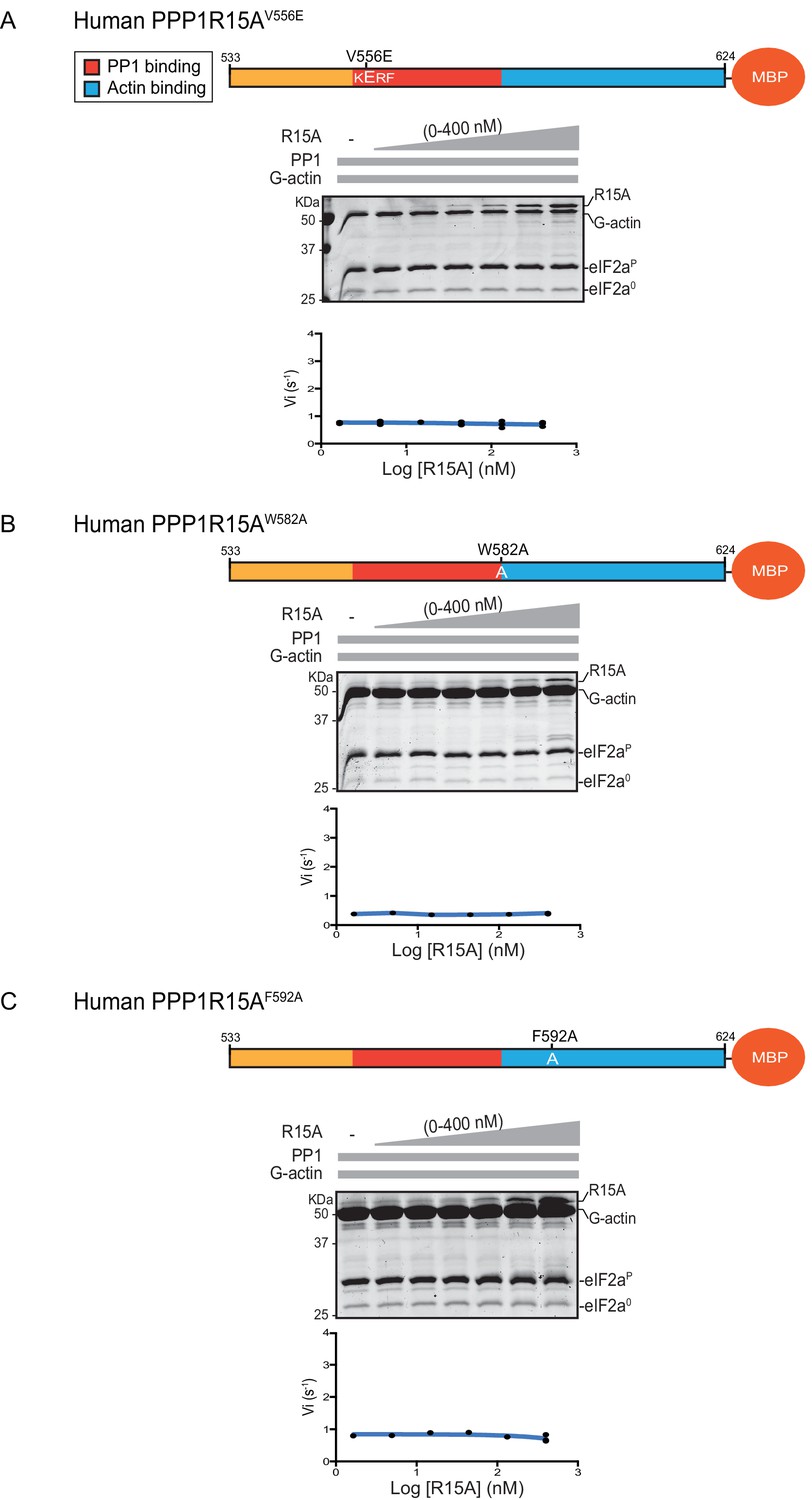
eIF2α-P dephosphorylation by ternary complexes constituted with human PPP1R15A(533-624)V556E, PPP1R15A (533-624)W582A or PPP1R15A (533-624)F592A.
(A) Coomassie-stained PhosTag-SDS-PAGE tracking the dephosphorylation of eIF2αP to eIF2α0 as in Figure 2 above, but with PP1[32 nM], G-actin [400 nM] and an escalating concentration of mutant human PPP1R15A(533-624)V556E. Shown is a representative of three independent experiments performed. The position of the mutation is provided in the schema above. The plot of initial velocity as a function of PPP1R15A(533-624)V556E derived from three repeats (one shown) is below the SDS-PAGE image. (B) As in ‘A’ above but using human PPP1R15A(533-624)W582A and G-actin [3.7 µM](Note: only the highest concentration of PPP1R15A was repeated three times). (C) As in ‘A’ above but using human PPP1R15A(533-624)F592A and G-actin [3.7 µM] (Note: only the highest concentration of PPP1R15A was repeated three times).
Figure 4
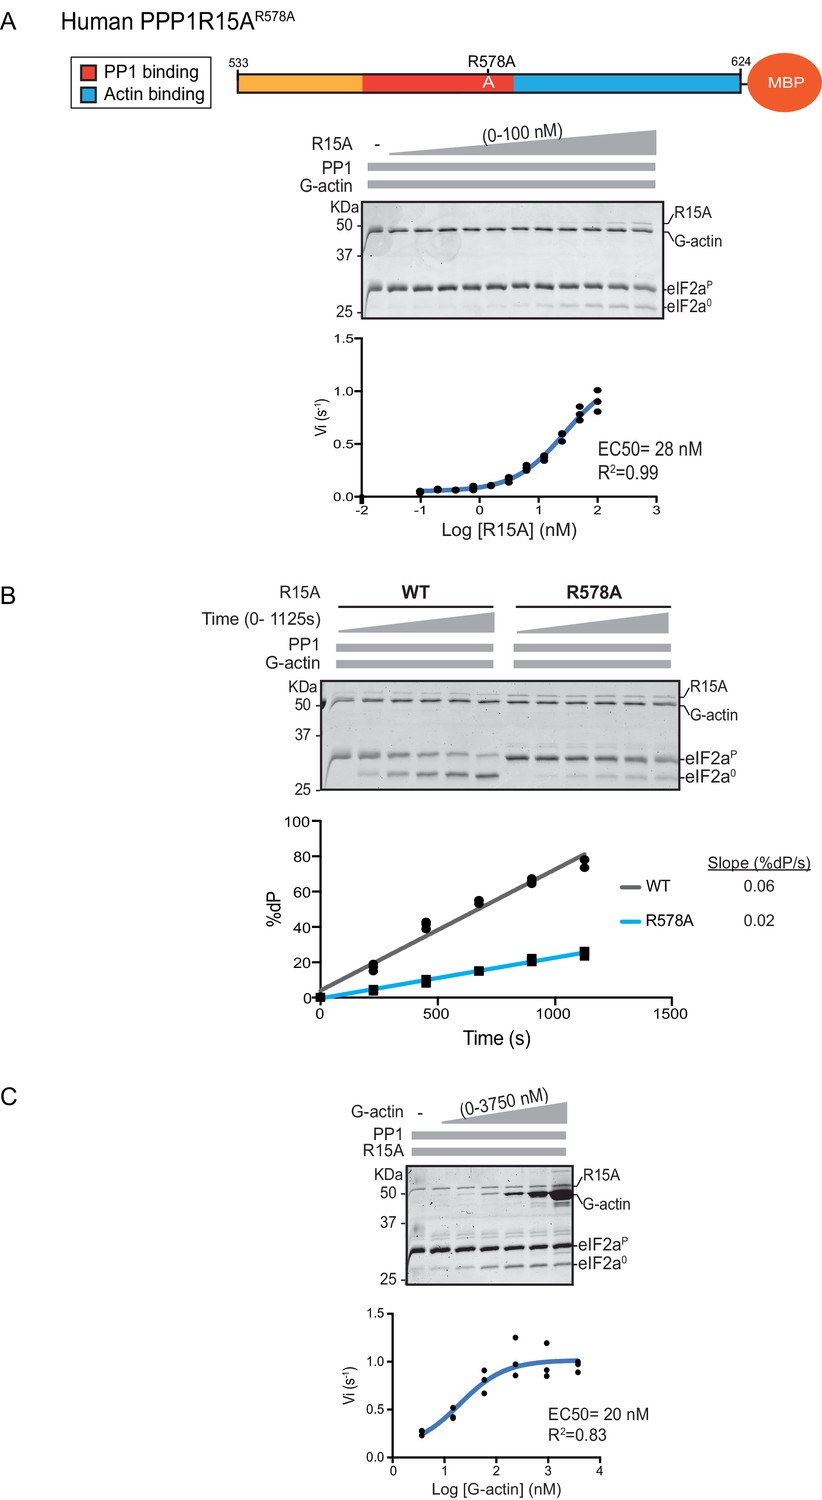
eIF2α-P dephosphorylation by ternary complexes constituted with human PPP1R15A(533-624)R578A.
(A) Coomassie-stained PhosTag-SDS-PAGE tracking the dephosphorylation of eIF2αP in a 20 min reaction, as in Figure 2 and 3 above, but with an escalating concentration of mutant human PPP1R15A(533-624)R578A. Shown is a representative of three independent experiments performed. The position of the mutation is provided in the schema above the gel. The plot of initial velocity as a function of PPP1R15A(533-624)R578A derived from three repeats (one shown) is below the SDS-PAGE image. The EC50 for PPP1R15A(533-624)R578A was calculated using the agonist fitting curve in GraphPad Prism V7. (B) Time-course of eIF2αP dephosphorylation using a low concentration of PP1 [0.625 nM], saturating concentrations of G-actin [400 nM], and wildtype [100 nM] or mutant human PPP1R15A(533-624)R578A [100 nM in one assay and 200 nM in the two other assays]. Shown is a representative of three independent experiments performed. Below the gel is a plot of the fraction of substrate dephosphorylated as a function of time derived from three repeats (one shown). The slope of the reaction was derived by fitting the data to a linear model in GraphPad Prism V7. (C) As in ‘A’ above but with saturating concentration of PPP1R15A(533-624)R578A [100 nM] and escalating concentration of G-actin. Shown is a representative of three independent experiments performed. The plot of initial velocity as a function of G-actin derived from three repeats (one shown) is below the SDS-PAGE image. The EC50 for G-actin was calculated using the agonist fitting curve in GraphPad Prism V7.
Figure 5
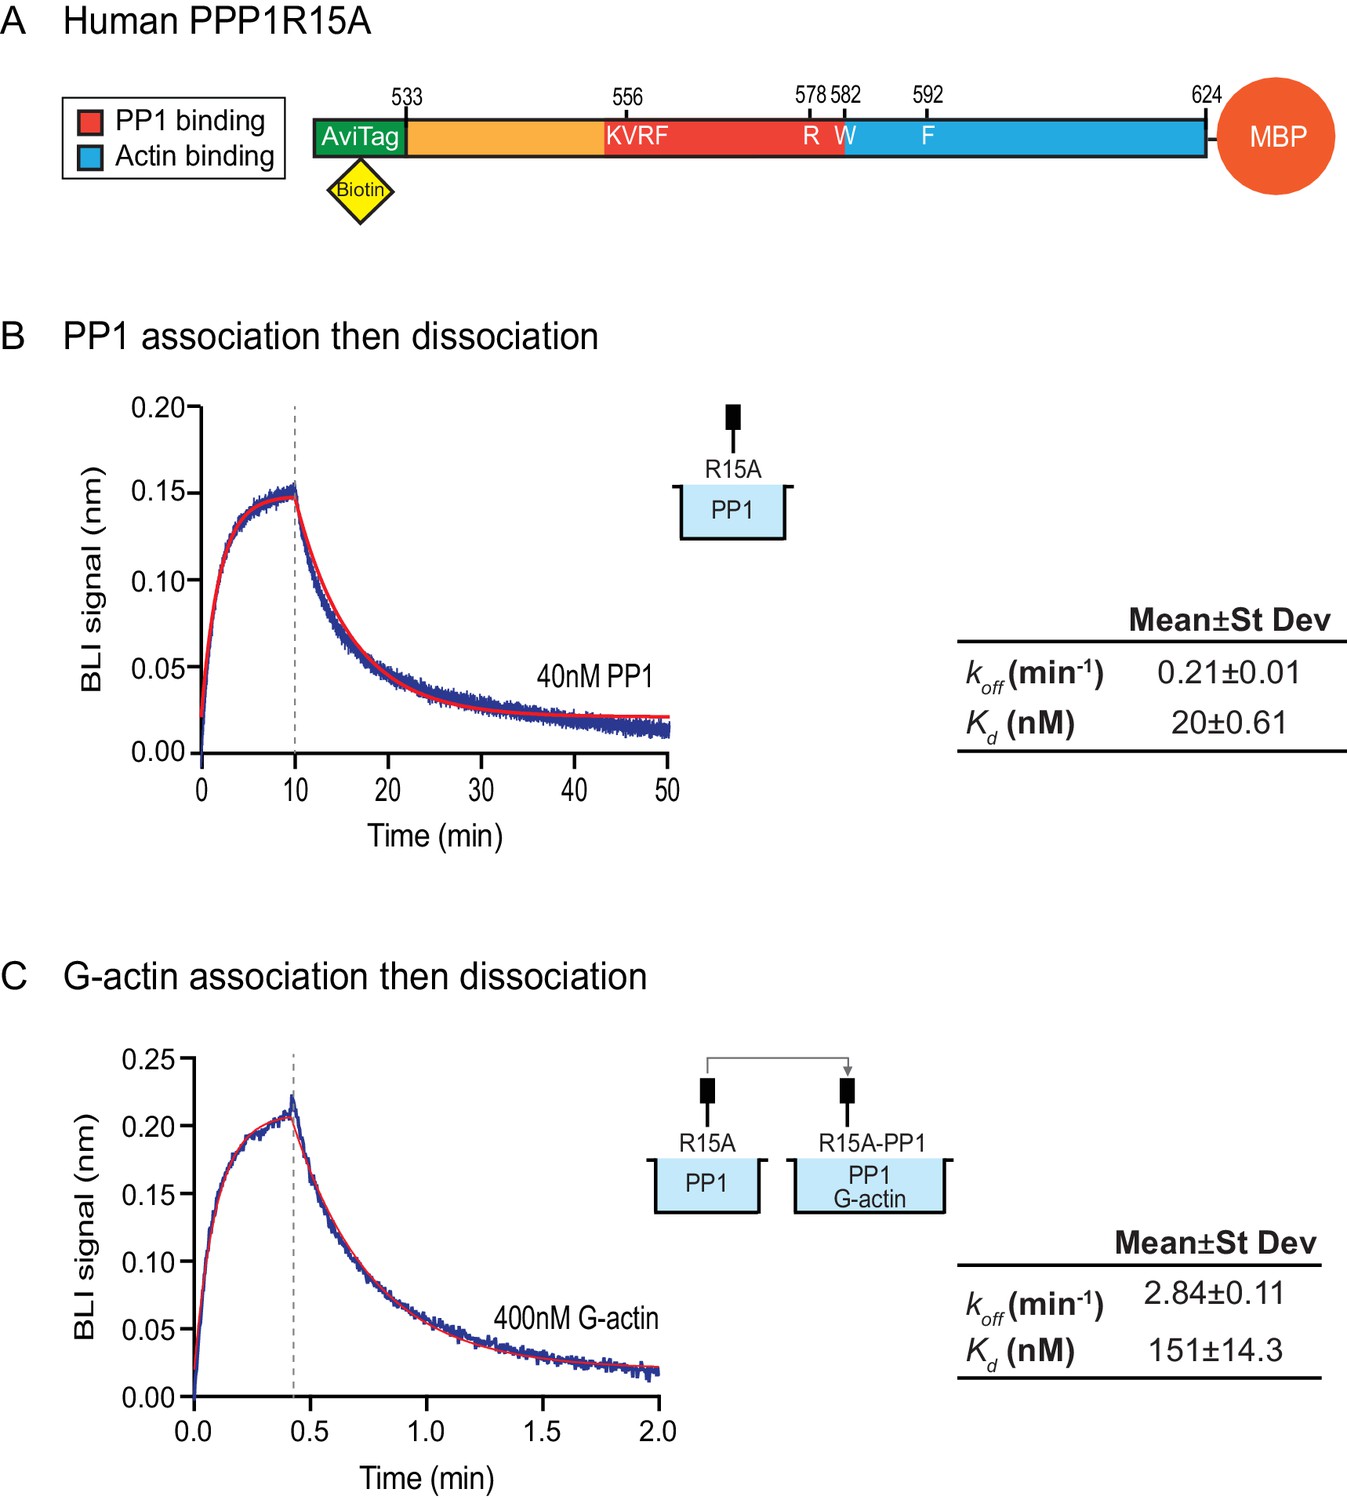
Affinity of the components of the tripartite holophosphatase for one another analysed by Bio-Layer Interferometry (BLI).
(A) Schema of the biotinylated human PPP1R15A533-624 immobilized onto the BLI biosensor tip. (B) Plot of Bio-Layer Interferometry (BLI) signal as a function of time in a representative experiment (repeated three times) in which immobilized PPP1R15A533-624 was reacted with PP1 [40 nM] in solution (blue trace). The fitting curve using ‘association then dissociation’ model in GraphPad Prism V7 is shown in red. Vertical dashed line marks the beginning of the dissociation phase. Table summarizes kinetic parameters extracted from fitting curves of three repeats of the experiment shown in left panel (mean ± standard deviation). (C) As in ‘B’ above, but the immobilized PPP1R15A533-624 was first exposed to PP1 [200 nM], before being exposed to a solution of both PP1 [200 nM] and G-actin [400 nM]. Shown is a representative of an experiment repeated three times.
Figure 6
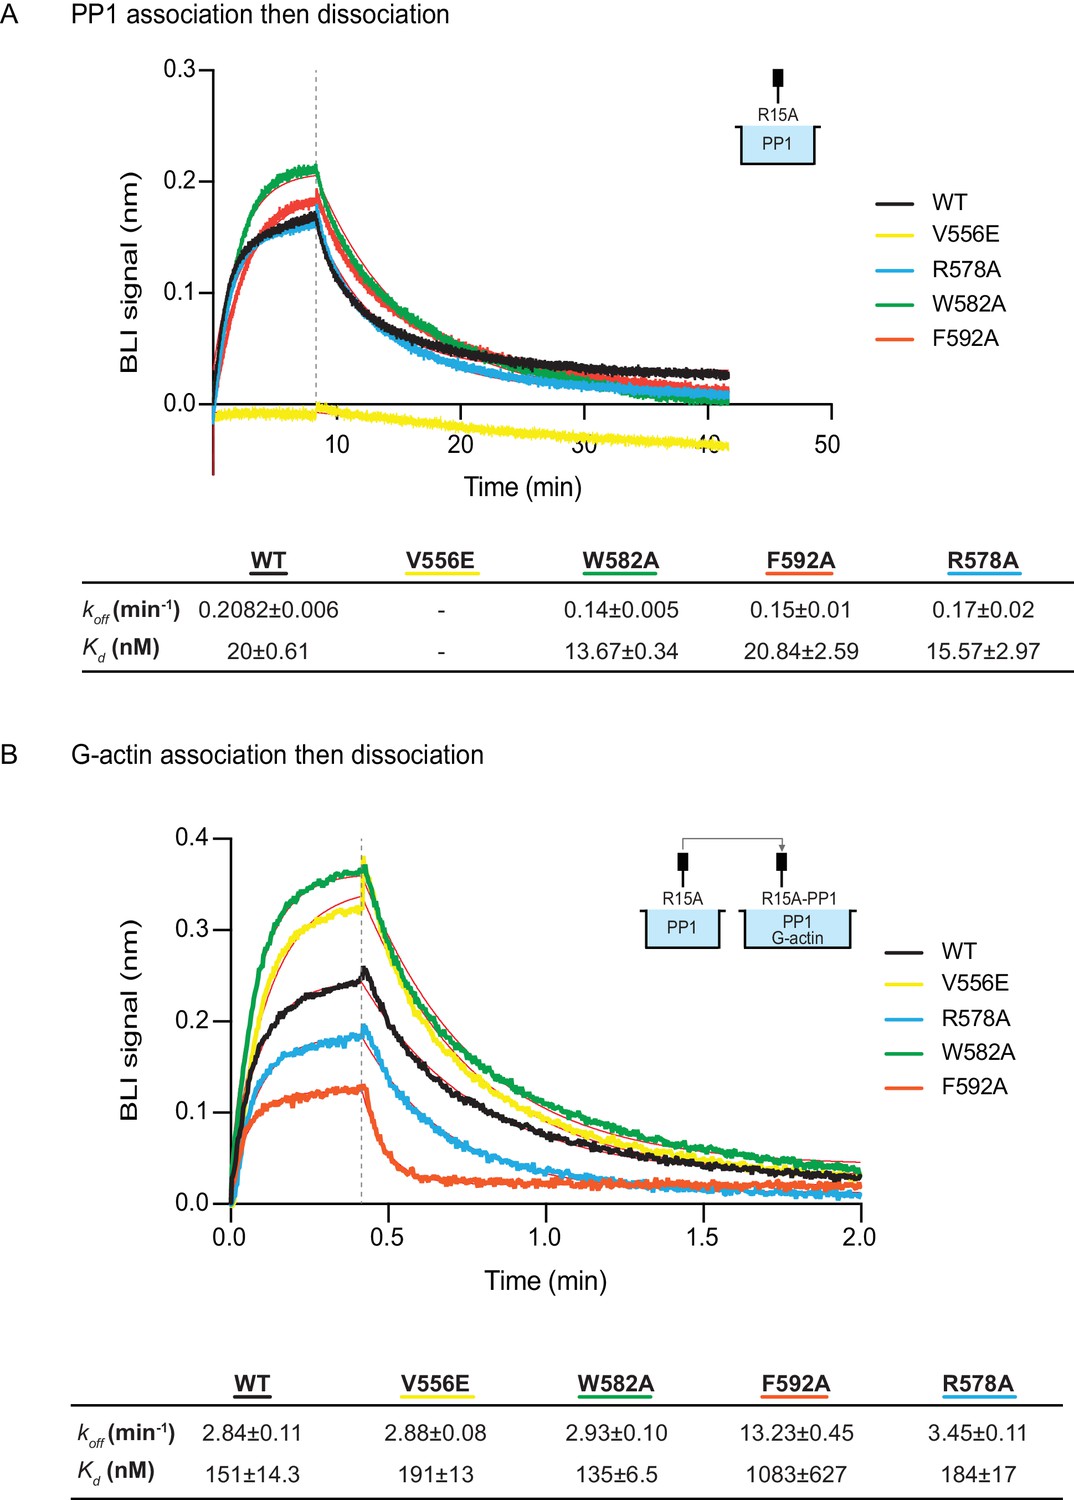
The effect of human PPP1R15A mutations on the affinity of the components of the tripartite holophosphatase for one another analysed by Bio-Layer Interferometry (BLI).
(A) Plot of Bio-Layer Interferometry (BLI) signal as a function of time in a representative experiment (repeated three times) in which immobilized wildtype and indicated mutant PPP1R15A533-624 proteins were reacted with PP1 [40 nM] in solution (thick traces). The fitting curve using ‘association then dissociation’ model in GraphPad Prism V7 is shown in thin red line. Vertical dashed line marks the beginning of the dissociation phase. Table summarizes kinetic parameters extracted from fitting curves of three repeats of the experiment shown in left panel (mean ± standard deviation). (B) As in ‘A’ above, but the immobilized wildtype and mutant PPP1R15A533-624 probes were first reacted with PP1 [200 nM], before being exposed to a solution of both PP1 [200 nM] and G-actin [400 nM]. Shown is a representative of an experiment repeated three times.
Figure 7
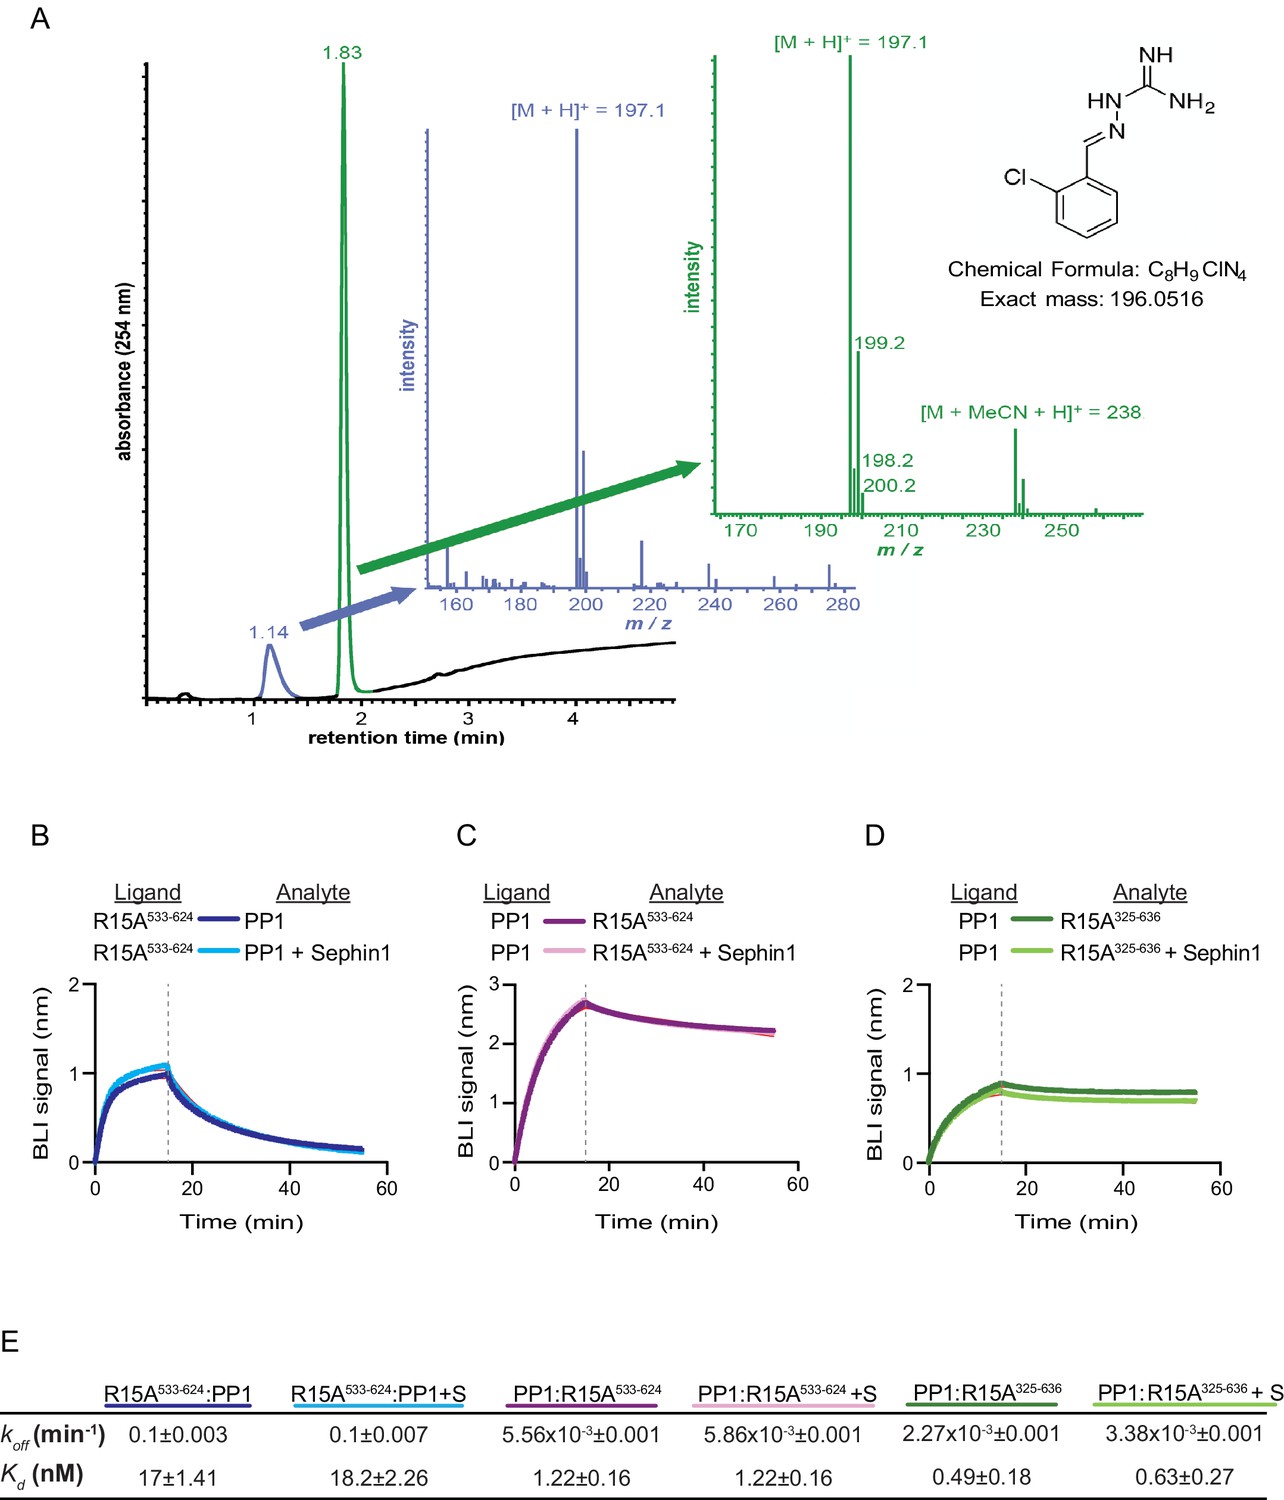
Sephin1’s effect on PP1-human PPP1R15A association analysed by Bio-Layer Interferometry (BLI).
(A) From left to right: Absorbance trace (at 254 nm) of Sephin1 resolved by reverse-phase HPLC and mass spectra of the minor early (blue) peak eluting at 1.14 min and the major later eluting (green peak) at 1.83 min. The predicted structure, chemical formula and exact mass of Sephin1, are provided for reference. (B) Plot of BLI signal as a function of time of a representative experiment (repeated three times) performed with immobilized PPP1R15A533-624 (Ligand) and PP1 [40 nM] (Analyte). Where indicated, the analyte was mixed with Sephin1 [50 µM) which was then present during the binding phase of the experiment. (C) As in ‘B’ above but with biotinylated PP1 as the ligand and PPP1R15A533-624 as the analyte, in the absence or presence of Sephin1. (D) As in ‘B’ above but with biotinylated PP1 as the ligand and PPP1R15A325-636 as the analyte, in the absence or presence of Sephin1. (E) Table summarizing data extracted from fitting curves of three repeats of the experiments shown above (mean ± standard deviation).
Figure 8 with 1 supplement
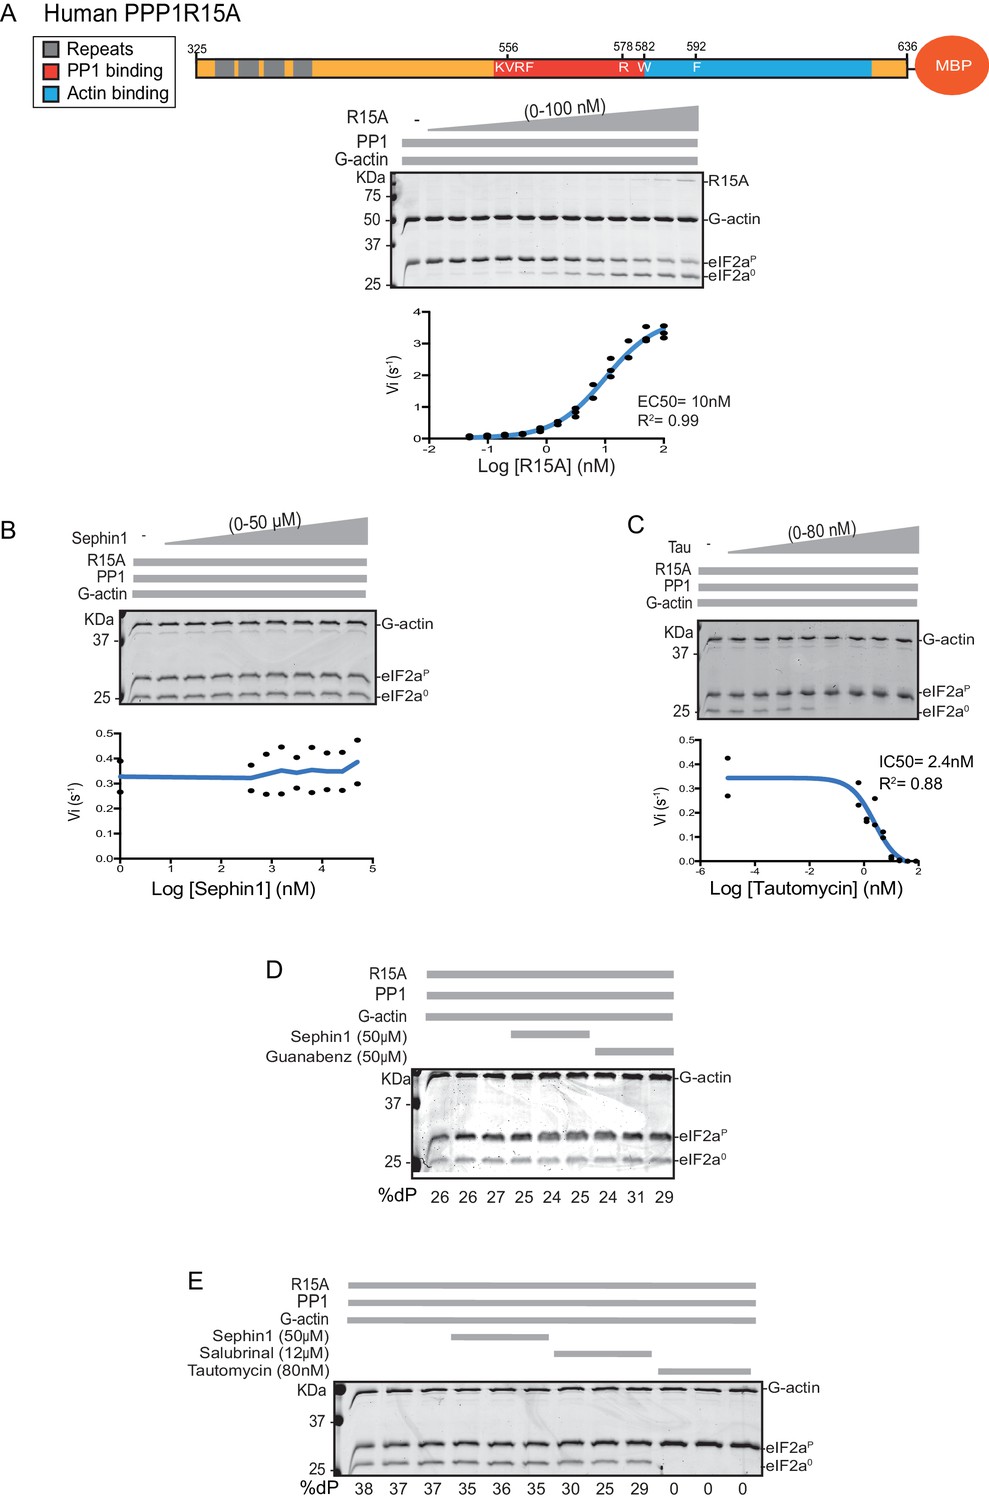
Sephin1’s effect on the eIF2α-P dephosphorylation activity of the human PP1-PPP1R15A-G-actin holophosphatase in vitro.
(A) Coomassie-stained PhosTag-SDS-PAGE tracking the dephosphorylation of eIF2αP in 20 min reactions constituted with PP1 [0.625 nM], G-actin [1.5 µM] and an escalating concentration of human PPP1R15A325-636. Shown is a representative of three independent experiments performed. A schema of the human PPP1R15A325-635 construct is shown above the gel. A semi-log10 plot of the initial velocity of eIF2αP dephosphorylation as a function of PPP1R15A325-636 concentration derived from three repeats of the experiment is shown below. The EC50 for PPP1R15A325-636 was calculated using agonist fitting function on GraphPad Prism V7. (B) As in ‘A’ above, but in the presence of a fixed concentration of PPP1R15A325-636 below the EC50 [2 nM] and escalating concentrations of Sephin1. Shown is a representative of the two independent experiments performed. Plot contains data from the two repeats. (C) As in ‘B’ above, but in the presence of an escalating concentrations of the PP1 active site inhibitor tautomycin (Tau). Shown is a representative of the two independent experiments performed. Plot contains data from the two repeats. (D) As above, triplicate reactions of eIF2α-P dephosphorylation conducted in the absence or presence of Sephin1 or the related compound, Guanabenz. (E) As in ‘D’ using Sephin1, salubrinal or tautomycin. Shown is a representative experiment, (of two repeats).
Figure 8—figure supplement 1
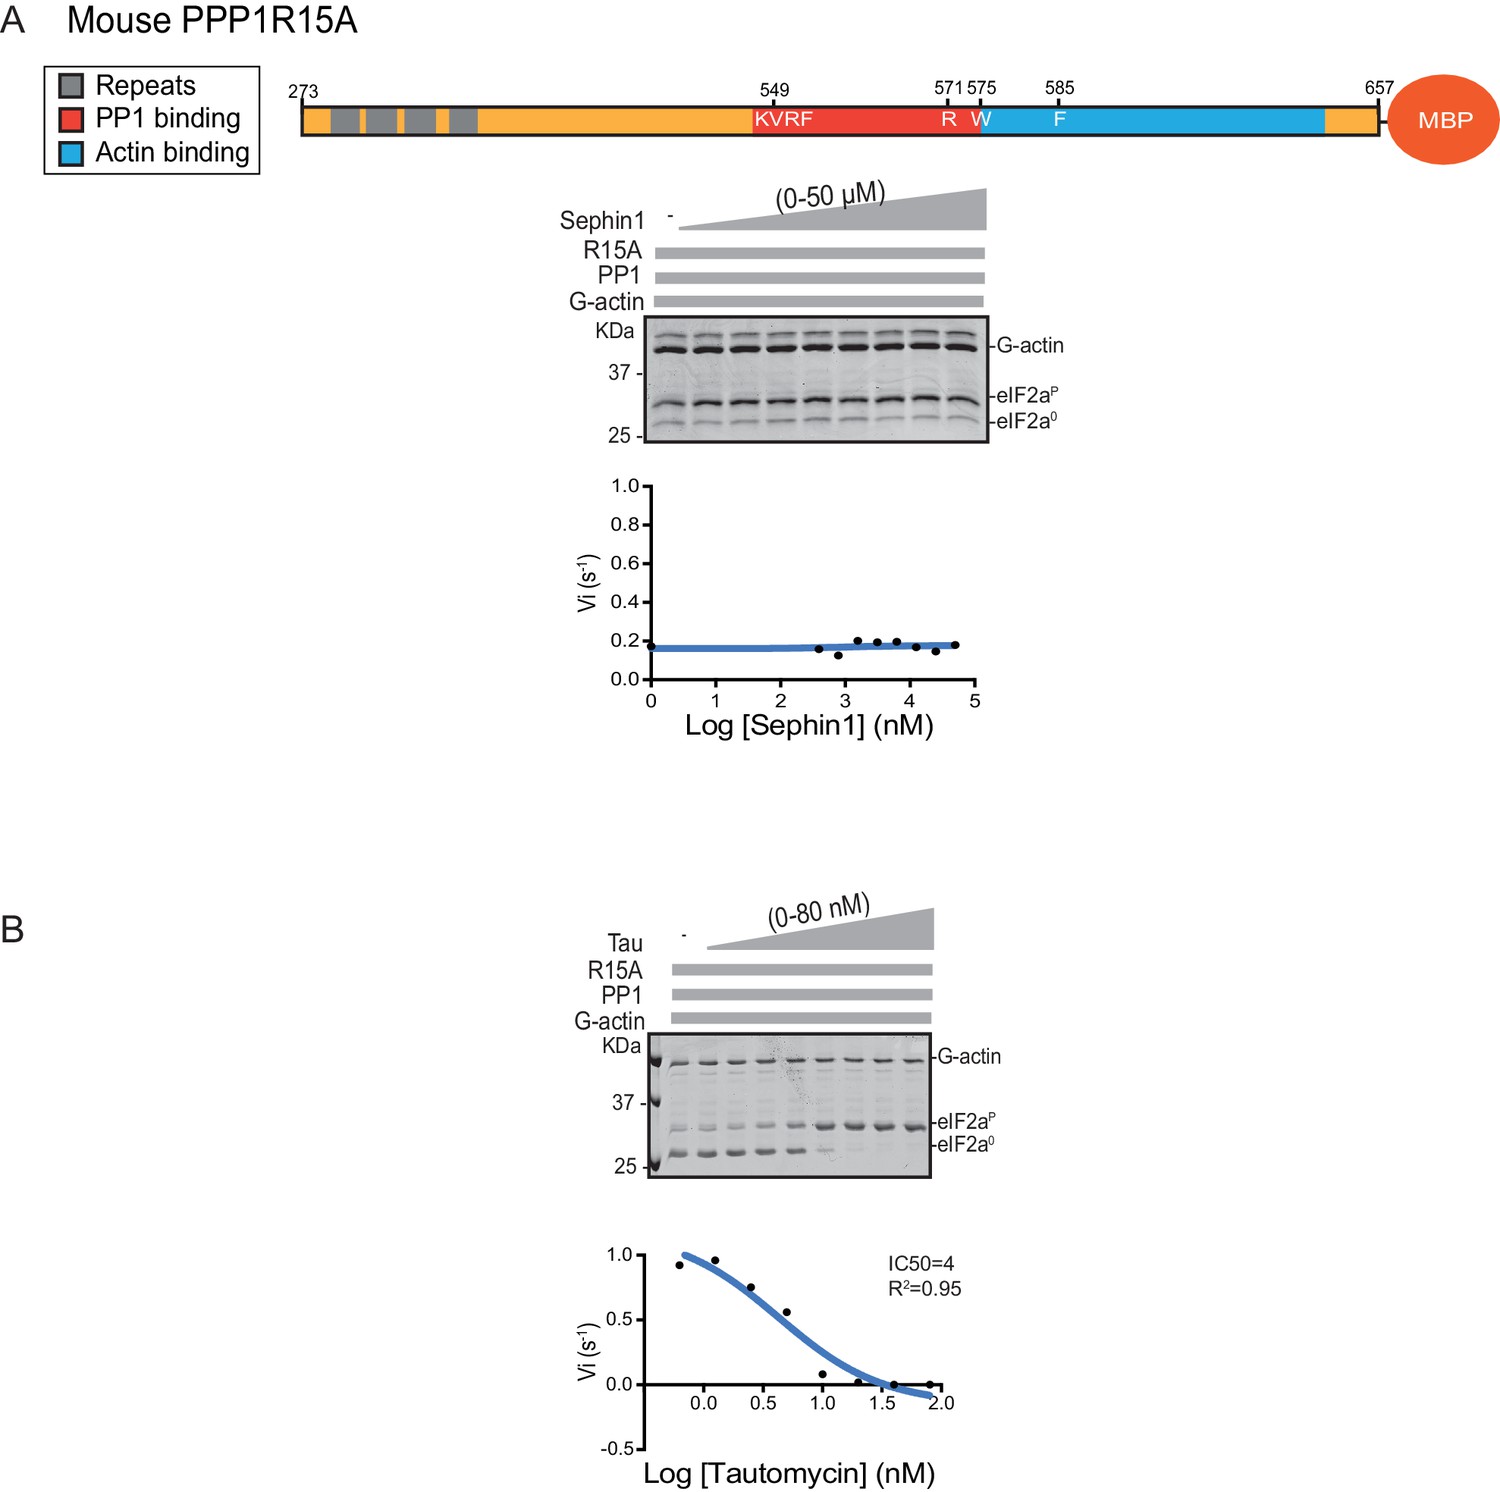
Sephin1’s effect on the eIF2α-P dephosphorylation activity of the mouse PP1-PPP1R15A-G-actin holophosphatase in vitro.
(A) Coomassie-stained PhosTag-SDS-PAGE tracking the dephosphorylation of eIF2αP in 20 min reactions constituted with mouse PPP1R15A273-657 and escalating concentrations of Sephin1. A schema of the mouse PPP1R15A273-657 construct is shown above the gel and a semi-log10 plot of the initial velocity as a function of Sephin1 concentration is shown below. (B) As in ‘A’ above, but in the presence of an escalating concentrations of the PP1 active site inhibitor tautomycin (Tau).
Figure 9 with 1 supplement
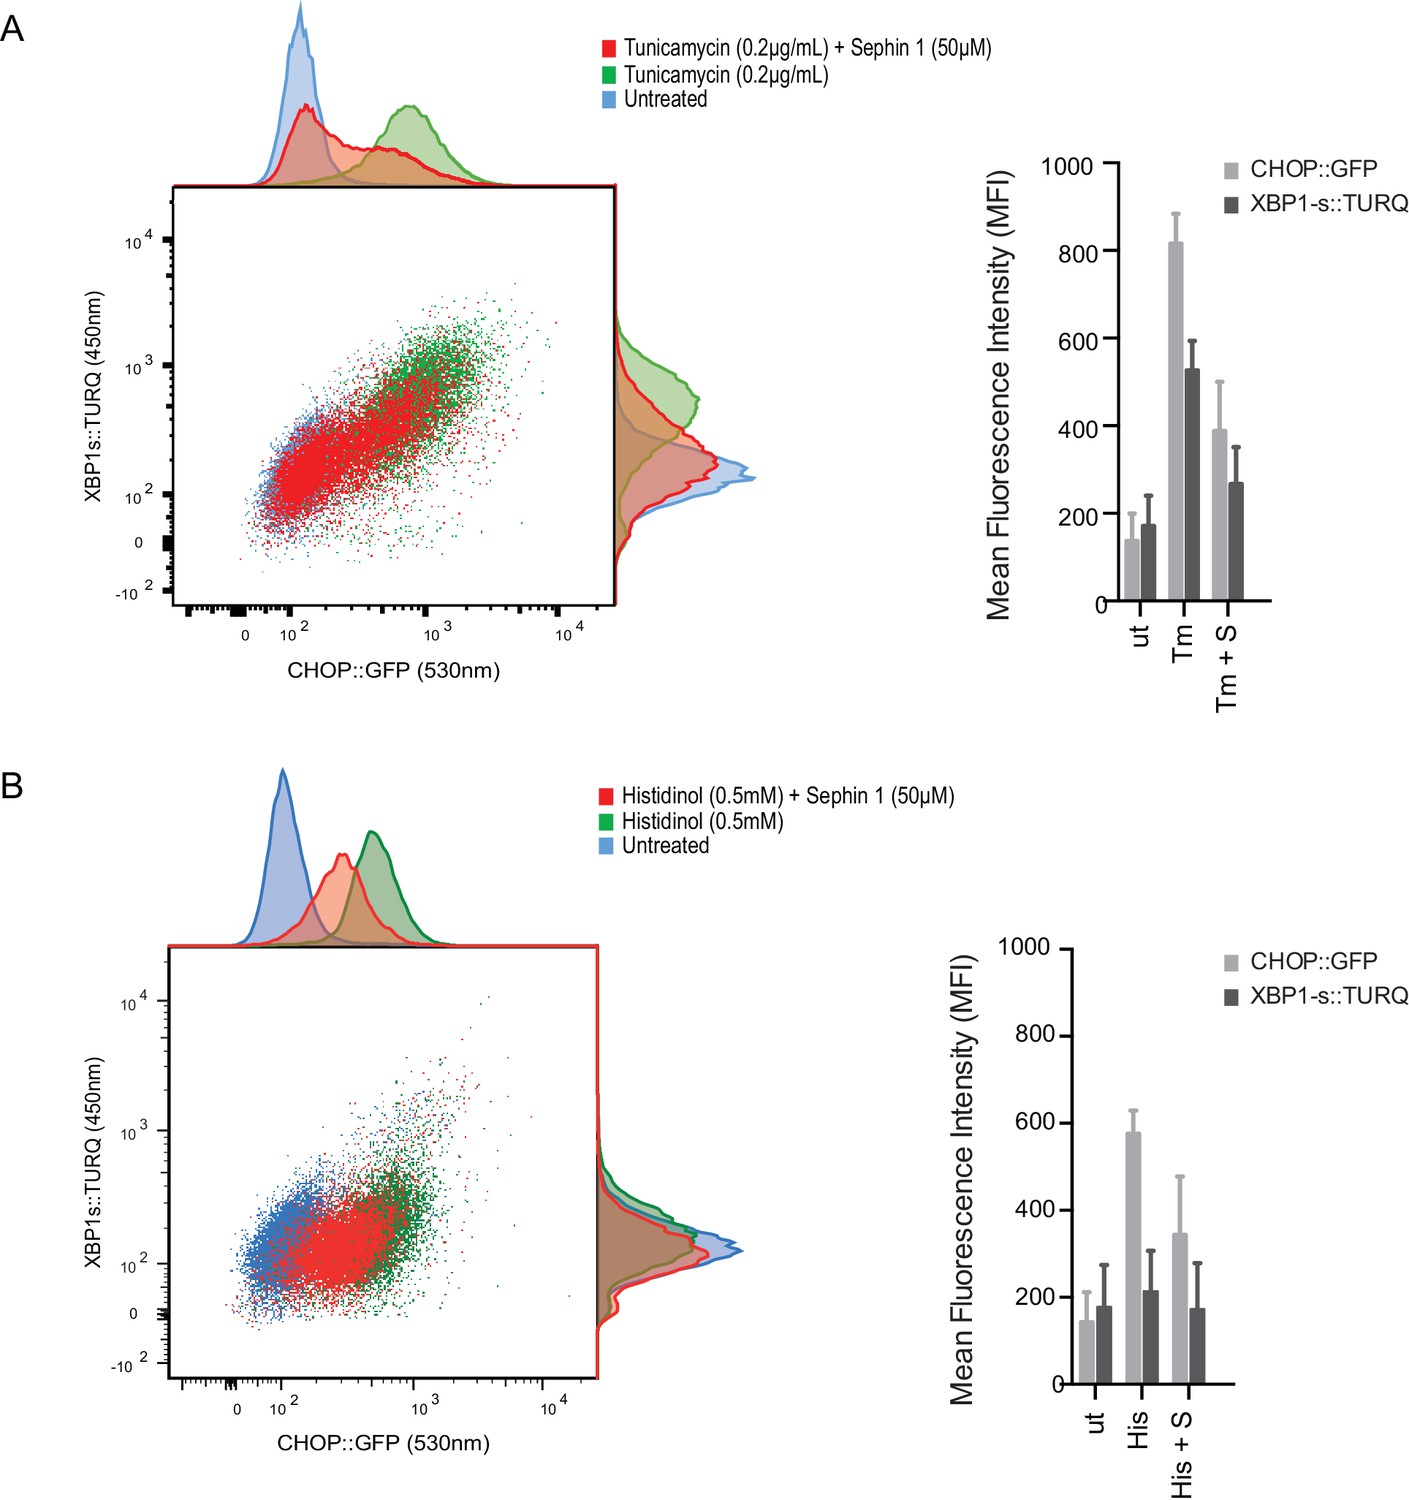
Sephin1 broadly attenuates the ER stress response in cultured CHO cells.
(A) Two-dimensional plot of the fluorescence signals derived from CHO cells stably transduced with both a CHOP::GFP reporter (on the horizontal axis, Ex: 488 nm/ Em 530 ± 30 nm; reflecting mostly ISR activity) and a XBP1::Turquoise reporter (on the vertical axis, Ex: 405 nm/ Em 450 ± 50 nm; reflecting IRE1α activity) analysed by flow cytometry. Color-coded signals from untreated cells (blue) or cells exposed to a low concentration of tunicamycin (0.2 µg/mL; 20 hr) alone (green) or together with Sephin1 (50 µM, red) are superimposed. Histograms of the distribution of the two reporter signals in the three cell populations are plotted on the corresponding axis and the mean ± CV (coefficient of variation) of the fluorescence intensity of the two reporters is depicted in the bar diagram to the right. (B) As in ‘A’ above, but the cells were exposed to histidinol, an ISR inducer that does not promote unfolded protein stress in the ER and does not activate the XBP1::Turquoise reporter. Shown is one of three independent experiments.
Figure 9—figure supplement 1
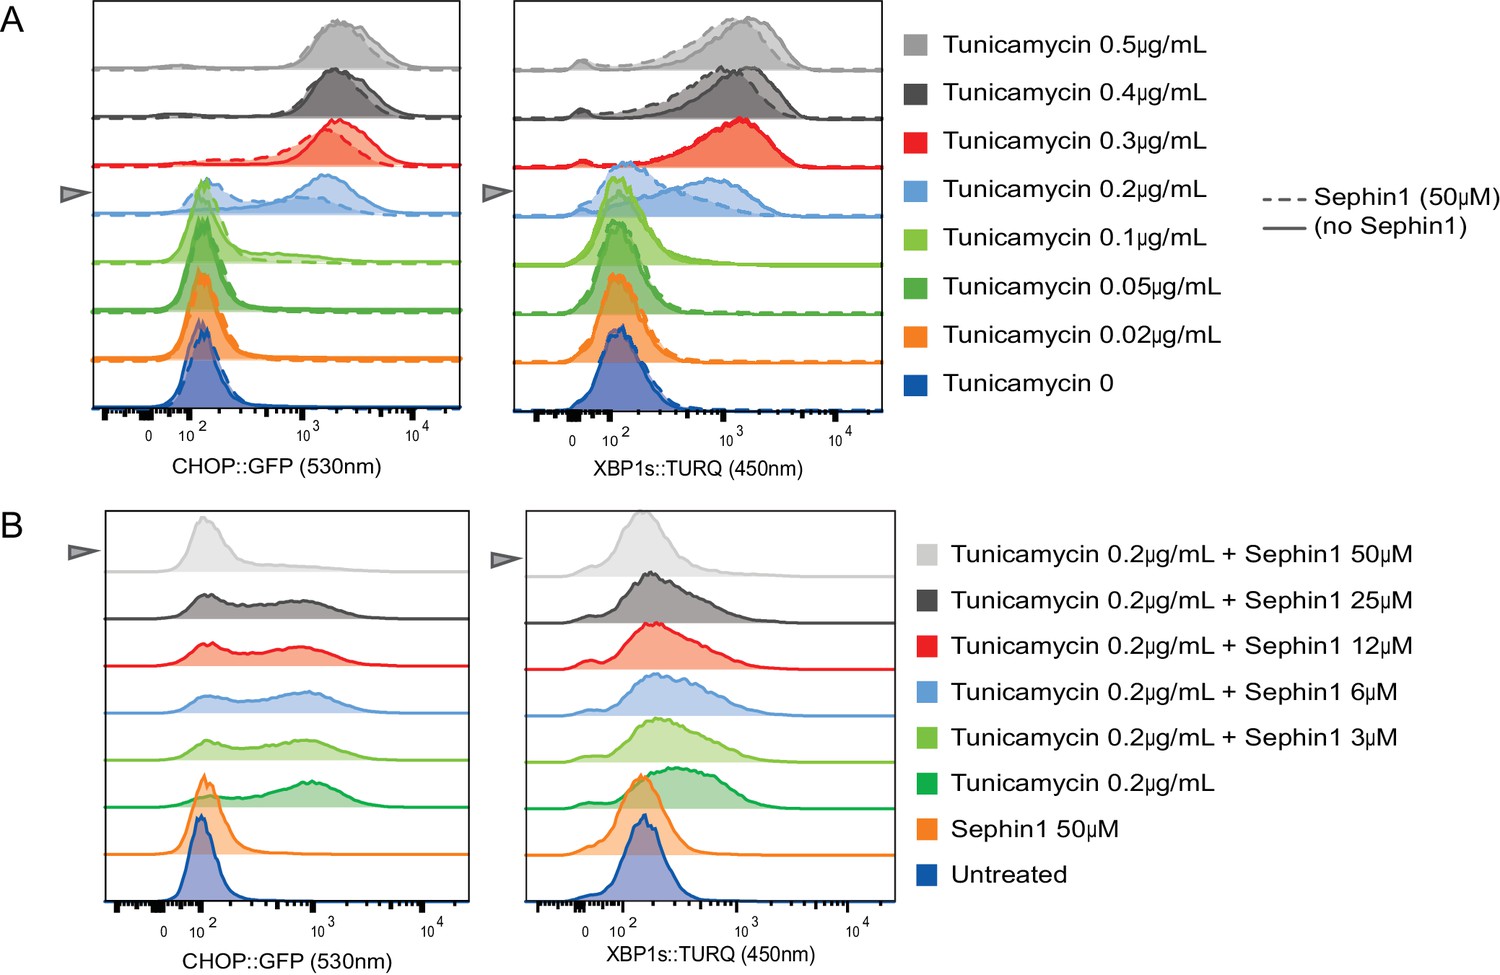
Concentration-dependence of the response of cultured cells to tunicamycin and Sephin1.
(A) Histograms of distribution of the fluorescence intensity of the CHOP:GFP reporter (left panel) and XBP1s:turquoise reporter (right panel) in populations of untreated CHO cells and cells exposed for 20 hr to the indicated concentration of tunicamycin in the absence and presence of Sephin1 (50 µM) analysed by flow cytometry. (B) As in ‘A’ above but the cells were either untreated or exposed to a fixed concentration of tunicamycin (0.2 µg/mL) and varying concentrations of Sephin1.
Figure 10 with 1 supplement
eIF2αP dephosphorylation in untreated and Sephin1-treated cells.
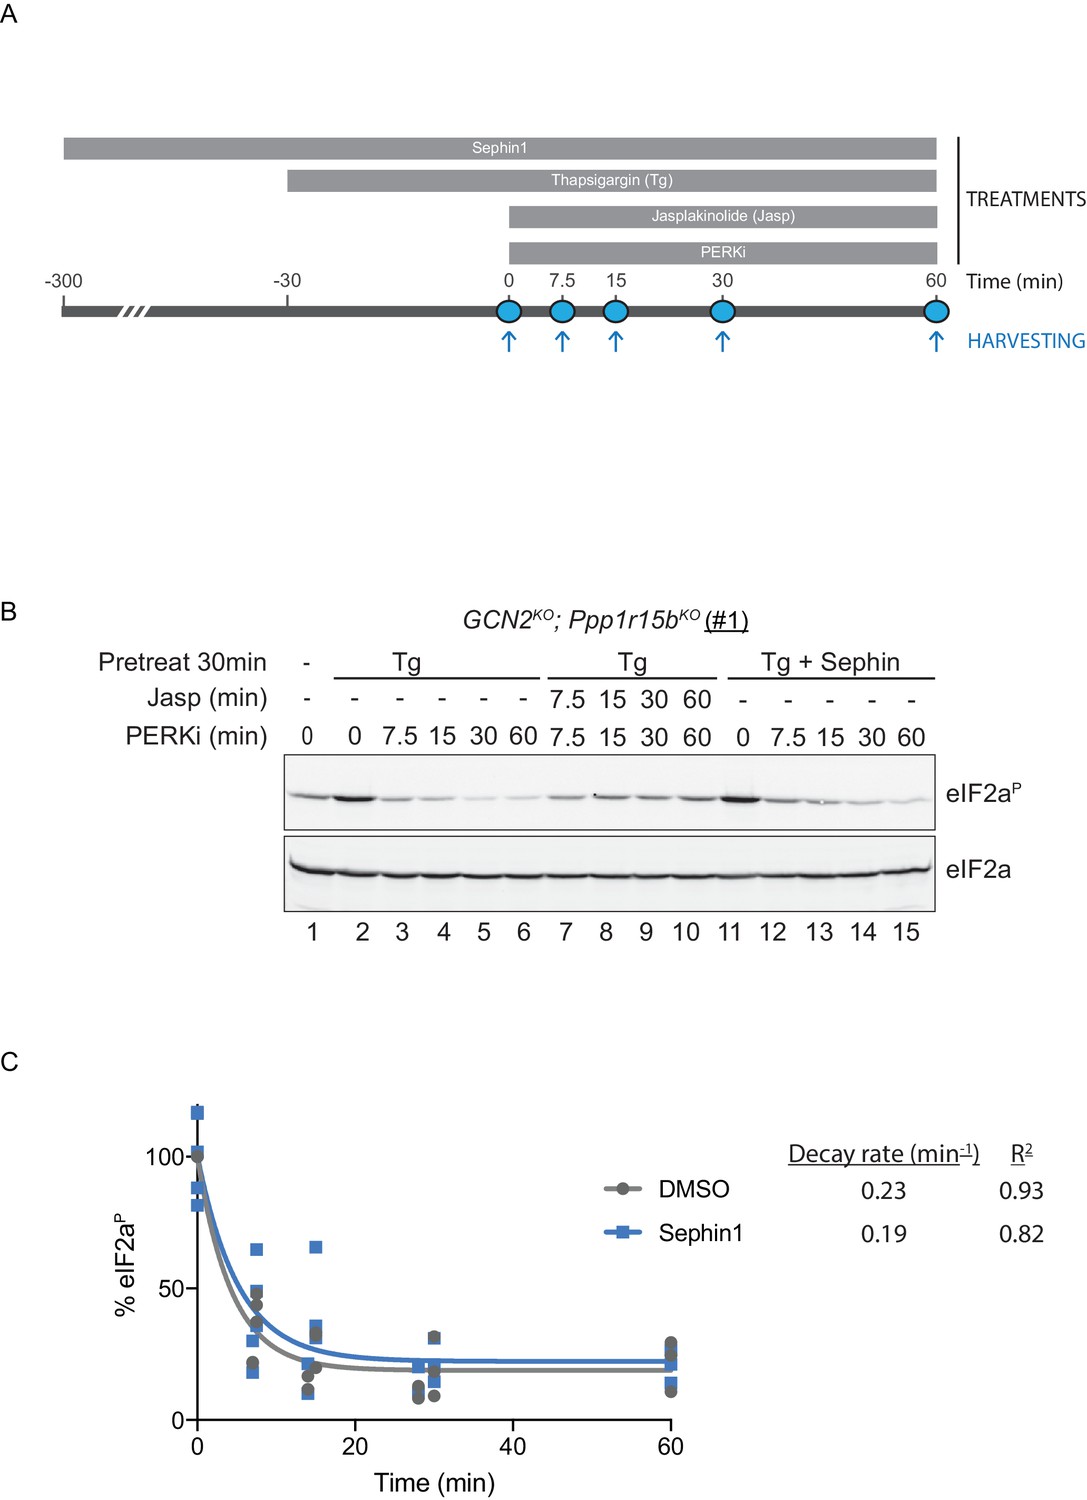
(A) Schema of the kinase shut-off experiment used to evaluate the decay of the eIF2αP signal in cells. Thapsigargin (300 nM) was added at t = −30 min to the media to activate PERK kinase and induce eIF2α phosphorylation. Sephin1 (50 µM) was introduced either at t = −30 min (alongside thapsigargin, in the experiment shown in panel B below and in Figure 10—figure supplement 1 panel C) or at t = −300 min (Figure 10—figure supplement 1 panel D). A PERK kinase inhibitor, PERKi/GSK260414A (2 µM), was added at t = 0 to visualize eIF2αP dephosphorylation at specified times. (B) Immunoblot of the time-dependent changes in the eIF2αP signal of compound-mutant Ppp1r15bKO; Gcn2KO CHO-K1 cells (clone #1) treated as in ‘A’. Where indicated, the cells were additionally exposed to Sephin1 (50 µM) or the actin-polymerizing agent Jasplakinolide (1 µM), which inhibits eIF2αP-dephosphorylation by sequestering G-actin. The immunoblot of eIF2α (lower panel) serves as a loading control. Shown is a representative experiment repeated five times. (C) Plot of the eIF2αP signal (normalised to the value at t = 0 of the vehicle only (DMSO) sample) as a function of time derived from five independent experiments. The data have been fitted to an exponential decay curve (grey solid line for the vehicle and blue solid line for the Sephin1-treated sample). The exponential decay rate and the R2 of the fit are indicated.
Figure 10—figure supplement 1
Analysis of Sephin1 in a different Ppp1r15b mutant cell line.
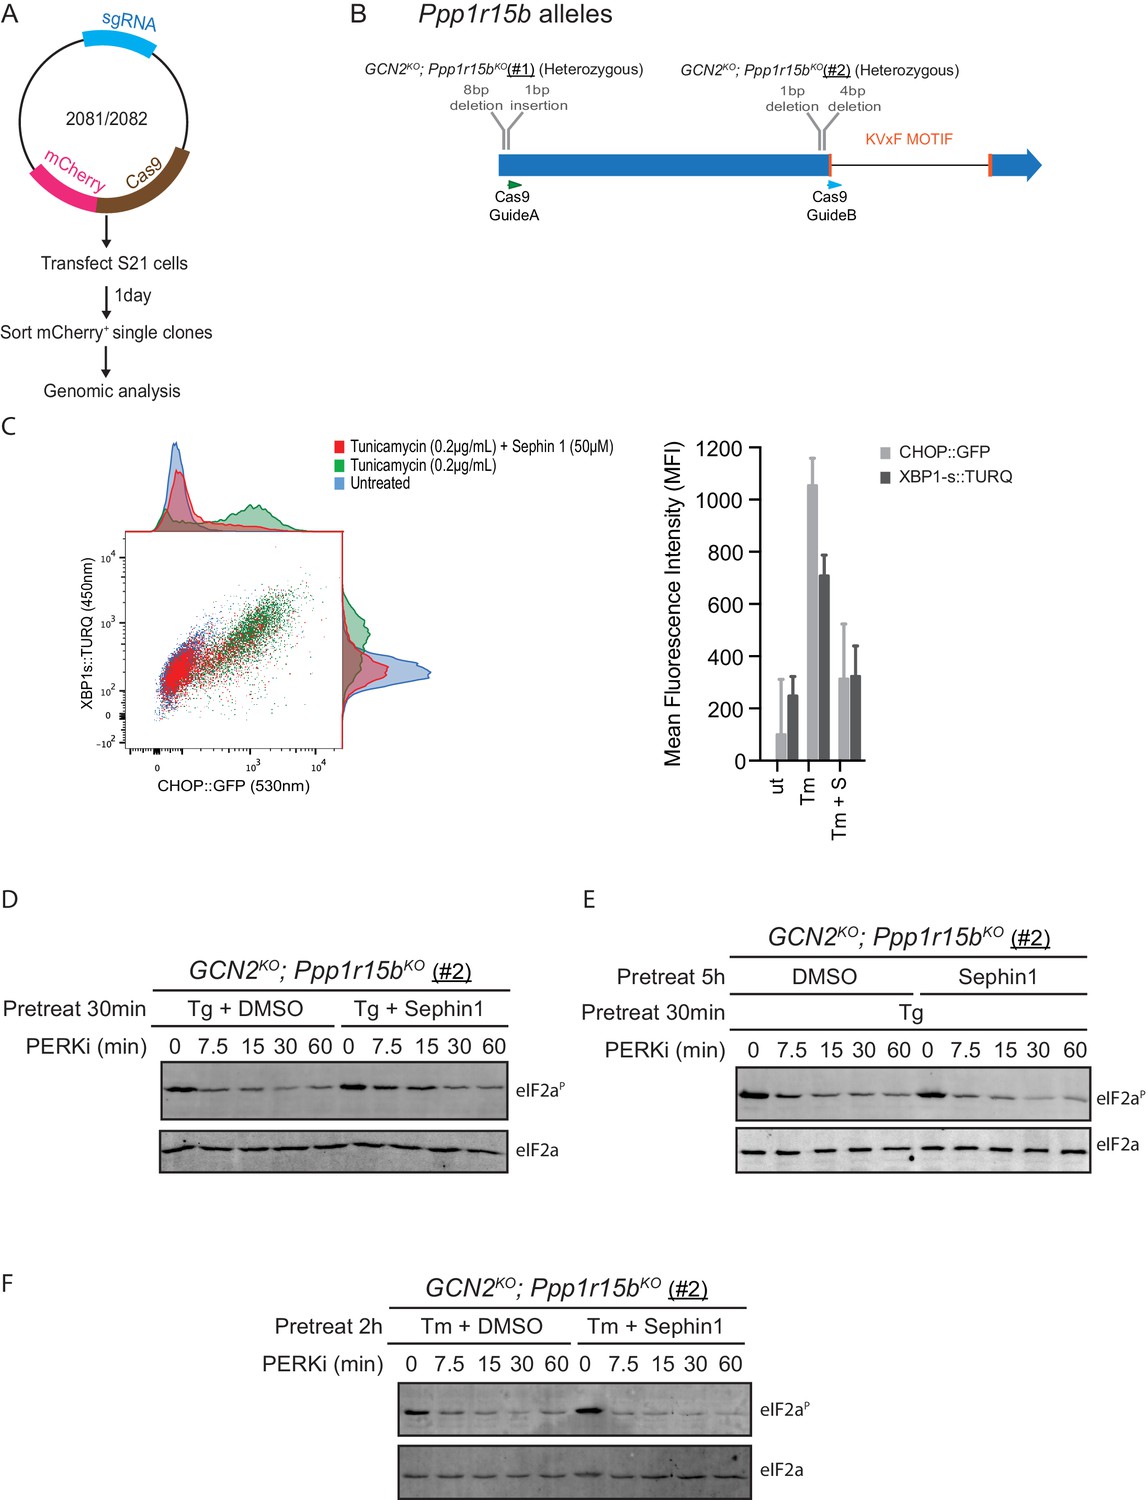
(A) Schema of the procedure to create dual reporter (CHOP::GFP, XBP1s::Turquoise) compound mutant Gcn2KO;Ppp1r15bKO CHO-K1 cells using the CRISPR-Cas9 system. (B) Schema of the mutant alleles. The two coding exons of wildtype hamster Ppp1r15b are denoted as is the region encoding the PP1-binding RVxF motif (KVTF, in PPP1R15B) and the positions of the guide RNAs used to direct the Cas9-mediated double strand breaks. (C) Two-dimensional plot and histograms of the fluorescent signal of the CHOP::GFP and XBP1s::Turquoise reporters in compound Ppp1r15bKO; Gcn2KO CHO-K1 cells (clone #2). Where indicated, the cells were exposed to a low concentration of tunicamycin (0.2 µg/mL; 20 hr) alone or together with Sephin1 (50 µM). The mean ± CV (coefficient of variation) of the fluorescence intensity of the two reporters is displayed in the bar diagram. Shown is one of three independent experiments. (D) As in ‘Figure 10B' but using Ppp1r15bKO; Gcn2KO (clone #2). (E) As in ‘D’ above, but Sephin1 pretreatment was extended to 5 hr, before the kinase shut-off procedure, and continued throughout. (F) As in ‘D’ above, but substituting tunicamycin (2.5 µg/mL; 2 hr) for thapsigargin as the PERK inducer. Shown is a representative experiment (of two repeats).
Figure 11 with 1 supplement
Cells lacking PPP1R15A remain responsive to Sephin1.
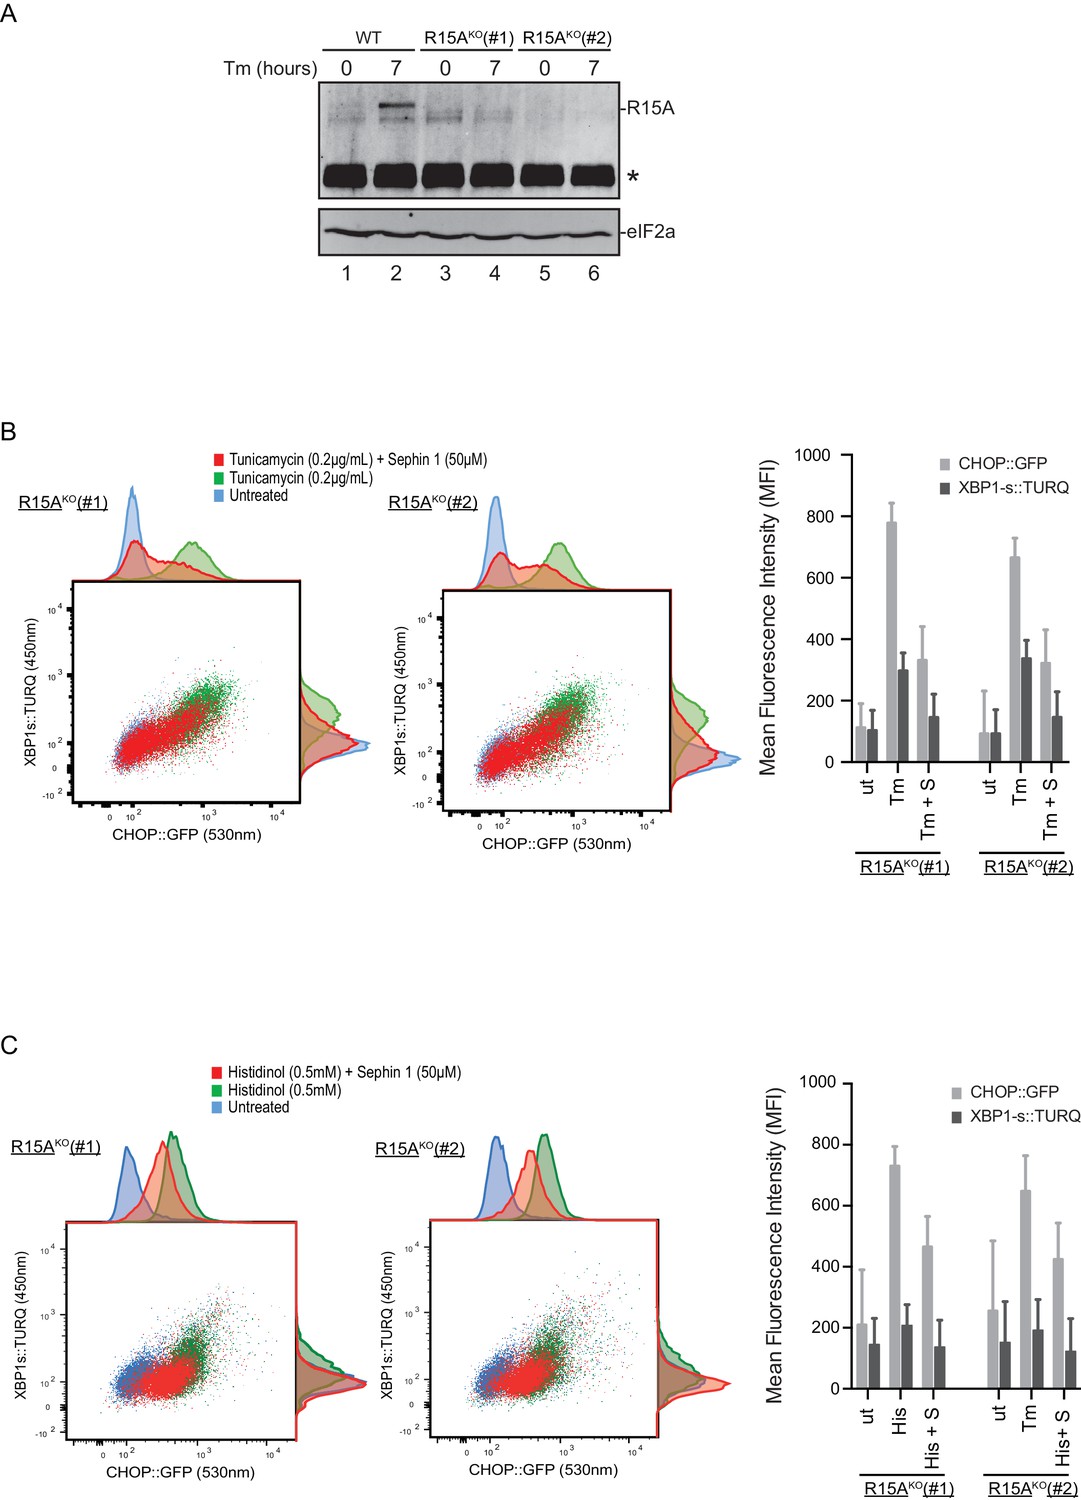
(A) Immunoblot of endogenous PPP1R15A recovered by immunoprecipitation (using an anti-PPP1R15A antibody conjugated to Protein A Sepharose) from untreated and tunicamycin exposed parental cells and cells from two different Ppp1r15aKO CHO-K1 clones. The position of PPP1R15A is indicated and the immunoglobulin heavy-chain is marked with an asterisks. The immunoblot of eIF2α (lower panel) serves as a loading control for the content of cellular protein in the lysates. (B) Two-dimensional plot and histograms of the fluorescent signal of the CHOP::GFP and XBP1s::Turquoise reporters in the two Ppp1r15aKO CHO-K1 clones. Where indicated, the cells were exposed to a low concentration of tunicamycin (0.2 µg/mL; 20 hr) alone or together with Sephin1 (50 µM). The mean ± CV (coefficient of variation) of the fluorescence intensity of the two reporters in each of the two clones is displayed in the bar diagram. Shown is one of three independent experiments. (C) As in ‘C’ above, but cells were exposed to histidinol. Shown is one of three independent experiments.
Figure 11—figure supplement 1
Mutant Ppp1r15a alleles.
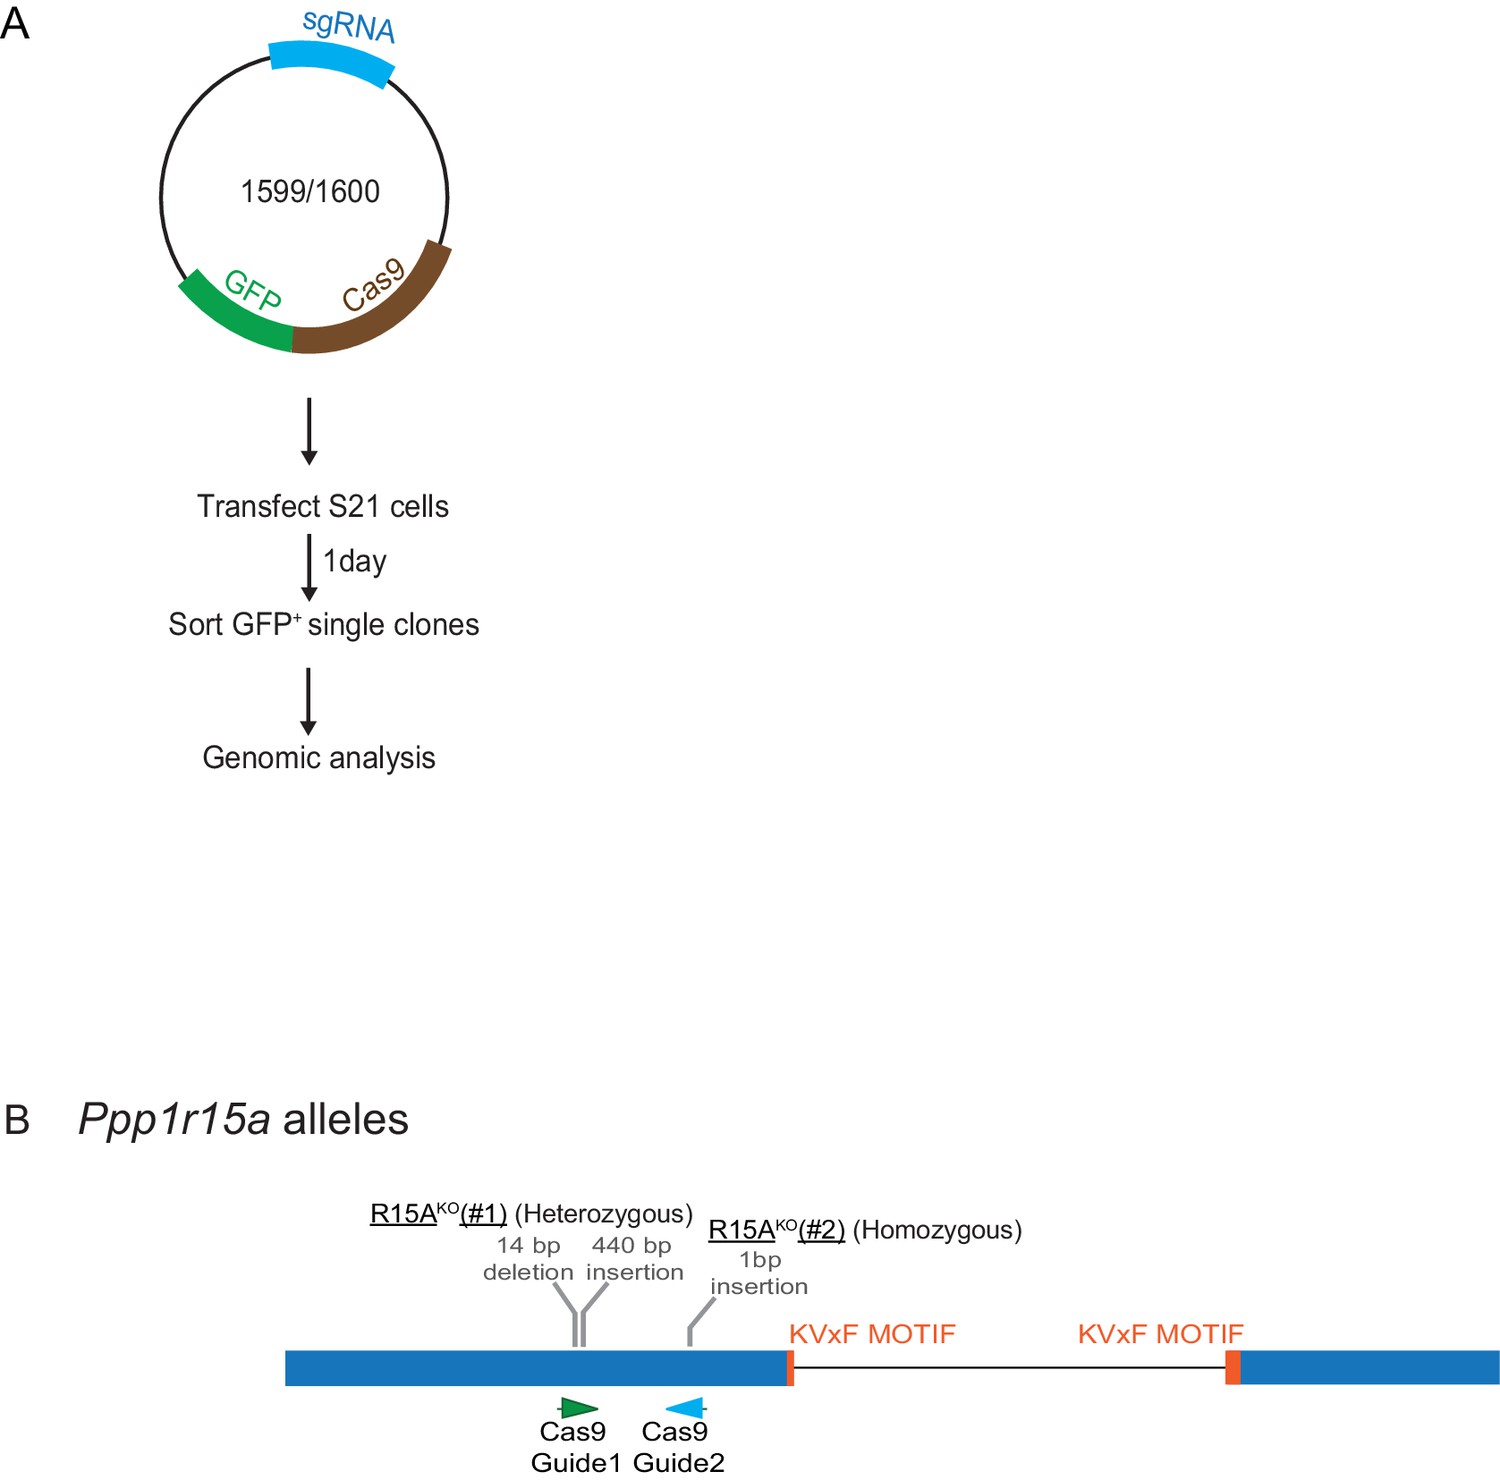
(A) Schema of the procedure to create dual reporter (CHOP::GFP, XBP1s::Turquoise) Ppp1r15aKO CHO-K1 cells using the CRISPR-Cas9 system. (B) Schema of the mutant alleles. The two coding exons of wildtype hamster Ppp1r15a are denoted as is the region encoding the crucial RVxF motif (KVHF, in PPP1R15A) and the positions of the guide RNAs used to direct the Cas9-mediated double strand breaks.
Figure 12
ISR-deficient Eif2s1S51A (eIF2αS51A) cells retain their responsiveness to Sephin1.
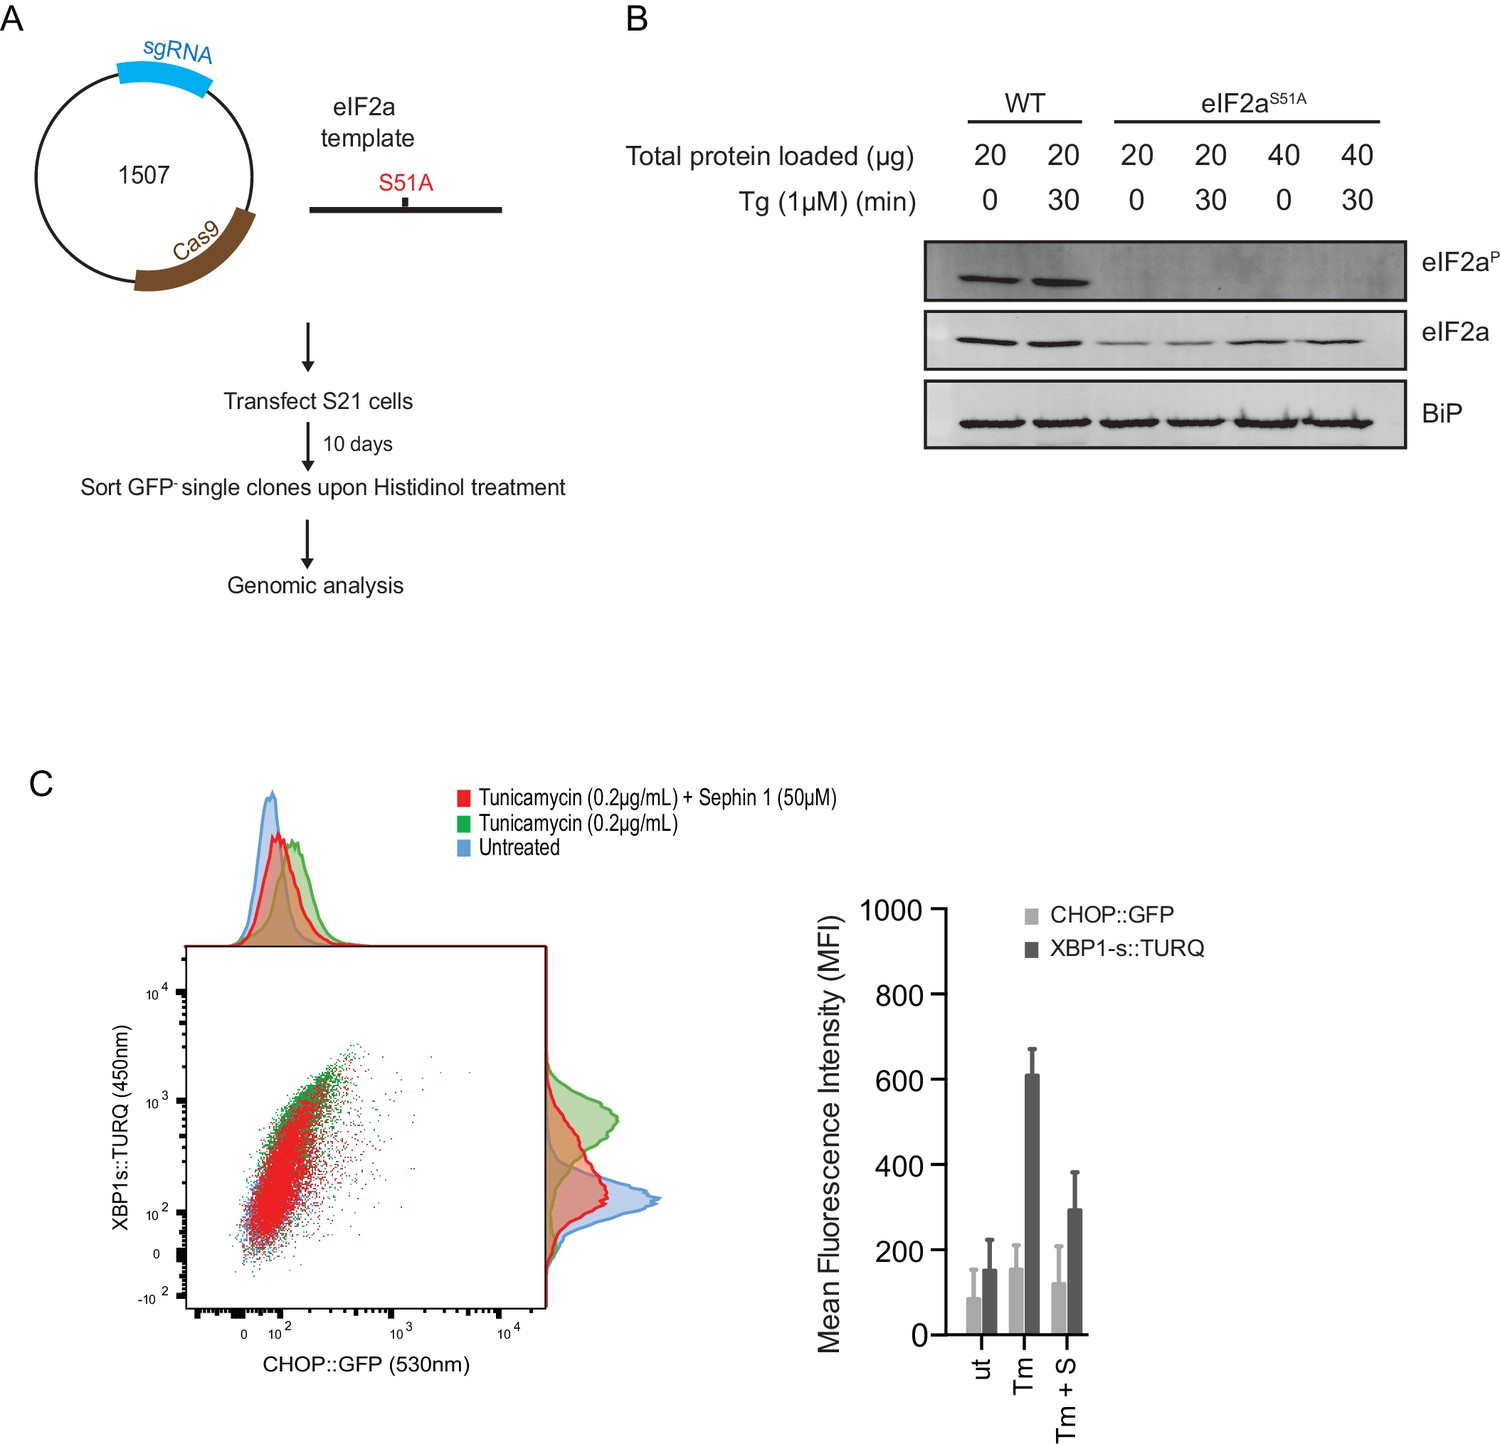
(A) Schematic representation of procedure used to create dual reporter (CHOP::GFP, XBP1s::Turquoise) Eif2s1S51A (eIF2αS51A) CHO-K1 cells using CRISPR-Cas9 system. (B) Immunoblot of CHO-K1 cell lysates using anti- eIF2αP (upper panel), anti- eIF2α (middle panel) and anti-BiP (lower panel) antibodies. Two-fold more cell lysate was loaded onto lanes 5 and 6 to compensate for the lower eIF2α content of the haploid mutant Eif2s1S51A cells. (C) Two-dimensional plot and histograms of the fluorescent signal of the CHOP::GFP and XBP1s::Turquoise reporters in the Eif2s1S51A CHO-K1 cells. Where indicated, the cells were exposed to a low concentration of tunicamycin (0.2 µg/mL; 20 hr) alone or together with Sephin1 (50 µM). The mean ± CV (coefficient of variation) of the fluorescence intensity of the two reporters in each of the two clones is displayed in the bar diagram. Shown is representative experiment of two independent experiments performed. Note the blunted expression of CHOP::GFP wrought by the ISR-defect imposed by the Eif2s1S51A mutation.
Tables
Table 1
Plasmids used.
| Lab number | Lab name | Description | Reference |
|---|---|---|---|
| UK105 | eIF2a-NM_pET30a | His6-tagged mouse eIF2a 1–185 pET-30a(+)" | PMID 15341733 |
| UK168 | PerkKD-pGEX4T-1 | Bacterial expression plasmid for mouse PERK kinase domain | PMID 9930704 |
| UK622 | PGV_PP1G_1–323_V1 | Bacterial expression plasmid forfull-length PP1 phosphatase catalytic domain | PMID 25774600 |
| UK1359 | pSpCas9(BB)−2A-GFP | Mammalian expression of GFP-tagged Cas9 and single guide RNA to introduce double strand breaks (Addgene 48138) | PMID 24157548 |
| UK1367 | pSpCas9(BB)−2A-Puro | Mammalian expression of Puror-tagged Cas9 and single guide RNA to introduce double strand breaks (Addgene 48138) | PMID 24157549 |
| UK1497 | CHO_EIF2K4_guideA*_pSpCas9(BB)−2A-Puro | Puro-tagged CRISPR for targeting human CHO GCN2(EIF2K4) gene | This paper |
| UK1507 | CHO_Eif2s1_guideC_pSpCas9(BB)−2A-Puro | A single guide gRNA plasmid for eIF2a (EIF2S1) locus | This paper |
| UK1599 | CHO_PPP1R15A_guide1_pSpCas9(BB)−2A-GFP | A single guide gRNA plasmid for GADD34 locus | This paper |
| UK1600 | CHO_PPP1R15A_guide2_pSpCas9(BB)−2A-GFP | A single guide gRNA plasmid for GADD34 locus | This paper |
| UK1610 | pSpCas9(BB)−2A-mCherry_V2 | modified pSpCas9(BB)−2A vector to express mCherry together with guide RNA and Cas9 | This paper |
| UK1645 | GST_Myd116_273–657_malE_pGEX_TEV | Bacterial expression of GST-mouse GADD34 273–657 -MBP | This paper |
| UK1677 | huPPP1R15A_325_636_malE_pGEX_TEV | Bacterial expression of GST-human GADD34- MBP | This paper |
| UK1881 | EcBirA_WT_pGEX_TEV (MP1) | Bacterial expression of fastidious E. coli BirA biotin ligase (R118 intact) | This paper |
| UK1897 | mPP1G_1–323_pGEX_TEV_AviTag (MP2) | Bacterial expression GST_TEV_AviTag_FL mPP1G with non-tempaled C-term LE | This paper |
| UK1920 | huPPP1R15A_533_624_malE_pGEX_TEV_AviTag (MP1) | Bacterial-expression plasmid for N-tern AviTagged human GADD34 533–624 | This paper |
| UK1921 | huPPP1R15A_325_636_malE_pGEX_TEV_AviTag (MP4) | Bacterial-expression plasmid for N-tern AviTagged human GADD34 325–624 | This paper |
| UK1992 | huPPP1R15A_I596A_533_624_malE_pGEX_TEV_AviTag | Bacterial-expression plasmid for N-term AviTagged human GADD34 533–624, I596A mutation | This paper |
| UK1993 | huPPP1R15A_V556E_R578A_533_624_malE_pGEX_TEV_AviTag | Bacterial-expression plasmid for N-term AviTagged human GADD34 533–624, v556e R578A mutation | This paper |
| UK1994 | huPPP1R15A_V556E_533_624_malE_pGEX_TEV_AviTag | Bacterial-expression plasmid for N-term AviTagged human GADD34 533–624, v556e mutation | This paper |
| UK1995 | huPPP1R15A_F592A_533_624_malE_pGEX_TEV_AviTag | Bacterial-expression plasmid for N-term AviTagged human GADD34 533–624, F592A mutation | This paper |
| UK2081 | CHO_PPP1R15B_guideA_pSpCas9(BB)−2A-mCherry_V2 | guide targeting cgPPP1R15B (hamster CReP) gene 5' end of exon1 | This paper |
| UK2082 | CHO_PPP1R15B_guideB_pSpCas9(BB)−2A-mCherry_V2 | guide targeting cgPPP1R15B (hamster CReP) gene 3' end of exon 1 | This paper |
Download links
A two-part list of links to download the article, or parts of the article, in various formats.
Downloads (link to download the article as PDF)
Open citations (links to open the citations from this article in various online reference manager services)
Cite this article (links to download the citations from this article in formats compatible with various reference manager tools)
PPP1R15A-mediated dephosphorylation of eIF2α is unaffected by Sephin1 or Guanabenz
eLife 6:e26109.
https://doi.org/10.7554/eLife.26109


