The conserved RNA helicase YTHDC2 regulates the transition from proliferation to differentiation in the germline
- Stanford University School of Medicine, United States
- Academic Medical Center, University of Amsterdam, Netherlands
Figures
Figure 1 with 1 supplement
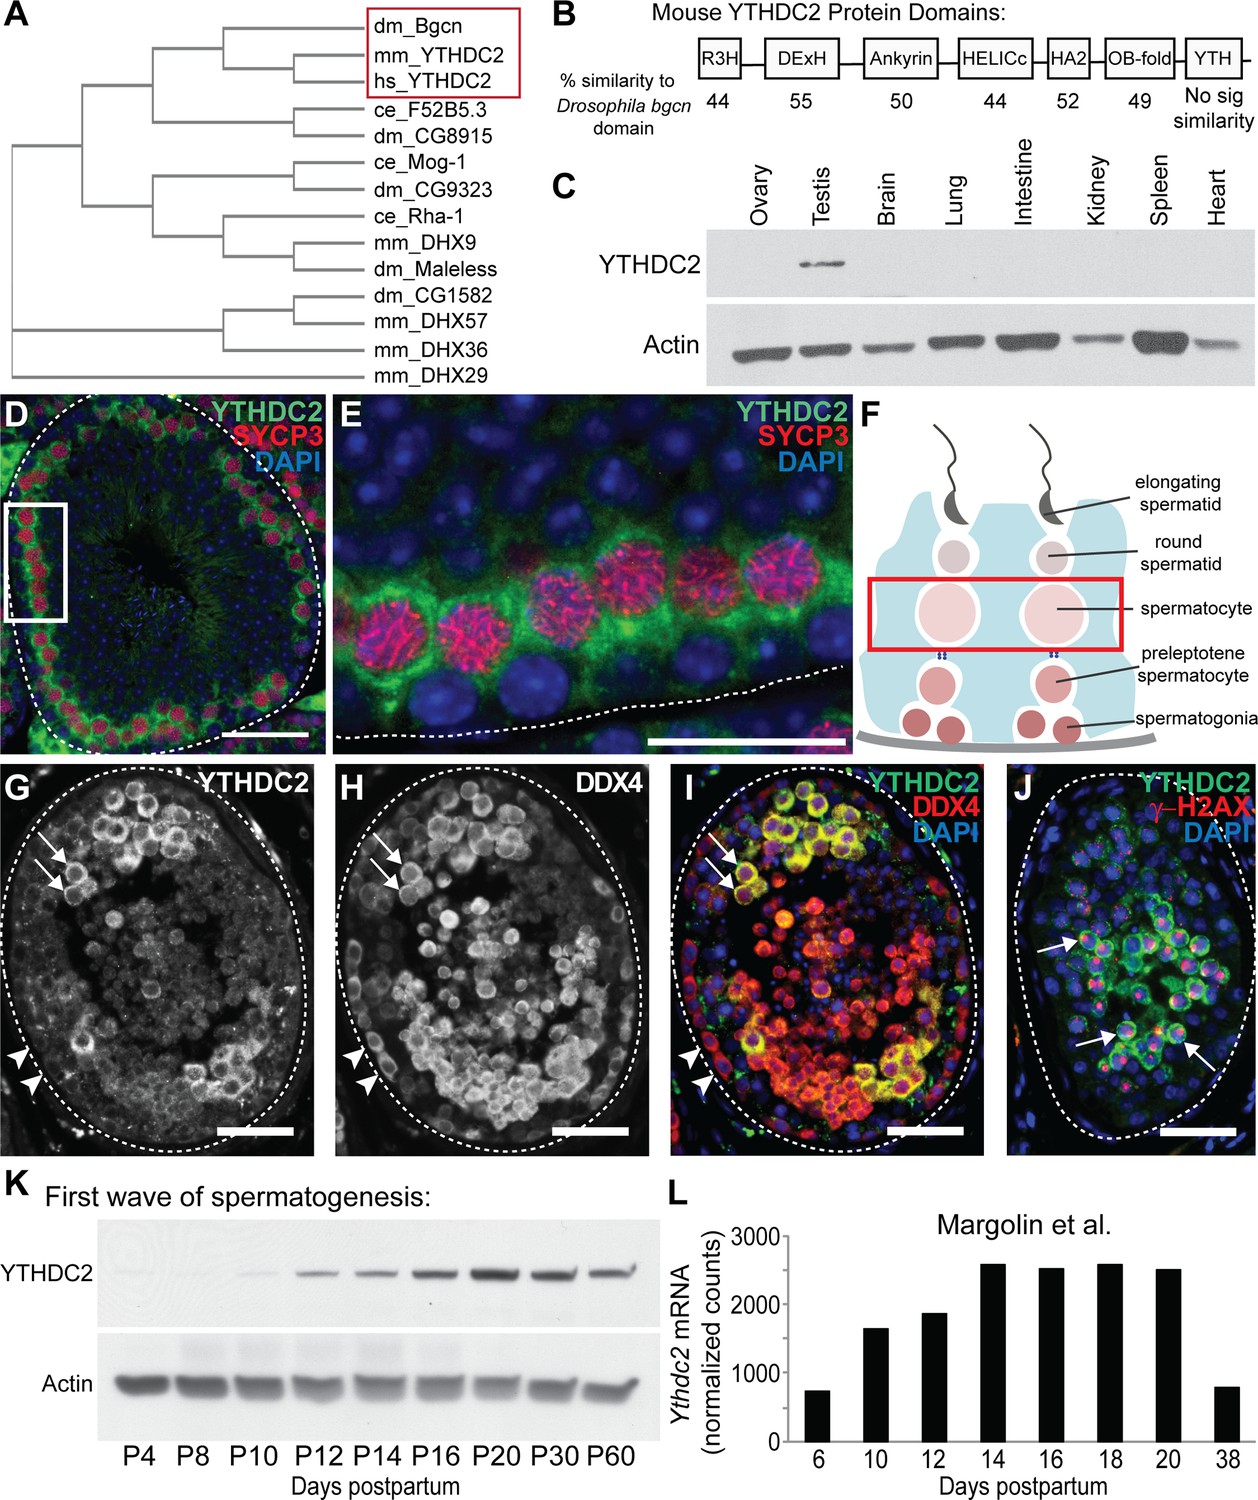
A DExH box helicase conserved from Drosophila to mammals is expressed in male germ cells entering meiosis.
(A) Cladogram of Bgcn-related proteins in Drosophila melanogaster (dm), Mus musculus (mm), Homo sapiens (hs) and Caenorhabditis elegans (ce). Protein sequences from the NCBI protein database. (B) Mouse YTHDC2 protein domains, with percent similarity between mouse YTHDC2 and the corresponding domain of Drosophila Bgcn for each domain region. (C) Expression of YTHDC2 protein in adult mouse tissues. Western blots probed with α-YTHDC2 or α-Actin. (D) Immunofluorescence images of adult wild-type mouse testis tubule cross-section stained for YTHDC2 (green), SYCP3 (red) and DAPI (blue). (E) High magnification of boxed region in panel D. White dotted line: outline of testis tubule. (F) Diagram of cell stages of spermatogenesis in the testis tubule. Red box: spermatocytes, which express high levels of YTHDC2 protein. (G–I) Immunofluorescence images of adult human testis tubule cross-section stained for (G) YTHDC2 and (H) DDX4. (I) Merged image. Arrowheads: YTHDC2-negative germ cells along tubule periphery. Arrows: YTHDC2-positive germ cells. White dotted line: outline of testis tubule. (J) Adult human testis tubule stained for YTHDC2 (green), γ-H2AX (red), and DAPI (blue). Arrows: YTHDC2-positive pachytene spermatocyte. (K) Expression of YTHDC2 protein in whole testis samples from mice during the first wave of spermatogenesis. Western blots probed with α-YTHDC2 or α-Actin. P, Postnatal. (L) Normalized Ythdc2 RNA expression during the first wave of spermatogenesis from (Margolin et al., 2014). Scale bars: (D and G–J) 50 μm; (E) 25 μm. See also Figure 1—figure supplement 1.
Figure 1—figure supplement 1
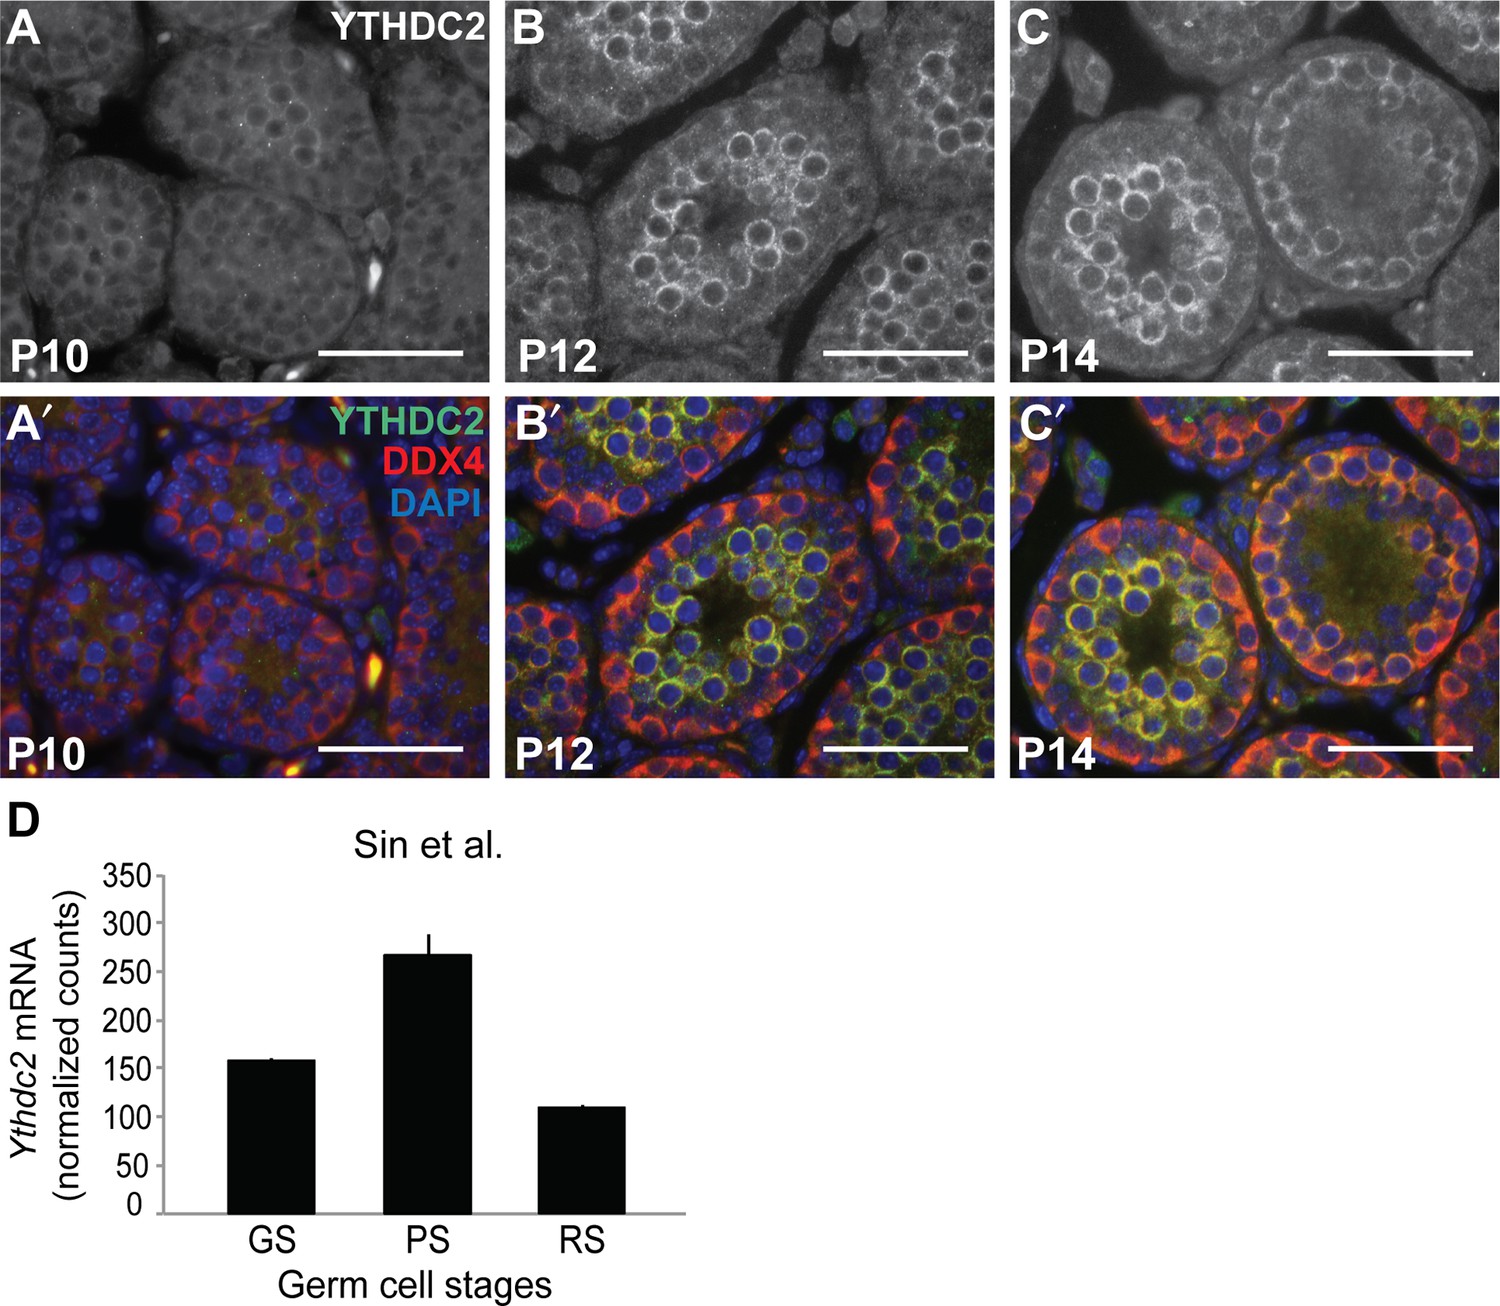
YTHDC2 expression during the first wave of spermatogenesis.
(A-C′) Immunofluorescence images of wild-type seminiferous tubule cross-sections from (A, A′) P10, (B, B′) P12, and (C, C′) P14 testes stained for YTHDC2 (white above, green below), DDX4 (red) and DAPI (blue). (D) Normalized Ythdc2 RNA expression in sorted cell populations (Sin et al., 2015). GS: germline stem cells; PS: pachytene spermatocytes; RS: round spermatids. Scale bars: (A-C′) 50 μm.
Figure 2 with 2 supplements
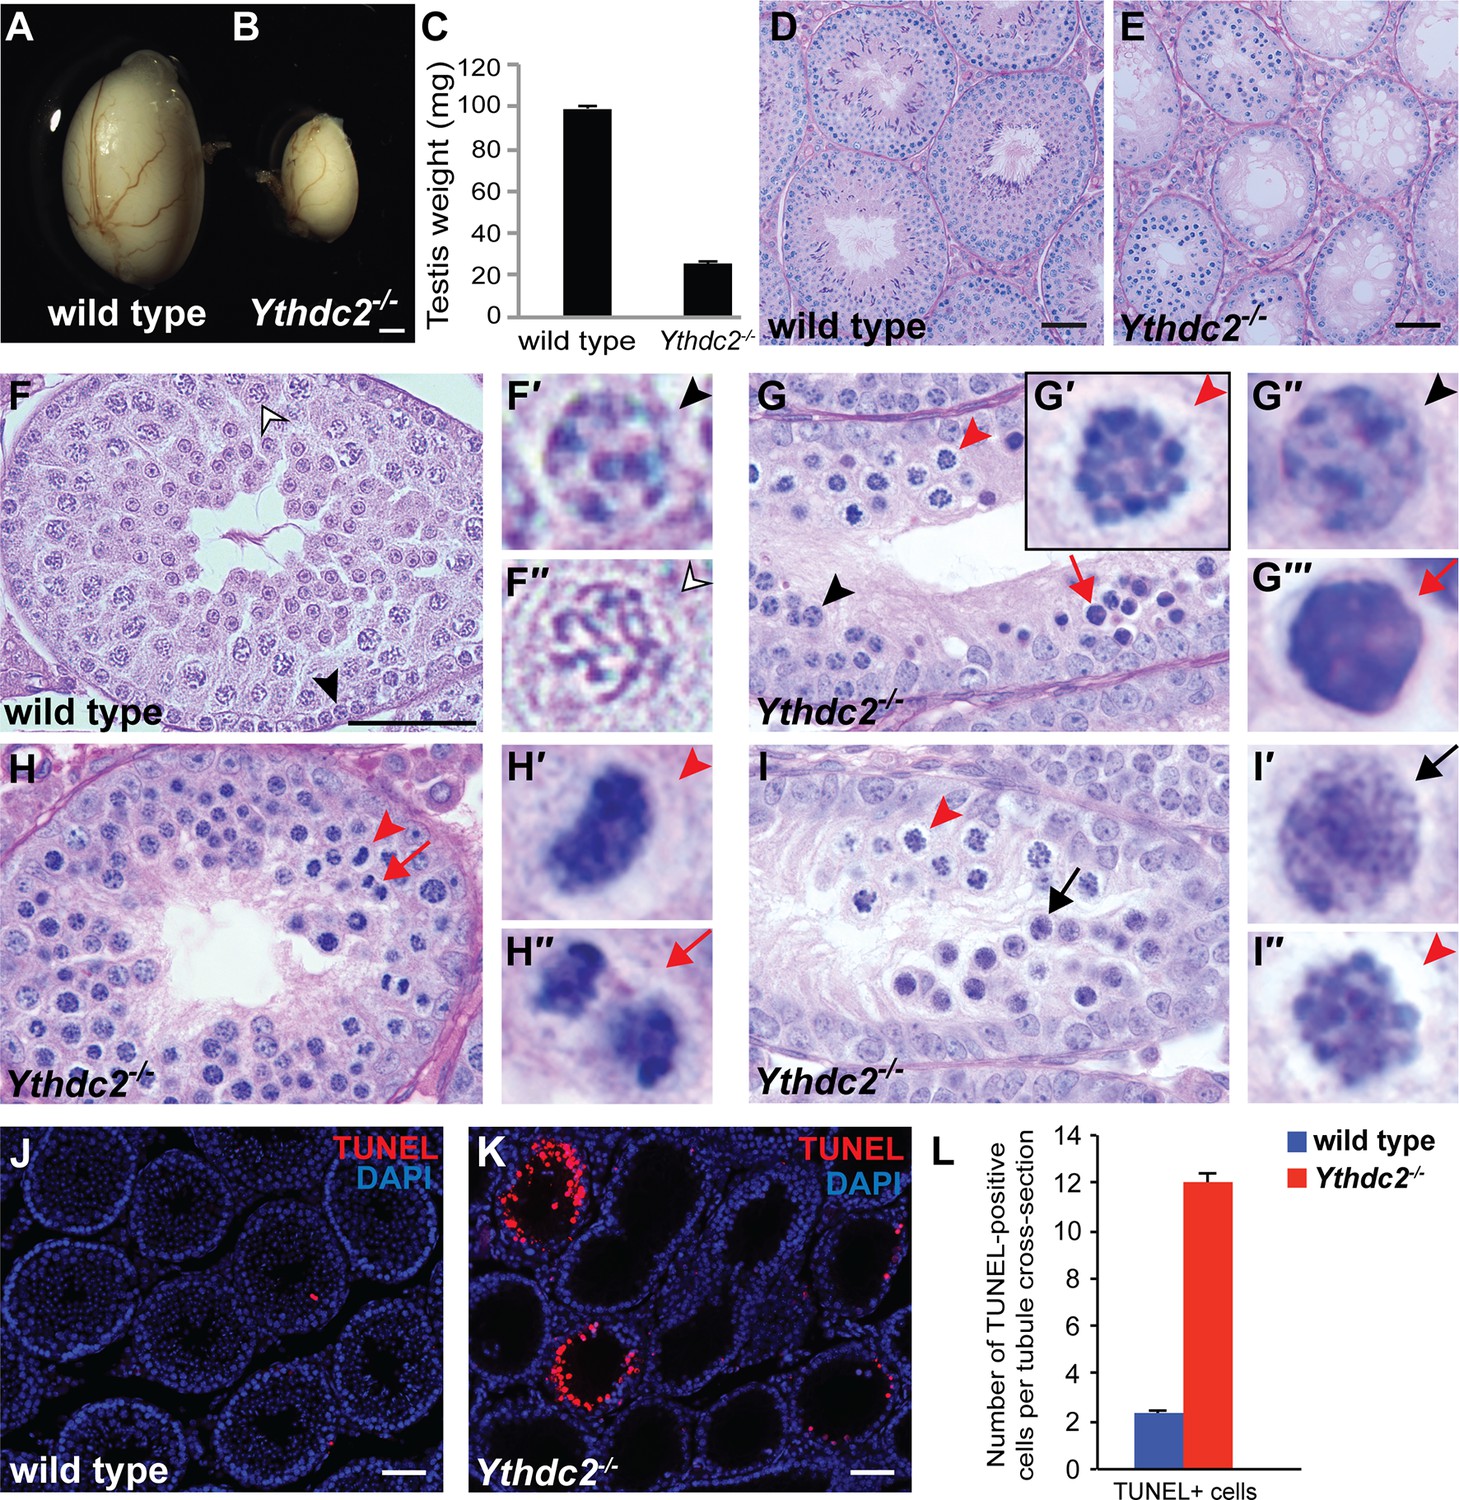
Adult Ythdc2 mutant male germ cells fail to properly execute meiosis.
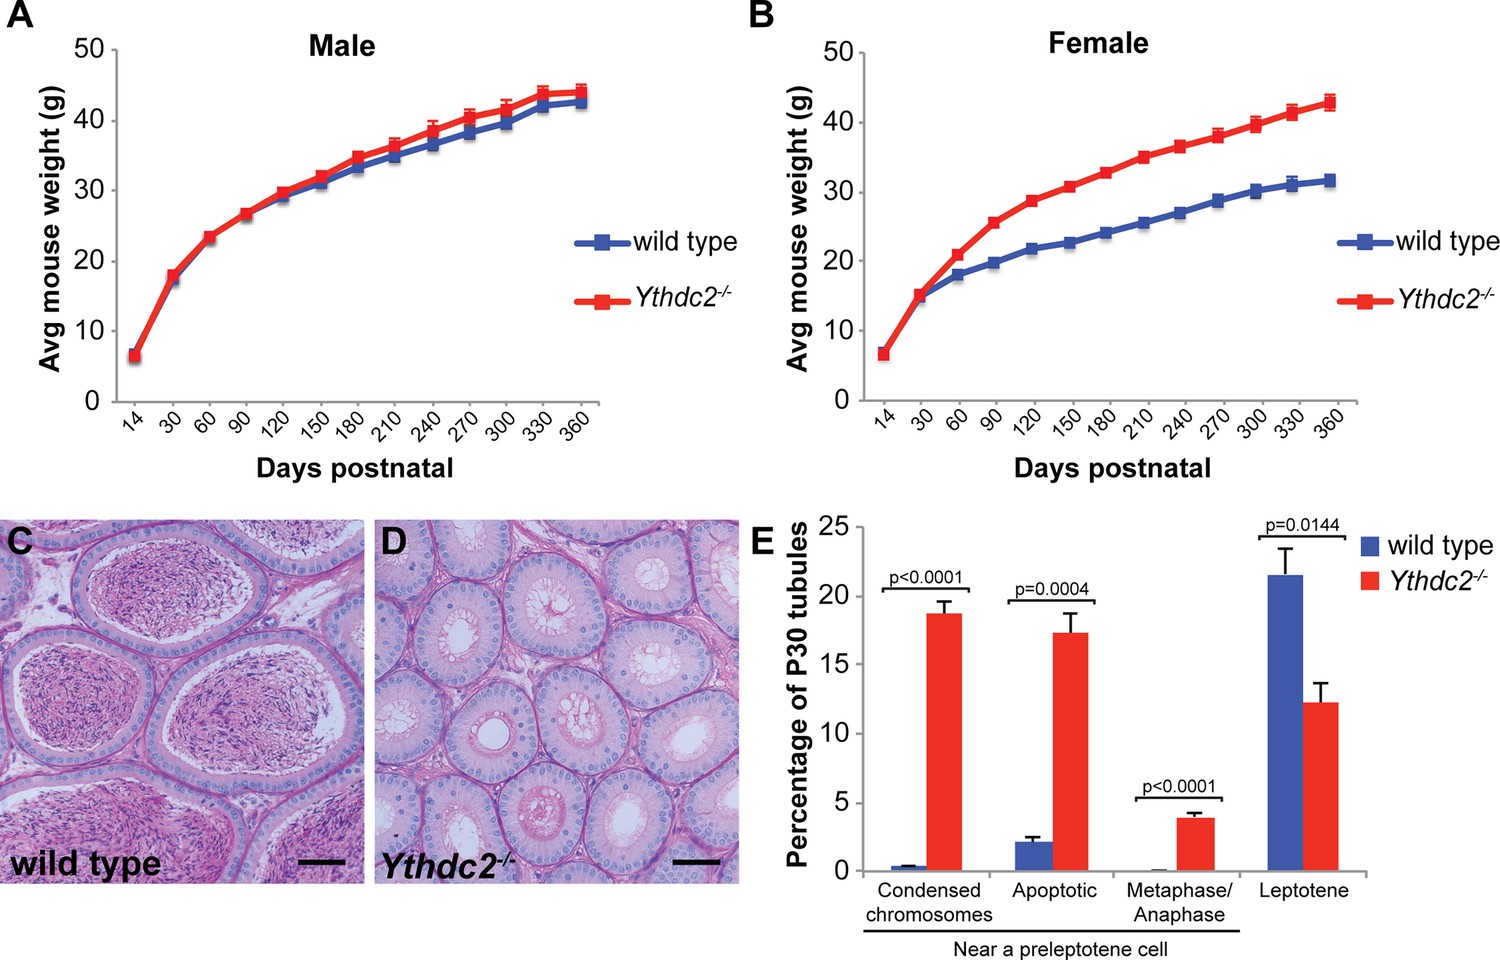
(A, B) Whole mount images of (A) wild-type and (B) Ythdc2-/- testes from 12-week-old male mice. (C) Testis weights from 8-week-old adult wild-type and Ythdc2-/- mice (n = 6 testes per group; t test, p<0.0001). Error bars: SEM. (D–I) Sections of mouse seminiferous tubules stained with periodic acid-Schiff (PAS). (D, E) Testis tubules from 8-week-old (D) wild-type and (E) Ythdc2-/- mice (n = 3 mice per group). (F) Testis tubule cross-sections from a P30 wild-type mouse. Black arrowhead: preleptotene cell. Outlined arrowhead: pachytene spermatocyte. (F′, F′′) High-magnification images of germ cells indicated in panel F. (G) Testis tubule from a P30 Ythdc2-/- mouse. Black arrowhead: normal appearing preleptotene cell. Red arrowhead: cell with mitotic-like condensed chromosomes. Red arrow: apoptotic cell. (G′-G′′′) High magnification images of germ cells indicated in panel G. (H) Testis tubule from a P30 Ythdc2-/- mouse. Red arrowhead: germ cell in abnormal metaphase. Red arrow: germ cell in abnormal anaphase. (H′, H′′) High-magnification images of germ cells indicated in panel H. (I) Testis tubule from a P30 Ythdc2 -/- mouse. Black arrow: leptotene-like germ cell. Red arrowhead: germ cell with condensed chromosomes. (I′, I′′) High-magnification images of germ cells indicated in panel I. n = 3 P30 mice per group. (J, K) Testes from P30 (J) wild-type and (K) Ythdc2-/- mice labeled with TUNEL (red) and DAPI (blue). (L) Number of TUNEL-positive cells per tubule cross-section in P30 wild-type (blue) and Ythdc2-/- (red) testes (n = 3 mice per group, two sections per mouse; t test, p<0.0001). Error bars: SEM. Scales bars: (A, B) 1 mm; (D–F and J, K) 50 μm. See also Figure 2—figure supplement 1, Figure 2—figure supplement 2, Figure 2—source data 1 and Figure 2—source data 2.
-
Figure 2—source data 1
Testis weights in adult wild-type and Ythdc2-/- mice.
- https://doi.org/10.7554/eLife.26116.007
-
Figure 2—source data 2
Number of TUNEL + cells per tubule cross-section in wild-type and Ythdc2-/- testes.
- https://doi.org/10.7554/eLife.26116.008
-
Figure 2—source data 3
Percentage of P30 tubule cross-sections containing indicated cell types in wild-type and Ythdc2-/- testes.
- https://doi.org/10.7554/eLife.26116.009
Figure 2—figure supplement 1
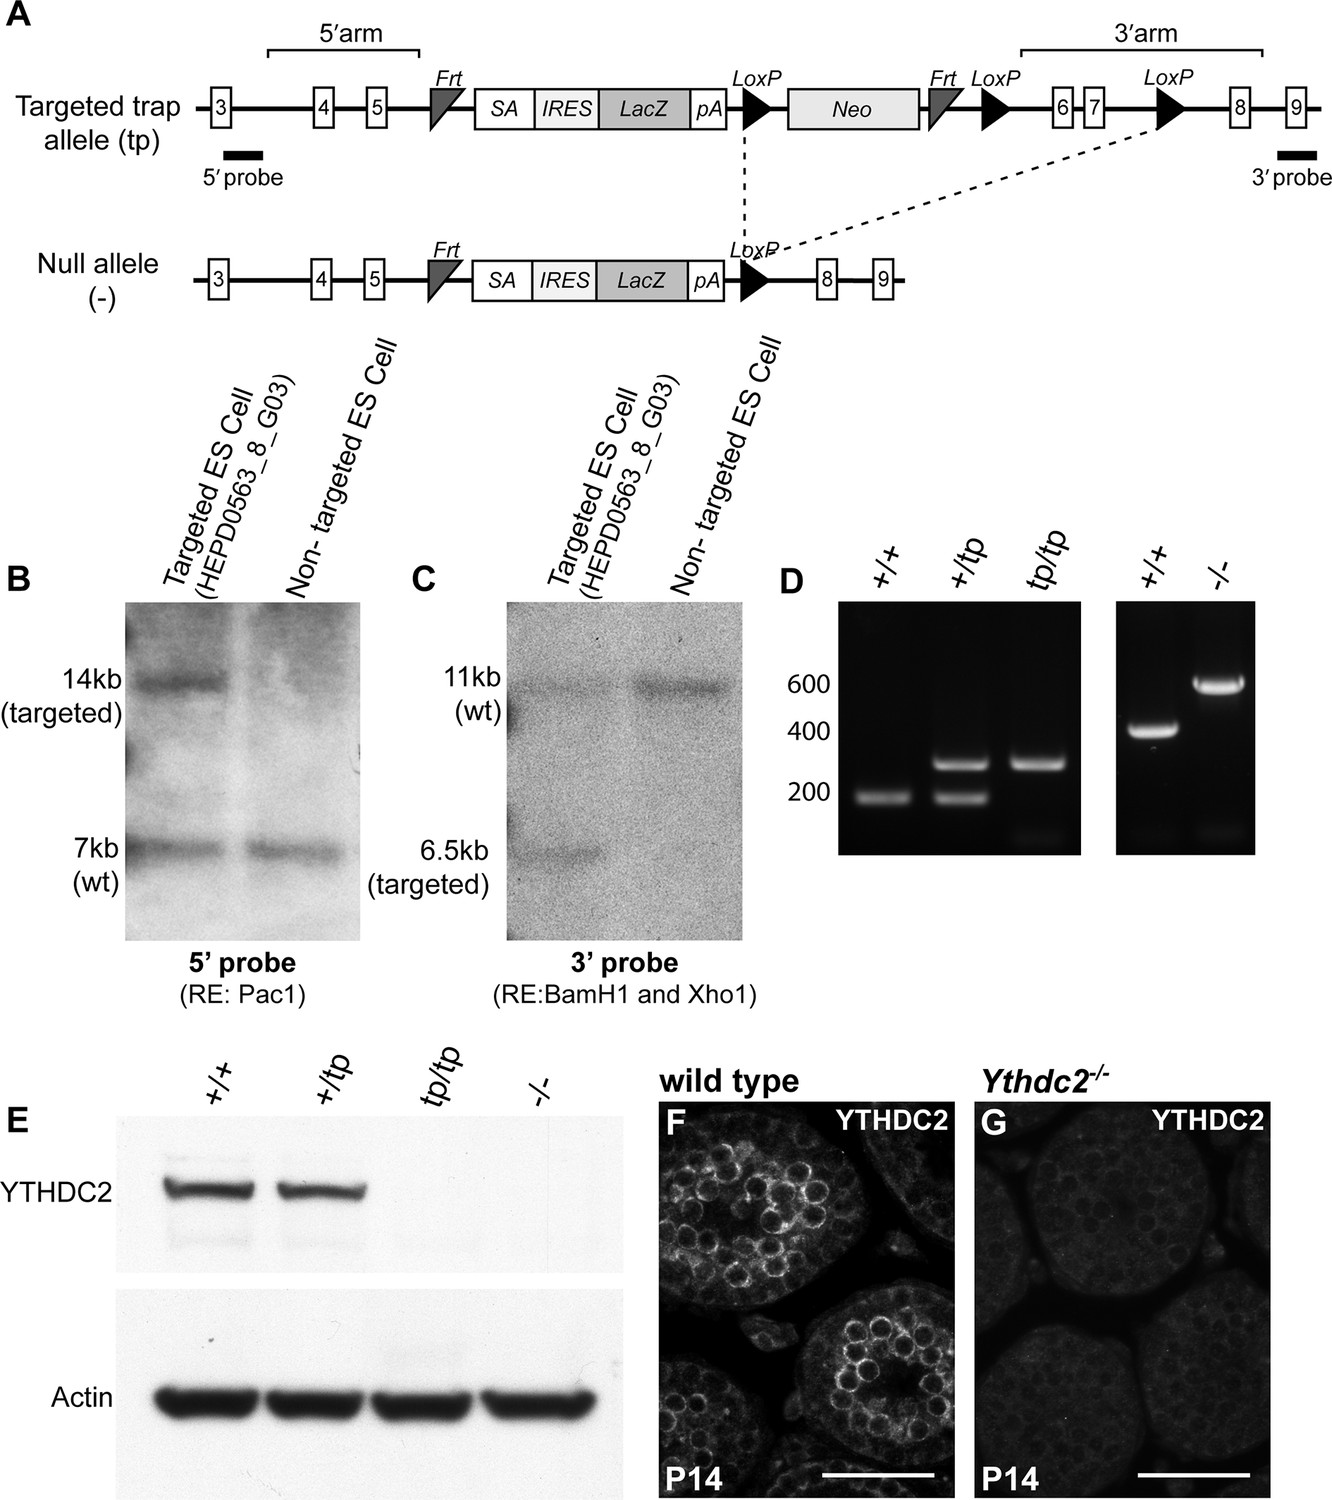
Generation of the Ythdc2 knockout mouse.
(A) Diagram of the Ythdc2 targeted trap allele (tp) showing the location of the targeted gene trap cassette between exons 5 and 6 (top), and the generation of the null allele (-) though excision of exons 6 and 7 (bottom). SA, splice acceptor; IRES, internal ribosome entry site; LacZ, β-galactosidase gene; pA, polyadenylation sequence; LoxP, Cre recombinase recognition site; FRT, flippase recognition site. (B, C) Southern blot of ES cell clones heterozygous for the Ythdc2 targeted trap allele using either (B) 5’ probe or (C) 3’ probe depicted in (A). (D) Mouse genotyping by PCR analysis of DNA purified from wild type (+/+), heterozygous for the targeted trap (+/tp), homozygous for the targeted trap (tp/tp), or null mutant (-/-) mice. (E) Expression of YTHDC2 protein in whole testis extract from 8-week-old wild type (+/+), heterozygous for the targeted trap (+/tp), homozygous for the targeted trap (tp/tp), or null mutant (-/-) mice. Western blots probed with α-YTHDC2 or α-Actin. (F, G) Immunofluorescence images of cross-sections of testis tubules from P14 (F) wild-type and (G) null mutant (Ythdc2-/-) mice stained for YTHDC2. Scale bars: (F, G) 50 μm.
Figure 2—figure supplement 2
Phenotypic characterization of Ythdc2 mutant mice.
(A, B) Average total weight of wild-type and Ythdc2-/- (A) male and (B) female mice over time. (n ≥ 20 mice per time point). Error bars: SEM. (C, D) Cross-sections of epididymis from 8-week-old (C) wild-type and (D) Ythdc2-/- mice stained with PAS (n = 4 mice per group). (E) Percentage of P30 tubule cross-sections containing either: cells with highly condensed chromosomes near preleptotene cells, apoptotic cells near preleptotene cells, metaphase or anaphase cells near preleptotene cells, or leptotene spermatocytes in wild-type (blue) and Ythdc2-/- (red) testes (n = 3 mice per group, >185 tubules counted per mouse; t test, p-values indicated on plot). Error bars: SEM. See also and Figure 2—source data 3.
Figure 3

YTHDC2-deficient male germ cells do not properly progress through meiotic prophase during the first wave of spermatogenesis.
(A–H) Testis seminiferous tubule cross-sections counterstained with PAS from wild-type (top) and Ythdc2-/- (bottom) mice during the first wave of spermatogenesis: (A, B) P8; (C, D) P10; (E, F) P12; and (G, H) P14 (n = 3 wild-type and Ythdc2-/- mice per time point). Black arrows: normal preleptotene cells. Black arrowheads: normal leptotene spermatocytes. Outlined arrowheads: normal pachytene spermatocytes. Red arrowheads: abnormal cells with mitotic-like condensed chromosomes. Red arrows: apoptotic cells. Insets are high-magnification images of representative boxed germ cells. Scale bars: 50 μm. (I) Percentage of P12 tubule cross-sections containing preleptotene, leptotene, zygotene or pachytene cells as the most advanced cell stage in wild-type (blue) and Ythdc2-/- (red) testes (n = 3 mice per group, ≥125 tubules counted per mouse). Error bars: SEM. (J) P12 Ythdc2 mutant tubule containing many abnormal cells with condensed chromosomes (red arrowheads). (K) Percentage of P12 tubule cross-sections containing cells with condensed chromosomes in wild-type (blue) and Ythdc2-/- (red) testes (n = 3 mice per group, ≥125 tubules counted per mouse). Error bars: SEM. (L, M) Immunofluorescence images of germ cell spreads from P14 (L-L′′) wild-type and (M-M′′) Ythdc2-/- mice stained for SYCP3 (green), γ-H2AX (red) and DAPI (blue). (N) Percentage of Ythdc2-/- metaphase-like nuclei that contain 40 chromosomes (counted nuclei from n = 4 Ythdc2-/- mice; 77 Ythdc2-/- nuclei counted). See also Figure 3—source data 1, Figure 3—source data 2 and Figure 3—source data 3.
-
Figure 3—source data 1
The most advanced cell stage in P12 wild-type and Ythdc2-/- testis tubules.
- https://doi.org/10.7554/eLife.26116.011
-
Figure 3—source data 2
Percentage of P12 wild-type and Ythdc2-/- testis tubules containing cells with condensed chromosomes.
- https://doi.org/10.7554/eLife.26116.012
-
Figure 3—source data 3
Number of chromosomes in Ythdc2-/- metaphase-like nuclei.
- https://doi.org/10.7554/eLife.26116.013
Figure 4 with 1 supplement
Defects in expression of some meiotic markers in Ythdc2 mutant male germ cells.
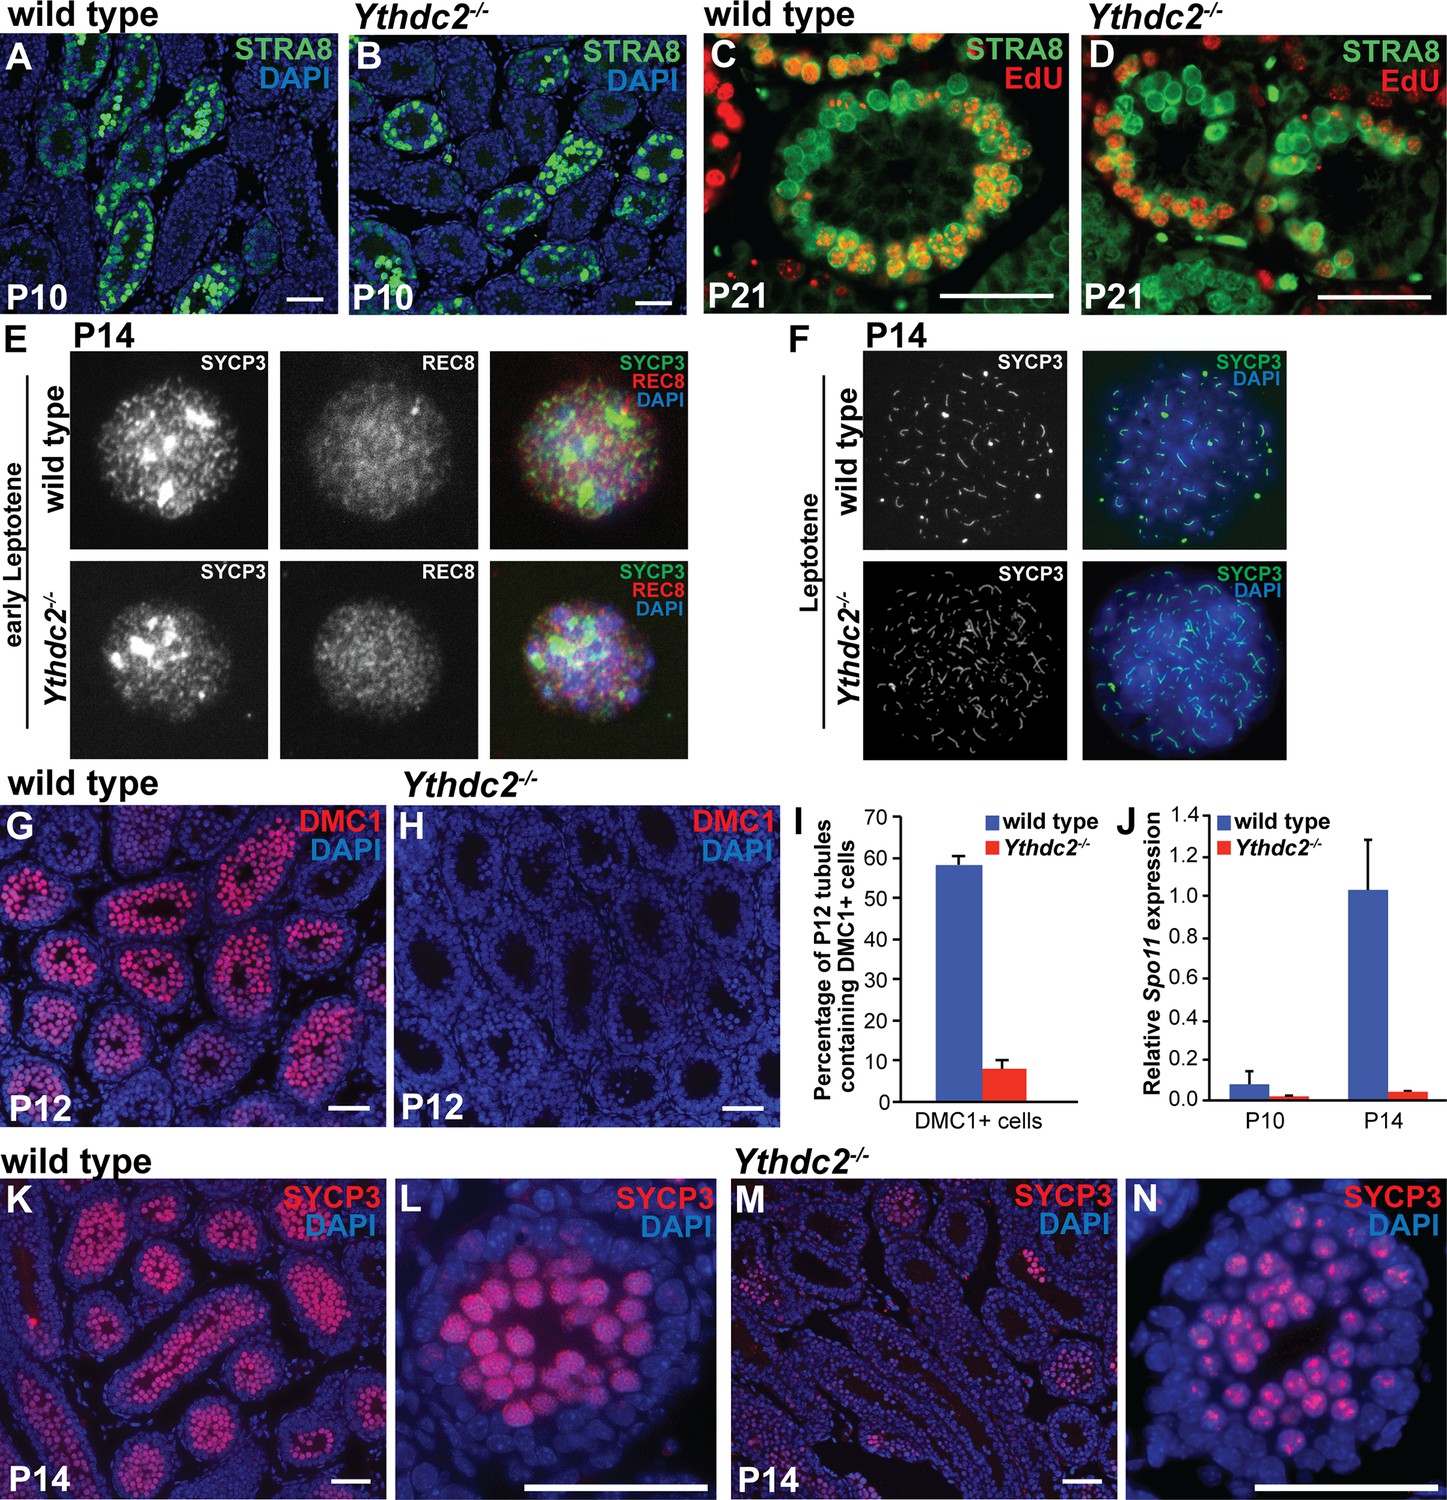
(A–D) Immunofluorescence images of testis tubule cross-sections. (A, B) Testes from P10 (A) wild-type and (B) Ythdc2-/- mice stained for STRA8 (green) and DAPI (blue) (n = 3 mice per group). (C, D) Testes from P21 (C) wild-type and (D) Ythdc2-/- mice labeled with EdU (red) and stained for STRA8 (green) (n = 3 mice per group). (E) Immunofluorescence images of early leptotene germ cells from P14 wild-type and Ythdc2-/- mice stained for SYCP3 (green), REC8 (red) and DAPI (blue). (F) Immunofluorescence images of leptotene germ cells from P14 wild-type and Ythdc2-/- mice stained for SYCP3 (green) and DAPI (blue). (G, H) Testes from P12 (G) wild-type and (H) Ythdc2-/- mice stained for DMC1 (red) and DAPI (blue). (I) Percentage of P12 testis tubules containing DMC1+ germ cells in wild-type (blue) and Ythdc2-/- (red) mice (n = 4 mice per group, one cross-section per mouse with >115 tubules per cross-section; t test, p<0.0001). Error bars: SEM. (J) Quantitative RT-PCR analysis of Spo11 mRNA expression in testes from P10 and P14 wild-type (blue) and Ythdc2-/- (red) mice (n = 2 mice per group). Error bars: SEM. (K–N) Testes from P14 (K, L) wild-type and (M, N) Ythdc2-/- mice stained for SYCP3 (red) and DAPI (blue). (L, N) High magnification images of single P14 testis tubules from (L) wild-type and (N) Ythdc2-/- mice. Scale bars: 50 μm. See also Figure 4—figure supplement 1, Figure 4—source data 1 and Figure 4—source data 2.
-
Figure 4—source data 1
Percentage of tubules containing DMC1 + germ cells in wild-type and Ythdc2-/- P12 testes.
- https://doi.org/10.7554/eLife.26116.016
-
Figure 4—source data 2
Expression of Spo11 mRNA in wild-type and Ythdc2-/- testes.
- https://doi.org/10.7554/eLife.26116.017
Figure 4—figure supplement 1
Expression of meiotic markers in Ythdc2 mutant males.
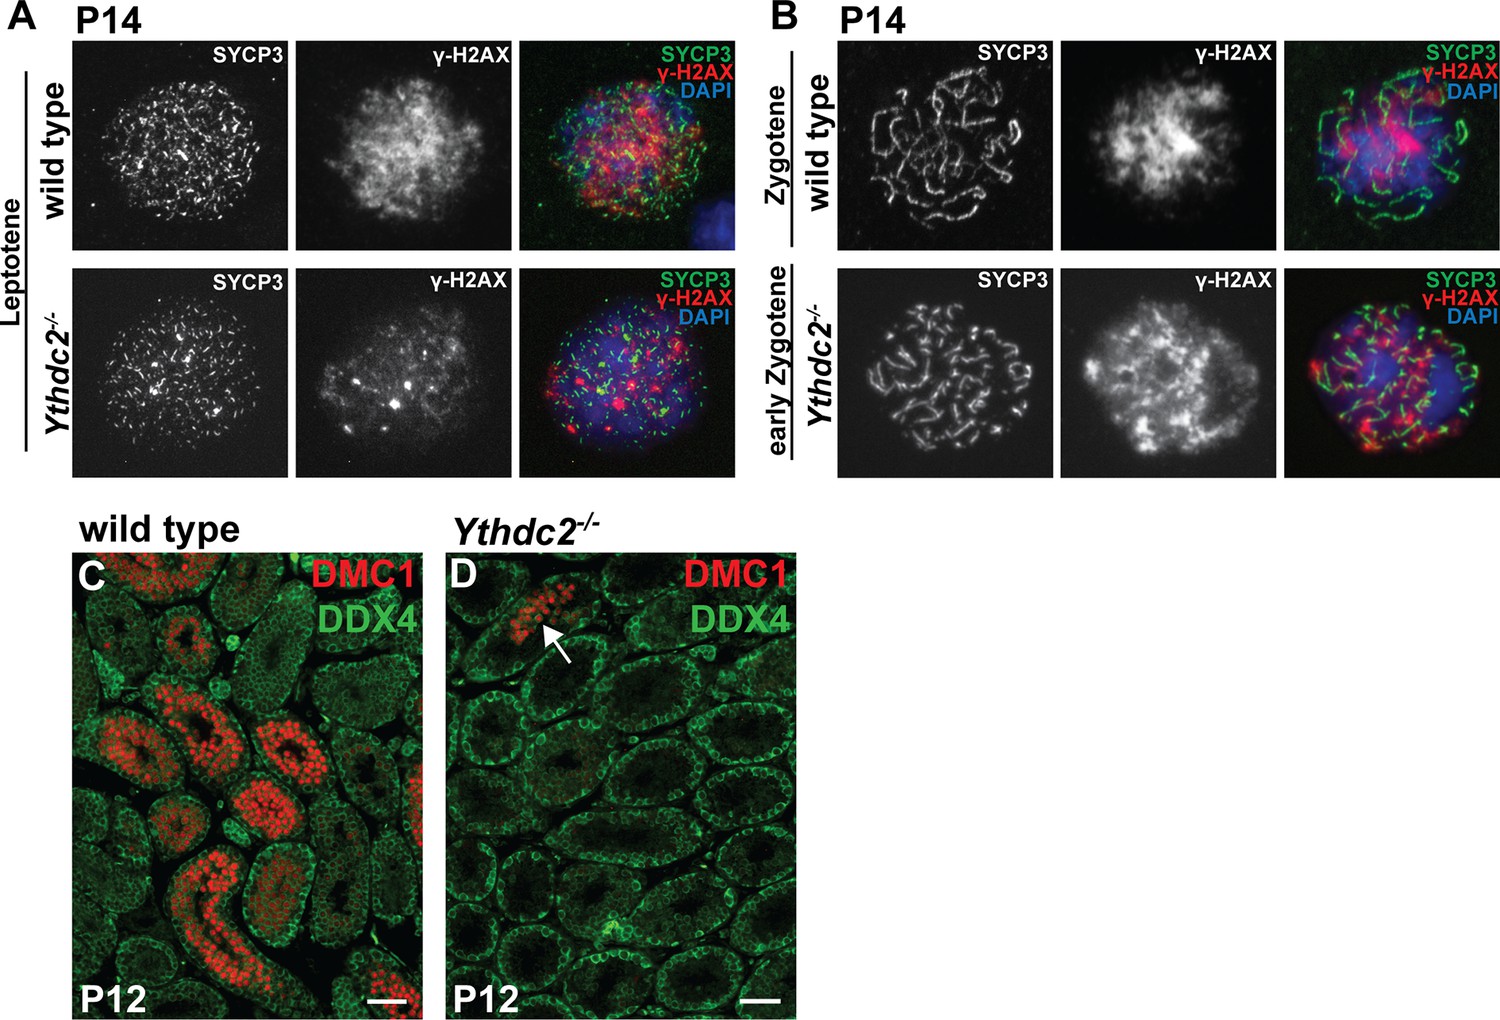
(A, B) Immunofluorescence images of (A) leptotene and (B) zygotene germ cells from P14 wild-type and Ythdc2-/- mice stained for SYCP3 (green), γ-H2AX (red) and DAPI (blue). (C, D) Immunofluorescences images of testis cross-sections from P12 (C) wild-type and (D) Ythdc2-/- mice stained for DMC1 (red) and DDX4 (green). Arrow: tubule in Ythdc2-/- with DMC1+ germ cells. Scale bars: 50 μm.
Figure 5 with 2 supplements
YTHDC2 is required for meiotic prophase in the fetal ovary.
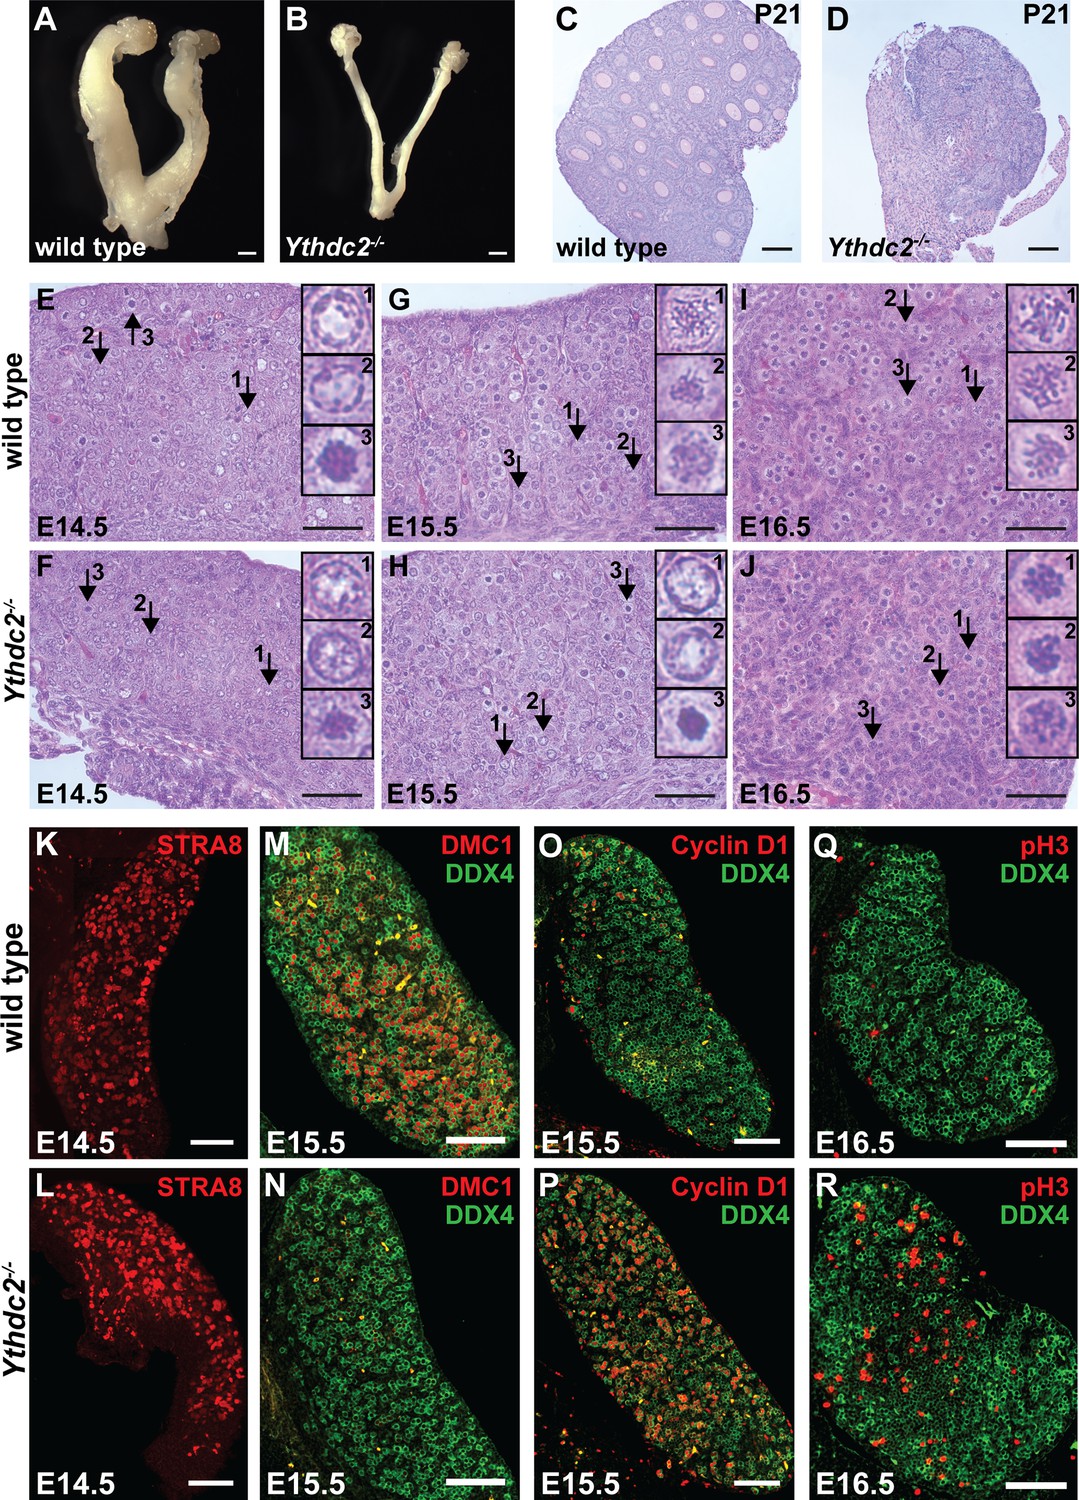
(A, B) Whole mount ovaries from 8-week-old adult female (A) wild-type and (B) Ythdc2-/- mice (n = 3 wild-type and n = 5 Ythdc2-/- mice). (C, D) PAS-stained ovary sections from P21 (C) wild type (8/8 ovaries contained germinal vesicles) and (D) Ythdc2-/- (0/7 ovaries contained germinal vesicles). (E–J) Embryonic ovary cross-sections counterstained with H and E from wild-type and Ythdc2-/- mice: (E, F) E14.5 (n = 3 wild-type and n = 3 Ythdc2-/- embryos); (G, H) E15.5 (n = 4 wild-type and n = 4 Ythdc2-/- embryos); and (I, J) E16.5 (n = 3 wild-type and n = 5 Ythdc2-/- embryos). Arrows: representative germ cells shown in insets. (K–R) Immunofluorescence images of fetal ovary cross-sections. (K, L) E14.5 ovaries from (K) wild-type and (L) Ythdc2-/- mice stained for STRA8. (M, N) E15.5 ovaries from (M) wild-type and (N) Ythdc2-/- mice stained for DMC1 (red) and DDX4 (green). (O, P) E15.5 ovaries from (O) wild-type and (P) Ythdc2-/- mice stained for Cyclin D1 (red) and DDX4 (green). (Q, R) E16.5 ovaries from (Q) wild-type and (R) Ythdc2-/- mice stained for pH3 (red) and DDX4 (green). Scale bars: (A, B) 1 mm; (C, D) 100 μm; (E–J) 50 μm; (K–R) 100 μm. See also Figure 5—figure supplement 1 and Figure 5—figure supplement 2.
-
Figure 5—source data 1
Number of DDX4 + cells in wild-type and Ythdc2-/- P0.5 ovaries.
- https://doi.org/10.7554/eLife.26116.021
-
Figure 5—source data 2
Percentage of DDX4 + cells that are pH3 + in wild-type and Ythdc2-/- E16.5 ovaries.
- https://doi.org/10.7554/eLife.26116.022
Figure 5—figure supplement 1
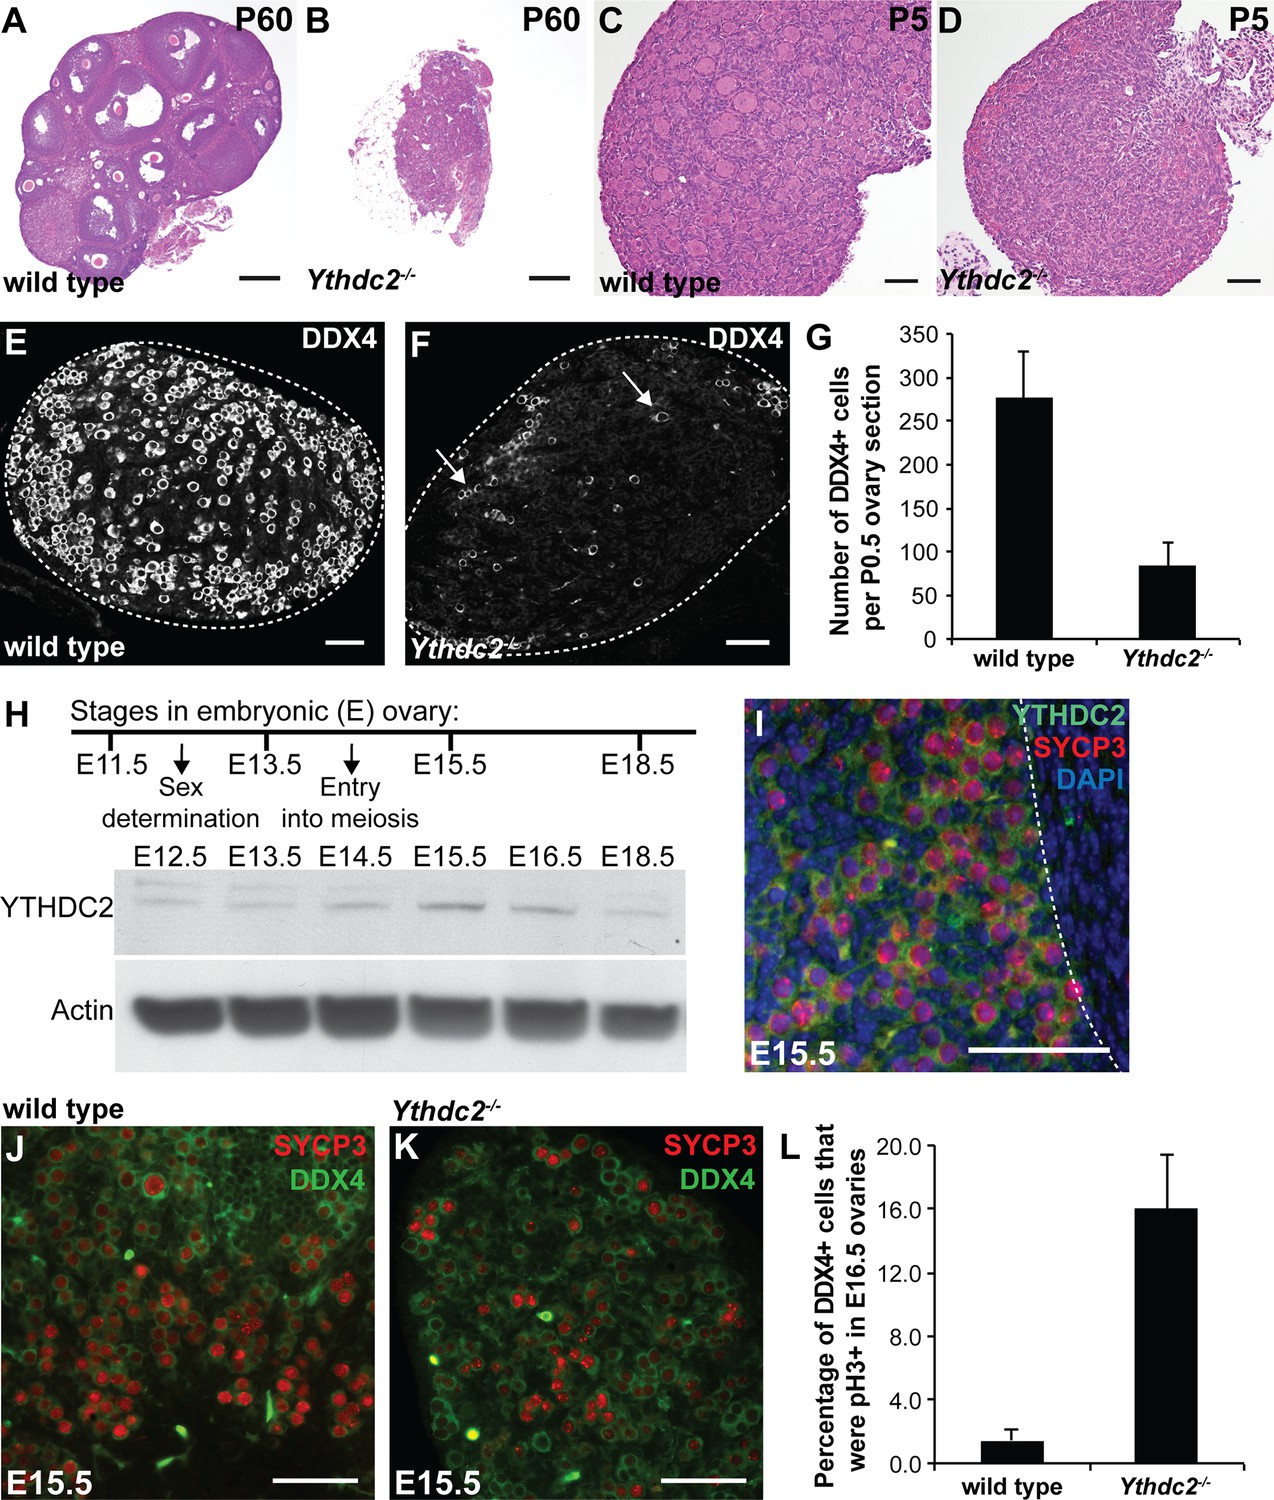
Ythdc2 mutant females have defects in the fetal ovary.
(A, B) PAS-stained sections of ovaries from P60 (A) wild-type and (B) Ythdc2-/- mice. (C, D) H and E-stained ovary sections from P5 (C) wild-type and (D) Ythdc2-/- mice. (E, F) Immunofluorescence images of ovary sections from P0.5 (E) wild-type and (F) Ythdc2-/- mice stained for DDX4. Arrows: DDX4+ germ cells. (G) Number of DDX4+ germ cells at P0.5 per wild-type or Ythdc2-/- ovary section (n = 3 wild-type and n = 5 Ythdc2-/- mice, 1 ovary section per mouse; t test, p=0.007). Error bars: SEM. (H) YTHDC2 protein expression in the fetal ovary from E12.5-E18.5. Western blots probed with α-YTHDC2 or α-Actin. E, Embryonic. (I) Immunofluorescence image of an ovary section from an E15.5 wild-type mouse stained for YTHDC2 (green), SYCP3 (red) and DAPI (blue). White dotted line: boundary between the fetal ovary and the mesonephros. (J, K) Immunofluorescence images of E15.5 fetal ovary cross-sections from (J) wild-type and (K) Ythdc2-/- mice stained for SYCP3 (red) and DDX4 (green). (L) Percentage of DDX4+ germ cells that were pH3+ in E16.5 wild-type and Ythdc2-/- ovary cross-sections (n = 6 wild-type and n = 7 Ythdc2-/- ovaries; t test, p=0.002). Error bars: SEM. Scale bars: (A, B) 100 μm; (C–F and I–K) 50 μm. See also Figure 5—source data 1 and Figure 5—source data 2.
Figure 5—figure supplement 2
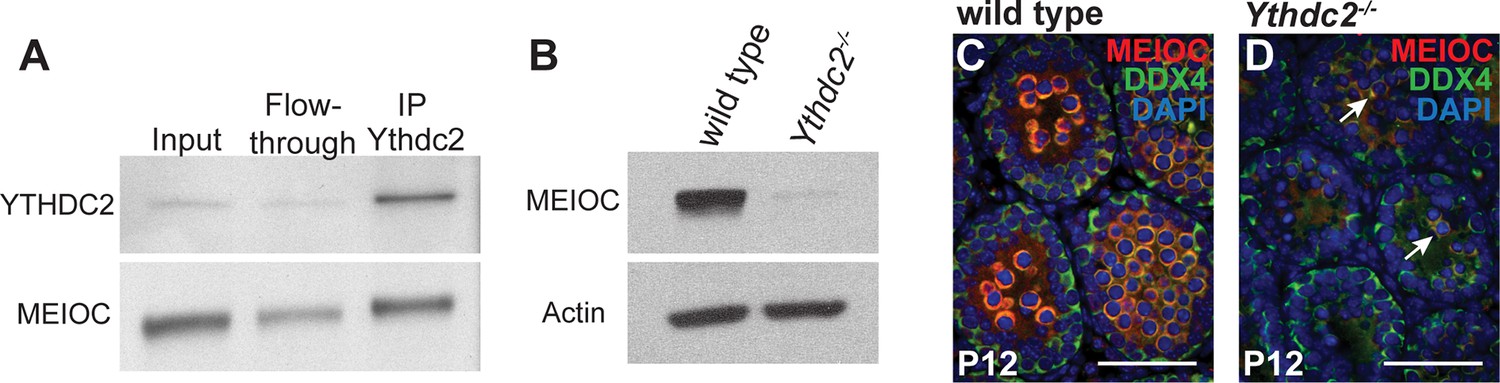
MEIOC coimmunoprecipitates with YTHDC2.
(A) Immunoprecipitation with α-YTHDC2 from wild-type testis extract. Western blot probed with α-YTHDC2 or α-MEIOC. (B) MEIOC protein expression in P12 wild-type and Ythdc2-/- testes. Western blot probed with α-MEIOC or α-Actin. (C, D) Immunofluorescence images of testis cross-sections from P12 (C) wild-type and (D) Ythdc2-/- mice stained for MEIOC (red), DDX4 (green) and DAPI (blue) (n = 3 mice per group). Arrows: Germ cells expressing DDX4 and MEIOC. Scale bars: 25 μm.
Figure 6 with 1 supplement
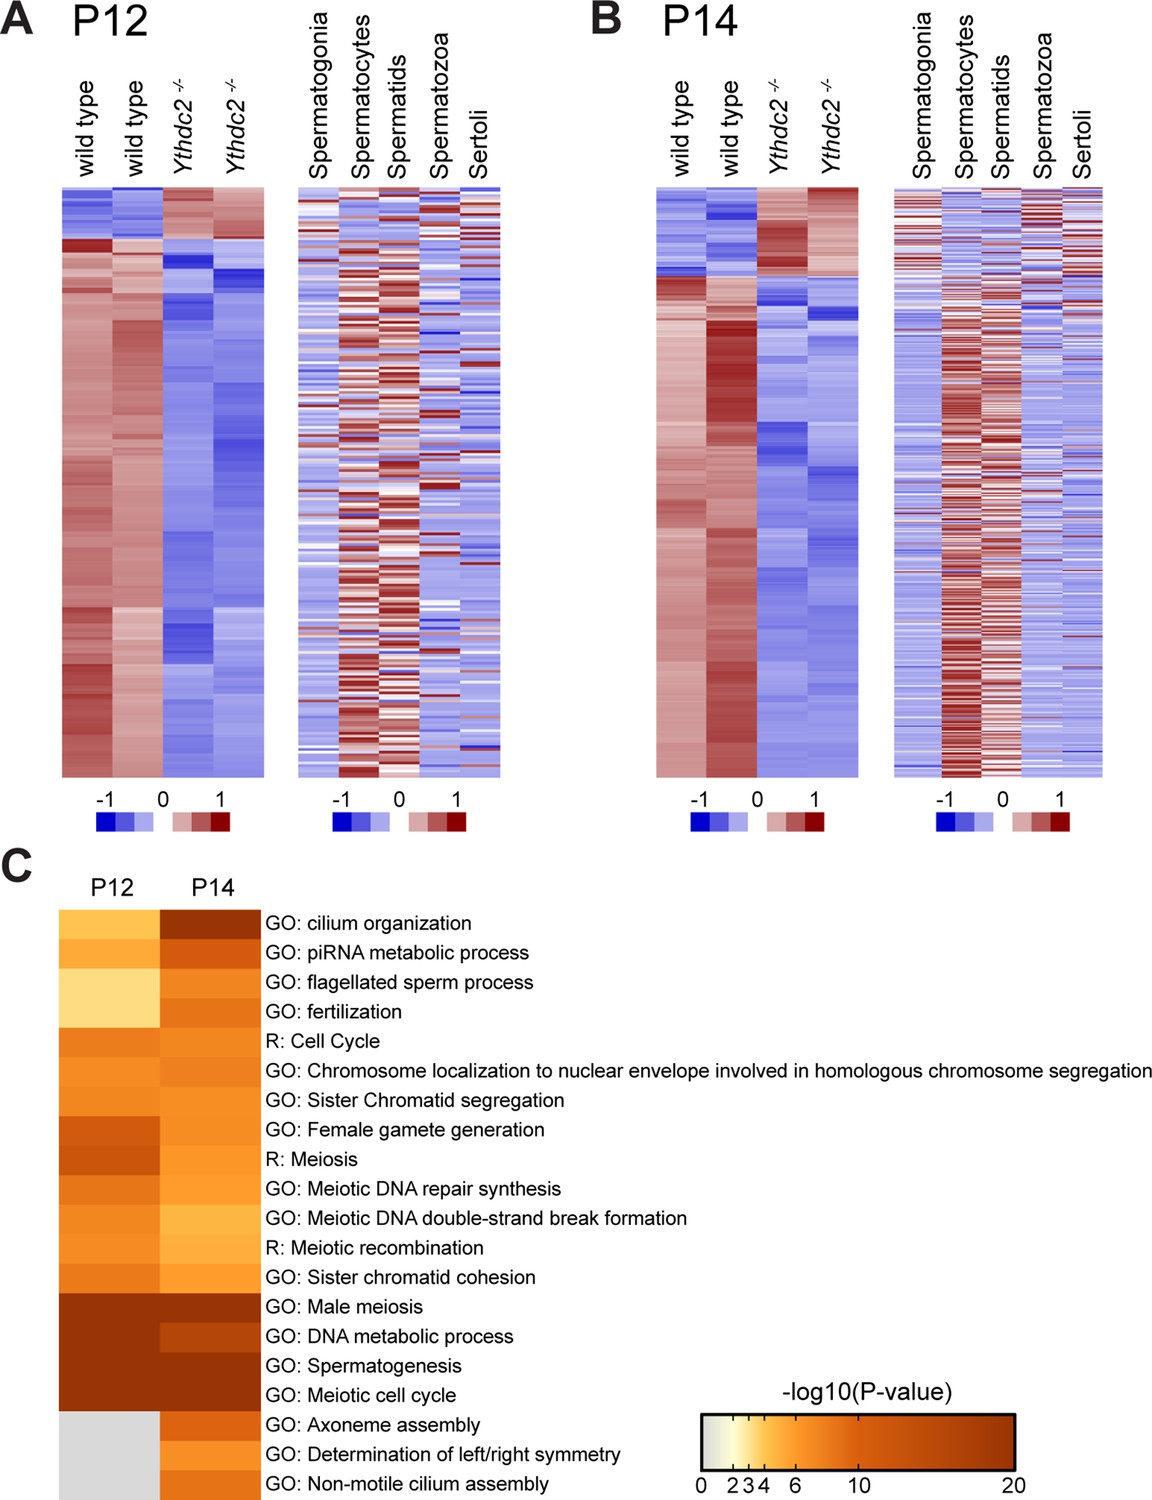
Ythdc2-/- male germ cells do not properly up-regulate meiotic transcripts at the mitosis to meiosis transition.
(A, B) Heatmaps representing transcripts differentially expressed in Ythdc2-/- compared to wild type in (A) P12 and (B) P14 testes (adjusted p-value<0.05), with corresponding expression levels for the same genes in sorted cell populations from adult testes (Soumillon et al., 2013). Biological replicates for both wild type and Ythdc2-/- are shown. For P12: 218 total transcripts shown, 199 transcripts down in Ythdc2-/- compared to wild type and 19 transcripts higher in Ythdc2-/- compared to wild type. For P14: 1130 total transcripts shown, 959 transcripts down in Ythdc2-/- compared to wild type and 171 transcripts higher in Ythdc2-/- compared to wild type. (C) Heatmap representing enrichment of GO and Reactome (R) -terms for the genes expressed at lower levels in P12 and P14 Ythdc2-/- testes compared to age-matched wild-type testes. See also Figure 6—figure supplement 1, Figure 6—source data 1 for the list of differentially expressed genes in P12 Ythdc2 mutant testes compared to wild type and Figure 6—source data 2 for the list of differentially expressed genes in P14 Ythdc2 mutant testes compared to wild type.
-
Figure 6—source data 1
Differentially expressed transcripts in P12 Ythdc2-/- testes compared to wild type.
- https://doi.org/10.7554/eLife.26116.025
-
Figure 6—source data 2
Differentially expressed transcripts in P14 Ythdc2-/- testes compared to wild type.
- https://doi.org/10.7554/eLife.26116.026
Figure 6—figure supplement 1
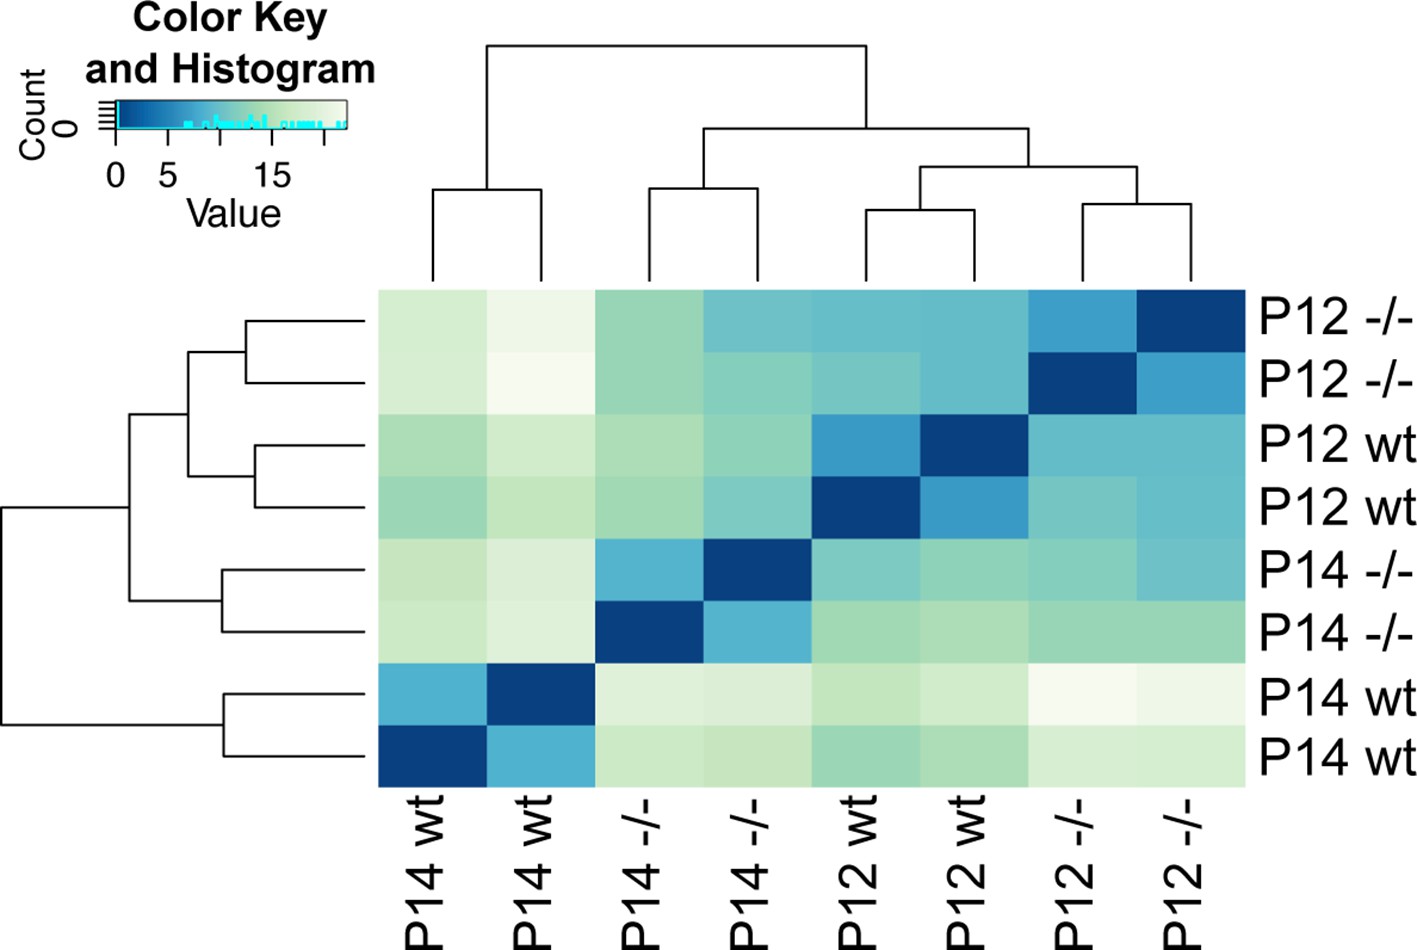
P12 and P14 RNA-sequencing dataset analysis.
Clustering analysis of RNA-sequencing from P12 and P14 wild-type and Ythdc2 mutant (-/-) testes.
Figure 7 with 1 supplement
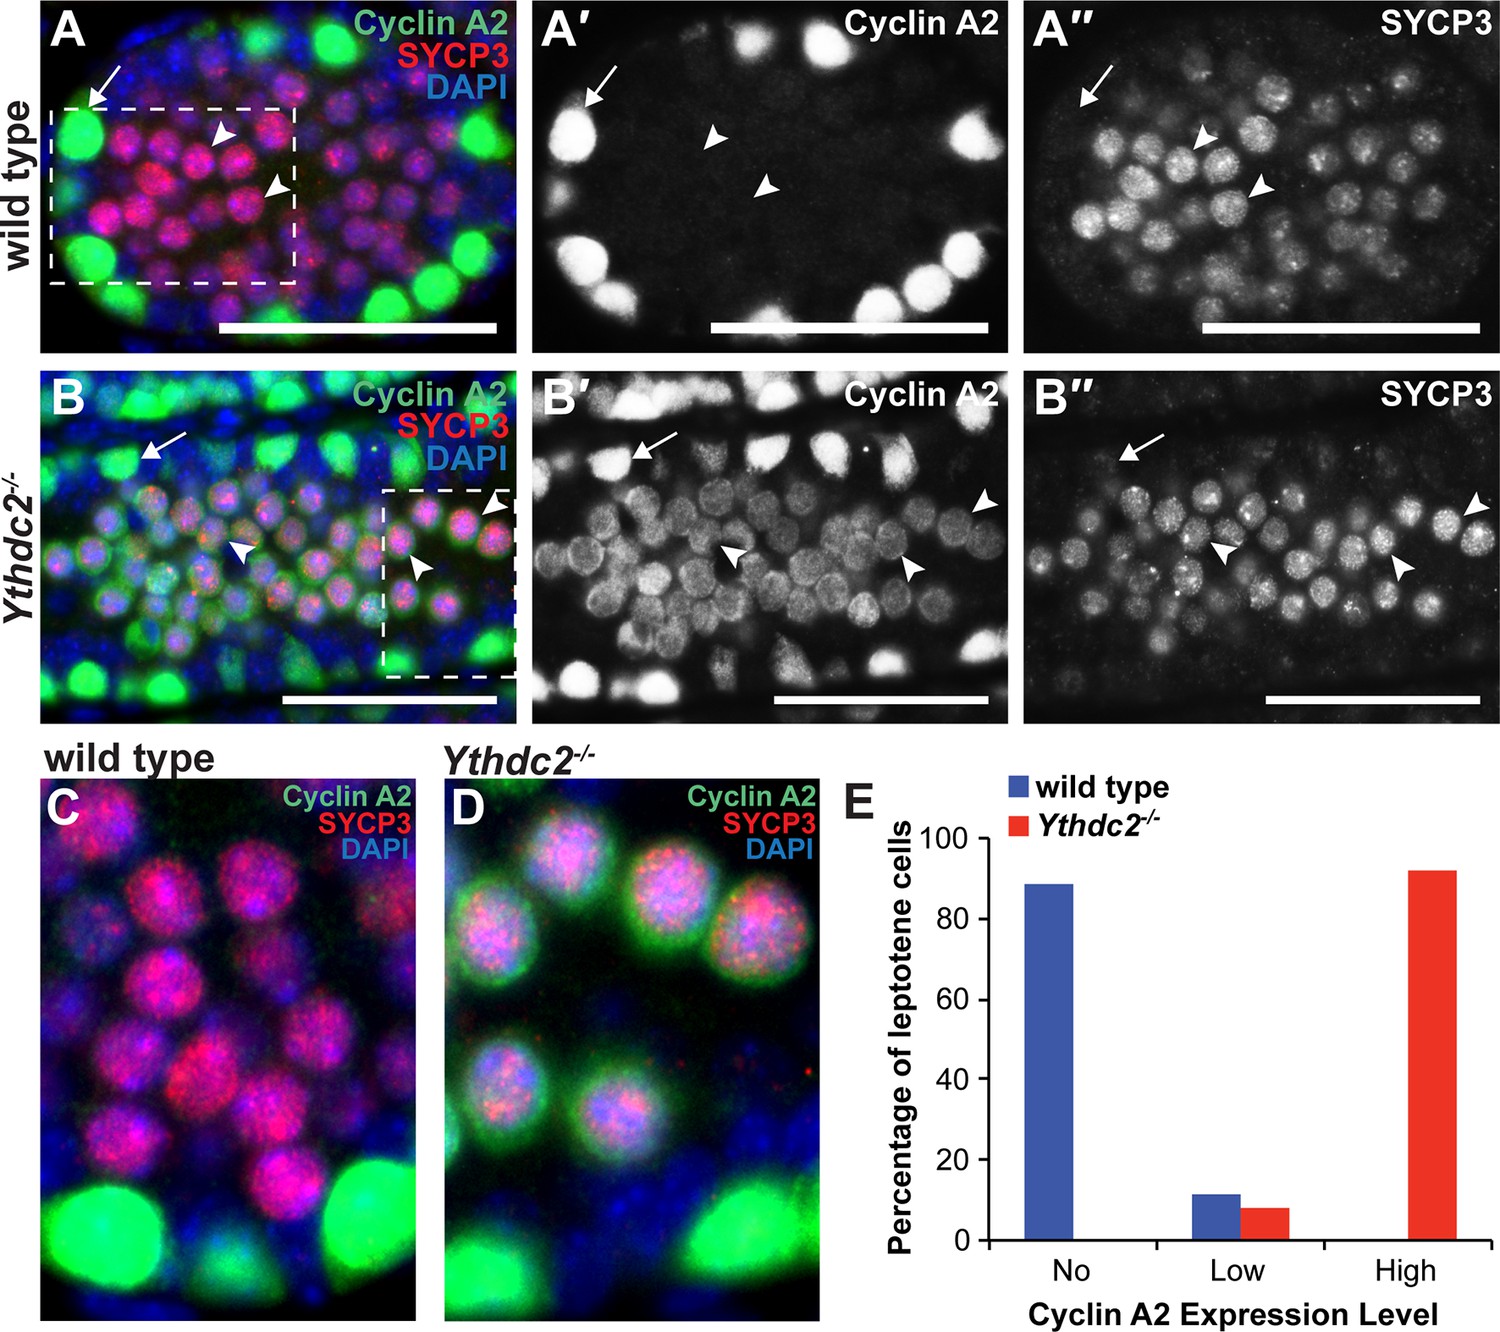
YTHDC2-deficient meiotic germ cells fail to turn off expression of Cyclin A2.
(A-B′′) Immunofluorescence images of testis cross-sections from P12 (A-A′′) wild-type and (B-B′′) Ythdc2-/- mice stained in parallel for Cyclin A2 (green), SYCP3 (red) and DAPI (blue). Arrow: spermatogonia. Arrowheads: leptotene spermatocytes. Scale bars: (A-B′′) 50 μm. (C) High magnification of boxed region in panel A. (D) High magnification of boxed region in panel B. (E) Quantification of Cyclin A2 protein expression levels in leptotene spermatocytes in P12 wild-type (blue) or Ythdc2 mutant (red) testes (counted leptotene spermatocytes from n = 3 wild-type and n = 3 Ythdc2-/- mice; >365 leptotene spermatocytes counted for both wild-type and Ythdc2-/- mice). See also Figure 7—figure supplement 1 and Figure 7—source data 1.
-
Figure 7—source data 1
Cyclin A2 protein expression in wild-type and Ythdc2-/- leptotene spermatocytes.
- https://doi.org/10.7554/eLife.26116.029
Figure 7—figure supplement 1
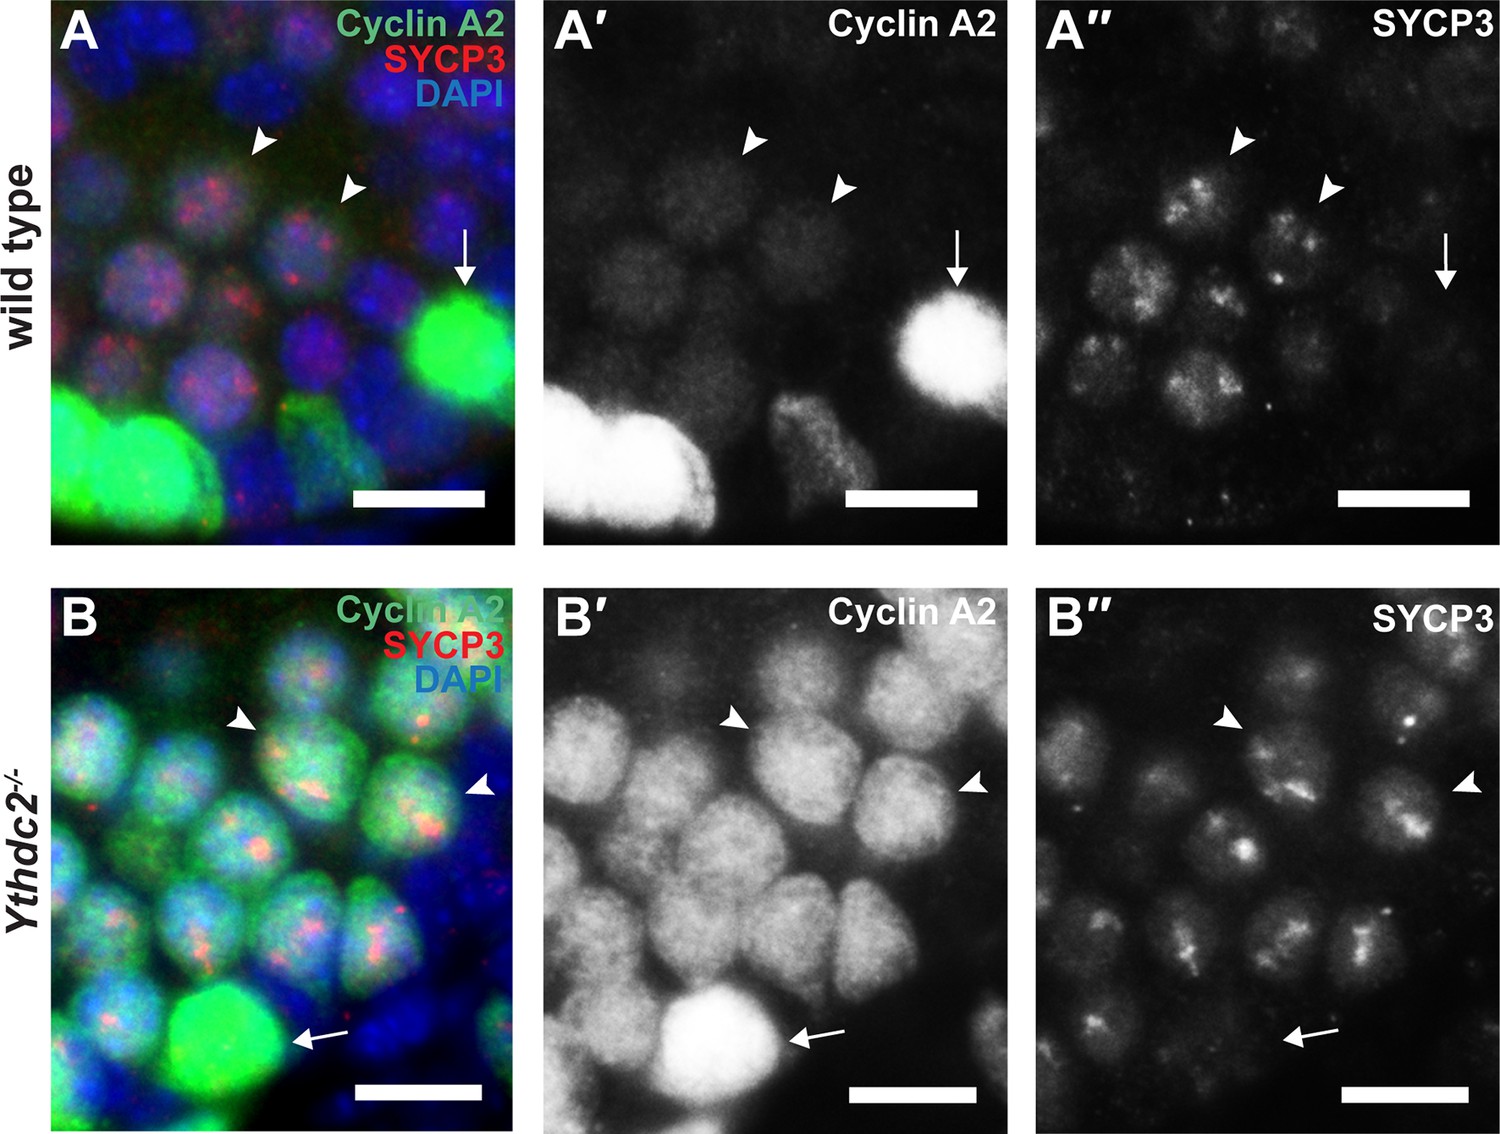
Cyclin A2 protein expression in wild-type and Ythdc2 mutant preleptotene cells.
(A-B′′) Immunofluorescence images of testis cross-sections from P12 (A-A′′) wild-type and (B-B′′) Ythdc2-/- mice stained in parallel for Cyclin A2 (green), SYCP3 (red) and DAPI (blue). Arrow: spermatogonia. Arrowheads: preleptotene cells. Scale bars: 10 μm.
Figure 8 with 2 supplements
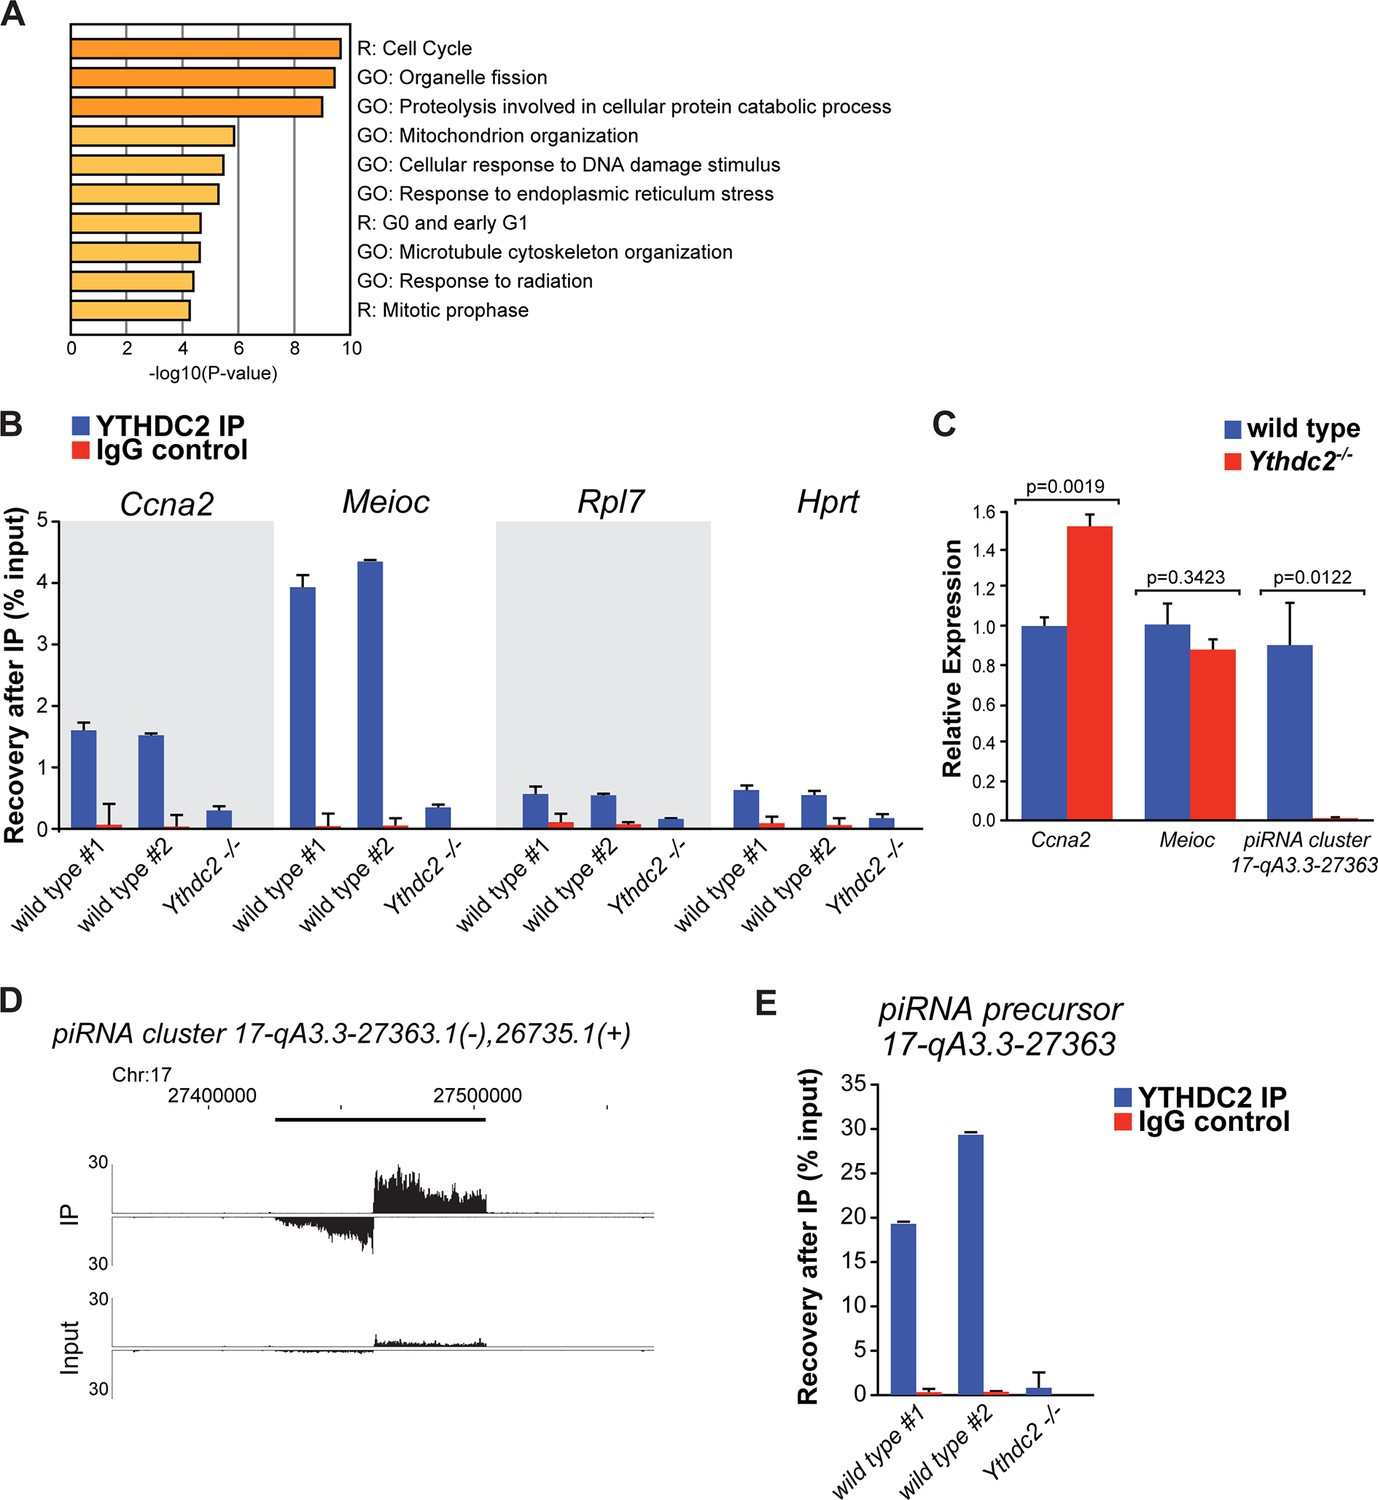
YTHDC2 binds specific RNA targets.
(A) Top GO and Reactome (R) -terms for mRNAs enriched by immunoprecipitation of YTHDC2 from wild-type P12 testes. (B) RT-qPCR analysis of RNA transcripts following fRIP for YTHDC2 (blue) or IgG (red) from formaldehyde cross-linked P12 testes. (C) Quantitative RT-PCR analysis of the expression levels of YTHDC2 interacting RNA transcripts Ccna2, Meioc, and the piRNA precursor RNA (cluster region 17-qA3.3–27363.1) in testes from P12 wild-type (blue) and Ythdc2-/- (red) mice (n = 3 mice per group; t test, p-values indicated on plot). Error bars: SEM. (D) UCSC Genome Browser plots of read coverage for input and fRIP sequencing libraries. The Y-axis represents normalized coverage of reads. (E) RT-qPCR analysis of the piRNA precursor cluster region 17-qA3.3–27363.1 following fRIP for YTHDC2 (blue) or IgG (red) from formaldehyde cross-linked P12 testes. See also Figure 8—figure supplement 1, Figure 8—figure supplement 2, Figure 8—source data 1 for the list of target RNAs identified by YTHDC2 immunoprecipitation after formaldehyde crosslinking, Figure 8—source data 2 and Figure 8—source data 3.
-
Figure 8—source data 1
RNAs enriched by fRIP for YTHDC2 from P12 testes.
- https://doi.org/10.7554/eLife.26116.033
-
Figure 8—source data 2
Validation of YTHDC2-bound RNAs by fRIP-qRT-PCR from P12 testes.
- https://doi.org/10.7554/eLife.26116.034
-
Figure 8—source data 3
Analysis of expression levels of YTHDC2-bound RNAs by qRT-PCR in P12 wild-type and Ythdc2-/- testes.
- https://doi.org/10.7554/eLife.26116.035
Figure 8—figure supplement 1
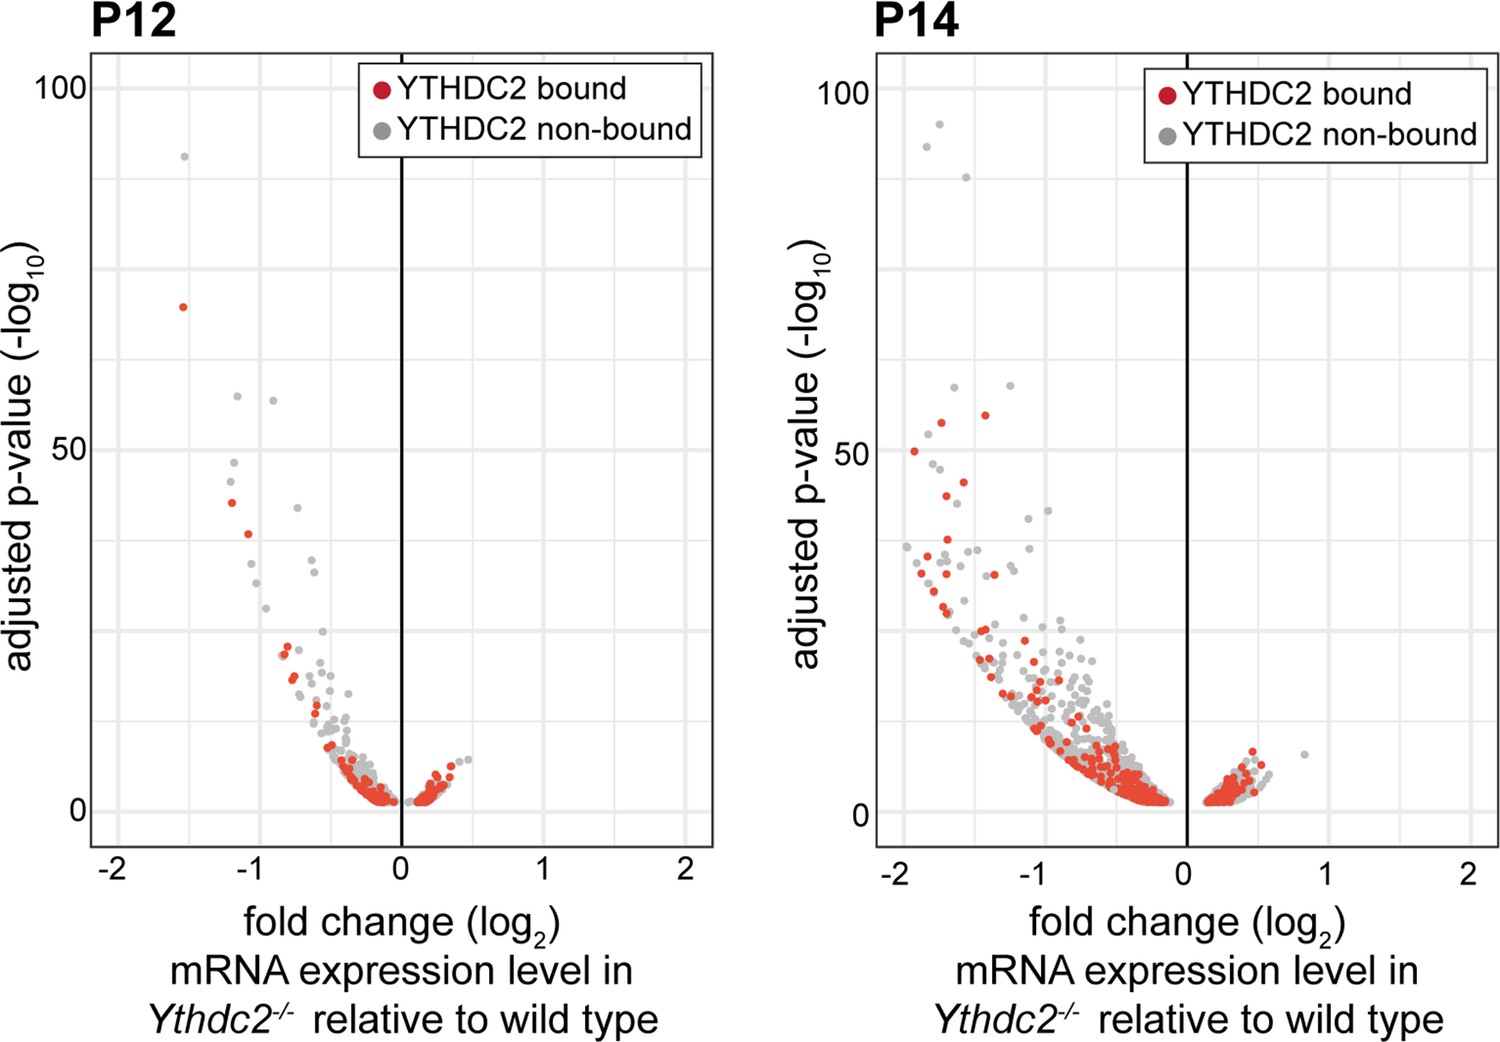
RNA expression levels of YTHDC2-bound RNAs in Ythdc2 mutant testes relative to wild type.
Volcano plots representing fold change differences in mRNA expression in Ythdc2 mutant testes relative to wild type at P12 and P14. YTHDC2-bound RNAs, determine by immunoprecipitation of YTHDC2 after formaldehyde crosslinking, are represented in red and non-bound RNAs are represented in gray.
Figure 8—figure supplement 2
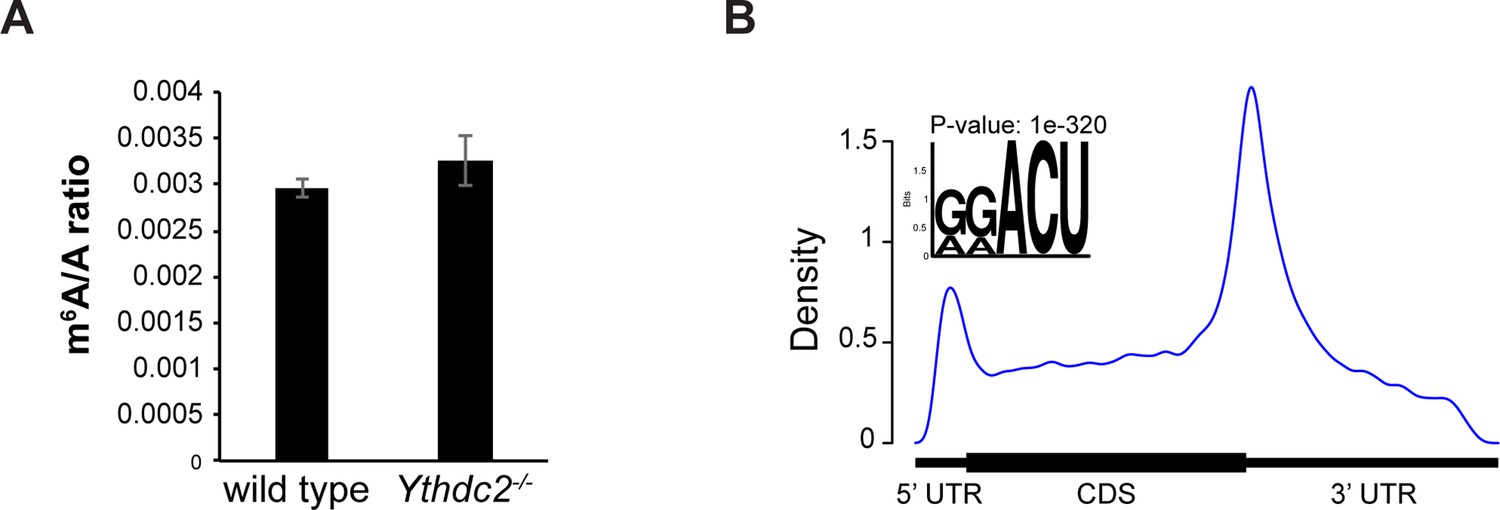
The m6A to A ratio is similar in wild-type and Ythdc2 mutant testes.
(A) Ratio of m6A to A levels in poly-A selected mRNAs from P12 wild-type and Ythdc2-/- testes based on HPLC. Error bars: STD. (B) Metagene representation of m6A modification sites in mRNAs of wild-type P12 testes. Sequence motif identified after analysis of m6A enrichment regions represented in the top left.
Figure 9 with 1 supplement
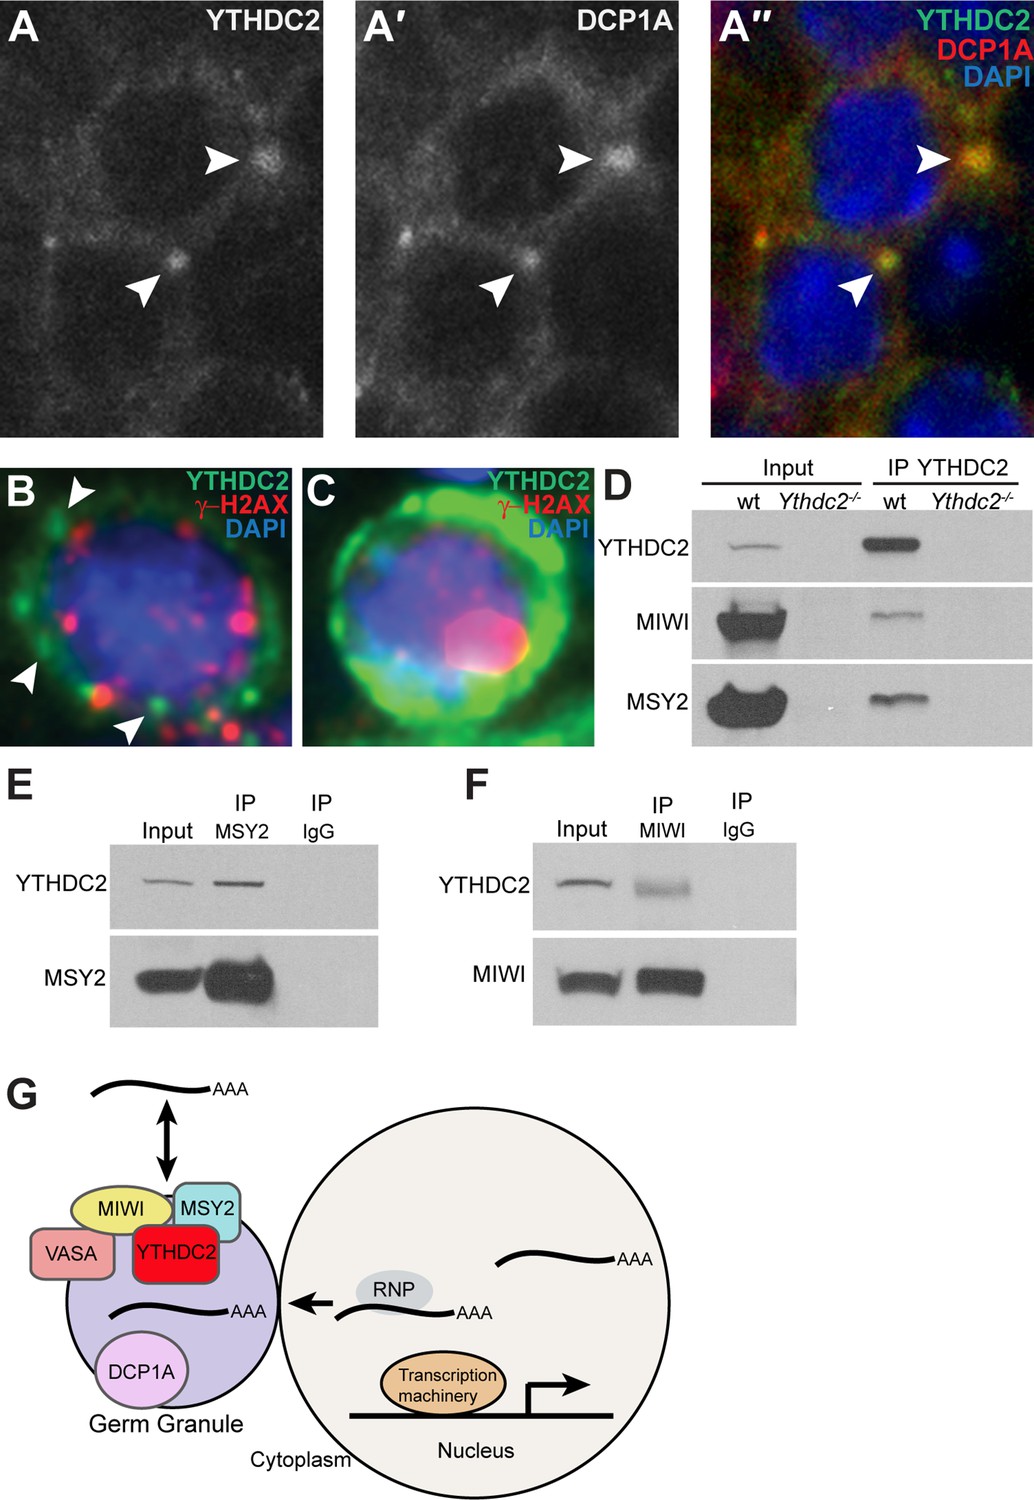
YTHDC2 localizes to RNA granules.
(A-A′′) High-magnification immunofluorescence images of spermatocytes from an adult mouse testis cross-section stained for YTHDC2 (green) DCP1A (red) and DAPI (blue). (B) High-magnification image of an early spermatocyte from a human testis cross-section stained for YTHDC2 (green), γ-H2AX (red) and DAPI (blue). (C) High-magnification image of a late, pachytene-stage spermatocyte from a human testis cross-section stained for YTHDC2 (green), γ-H2AX (red) and DAPI (blue). (D) Immunoprecipitation with α-YTHDC2 from adult wild-type (wt) and Ythdc2-/- mouse testis extracts. Western blots probed with α-YTHDC2, α-MIWI, or α-MSY2. (E) Immunoprecipitation with α-MSY2 and α-IgG from adult wild-type mouse testis extracts. Western blots probed with α-YTHDC2 and α-MSY2. (F) Immunoprecipitation with α-MIWI and α-IgG from adult wild-type mouse testis extracts. Western blots probed with α-YTHDC2 and α-MIWI. (G) Model for action of YTHDC2 with germ granule components in spermatocytes. See also Figure 9—figure supplement 1.
Figure 9—figure supplement 1
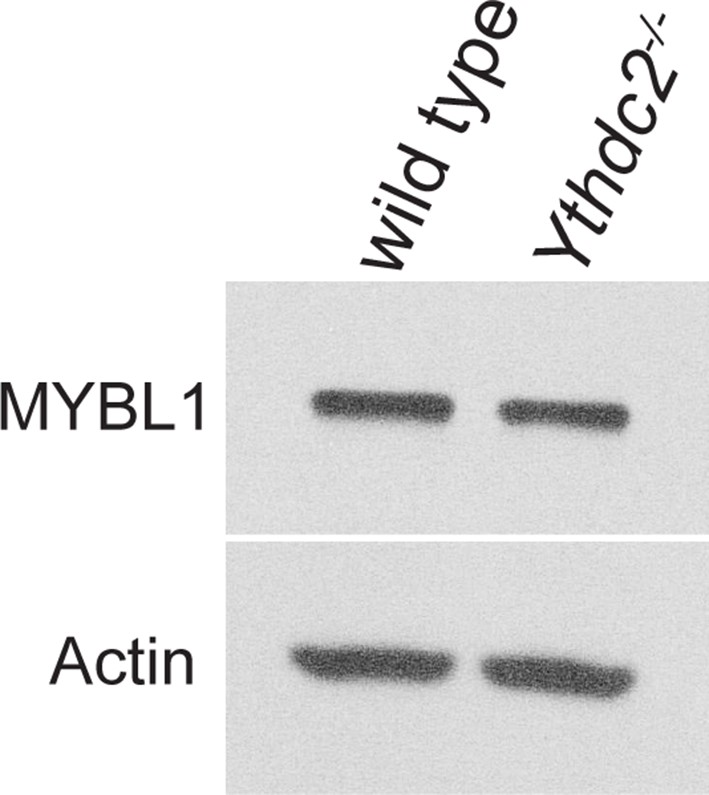
MYBL1 expression in Ythdc2 mutant testes.
MYBL1 (A-MYB) protein expression in P12 wild-type and Ythdc2-/- testes. Western blot probed with α-MYBL1 or α-Actin.
Additional files
-
Supplementary file 1
Breeding data for Ythdc2 heterozygous (Ythdc2+/-) mice showing that Ythdc2 null mutant mice are born at the expected Mendelian ratio.
- https://doi.org/10.7554/eLife.26116.038
-
Supplementary file 2
Breeding data for Ythdc2 homozygous mutant (Ythdc2-/-) mice showing that Ythdc2-/- mice are infertile.
- https://doi.org/10.7554/eLife.26116.039
-
Transparent reporting form
- https://doi.org/10.7554/eLife.26116.040
Download links
A two-part list of links to download the article, or parts of the article, in various formats.
Downloads (link to download the article as PDF)
Open citations (links to open the citations from this article in various online reference manager services)
Cite this article (links to download the citations from this article in formats compatible with various reference manager tools)
The conserved RNA helicase YTHDC2 regulates the transition from proliferation to differentiation in the germline
eLife 6:e26116.
https://doi.org/10.7554/eLife.26116


