Figures
Figure 1 with 6 supplements
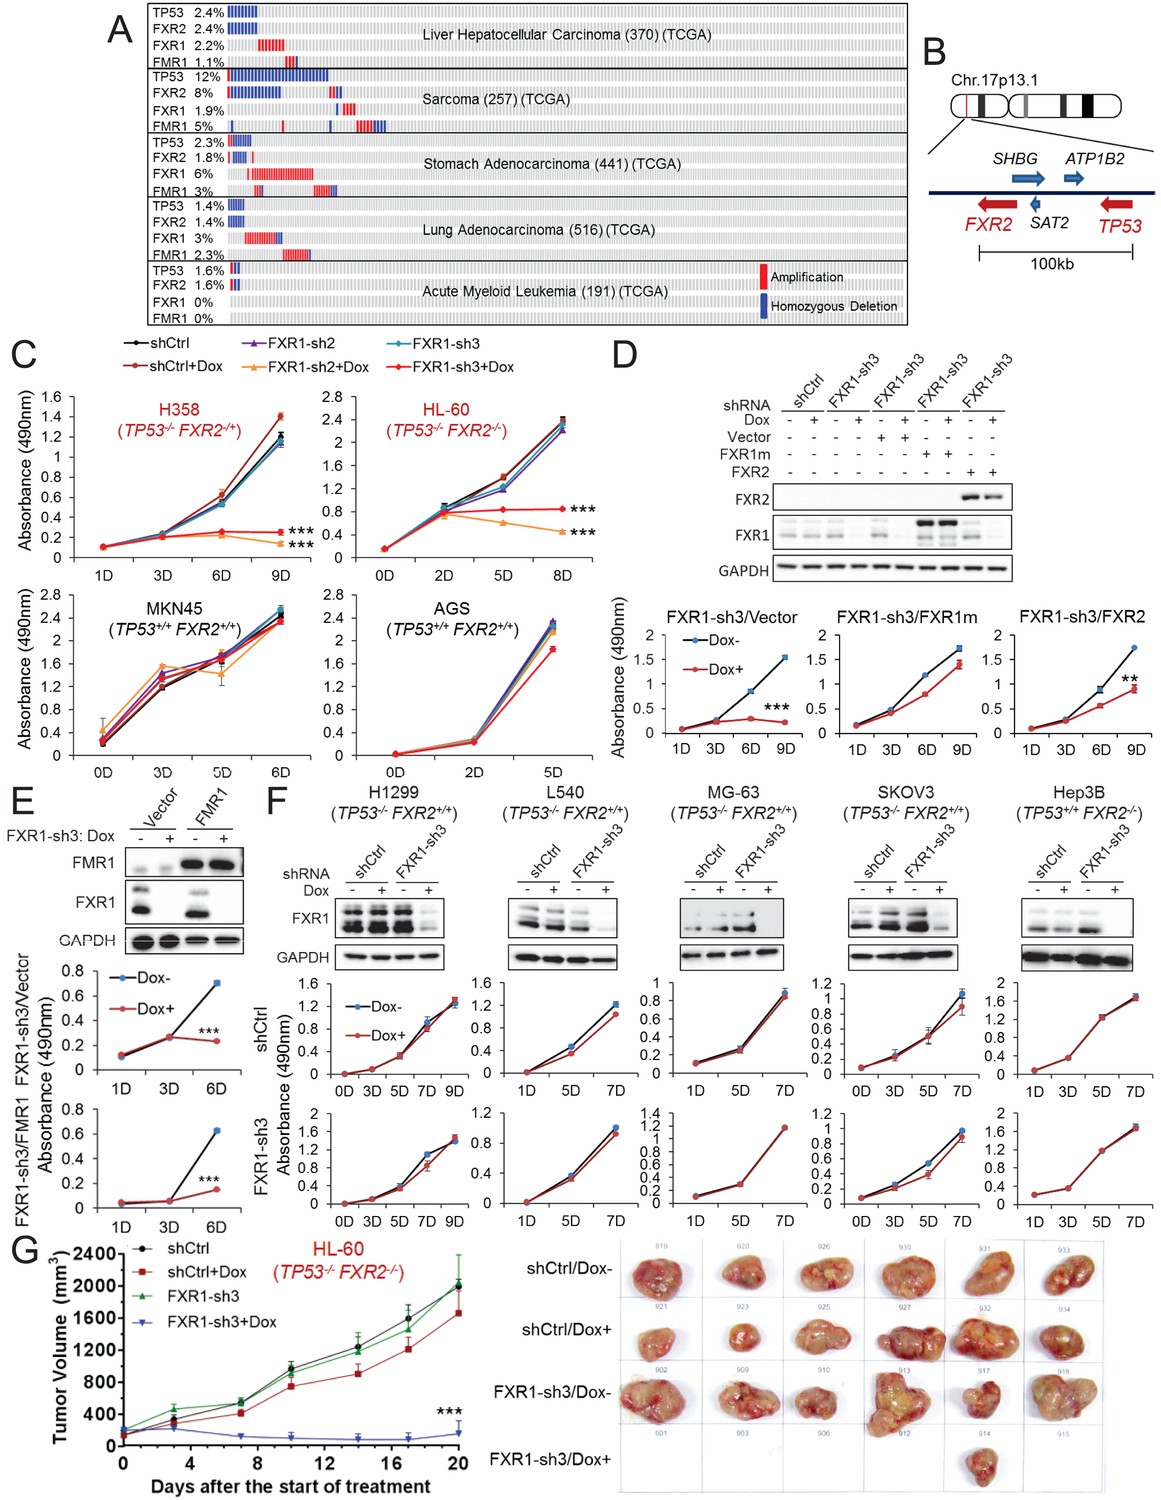
FXR1 knockdown inhibits cell proliferation in cancer cells containing both TP53 homozygous deletion and FXR2 passenger deletion.
(A) Copy number alterations in TP53, FXR2, FXR1, and FMR1 in various types of human tumors based on TCGA data analysis. (B) Schematic diagram of FXR2 and TP53 location at chromosome 17p13.1. (C) Cell proliferation rate upon FXR1 inducible knockdown. Measurements of change in cell proliferation rate induced by control shRNA (shCtrl) or by FXR1 shRNA (FXR1-sh2, FXR1-sh3) upon doxycycline (Dox) treatment (at indicated days) in TP53 and FXR2 co-deletion-containing cancer cell lines HL-60 and H358 (upper panel) and in the copy-number-normal cancer cell lines MKN45 and AGS (lower panel) using an MTS assay. Data represent the mean ± s.d. of three independent experiments. (D) Rescuing FXR1-sh3-induced anti-proliferation by ectopic expression of FXR1 or FXR2 in TP53/FXR2 deletion cancer cell line KATOIII. Upper panel: protein levels of a shRNA-resistant form of full-length FXR1 (FXR1m_a) or of FXR2 upon knockdown of endogenous FXR1 in a Western Blot (WB) assay. Lower panel, cell proliferation in vector, FXR1m_a, or FXR2 ectopic expression cells upon Dox-induced FXR1 knockdown in the MTS assay. Data represent the mean ± s.d. of three independent experiments. (E) Rescuing FXR1-sh3-induced anti-proliferation by ectopic expression of FMR1 in the TP53/FXR2 deletion cancer cell line H358. Upper panel: ectopic expression level of FMR1 and knockdown efficiency of FXR1 by Dox-induced shRNA. Lower panel, cell proliferation in H358 cells ectopically expressing vector or FMR1 upon Dox-induced FXR1 knockdown in the MTS assay. Data represent the mean ± s.d. of three independent experiments. (F) Cell proliferation change upon FXR1-inducible knockdown in cancer cells with a TP53 single deletion (H1299, L540, MG-63, SKOV3) or an FXR2 single deletion (Hep3B). Upper panel, FXR1 protein level upon shCtrl or FXR1-sh3 treatment. Lower panel, cell proliferation measurement in MTS assay. Data represent the mean ± s.d. of three independent experiments. (G) Tumor growth in cancer cell xenograft upon FXR1 knockdown. Left, growth curves of xenograft tumors derived from subcutaneously implanted HL-60 cells stably expressing shCtrl or FXR1-sh3 upon Dox treatment. Tumor volume (mm3) represents the mean ± s.e.m of six mice for each group after the indicated number of days with Dox treatment. Right, the tumor sizes on the termination day. The cell proliferation rate was determined by measuring absorbance at 490 nm in the MTS assay (Y axis). *p<0.05, **p<0.01, ***p<0.001. Also see Figure 1—figure supplements 1, 2, 3, 4, 5 and 6.
-
Figure 1—source data 1
Source data for Figure 1.
- https://doi.org/10.7554/eLife.26129.010
Figure 1—figure supplement 1
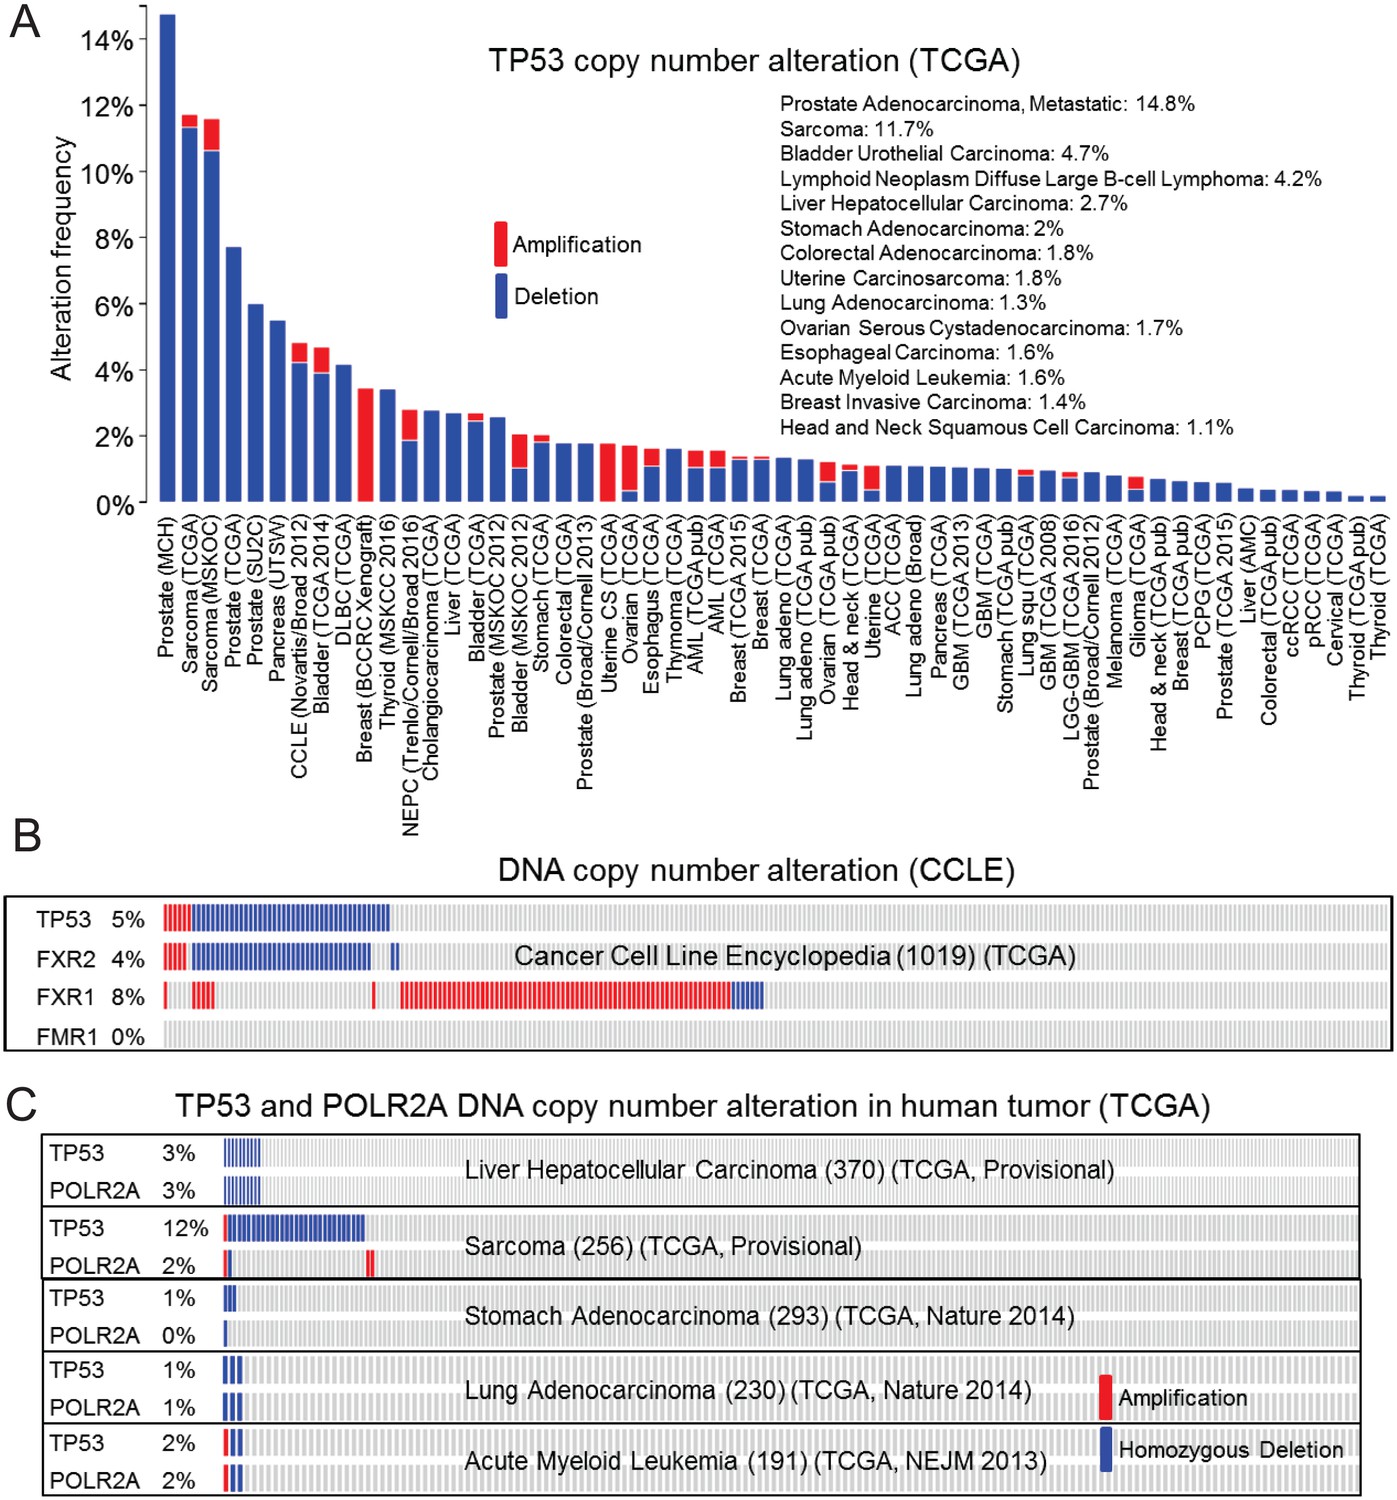
Passenger deletion of FXR2 in TP53 homozygous deletion cancer.
(A) TP53 homozygous deletion frequency in human cancers based on The Cancer Genome Atlas (TCGA) database analysis. Blue bar, homozygous deletion. Red bar, amplification. (B) TP53, FXR2, FXR1, and FMR1 copy number alteration in human cancer cell lines based on the Cancer Cell Line Encyclopedia (CCLE) database. (C) TP53 and POLR2A copy number alteration in human cancers based on TCGA database analysis. Blue bar, homozygous deletion. Red bar, amplification.
Figure 1—figure supplement 2
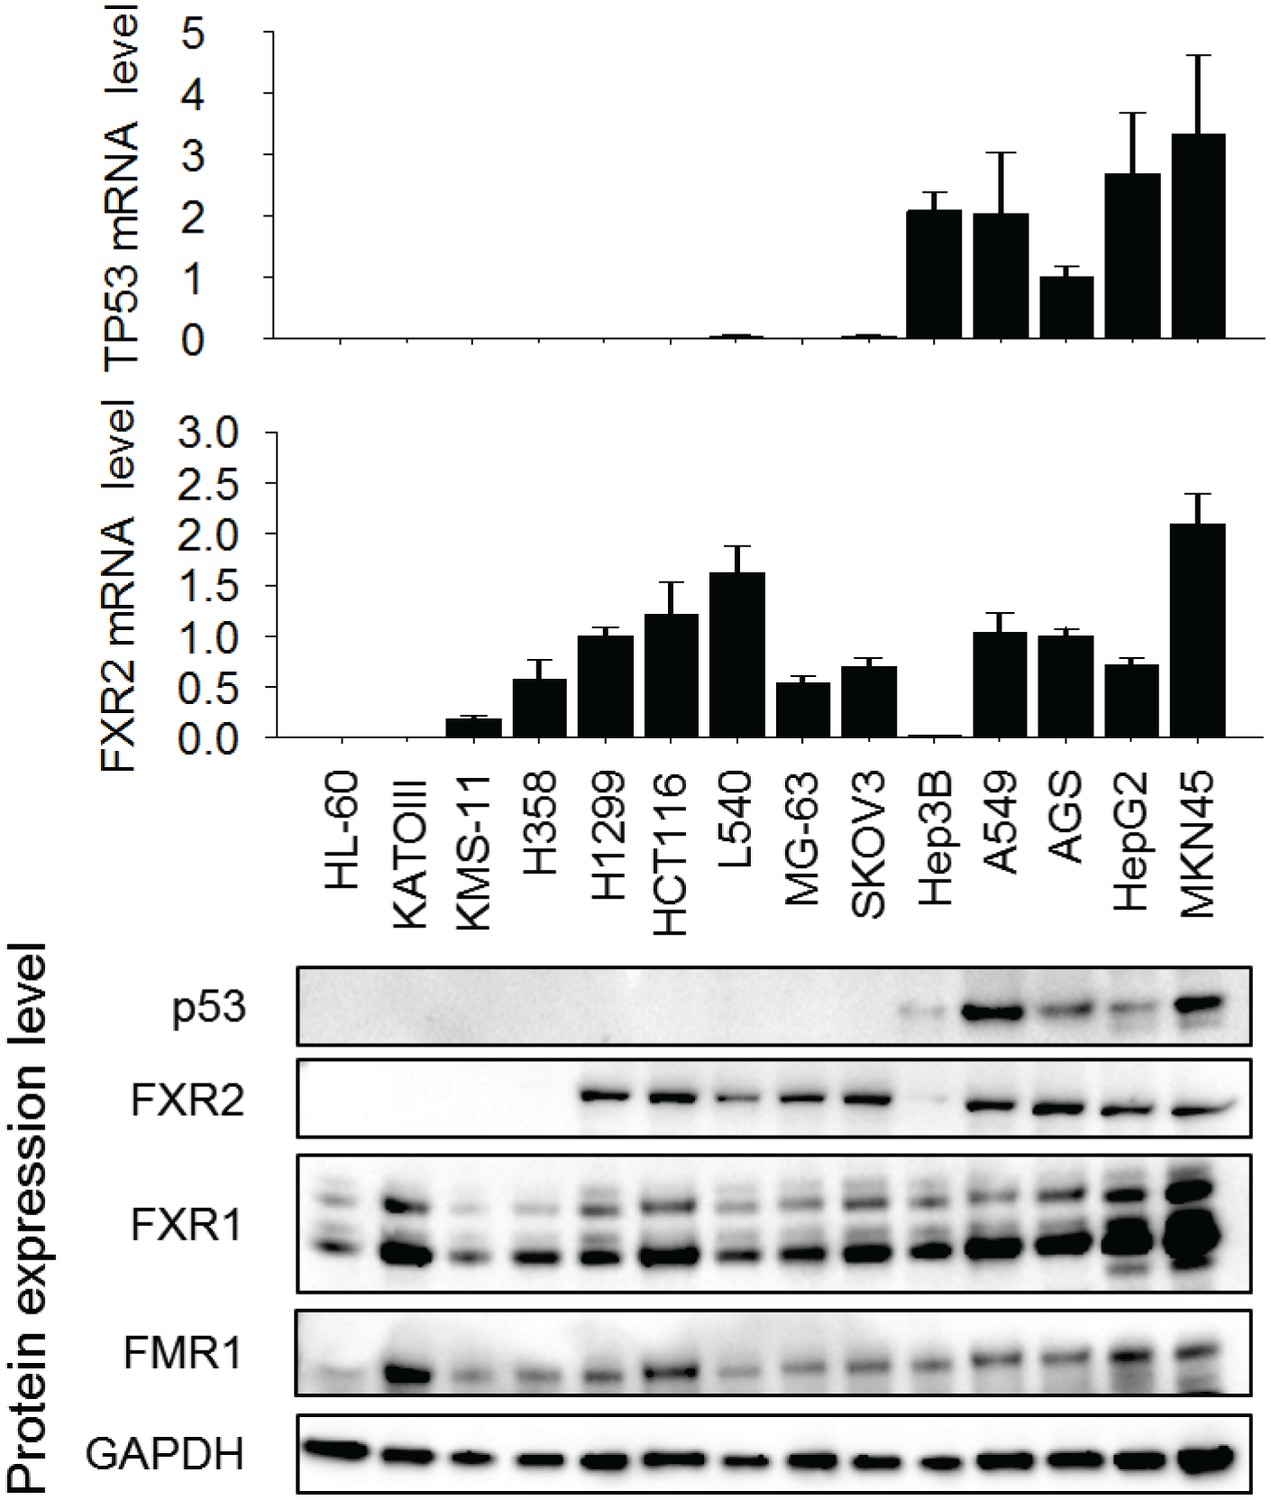
Expression of p53, FXR2, FXR1 and FMR1 in human cancer cell lines.
The expression level was detected by q-RT-PCR (a) and Western Blot (WB) assay (b). Doxorubicin (1 µM, 24 hr) was used to trigger p53 protein expression. The mRNA level shown in (a) is fold change normalized to GAPDH mRNA level, data represent mean ± s.d. of three independent experiments. The mRNA level in AGS cells is set as 1.
-
Figure 1—figure Supplement 2—source data 1
Source data for Figure 1—figure supplement 2.
- https://doi.org/10.7554/eLife.26129.011
Figure 1—figure supplement 3
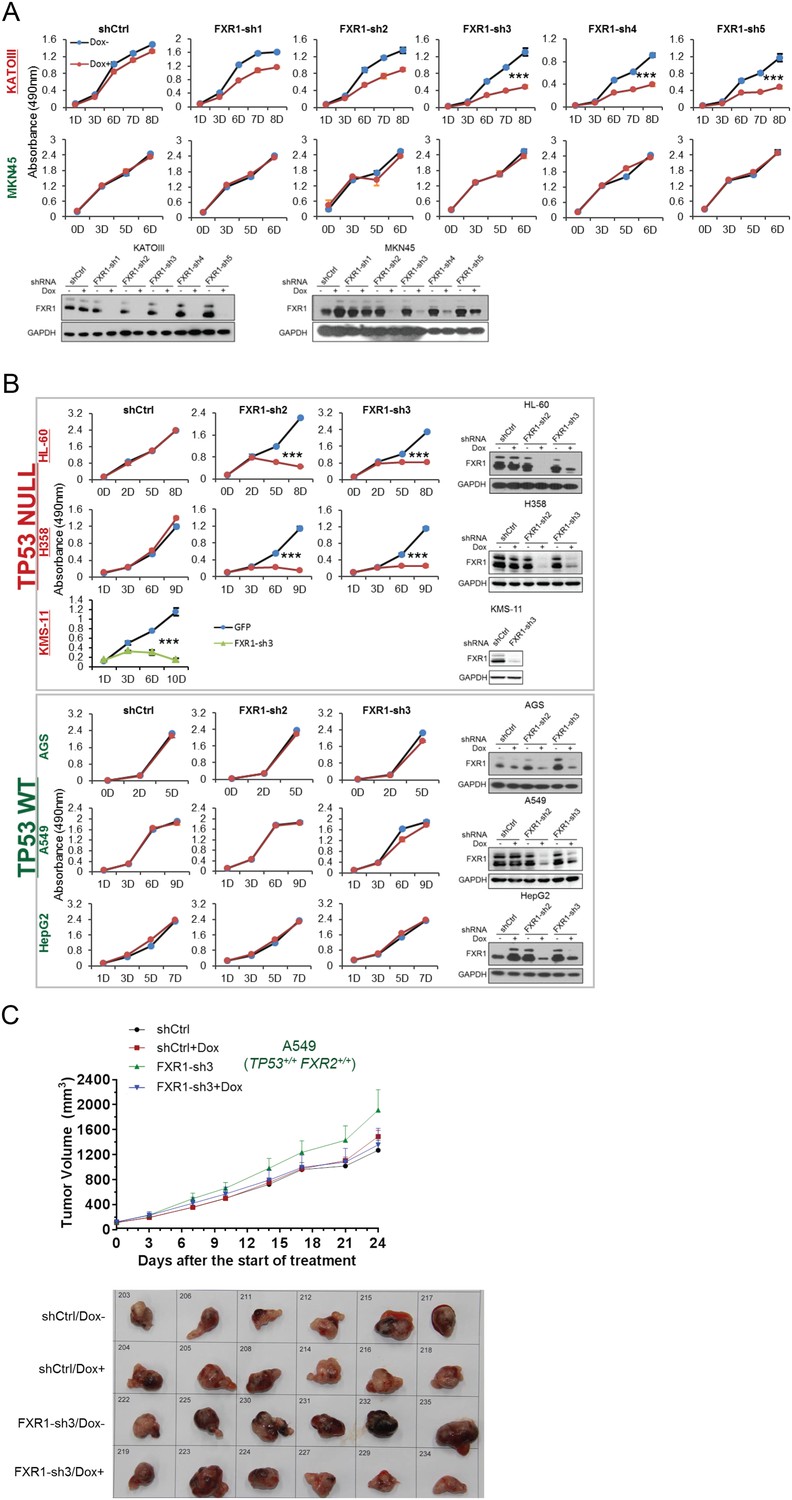
FXR1 knockdown inhibits cell proliferation in TP53 homozygous deletion cancers upon passenger deletion of FXR2.
(A) Knockdown efficiency of five independent doxycycline (Dox)-inducible short hairpin RNAs (shRNA) against FXR1 (FXR1-sh1-5) tested by WB in KATOIII (TP53/FXR2 co-deletion) or MKN45 (copy-number-normal) cells individually (lower panel). The stable cell lines are subjected to cell proliferation MTS assay upon Dox treatment (upper panel). Data represent the mean ± s.d. of three independent experiments. (B) Cell proliferation regulation by FXR1-inducible knockdown. Measurement of control shRNA (shCtrl)- and FXR1 shRNA (FXR1-sh2, FXR1-sh3)-induced anti-proliferation upon doxycycline (Dox) treatment (at indicated days) in TP53/FXR2 deletion-containing cancer cell lines (HL-60, H358, KMS-11) and in the copy-number-normal cancer cell lines (AGS, A549, HepG2) in an MTS assay. FXR1 knockdown in KMS-11 cells is induced by adenoviral shRNA. Data represent the mean ± s.d. of three independent experiments. (C) Tumor growth in cancer cell xenografts upon FXR1 knockdown. Upper, growth curves of xenograft tumors derived from subcutaneously implanted A549 cells stably expressing shCtrl or FXR1-sh3 upon Dox treatment. Tumor volume (mm3) represents the mean ± s.e.m of six mice for each group after the indicated number of days with Dox treatment. Lower, the tumor sizes at the termination day. Cell proliferation rate was determined by measuring absorbance at 490 nm in an MTS assay (Y axis). *p<0.05, **p<0.01, ***p<0.001.
-
Figure 1—figure supplement 3—source data 1
Source data for Figure 1—figure supplement 3.
- https://doi.org/10.7554/eLife.26129.012
Figure 1—figure supplement 4
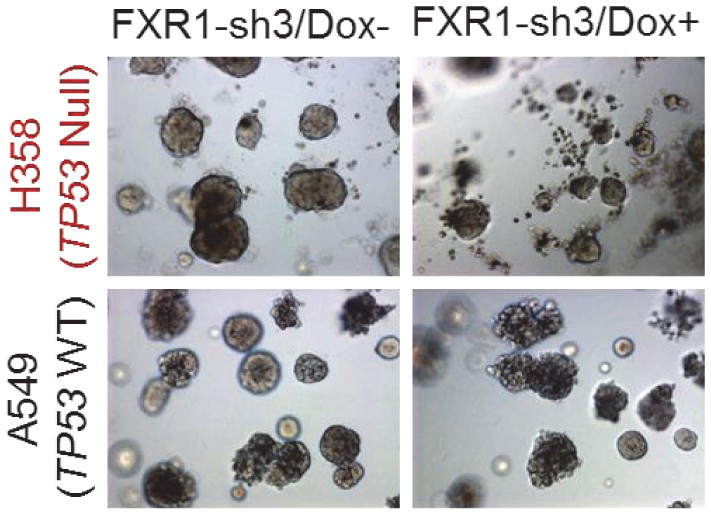
FXR1 knockdown inhibits cell growth in a Matrigel-based three-dimensional assay.
H358 (TP53/FXR2 co-deletion) and A549 (copy-number-normal) cells stably expressing FXR1-sh3 were seeded on Matrigel for one day and then treated with Dox for seven days. The organoids image represents one out of three independent experiments.
Figure 1—figure supplement 5

Rescuing FXR1 shRNA-induced anti-proliferation by ectopic expression of FXR1.
Upper, ectopic expression of lentiviral shRNA-resistant full-length FXR1 (FXR1m_a) restores Dox-induced knockdown of endogenous FXR1 in HL-60/FXR1-sh2 or HL-60/FXR1-sh3 cells. Middle, ectopic FXR1m rescues FXR1 shRNA-induced anti-proliferation, measured by MTS assay in HL-60/FXR1-sh2 or HL-60/FXR1-sh3 cells. Data represent the mean ± s.d. of three independent experiments. Lower, representative cell image in the rescuing study. The cell proliferation rate was determined by measuring absorbance at 490 nm in an MTS assay (Y axis). *p<0.05, **p<0.01, ***p<0.001.
-
Figure 1—figure supplement 5—source data 1
Source data for Figure 1—figure supplement 5.
- https://doi.org/10.7554/eLife.26129.013
Figure 1—figure supplement 6
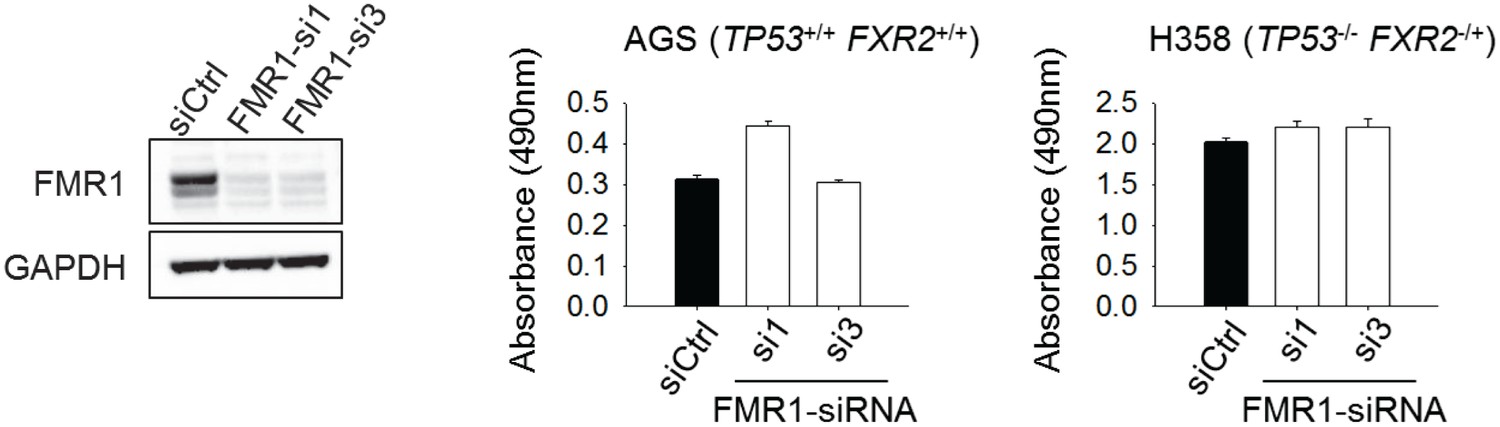
The effect of FMR1 knockdown on cancer cell proliferation.
Left, siRNA-mediated FMR1 expression silence in H358 cells. Right, cell proliferation rate of H358 (TP53/FXR2 co-deletion) or AGS (copy-number-normal) cells upon FMR1 knockdown was detected by MTS assay. The cell proliferation rate in MTS was determined by measuring absorbance at 490 nm (Y axis). Data represent the mean ± s.d. of three independent experiments.
-
Figure 1—figure supplement 6—source data 1
Source data for Figure 1—figure supplement 6.
- https://doi.org/10.7554/eLife.26129.014
Figure 2 with 3 supplements
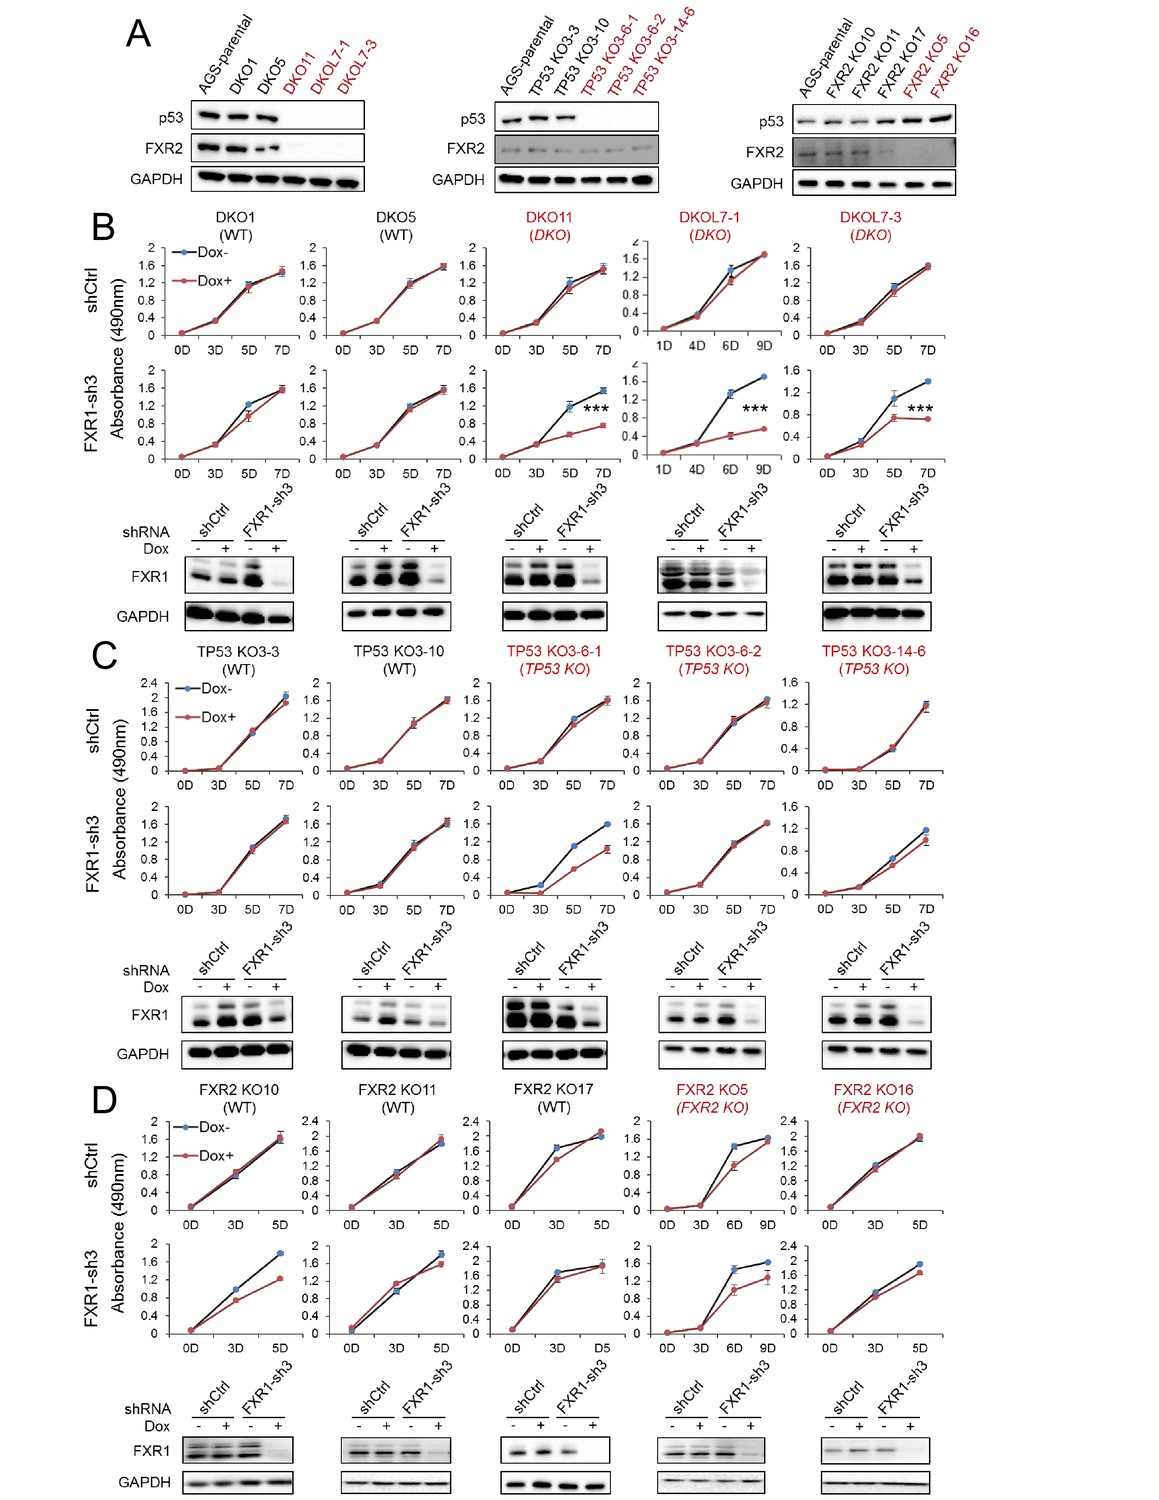
FXR1 knockdown inhibits cell proliferation in engineered TP53/FXR2 double knockout cancer cell clones.
(A) Protein levels of p53 and FXR2 in the CRISPR-Cas9-engineered copy-number-normal (WT) and knockout (KO) cell clones generated from the TP53/FXR2 copy-number-normal parental cancer cell line AGS. Western blots (WBs) for individual cell clones from TP53/FXR2 double knockout (DKO) (left), TP53 single knockout (TP53 KO) (middle), and FXR2 single knockout (FXR2 KO) lines (right) were analyzed in the presence of doxorubicin treatment (1 µM for 24 hr to trigger p53 expression). Wild type clones are in black, and KO clones are in red. (B–D) Cell proliferation in the engineered AGS cell clones upon FXR1 knockdown. Upper panel, measurement of cell growth using the MTS assay. Lower panel, Dox-induced FXR1 knockdown in WB assay. Data represent the mean ± s.d. of three independent experiments. The cell proliferation rate was determined by measuring absorbance at 490 nm in an MTS assay (Y axis). *p<0.05, **p<0.01, ***p<0.001. Also see Figure 2—figure supplements 1, 2 and 3.
-
Figure 2—source data 1
Source data for Figure 2.
- https://doi.org/10.7554/eLife.26129.021
Figure 2—figure supplement 1
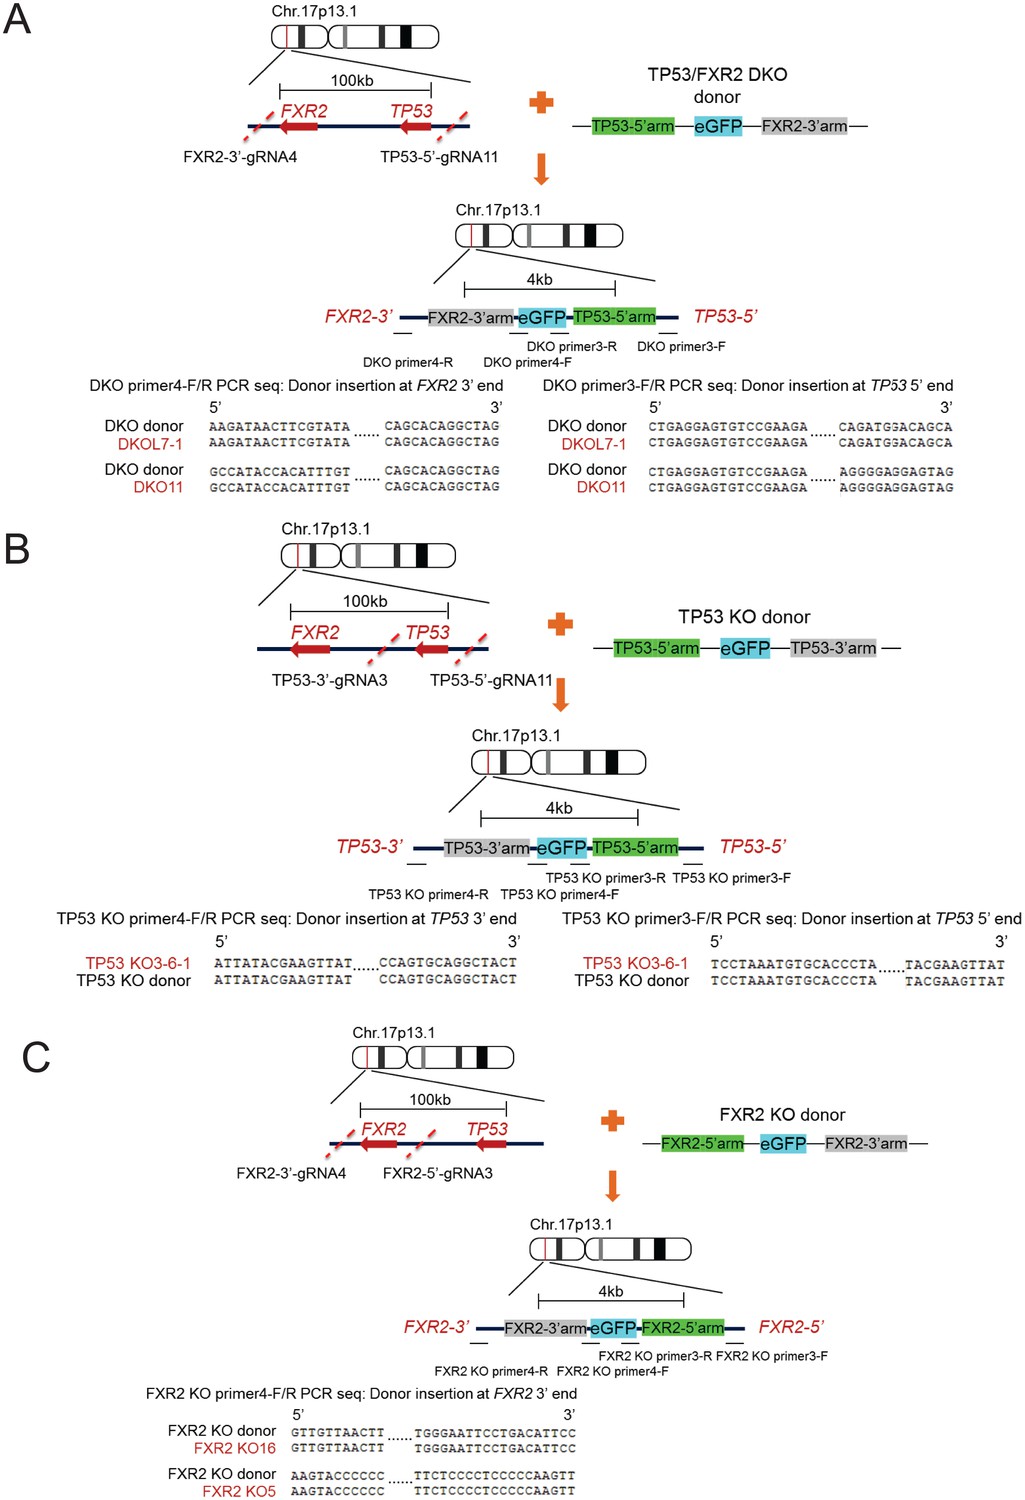
CRISPR-Cas9-engineered TP53/FXR2 knockout clones.
Diagram illustrating the location of TP53 and FXR2 on chromosome 17, gRNA target position, donor plasmid design, and assay flow of knockout generation followed by genomic PCR sequencing showing the proper replacement of the targeted genomic region with donor sequence in TP53/FXR2 double knockout (DKO) clones (A), TP53 single knockout (KO) clones (B), and FXR2 single KO clones (C).
Figure 2—figure supplement 2
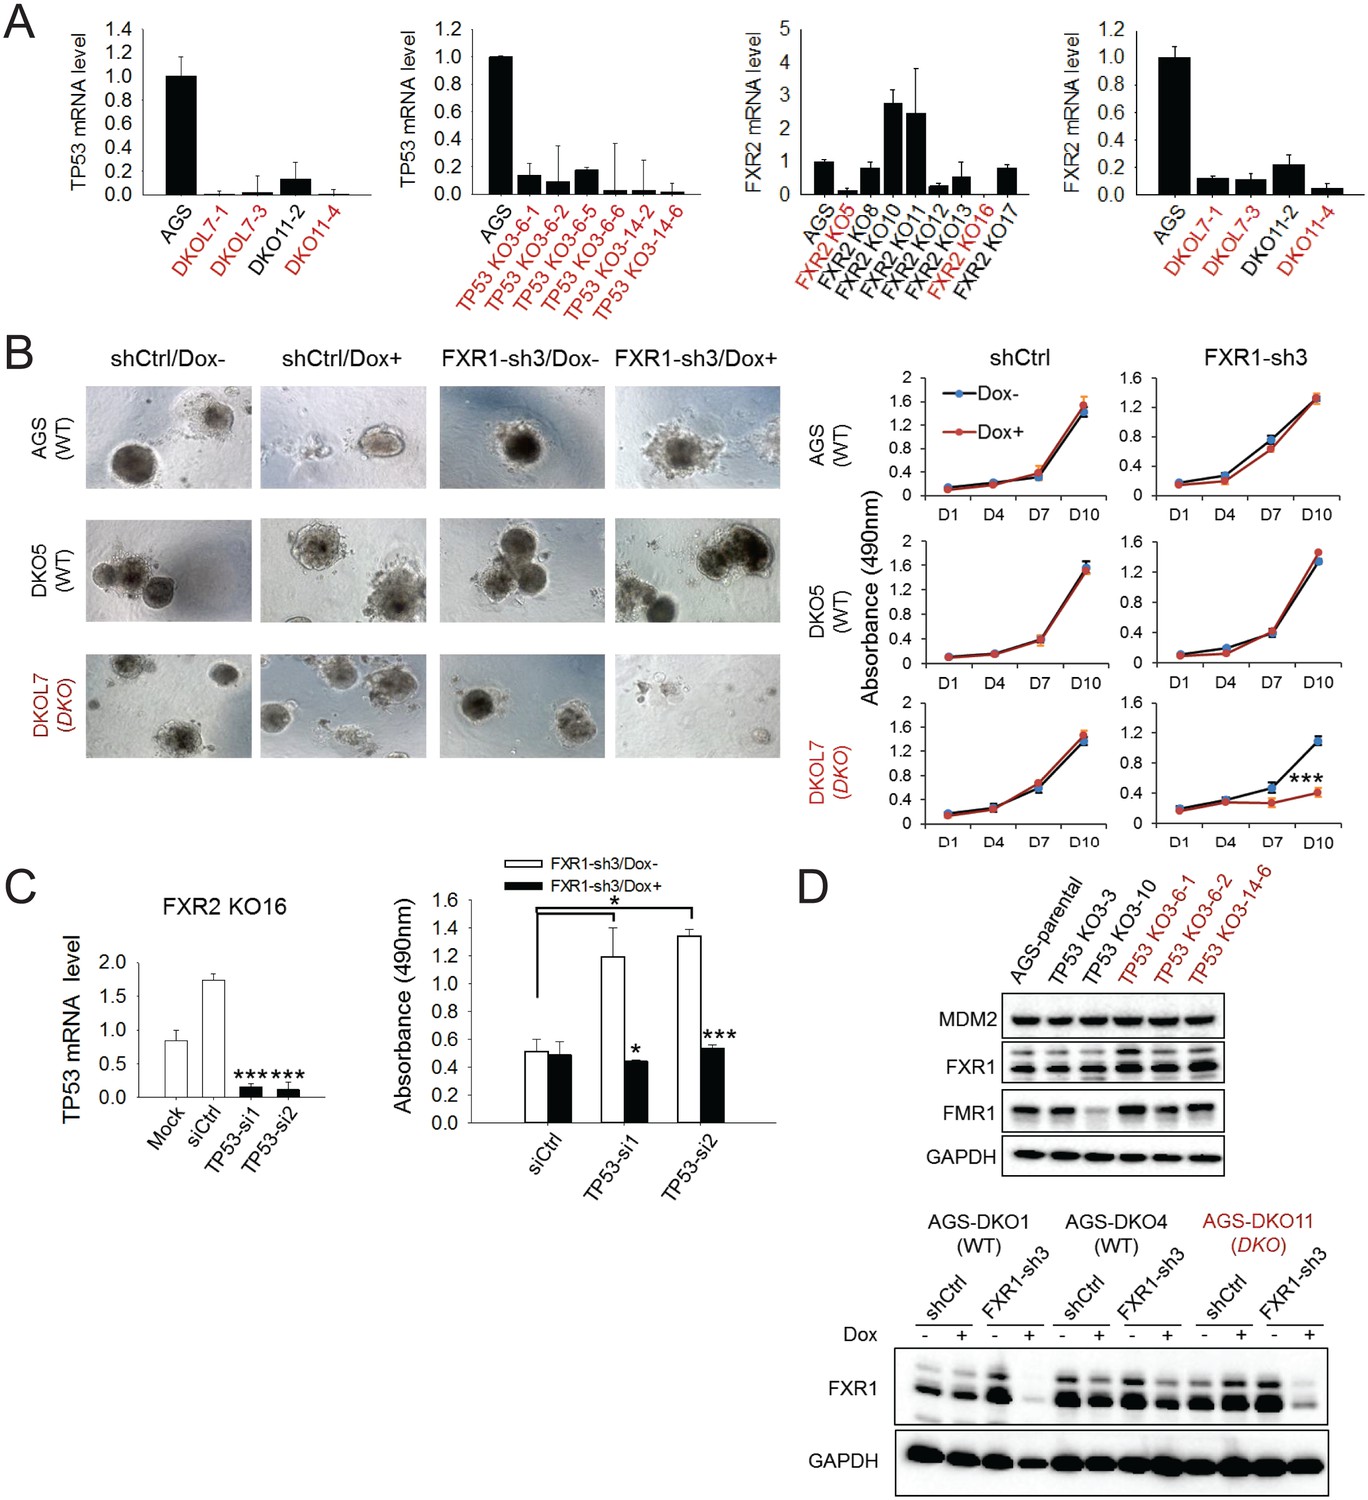
Effect of FXR1 knockdown on cell proliferation in CRISPR-Cas9-engineered clones.
(A) TP53 and/or FXR2 expression in TP53/FXR2 double knockout (DKO) clones (left), TP53 single knockout (KO) clones (middle), and FXR2 single KO clones (right) as determined by q-RT-PCR. The mRNA level in AGS parental cells is set as 1. The wild-type clones are in black, and the KO clones are in red. (B) AGS parental cells, DKO5 clones (copy-number-normal, WT), or double knockout DKOL7 clones (TP53/FXR2 double knockout) stably expressing control shRNA (shCtrl) or FXR1-sh3 were cultured on Matrigel for one day and then treated with Dox for up to 10 days. Left, organoids were imaged at the last time point. Right, cell growth in organoids was measured by MTS assay at the indicated time points. Data represent the mean ± s.d. of three independent experiments. The cell proliferation rate in MTS was determined by measuring absorbance at 490 nm (Y axis). (C) p53 deficiency is required for FXR1’s function in proliferation regulation. Left, TP53 siRNAs-mediated silence of expression. siCtrl, control non-coding siRNA. Right, effect of TP53 siRNA and the combination with FXR1 knockdown on cell proliferation in the FXR2 knockout clone KO16. Data represent the mean ± s.d. of three independent experiments. The cell proliferation rate in MTS was determined by measuring absorbance at 490 nm (Y axis). The mRNA level shown in q-RT-PCR is fold-change normalized to GAPDH. Data represent mean ± s.d. of three independent experiments. *p<0.05, **p<0.01, ***p<0.001. (D) Protein level of FXR1, FMR1 and MDM2 in AGS normal (WT) and TP53 knockout (KO) or TP53/FXR2 double KO (DKO) cells by immunoblotting. The knockout clones are marked in red. GAPDH is used as an internal control.
-
Figure 2—figure Supplement 2—source data 1
Source data for Figure 2—figure supplement 2.
- https://doi.org/10.7554/eLife.26129.022
Figure 2—figure Supplement 3

FXR2 knockdown inhibits cell proliferation in engineered TP53/FXR1 double-knockout cancer cell clones.
Upper left, protein level of FXR1 in the CRISPR-Cas9-engineered FXR1 copy-number-normal (WT) and knockout (KO) cell clones generated from the TP53 single knockout (TP53 KO) clone TP53 KO3-6-1. Upper right, FXR2 protein level upon shCtrl, FXR2-sh2 or FXR2-sh3 treatment. The wild-type clones are in black, and the KO clones are in red. Lower, cell proliferation in the engineered AGS cell clones upon FXR2 knockdown. Data represent the mean ± s.d. of three independent experiments. Cell proliferation rates in the MTS assay were measured by the absorbance at 490 nm (Y axis). *p<0.05, **p<0.01, ***p<0.001.
-
Figure 2—figure supplement 3—source data 1
Source data for Figure 2—figure supplement 3.
- https://doi.org/10.7554/eLife.26129.023
Figure 3
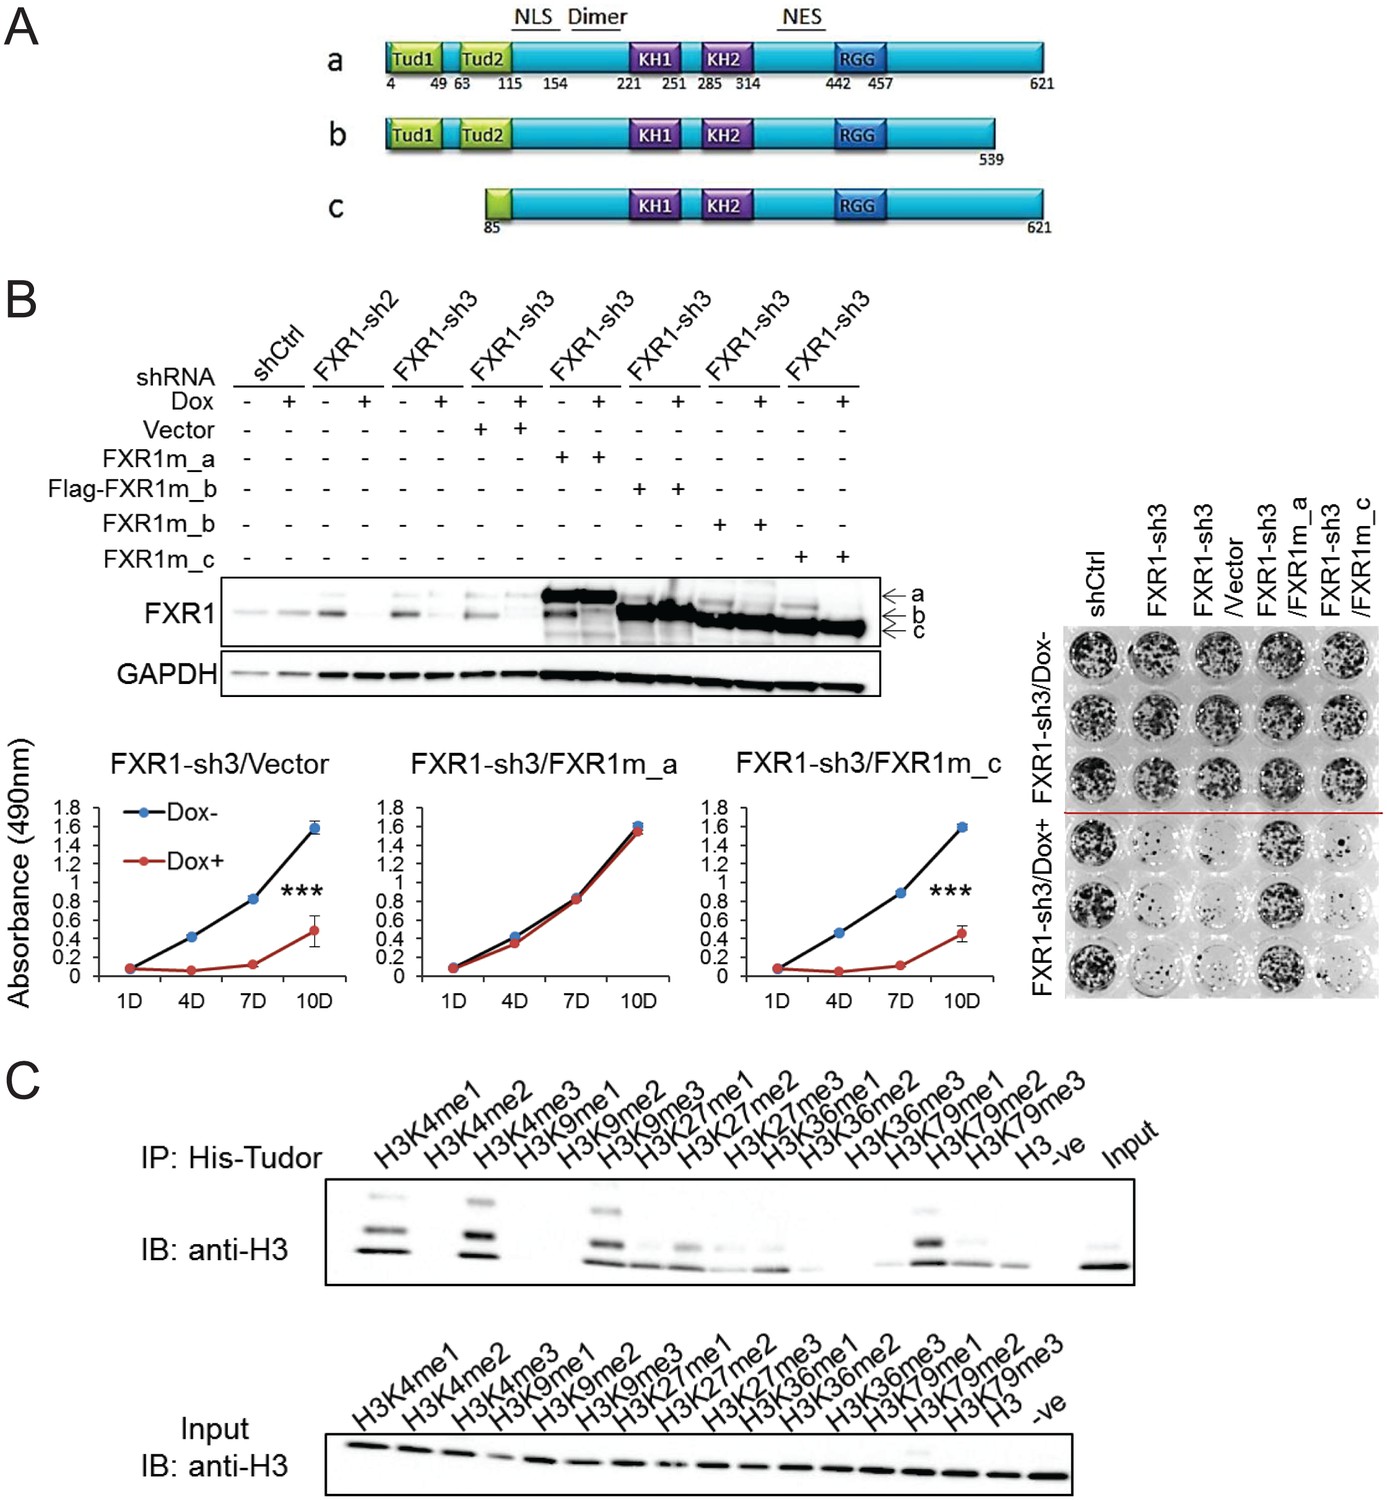
Tandem Tudor domain is required for FXR1’s function in cell proliferation.
(A) Schematic diagrams of FXR1 domains and isoforms: the full-length isoform a, the C-terminal tail truncated isoform b, and the N-terminal tandem Tudor truncated isoform c. (B) Comparison of rescuing capability among FXR1 isoforms in the H358 cell line. Upper, ectopic expression of the FXR1 shRNA-resistant isoforms (FXR1m_a, FXR1m_b, Flag-tagged-FXR1m_b, and FXR1m_c) upon Dox-induced FXR1 knockdown in a WB assay. Lower, cell proliferation measurement by MTS assay. Data represent the mean ± s.d. of three independent experiments. The crystal violet cell-staining represents the duplicate study at the last time point (after 10 days of Dox treatment). The cell proliferation rate was determined by measuring absorbance at 490 nm in an MTS assay (Y axis). *p<0.05, **p<0.01, ***p<0.001. (C) Tudor-histone H3 interaction assessed using the methyl lysine analog (MLA) protein with lysine methylation at various residues and His-tag FXR1 tandem Tudor protein in an in vitro pull down assay. –ve, negative control, pulldown of H3K4me3 MLA protein without the His-tagged-TudorFXR1.
-
Figure 3—source data 1
Source data for Figure 3.
- https://doi.org/10.7554/eLife.26129.025
Figure 4 with 1 supplement

FXR1 protein complex identified by chromatin immunoprecipitation–mass spectrometry.
(A) Coomassie-blue-stained sodium dodecyl sulfate (SDS) gel showing the endogenous proteins immunoprecipated from cross-linked and single-nucleosome-generated KATOIII cell lysate using validated anti-FXR1 antibody or IgG control. The potential FXR1 interacting proteins identified by the ChIP-MS assay followed by Cytoscape/GenePro analysis are labelled listed on the right side according to their molecular weight (MW). Also see Supplementary file 1. (B) FXR1 protein complexes identified by ChIP-MS in H358 and KATOIII from Cytoscape/GenePro screenshot. Each circle represents an individual FXR1-interacting protein. Circle size indicates Gene Ontology (GO) term scale. The lines connecting the circles indicate the protein–protein interactions analyzed using the Kyoto Encyclopedia of Genes and Genomes (KEGG) pathway database. The Database for Annotation, Visualization and Integrated Discovery (DAVID) was used to cluster the potential FXR1-interacting proteins according to their function. Different colors represent selected major protein clusters, including mRNA binding and stability (red), mRNA localization and transportation (orange), translation (yellow), mRNA splicing/metabolism (green), chromatin/chromosome organization (light blue), transcription (dark blue), and replication (purple). Representative proteins are also listed for each function cluster. Also see Supplementary file 2. (C) Validation of the interaction between FXR1 and the proteins identified by ChIP-MS using the ChIP-Western blot (WB) assay by analyzing ChIP pull-down complexes in SDS-PAGE gel with validated specific antibodies. The lower panel shows the result in the H358 cell line. (D) The interaction between FXR1 and STAT1 or STAT3 evaluated by in vitro pull-down assay using purified Flag-tagged-FXR1 (full-length isoform a) and HA-tagged-STAT1/3. Anti-Flag or anti-HA antibodies were used to pull down the purified proteins. The proteins are detected using their specific antibodies in an immunoblotting assay. Also see Figure 4—figure supplement 1.
Figure 4—figure supplement 1
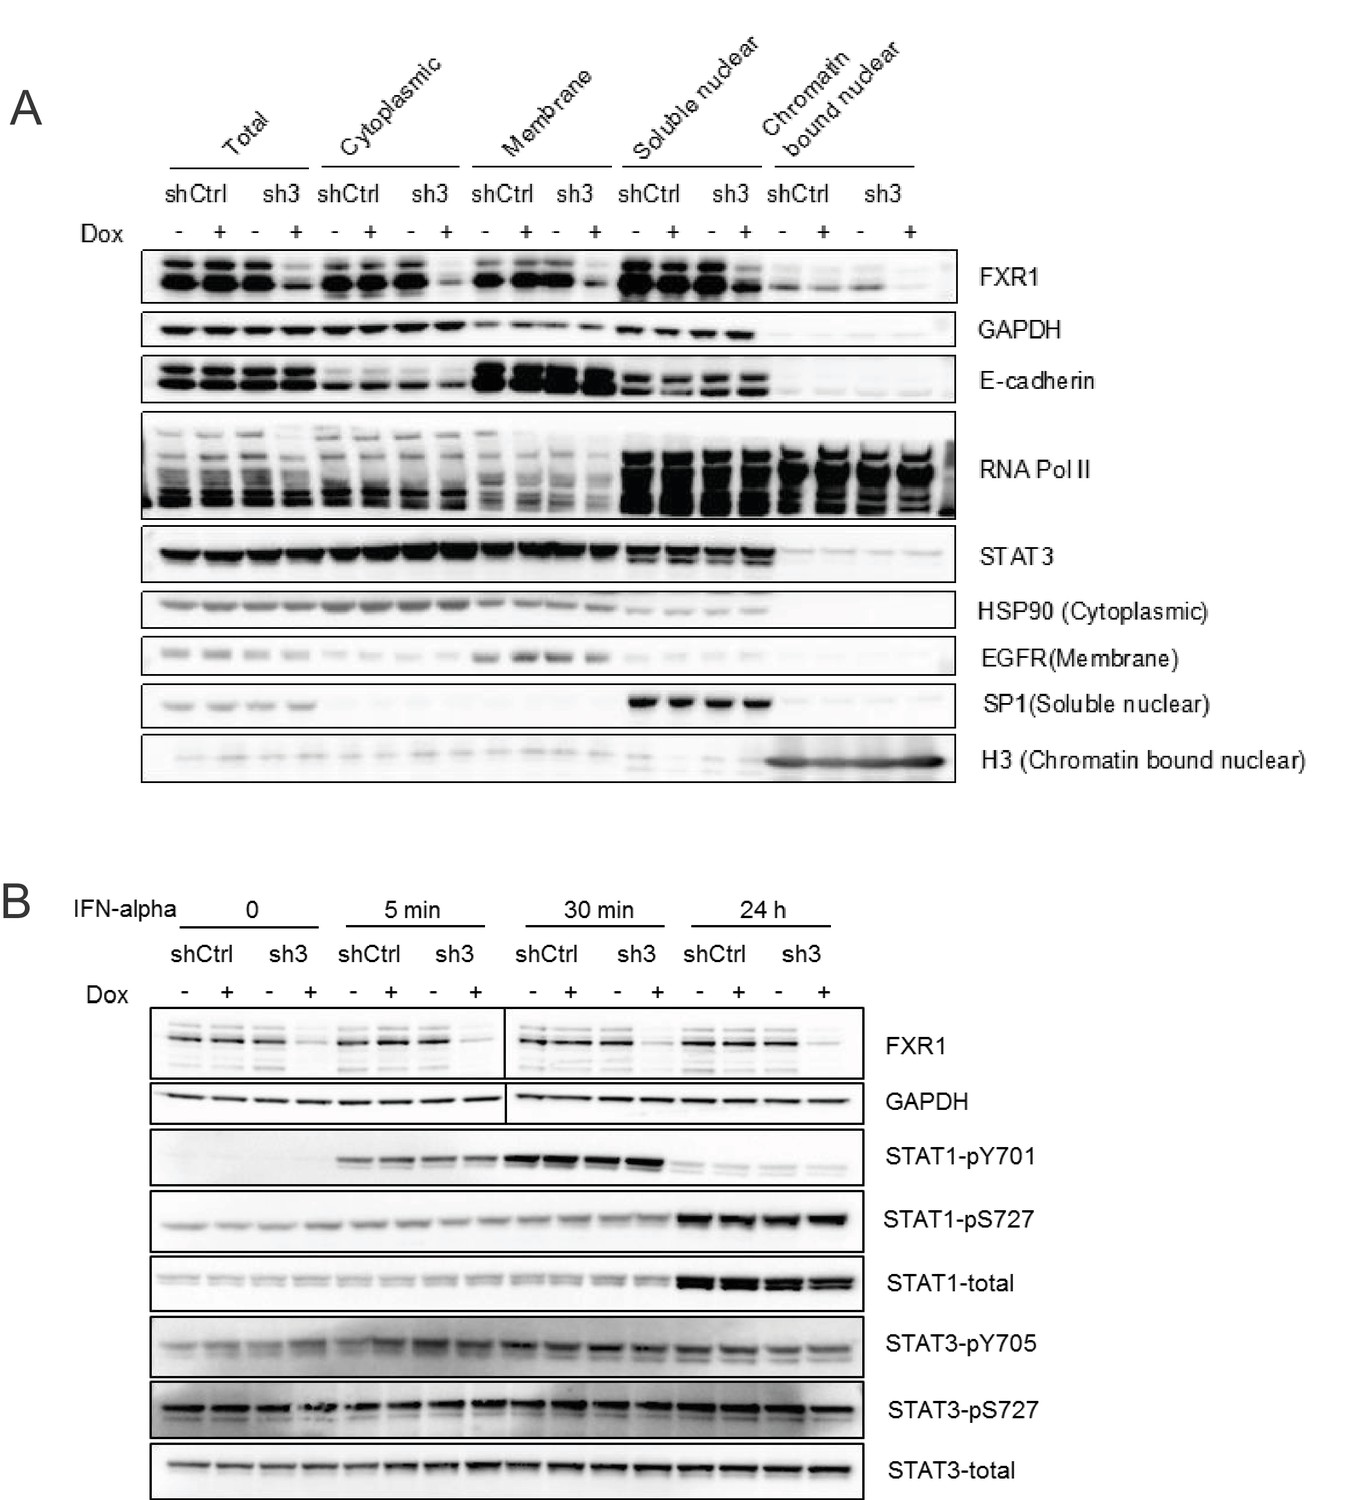
FXR1 knockdown does not affect the cytoplasm-nucleus shuttling or phosphorylation of STATs.
(A) H358/FXR1-sh3 (sh3) and H358/control shRNA (shCtrl) cells were treated with Dox for three days. The fractions of cytoplasm, membrane, soluble nucleus, and chromatin-bound nucleus were separated using the Subcellular Protein Fractionation Kit for Cultured Cells (Thermo scientific, 78840) and subjected to protein detection in a WB assay to determine STAT translocation. HSP90, EGFR, SP1, and histone H3 were used as the markers of the different cellular fractions, respectively. (B) H358/FXR1-sh3 (sh3) and H358/control shRNA (shCtrl) cells were stimulated with IFN-alpha (4.25 × 10⁴ U/ml, Millipore, Cat #IF007) for up to 24 hr. The cell lysates were subjected to protein detection in a WB assay to measure STAT phosphorylation.
Figure 5 with 6 supplements
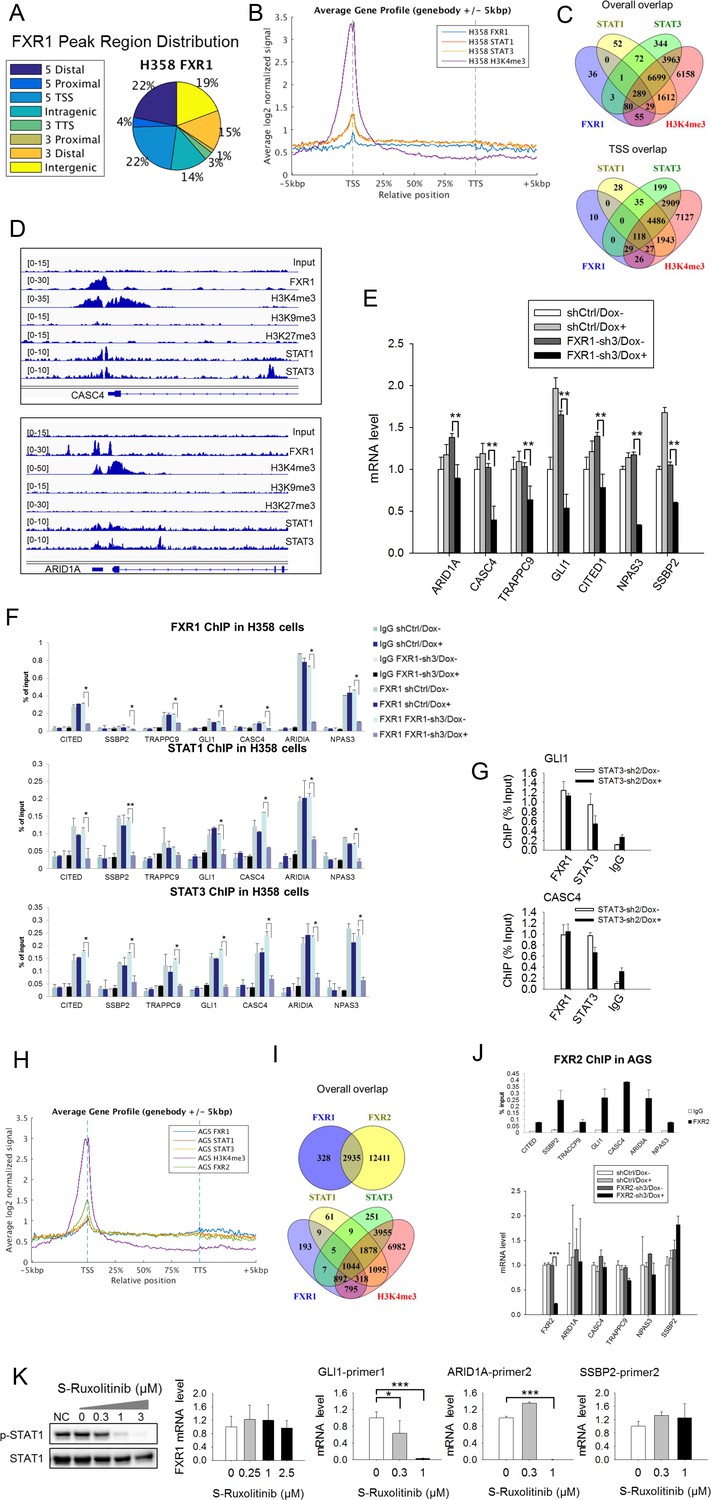
FXR1 regulates transcription by colocalizing with H3K4me3 and STAT1 and STAT3 at gene promoters.
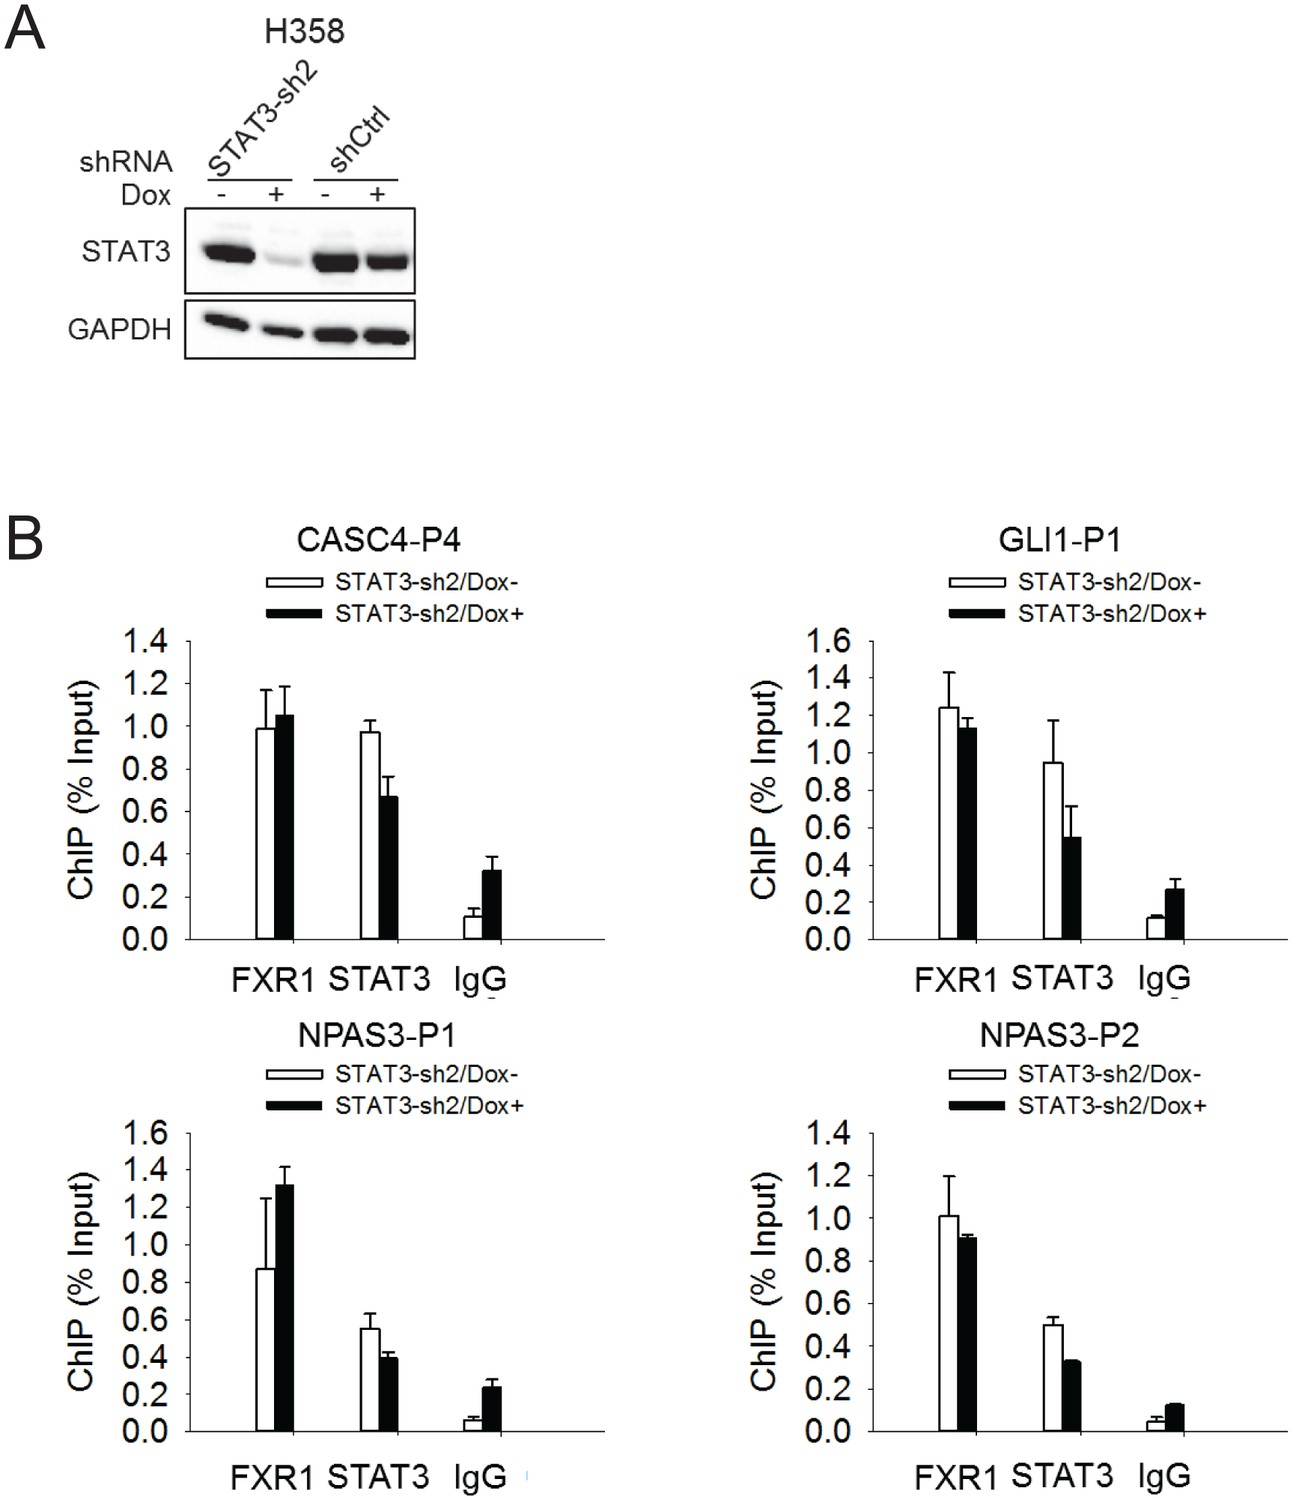
(A) Genomic distribution of FXR1 ChIP-seq peaks in H358 cells. 22% of peaks are enriched at promoter regions (defined as 5000 bp upstream and 1000 bp downstream of TSS) (p<1×e−5). (B) Average profile of FXR1, STAT1, STAT3, and H3K4me3 occupancies in gene bodies and promoters along the transcription units in H358 cells. The relative position is aligned by percentage from the transcription start site (TSS) to transcription terminal site (TTS). 5000 bp upstream of TSS and 5000 bp downstream of TTS are also included. (C) Upper: Venn diagram showing significant overlap of FXR1, STAT1, STAT3, and H3K4me3 ChIP-seq peak-associated genes in H358 cells (p<1×e-5). Lower: Venn diagram showing significant overlap of FXR1, STAT1, STAT3, and H3K4me3 ChIP-seq peak-associated genes (enriched at TSS) in H358 cells (p<1×e-5). (D) The enrichment of FXR1, H3K4me3, H3K9me3, H3K27me3, STAT1, and STAT3 ChIP-seq peaks at the gene promoter regions of CASC4 and ARID1A from IGV screenshot in H358 cells. (E) Gene expression regulation by FXR1 knockdown in H358 cells using a quantitative real-time PCR (q-RT-PCR) assay. The mRNA level is presented as fold change normalized to GAPDH. The mRNA level of the shCtrl/Dox- sample is set as 1. **p<0.01. (F) FXR1, STAT1 and STAT3 ChIP-PCR analyses at seven target genes in shCtrl and FXR1-sh3 H358 cell lines. Data are represented as mean ± s.d. of three independent experiments. IgG pull down is used as a negative control. *p<0.05,**p<0.01. (G) FXR1 and STAT3 ChIP-qPCR analyses at two selected genes in shCtrl and STAT3-sh2 H358 cell lines. Data are represented as mean ± s.d. of three independent experiments. IgG pull down is used as a negative control. ***p<0.001. (H) Average profile of FXR1, FXR2, STAT1, STAT3, and H3K4me3 occupancies at gene bodies and promoters along the transcription units in AGS cells. The relative position is aligned by percentage from the transcription start site (TSS) to transcription terminal site (TTS). 5000 bp upstream of TSS and 5000 bp downstream of TTS are also included. (I) Venn diagram showing significant overlap of FXR1 and FXR2 (upper), and FXR1, STAT1, STAT3, and H3K4me3 (lower) ChIP-seq peak-associated genes in AGS cells (p<1×e-5). (J) FXR2 regulation of FXR1 target-gene transcription. Upper, FXR2 ChIP-PCR analyses at seven selected genes in AGS cell lines. Data are represented as mean ± s.d. of three independent experiments. IgG pull down is used as a negative control. Lower, the inducible FXR2 knockdown and its effect on target-gene expression. The mRNA level is presented as fold change normalized to GAPDH. ***p<0.001. (K) JAK inhibitor effect on the expression of FXR1 target-gene expression in AGS cells. The JAK inhibitor (JAKi) S-Ruxolitinib inhibits STAT1 phosphorylation in a dose-dependent manner in H358 cells as measured by WB. The expression of both the target gene and FXR1 are determined by q-RT-PCR using their specific primers in S-Ruxolitinib-treated H358 cells. The mRNA level is fold-change normalized to GAPDH mRNA level. The mRNA level of 0 μM S-Ruxolitinib treatment sample is set as 1. *p<0.05, ***p<0.001. Also see Figure 5—figure supplements 1–6, and Supplementary files 3 and 4.
-
Figure 5—source data 1
Source data for Figure 5.
- https://doi.org/10.7554/eLife.26129.035
Figure 5—figure supplement 1
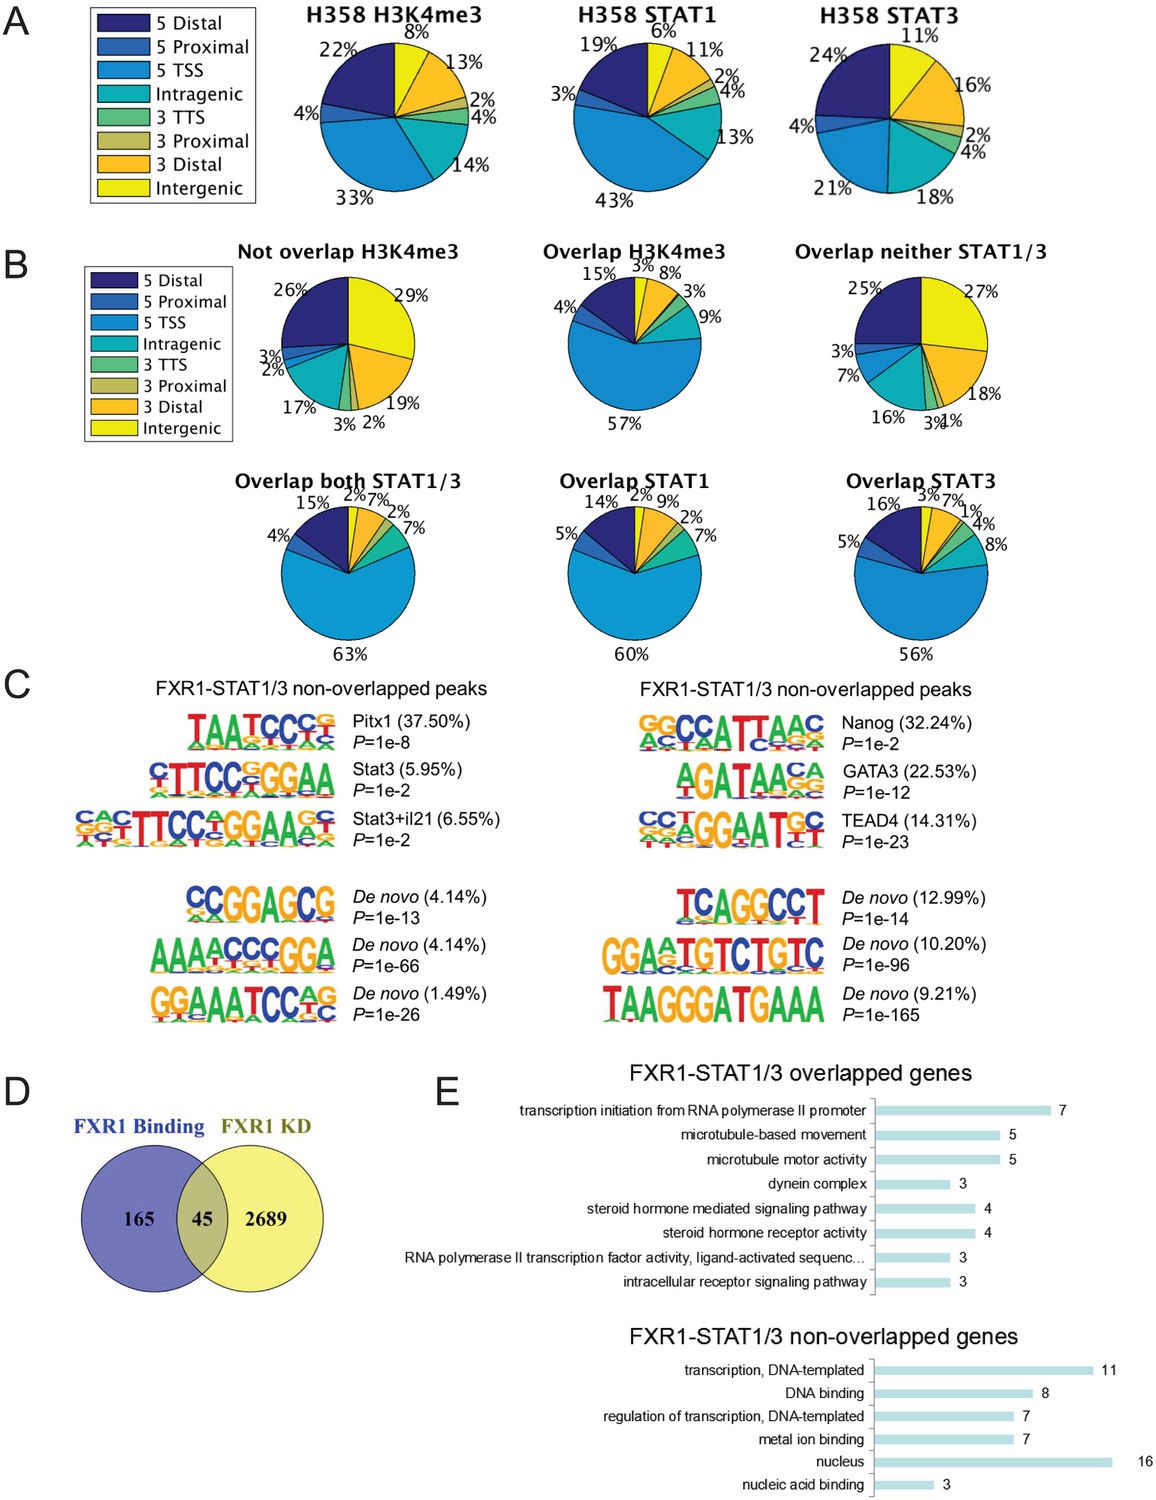
FXR1 colocalizes with H3K4me3 and STAT1/3 at gene promoters.
(A) Genomic distribution of H3K4me3, STAT1 and STAT3 ChIP-seq peaks in H358 cells. (B) Genomic distribution of FXR1-H3K4me3 or FXR1-STAT1/3 overlapped or non-overlapped ChIP-seq peaks in H358 cells. (C) Representative binding motifs of FXR1 from motif analysis of FXR1 and STAT1/3 overlapped regions (left) or non-overlapped regions (right) using MEME. (D) Venn diagram showing significant overlap between FXR1 regulated genes from RNA-seq results (FXR1 KD) and genes with FXR1 occupancy at promoters from ChIP-seq results (FXR1 Binding) in H358 cells (p<1 × e-5). KD, knockdown. (E) GO analysis of FXR1 with STAT1/3 overlapped or non-overlapped genes. TSS, transcription start site; TTS, transcription termination site. Also see Supplementary files 6 and 7.
Figure 5—figure supplement 2

ChIP-seq peaks of FXR1, STAT1, STAT3 and histone marks (H3K4me3, H3K9me3, and H3K27me3) at validated target genes GLI1, TRAPPC9, CITED1, NPAS3, and SSBP2.
(A) The enrichment of FXR1, H3K4me3, H3K9me3, H3K27me3, STAT1, and STAT3 ChIP-seq peaks at the gene promoter regions of target genes from IGV screenshot in H358 cells. (B) Upper, illustration of the targeting region of FXR1 ChIP-PCR primers according to FXR1 genomic peak localization at the target genes. TSS: transcription start site. Lower, evaluation of primers in FXR1 ChIP-PCR assay. IgG serves as the control of FXR1 antibody pull down. Primer design and selection for other target genes follows the same approach.
Figure 5—figure supplement 3
FXR1 localization at gene promoters is not affected by STAT3.
(A) siRNA-mediated silencing of STAT3 expression in H358 cells. (B) The FXR1 or STAT3 ChIP complexes from STAT3 siRNA-treated H358 cells were subjected to PCR using promoter-specific primers to detect FXR1 or STAT3 enrichment at the promoters of the target genes. IgG pull down was used as a negative control. Data represent mean ± s.d. from three independent experiments.
-
Figure 5—figure Supplement 3—source data 1
Source data for Figure 5-Figure Supplement 3.
- https://doi.org/10.7554/eLife.26129.036
Figure 5—figure supplement 4
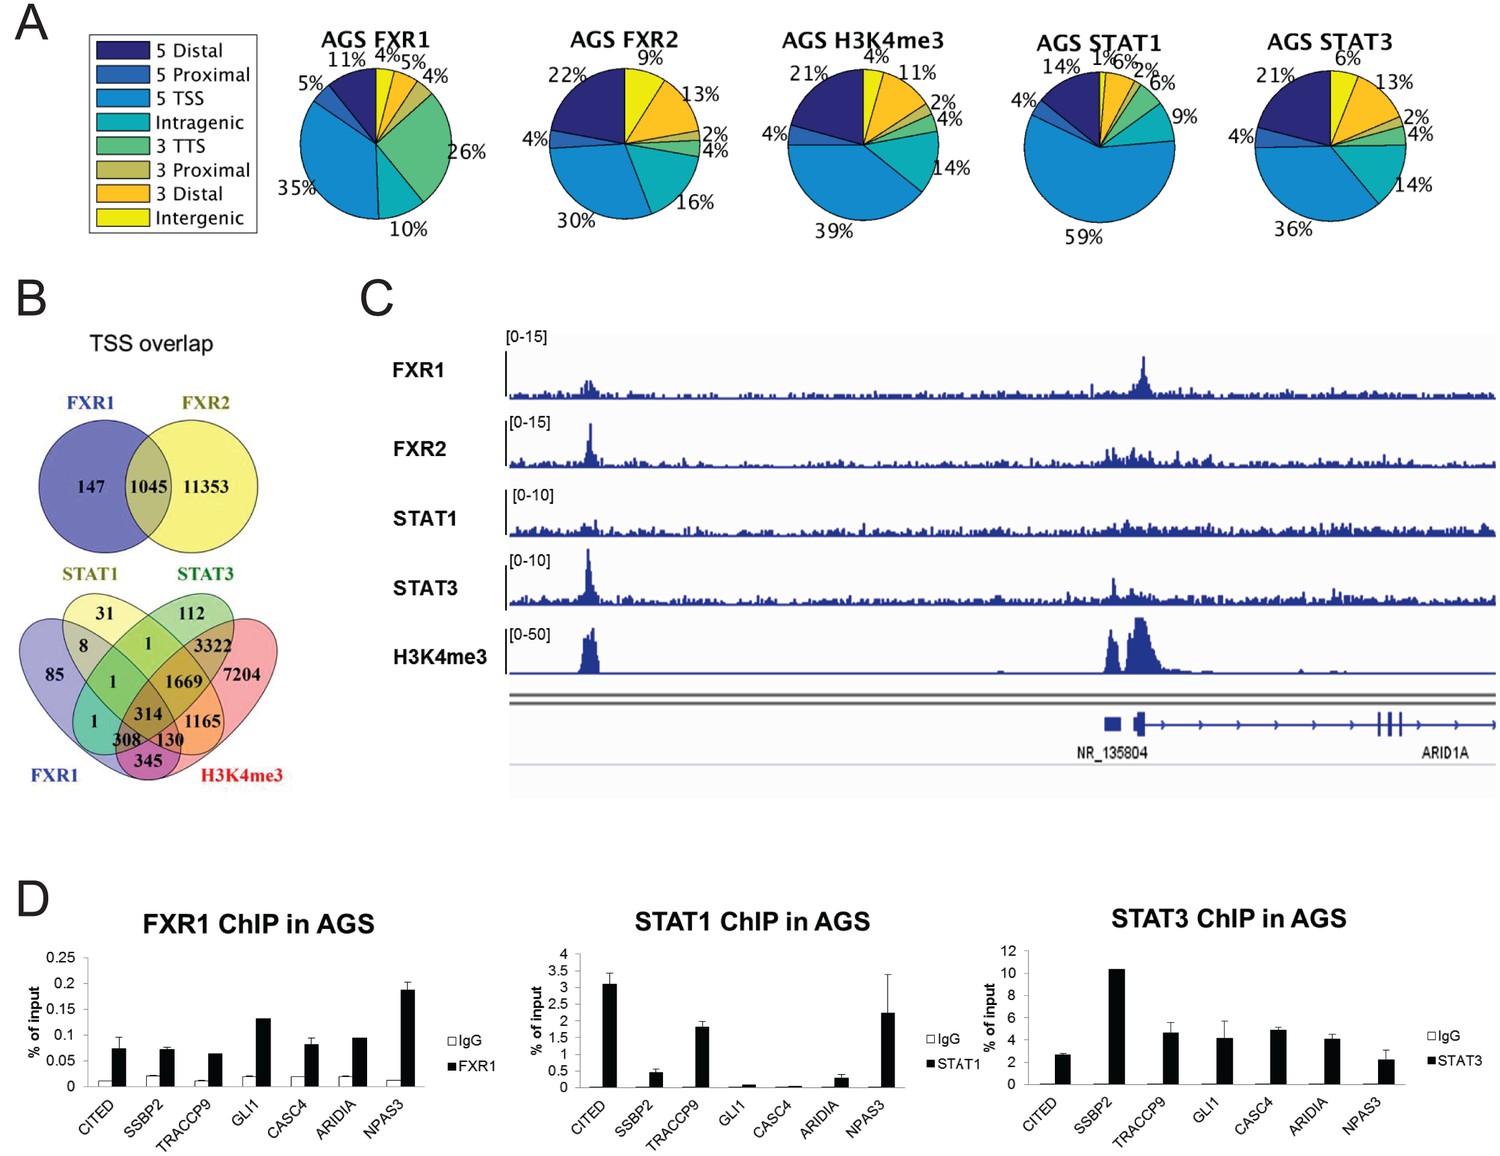
FXR1 colocalizes with FXR2, STAT1/3 and H3K4me3 at gene promoters in AGS cells.
(A) Genomic distribution of FXR1, FXR2, H3K4me3, STAT1 and STAT3 ChIP-seq peaks in AGS cells. (B) Venn diagram showing significant overlap of FXR1 and FXR2 (upper), FXR1, STAT1, STAT3, and H3K4me3 (lower) ChIP-seq peak(enriched at TSS)-associated genes in AGS cells (p<1 × e-5). (C) The enrichment of FXR1, FXR2, H3K4me3, H3K9me3, H3K27me3, STAT1, and STAT3 ChIP-seq peaks at gene promoter regions of ARID1A from IGV screenshot in AGS cells. (D) FXR1, STAT1 and STAT3 ChIP-qPCR analyses for seven target genes in AGS cell lines. Data are represented as mean ± s.d. (n = 3). IgG pull down is used as a negative control. TSS, transcription start site; TTS, transcription termination site.
-
Figure 5—figure supplement 4—source data 1
Source data for Figure 5-Figure Supplement 4.
- https://doi.org/10.7554/eLife.26129.037
Figure 5—figure supplement 5

Regulation of target gene expression by JAK inhibitor.
The TP53/FXR2 co-deletion cancer cell line H358 was treated with JAK inhibitor (JAKi) S-Ruxolitinib at a dose of 0, 0.3, or 1 µM for 4 days. The total mRNA was extracted and subjected to q-RT-PCR assay to determine the expression of FXR1 target genes. Data represent mean ± s.d. from three independent experiments. The mRNA level shown for q-RT-PCR is fold-change normalized to GAPDH mRNA level. The mRNA level at 0 μM S-Ruxolitinib treatment is set as 1. *p<0.05, ***p<0.001 (comparing to the 0 µM S-Ruxolitinib treatment sample).
-
Figure 5—figure supplement 5—source data 1
Source data for Figure 5-Figure Supplement 5.
- https://doi.org/10.7554/eLife.26129.038
Figure 5—figure supplement 6
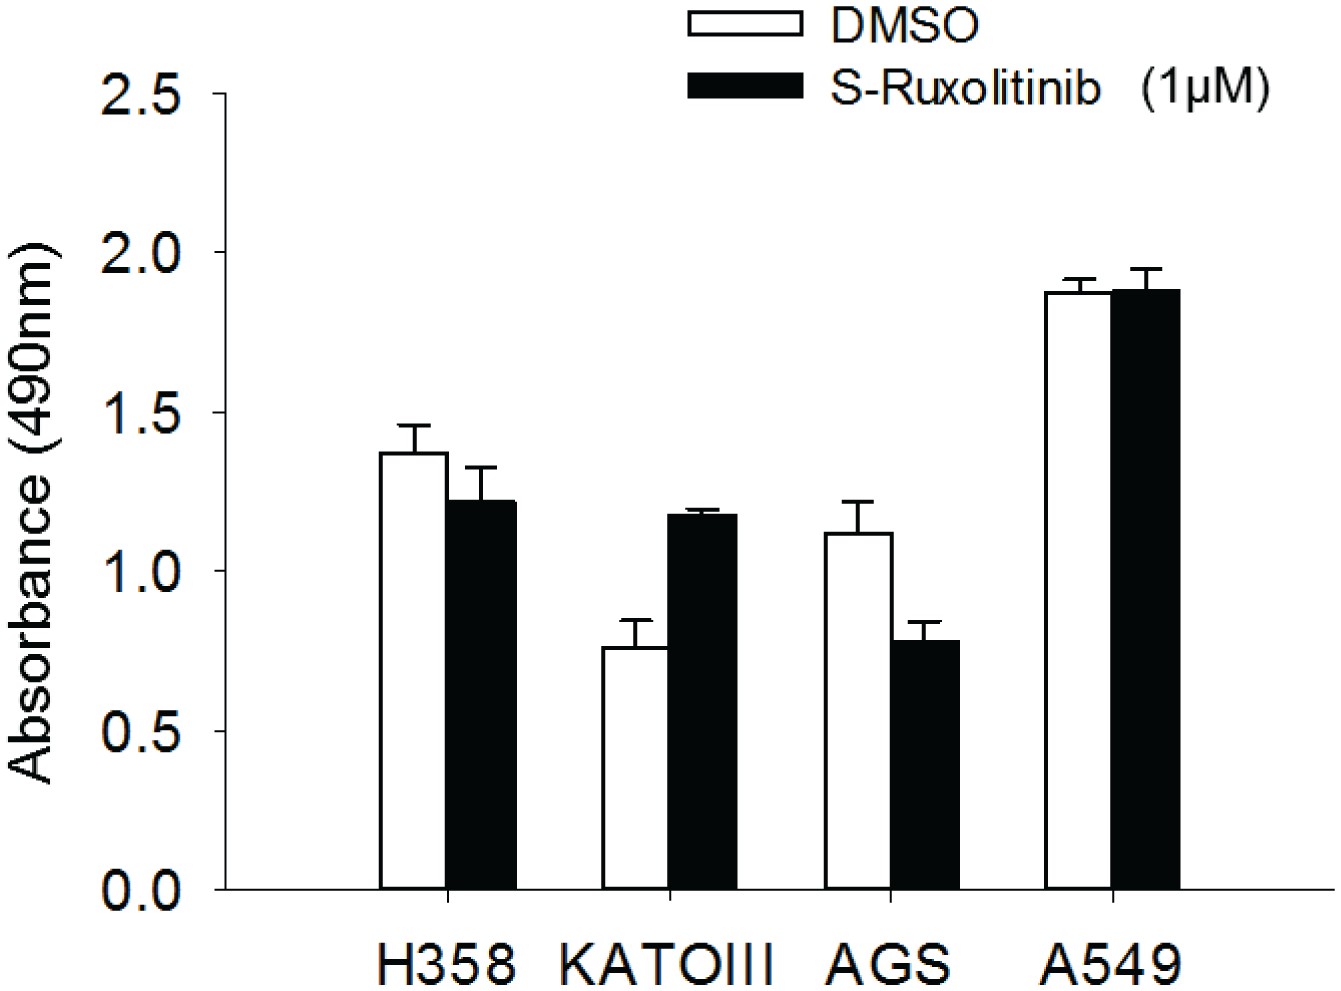
Cell proliferation regulation by JAK inhibitor.
The TP53/FXR2 co-deletion cancer cell lines (H358, KATOIII) and wild-type cancer lines (AGS, A549) were treated with JAKi S-Ruxolitinib at 1 µM for 5 days. Cell proliferation rate is determined by MTS assay. The cell proliferation rate in MTS was determined by measuring absorbance at 490 nm (Y axis). Data represent mean ± s.d. from three independent experiments.
-
Figure 5—figure supplement 6—source data 1
Source data for Figure 5-Figure Supplement 6.
- https://doi.org/10.7554/eLife.26129.039
Figure 6 with 3 supplements
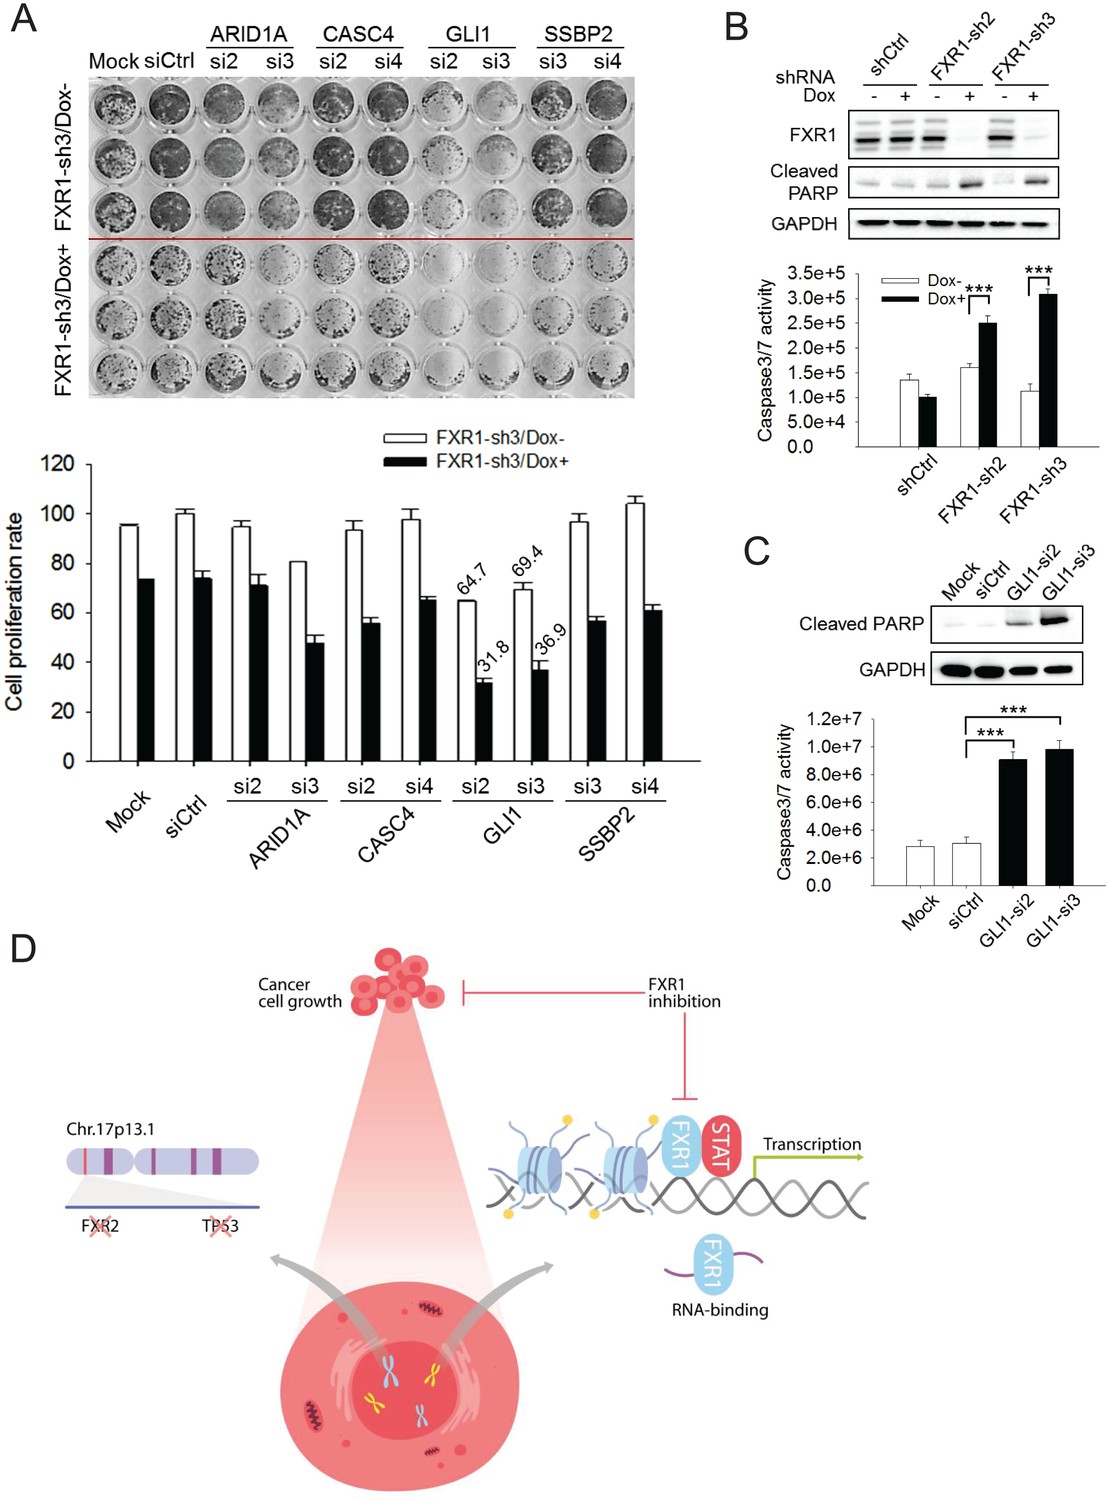
FXR1 target genes mediate its function in cell proliferation.
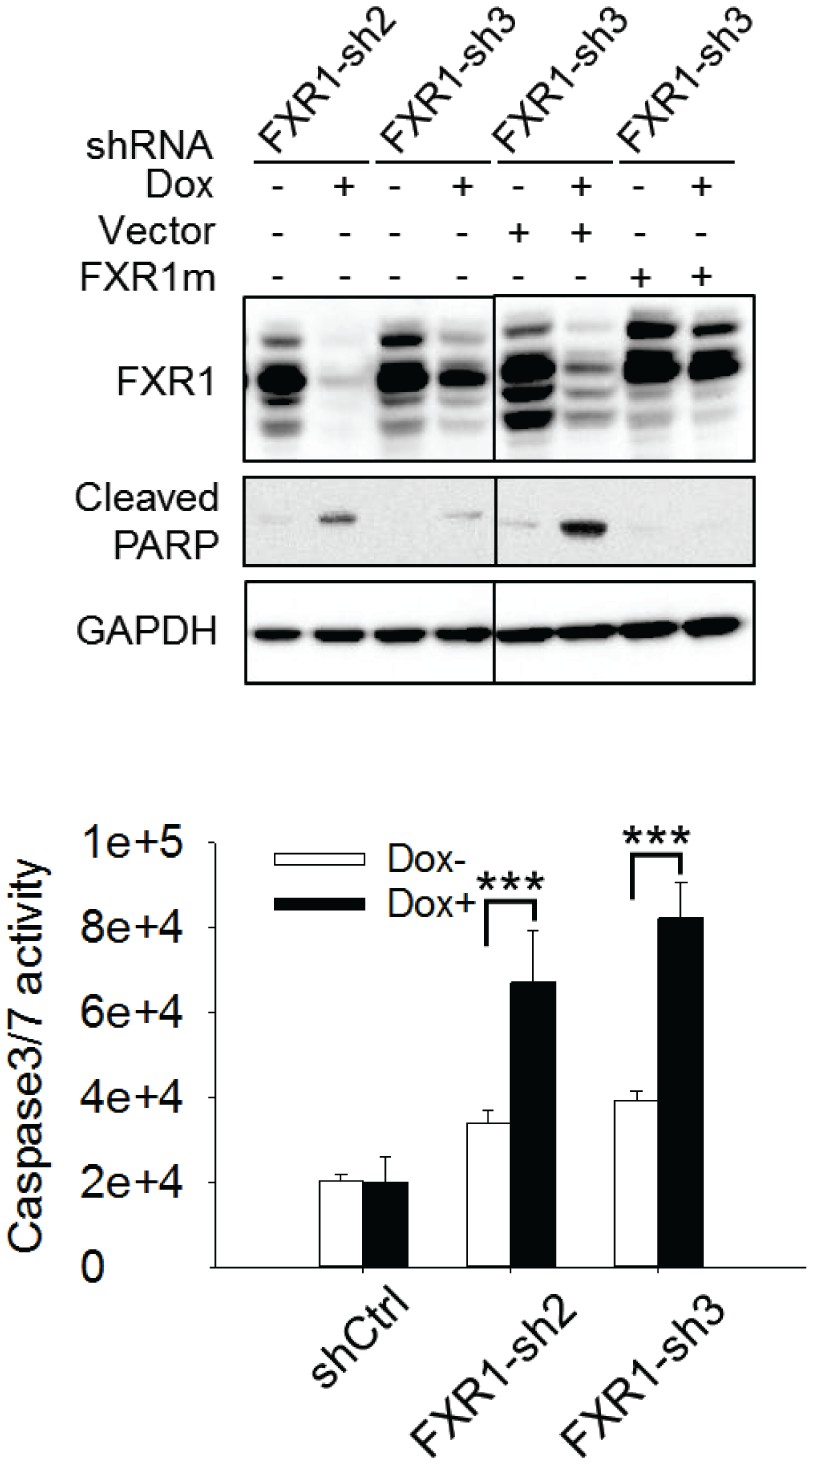
(A) Dual knockdown of FXR1 and its target gene enhances cell growth inhibition. The H358/FXR1-sh3 stable cell line was transfected with target gene-specific siRNA (5 nM), and treated with Dox for induction of FXR1 knockdown one day post-transfection, and then subjected to cell imaging (upper) or MTS (lower) assay to monitor cell growth after four further days, after a total of 5 days of Dox treatment. Percentage of cell growth rate (absorbance at 490 nm) comparing to control siRNA (siCtrl) without Dox treatment group (rate set as 100) is labeled. Data represent mean ± s.d. of three independent experiments. (B) Cell apoptosis induced by FXR1 knockdown. Upper, cleaved PARP is measured by WB in H358/FXR1-sh2 and H358/FXR1-sh3 cells upon Dox-induced FXR1 knockdown for 5 days. Data represent one time study out of three independent experiments. Lower, caspase-3/7 activity is measured by Caspase-Glo3/7 assay in H358/FXR1-sh2 and H358/FXR1-sh3 cells. Data represent mean ± s.d. of three independent experiments. ***p<0.001 (FXR1-shRNA/Dox + sample comparing to FXR1-shRNA/Dox- sample). (C) Cell apoptosis induced by GLI1 knockdown in H358 cells. Upper panel, cleaved PARP level detection. Data represent one time study out of three independent experiments. Lower panel, caspase-3/7 activity measurement. Data represent the mean ± s.d. of three independent experiments. ***p<0.001 (GLI1-shRNA/Dox + sample comparing to GLI1-shRNA/Dox- sample). (D) Schematic diagram demonstrating the cellular function and disease linkage of FXR1. In brief, FXR1 recognizes histone marks through its tandem Tudor domain, and recruits or stabilizes transcription factor STATs at target gene promoters for transcription regulation. Further, as an RNA-binding protein, FXR1 also functions in mRNA transport and the regulation of mRNA translation and stability. TP53 homozygous deletion cancers usually have passenger deletion of the neighboring gene FXR2 at chromosome 17p13.1, which causes cancer-specific cell dependency on the other FXR1 family member. Inhibition of FXR1 could serve as a novel therapeutic approach to targeting TP53 homozygous deletion cancers that involve co-deletion of FXR2 in a collateral lethality manner. Also see Figure 6—figure supplements 1, 2 and 3.
-
Figure 6—source data 1
Source data for Figure 6.
- https://doi.org/10.7554/eLife.26129.044
Figure 6—figure supplement 1
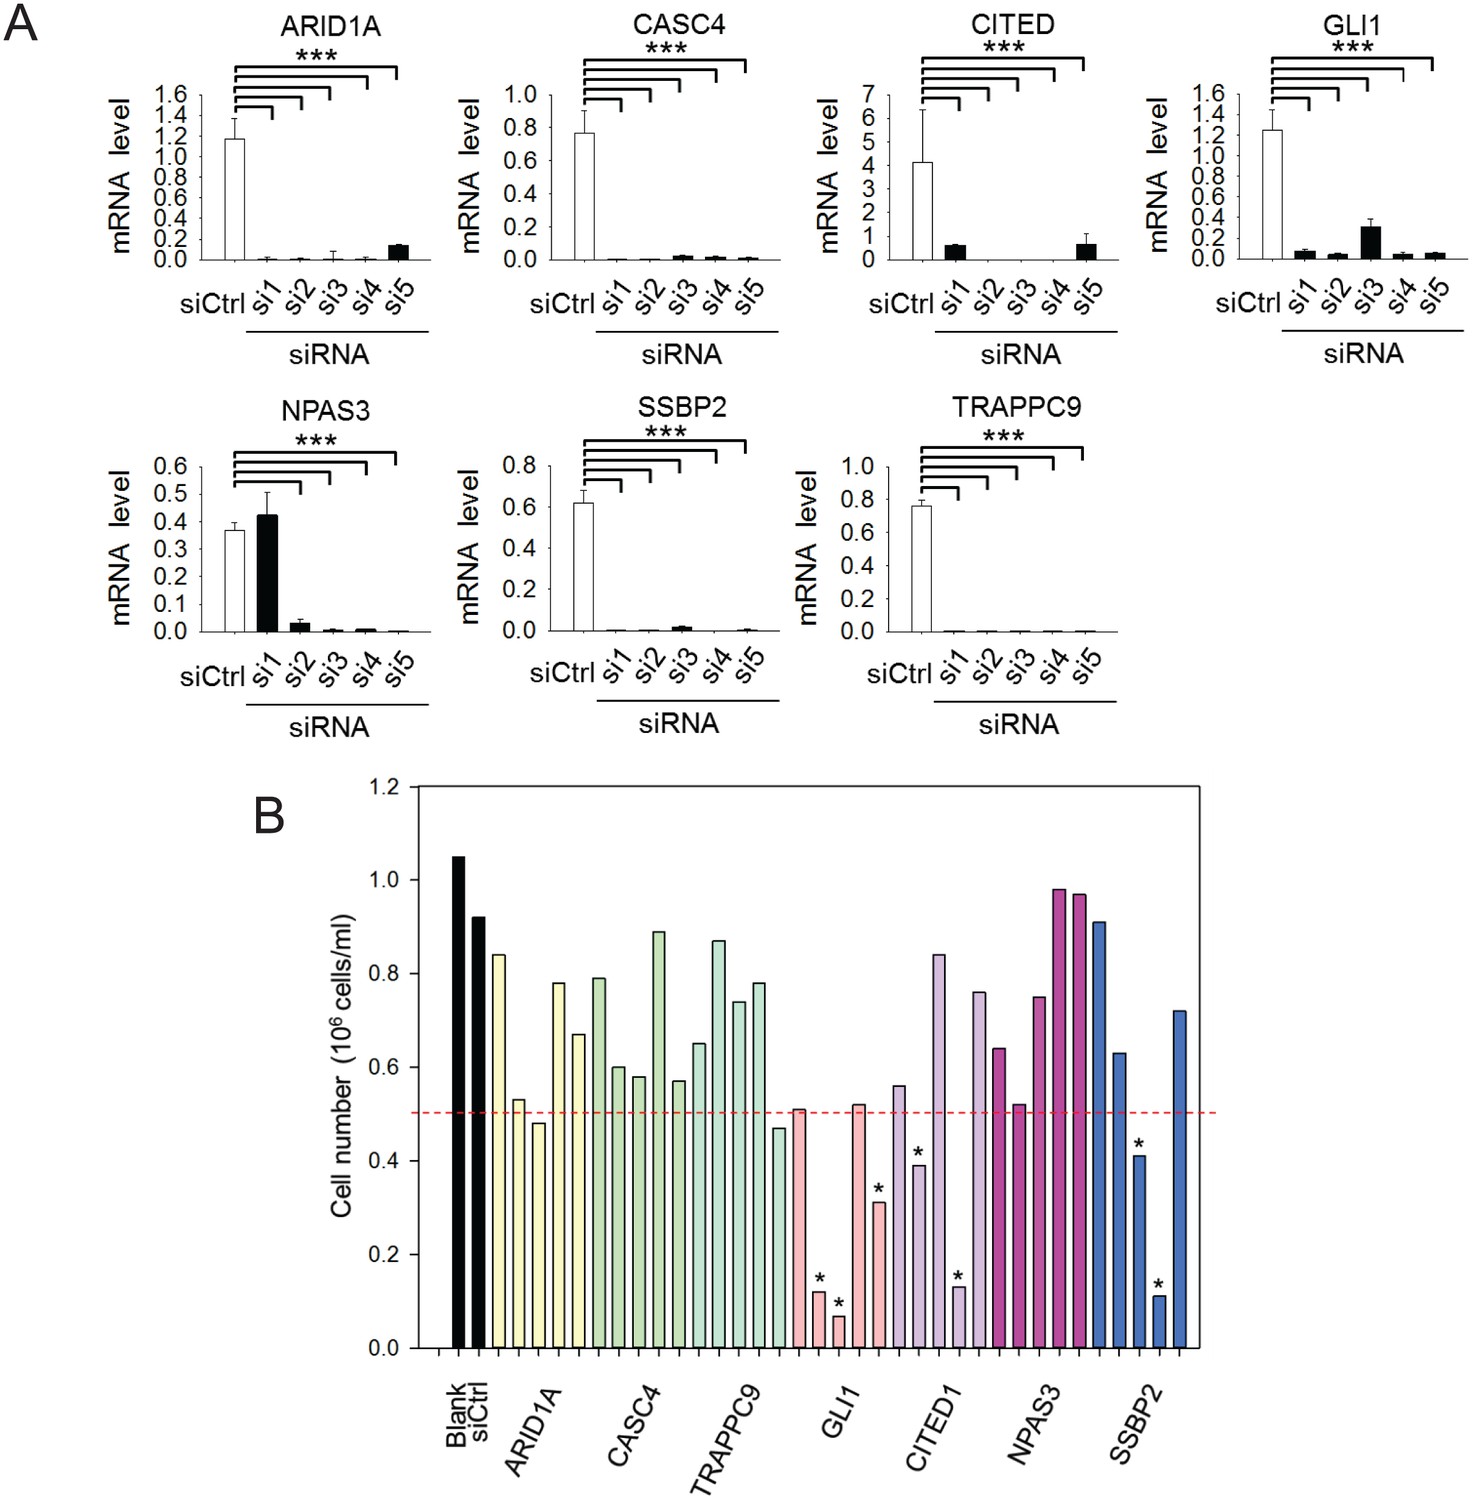
siRNA knockdown of FXR1 target genes.
(A) siRNA-mediated downregulation of the target genes in H358 cells detected by q-RT-PCR. Five siRNAs for each gene (si1–5) were tested for knockdown efficiency at concentration 20 nM. The mRNA level shown in q-RT-PCR is fold-change normalized to GAPDH. Data represent mean ± s.d. of three independent experiments. ***p<0.001 (comparing to the control siRNA treatment sample). (B) Effect of siRNA-mediated downregulation of the FXR1 target genes on H358 cell proliferation by counting the cell number. Five siRNAs for each gene (si1–5) were tested at concentration 20 nM. * indicates the siRNAs that caused significant cell proliferation change.
-
Figure 6—figure Supplement 1—source data 1
Source data for Figure 6-Figure Supplement 1.
- https://doi.org/10.7554/eLife.26129.045
Figure 6—figure supplement 2
Cell apoptosis induced by FXR1 knockdown in HL-60 cells.
Upper, cleaved PARP is measured by WB in HL-60/FXR1-sh2 and HL-60/FXR1-sh3 cells upon Dox-induced FXR1 knockdown. Data represent one time study out of three independent experiments. Lower, caspase-3/7 activity is measured by Caspase-Glo3/7 assay in HL-60/FXR1-sh2 and HL-60/FXR1-sh3 cells. Data represent mean ± s.d. of three independent experiments. ***p<0.001 (FXR1-shRNA/Dox + sample comparing to FXR1-shRNA/Dox- sample).
-
Figure 6—figure supplement 2—source data 1
Source data for Figure 6-Figure Supplement 2.
- https://doi.org/10.7554/eLife.26129.046
Figure 6—figure supplement 3

FXR1 binding to the target genes' mRNA.
Immunoprecipitation (IP) complexes produced by FXR1 antibody or IgG pull down from H358 cells are subjected to RT-PCR using target-gene-specific primers (listed in Supplementary information) to detect the precipitated mRNAs. The PCR products are detected by electrophoresis in agarose gels and stained with ethidium bromide, visualized by ChemiDoc. The non-target genes GAPDH, Actin, and SPATA6 serve as negative controls.
Tables
Table 1
Summary of FXR1-knockdown-induced anti-proliferation in cancer cell lines and CRISPR-Cas9-engineered cell clones.
The cell line or CRISPR clone name, cancer type, TP53 and FXR2 copy number alteration (based on the CCLE database or knockout confirmation), FXR1-sh3 knockdown (KD) efficiency (determined by q-RT-PCR and WB), and FXR1 KD-induced anti-proliferation efficiency are listed. Dark green, anti-proliferation efficiency >60%. Yellow green, anti-proliferation 30–60%. Yellow, anti-proliferation <30%. Data of KD efficiency and anti-proliferation efficiency represent means of at least three independent experiments. Del, deletion; WT, copy number normal; KO, knockout.
| Cell | Cancer | TP53 | FXR2 | FXR1 KD efficiency (%) | FXR1 KD induced anti-proliferation (%) | |
|---|---|---|---|---|---|---|
| Cancer cell line | HL-60 | Acute myeloid leukemia | Del | Del | 77.6 | 73.4 |
| KATOIII | Gastric | Del | Del | 83.5 | 76.4 | |
| KMS-11 | Multiple myeloma | Del | Del | 95.7 | 88.3 | |
| H358 | Lung | Del | Del | 79.9 | 95.3 | |
| H1299 | Lung | Del | WT | 96.4 | −1.1 | |
| L540 | Hodgkin lymphoma | Del | WT | 94.9 | −5.8 | |
| MG-63 | Osteosarcoma | Del | WT | 96.8 | −4.5 | |
| SKOV3 | Ovarian | Del | WT | 89.0 | −7.3 | |
| Hep3B | Liver | WT | Del | 94.0 | −0.8 | |
| A549 | Lung | WT | WT | 72.7 | 15.5 | |
| AGS | Gastric | WT | WT | 73.6 | 12.8 | |
| HepG2 | Liver | WT | WT | 92.0 | 2.8 | |
| MKN45 | Gastric | WT | WT | 71.5 | 3.4 | |
| CRISPR-Cas9 KO clone | DKO1 | Gastric | WT | WT | 88.8 | 1.9 |
| DKO5 | Gastric | WT | WT | 86.0 | 2.7 | |
| DKO11 | Gastric | KO | KO | 79.0 | 49.8 | |
| DKOL7-1 | Gastric | KO | KO | 92.0 | 68.5 | |
| DKOL7-3 | Gastric | KO | KO | 87.5 | 45.3 | |
| FXR2 KO10 | Gastric | WT | WT | 80.6 | 34.1 | |
| FXR2 KO11 | Gastric | WT | WT | 75.8 | 19.0 | |
| FXR2 KO17 | Gastric | WT | WT | 77.2 | 6.8 | |
| FXR2 KO5 | Gastric | WT | KO | 81.3 | 16.2 | |
| FXR2 KO16 | Gastric | WT | KO | 72.9 | 15.6 | |
| TP53 KO3-3 | Gastric | WT | WT | 51.1 | −5.3 | |
| TP53 KO3-10 | Gastric | WT | WT | 92.9 | −5.8 | |
| TP53 KO3-6-1 | Gastric | KO | WT | 85.3 | 34.0 | |
| TP53 KO3-6-2 | Gastric | KO | WT | 81.4 | −5.3 | |
| TP53 KO3-14-6 | Gastric | KO | WT | 86.2 | 12.5 |
-
Table 1—source data 1
Source data for Table 1.
- https://doi.org/10.7554/eLife.26129.016
Additional files
-
Supplementary file 1
FXR1 potential interacting proteins predicted by ChIP-MS in KATOIII and H358 cell lines.
- https://doi.org/10.7554/eLife.26129.047
-
Supplementary file 2
Function clustering of the FXR1 potential interacting proteins using the GO and DAVID analysis.
- https://doi.org/10.7554/eLife.26129.048
-
Supplementary file 3
FXR1, FXR2, histone marks and STATs ChIP-seq peaks, distribution, and overlap analysis.
- https://doi.org/10.7554/eLife.26129.049
-
Supplementary file 4
Table S4-GO pathway analysis of FXR1-H3K4me3 or FXR1-STATs overlapped or non-overlapped ChIP-seq target genes in H358 cells.
- https://doi.org/10.7554/eLife.26129.050
-
Supplementary file 5
Target gene validation-RT-PCR-primers.
- https://doi.org/10.7554/eLife.26129.051
-
Supplementary file 6
FXR1 target gene analysis using RNA-seq in H358 cells.
- https://doi.org/10.7554/eLife.26129.052
-
Supplementary file 7
Gene expression profile of genes with FXR1 occupancy at promoter.
- https://doi.org/10.7554/eLife.26129.053
-
Supplementary file 8
Reagent information.
- https://doi.org/10.7554/eLife.26129.054
Download links
A two-part list of links to download the article, or parts of the article, in various formats.
Downloads (link to download the article as PDF)
Open citations (links to open the citations from this article in various online reference manager services)
Cite this article (links to download the citations from this article in formats compatible with various reference manager tools)
FXR1 regulates transcription and is required for growth of human cancer cells with TP53/FXR2 homozygous deletion
eLife 6:e26129.
https://doi.org/10.7554/eLife.26129


