Laminin signals initiate the reciprocal loop that informs breast-specific gene expression and homeostasis by activating NO, p53 and microRNAs
- Lawrence Berkeley National Laboratory, United States
- University of Toledo Health Science Campus, United States
Figures
Figure 1 with 1 supplement
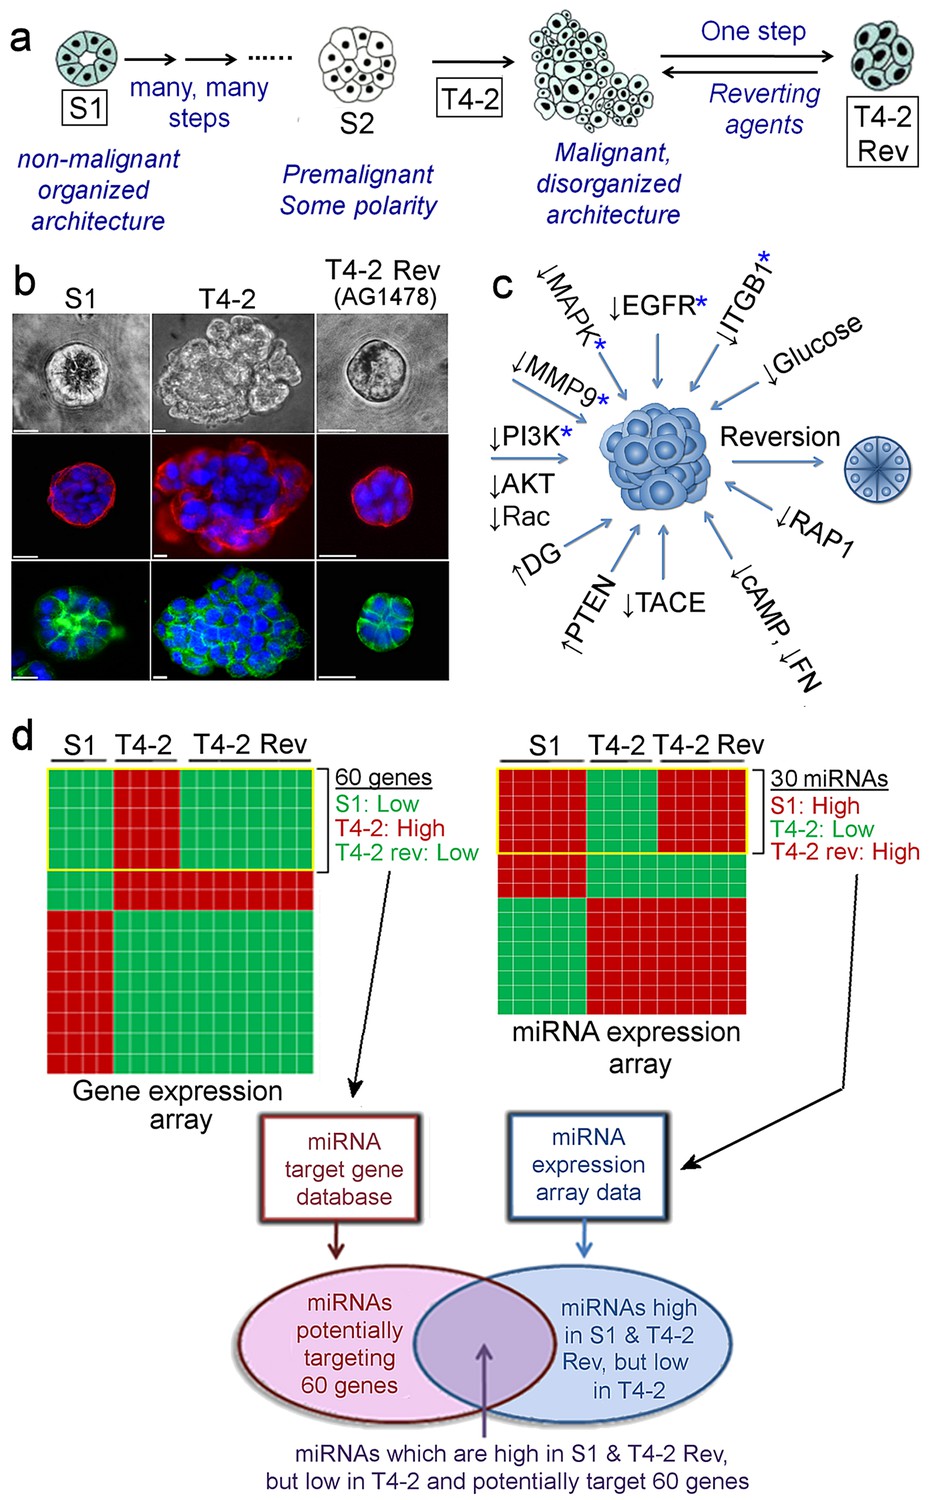
Identification of miRNAs linked to phenotypic reversion of human breast-cancer cells.
(a) Scheme of progression of non-malignant HMT3522-S1 cells to malignant T4-2 cells and of reversion of T4-2 cells to an S1-like phenotype in the presence of a reverting agent. (b) S1, T4-2 and T4-2 Rev cells with AG1478 in lrECM. Cells are stained for integrin α6 (red), β-catenin (green) and nuclei (blue). Scale bars: 20 μm. Replicate experiments (n = 3) were performed, and representative data are shown. (c) A scheme of modulation of a single oncogenic pathway for phenotypic reversion of tumor cells. Five pathways chosen for gene and miRNA arrays are indicated with blue asterisks (*). (d) Screening miRNAs linked to phenotypic reversion. (Top left) Gene arrays (n = 5, GSE50444 [Becker-Weimann et al., 2013]) clustered 60 genes that are downmodulated in S1 and T4-2 Rev cells compared to T4-2 cells. (Top right) miRNA arrays (n = 4) clustered 30 miRNAs the expression of which was anti-correlated to that of these 60 genes. (Bottom left) A miRNA target database (microRNA.org) predicted miRNAs that could target the 60 genes. Combination of the two lists identified miRNAs that are linked to phenotypic reversion.
Figure 1—figure supplement 1
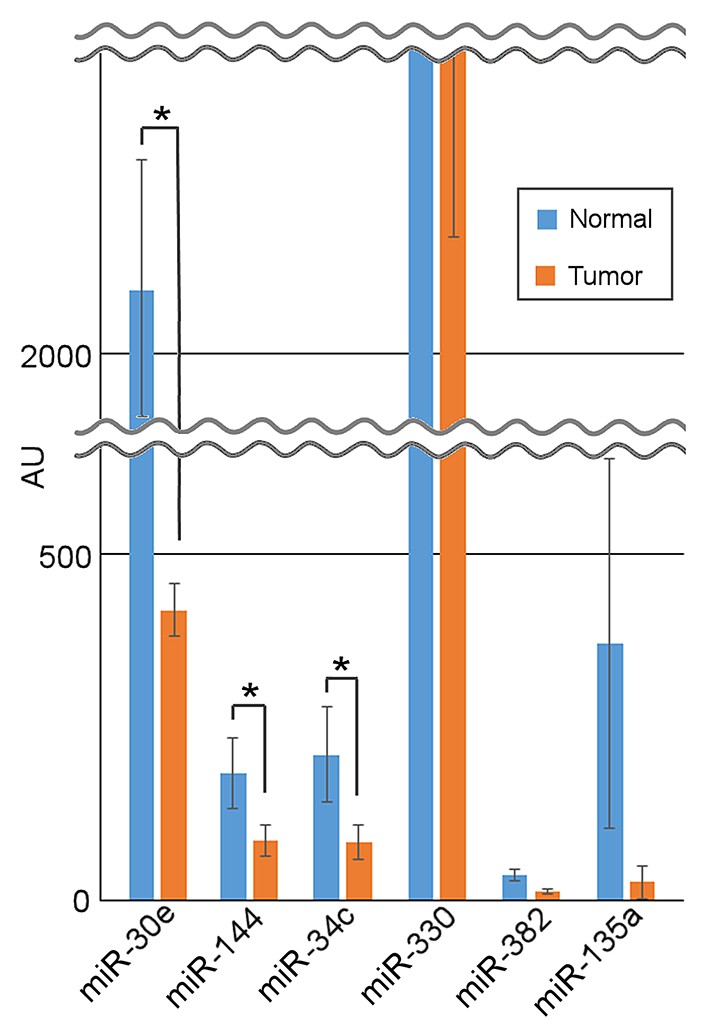
miR-34c, miR-30e and miR-144 are downregulated in breast cancer.
Expression of six identified miRNAs in normal vs. tumorigenic breast tissues based on published microarray data (GSE2564) (Lu et al., 2005).
Figure 2 with 1 supplement
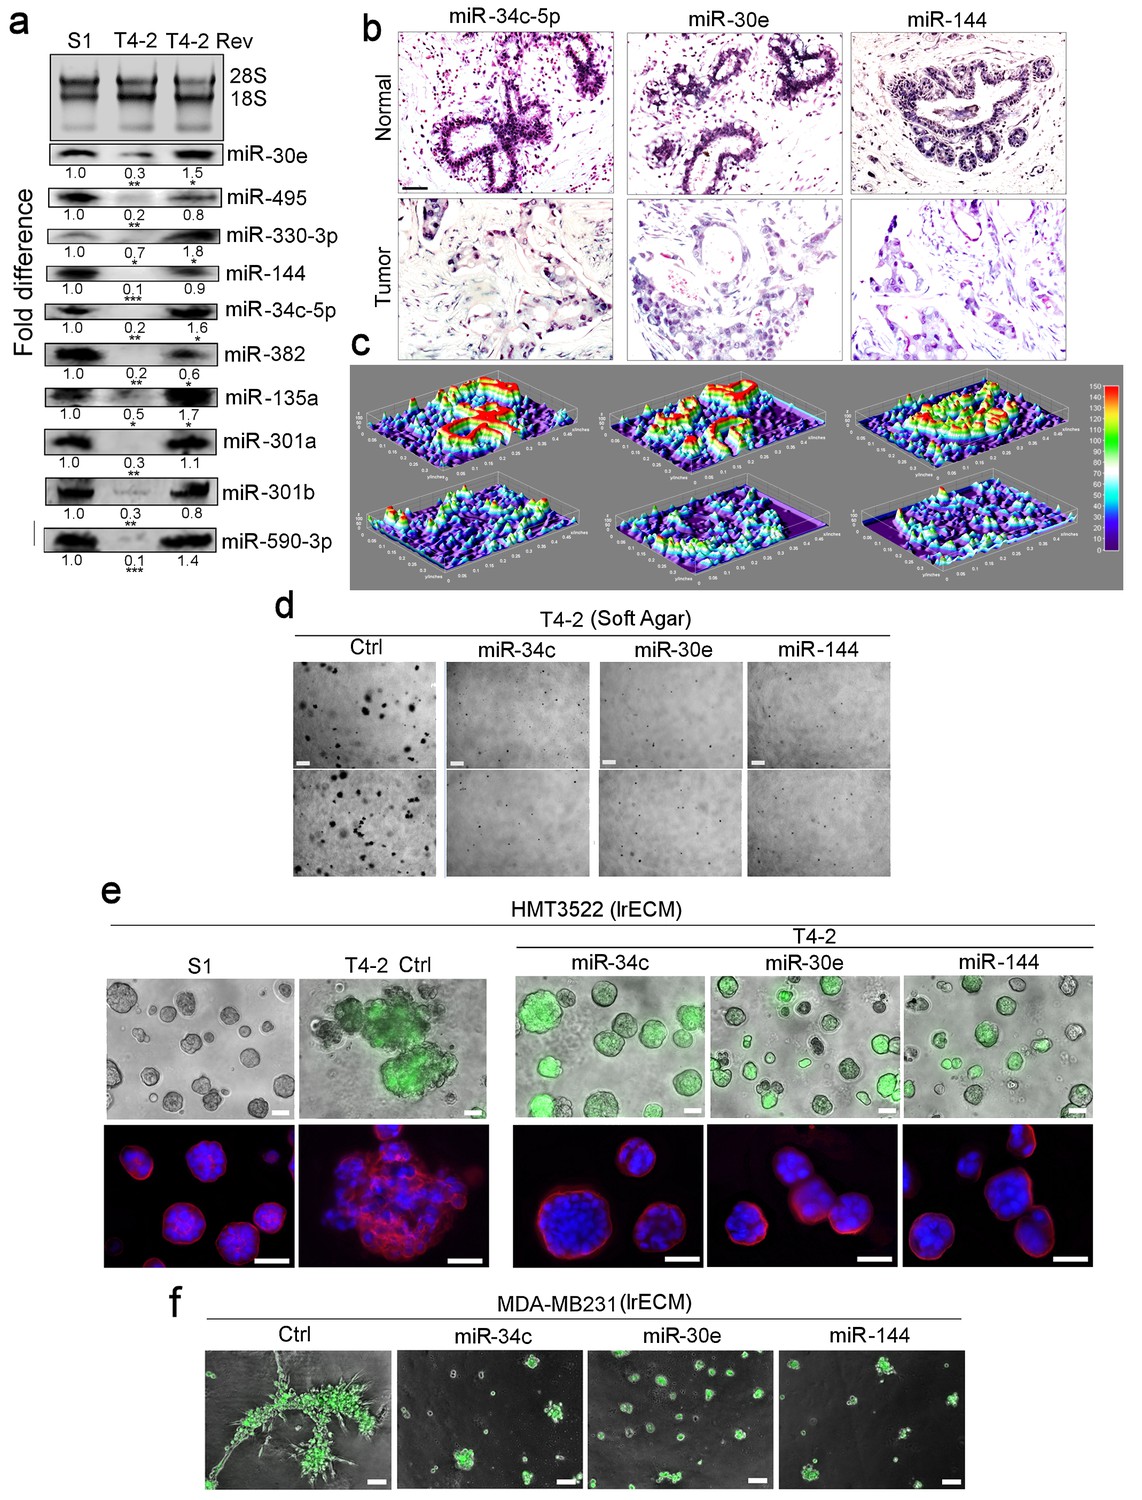
Restoring the expression of miR-34c-5p, −30e or −144 in breast cancer cells induces phenotypic reversion.
(a) Actual expression pattern of the ten identified miRNAs (Figure 1): the levels are at least two-fold higher in S1 and T4-2 Rev cells than in T4-2 cells, as measured by northern analysis. 28S and 18S RNAs were used as internal controls. Fold difference was determined with respect to S1 cells. *p<0.05; **p<0.01; and ***p<0.001. (b) In situ hybridization of primary human breast tissues showed the abundance of miR-34c-5p, −30e and −144 in normal (top row) compared to tumor tissues (second row) (n = 3). Nuclei were counterstained with nuclear fast red. (c) Heat maps of (b) generated by ImageJ. (d) T4-2 cells expressing the 3 miRNAs grown in soft agar. See quantification in Figure 2—figure supplement 1b. Two representative images are shown out of 9 samples (e) T4-2 cells expressing thethree miRNAs grown in lrECM. (Top) Phase images overlaid with FITI to indicate transduced cells. (Bottom) Red: α6 integrin; blue: DAPI. See quantification in Figure 2—figure supplement 1c. (f) MDA-MB231 cells expressing the three miRNAs grown in lrECM. Phase images overlaid with FITI to indicate transduced cells. Scale bars: 20 μm. See quantification of colony sizes in Figure 2—figure supplement 1d. For each analysis, replicate experiments (n = 3) were performed, and representative data are shown.
Figure 2—figure supplement 1
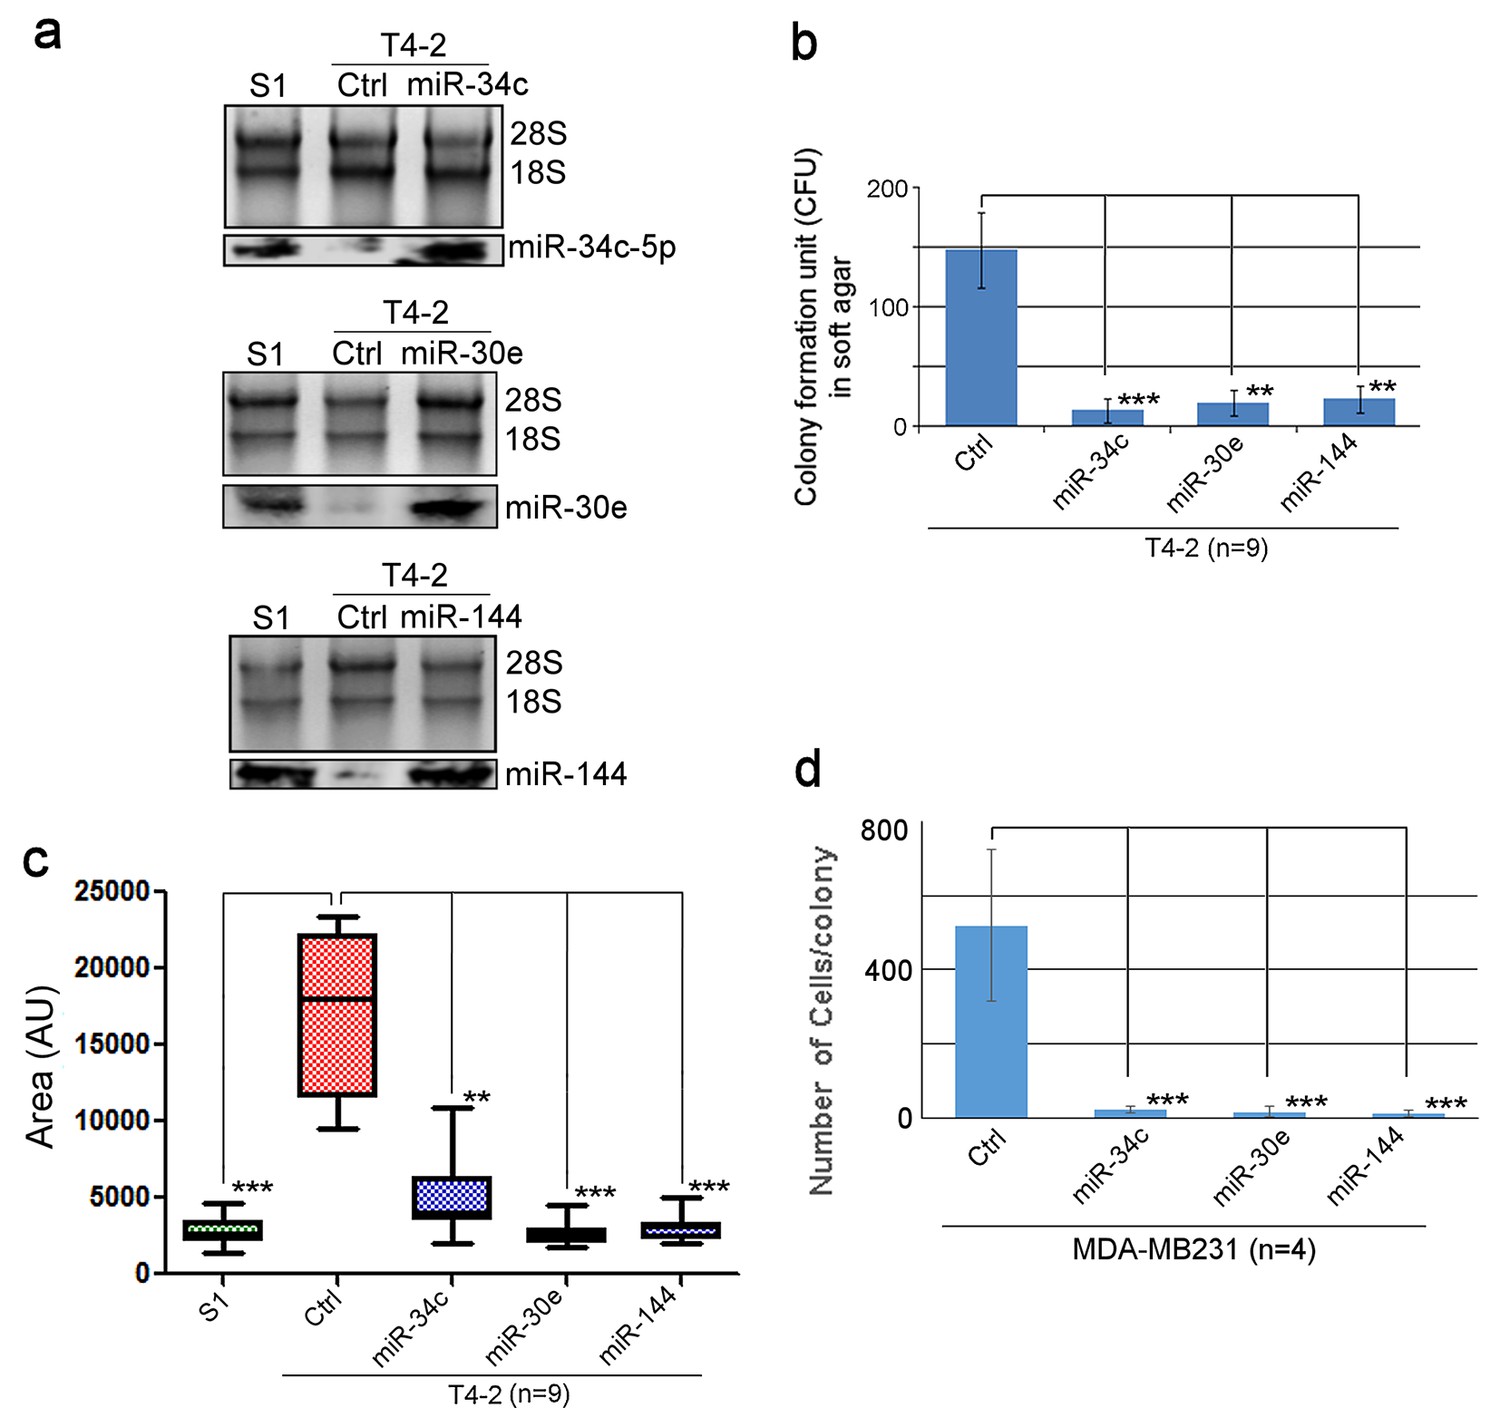
miR-34c, miR-30e and miR-144 are critically involved in tumor-cell reversion.
(a) Representative result of northern analysis (n = 3 replicates, n = 10 measurements) confirming the overexpression of miR-34c-5p, miR-30e or miR-144 in stable T4-2 cell lines compared to control (Ctrl) T4-2 cells. 28S and 18S RNAs were used as internal loading controls. (b) The number of colonies formed per 30-mm-plate (n = 9 replicates) in Figure 2c. (c) The mean areas (n > 50) formed by 3D colonies of S1, T4-2 and T4-2 cells that were expressing the three miRNAs in Figure 2d. (d) The number of cells per colony formed in Figure 2e. (n > 50.) Data are represented as mean ± SEM.
Figure 3 with 2 supplements
Dissection of miRNA target genes and promoter regulation.
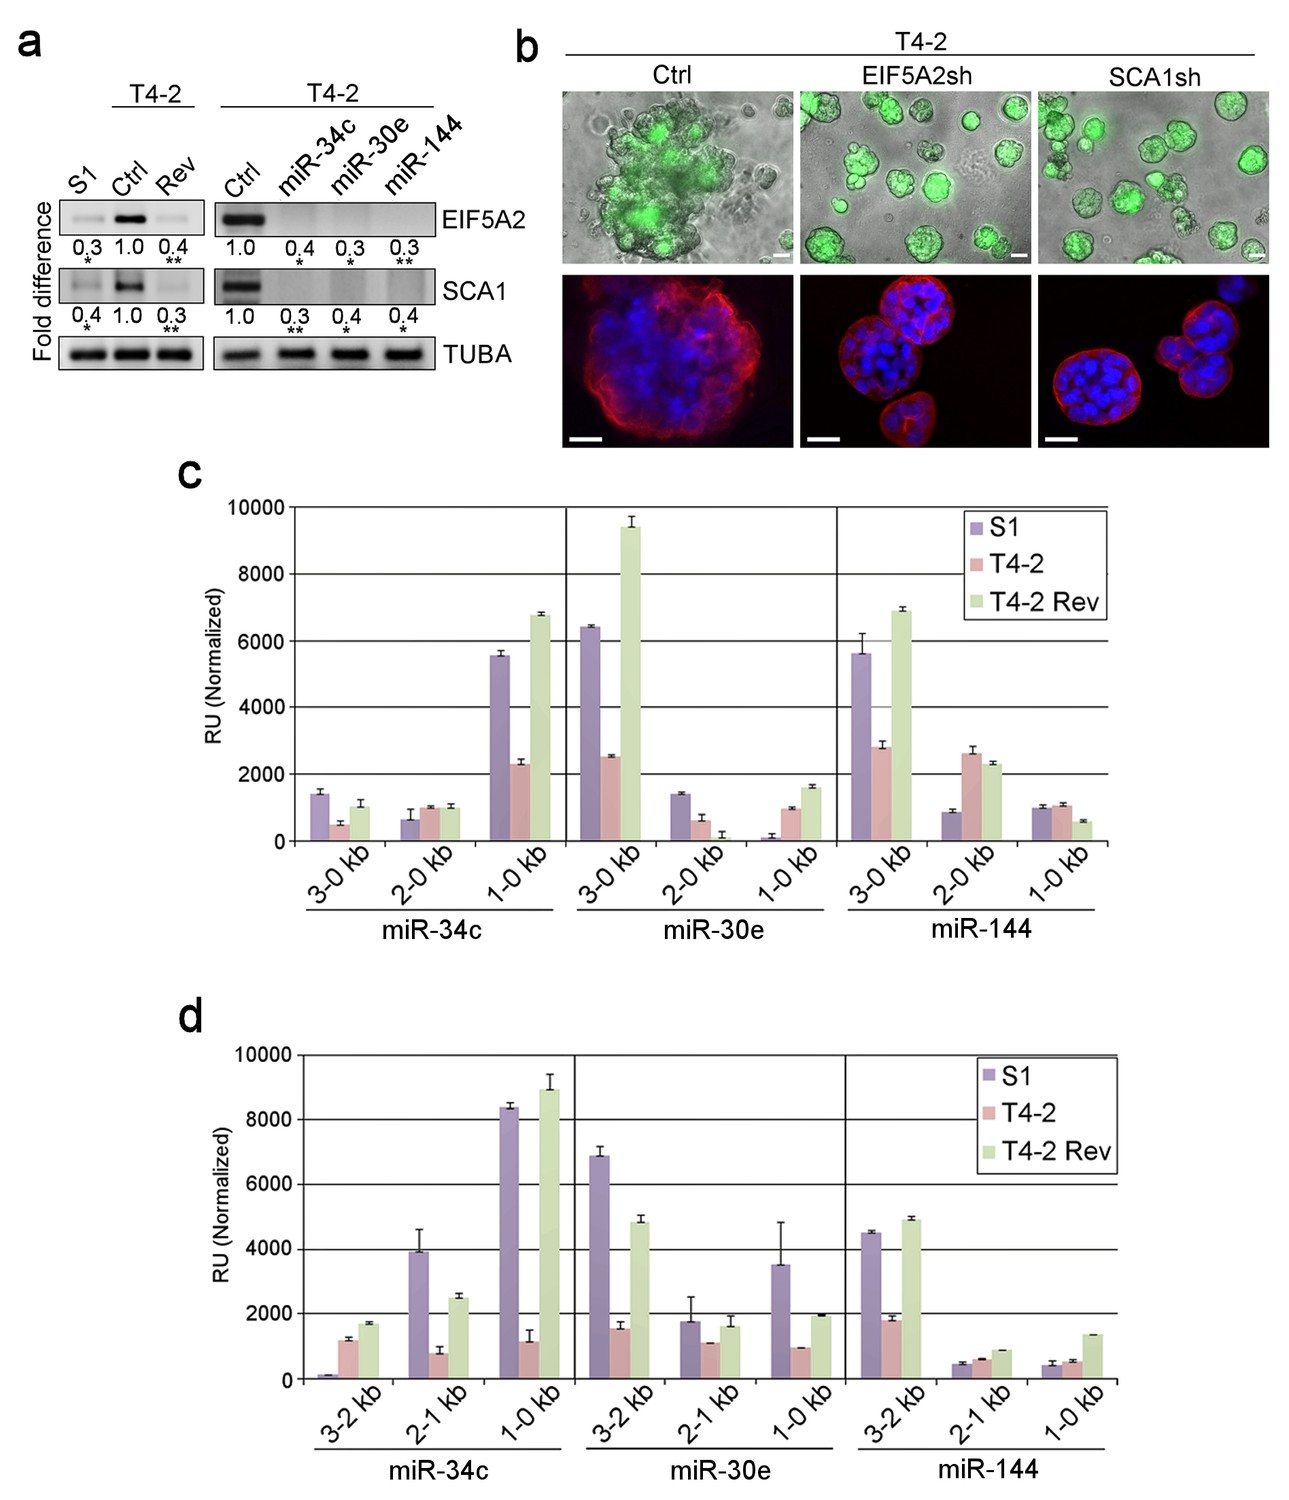
(a) Representative result of semi-quantitative RT-PCR (n = 3) to determine the levels of EIF5A2 and SCA1 in S1, T4-2 and T4-2 Rev cells (treated with AG1478). Fold difference was determined with respect to the Ctrl T4-2. *p<0.05 and **p<0.01 (b) T4-2 cells depleted of EIF5A2 or SCA1 grown in lrECM. (Top) Phase images overlaid with FITI to indicate transduced cells. (Bottom) Red — integrin α6 (red); blue — DAPI. Scale bars: 20 μm. See quantification in Figure 3—figure supplement 1b. (c) Activities of different miRNA promoters (n = 3) in S1, T4-2 and T4-2 Rev cells using the promoter constructs shown in Figure 3—figure supplement 2a. Note that a 1–0 kb fragment of miR-34c promoter, a 3–0 kb fragment of miR-30e promoter and a 3–0 kb fragment of miR-144 promoter were activated in the S1 and T4-2 Rev cells. (d) Activities of different miRNA promoters (n = 3) in S1, T4-2 and T4-2 Rev cells using the promoter constructs shown in Figure 3—figure supplement 2b. Note that a 1–0 kb fragment of miR-34c promoter,a 3–2 kb fragment of miR-30e promoter and a 3–2 kb fragment of miR-144 promoter were activated in S1 and T4-2 Rev cells. Data are represented as mean ± SEM. For each analysis, replicate experiments (n = 3) were performed, and representative data are shown.
Figure 3—figure supplement 1
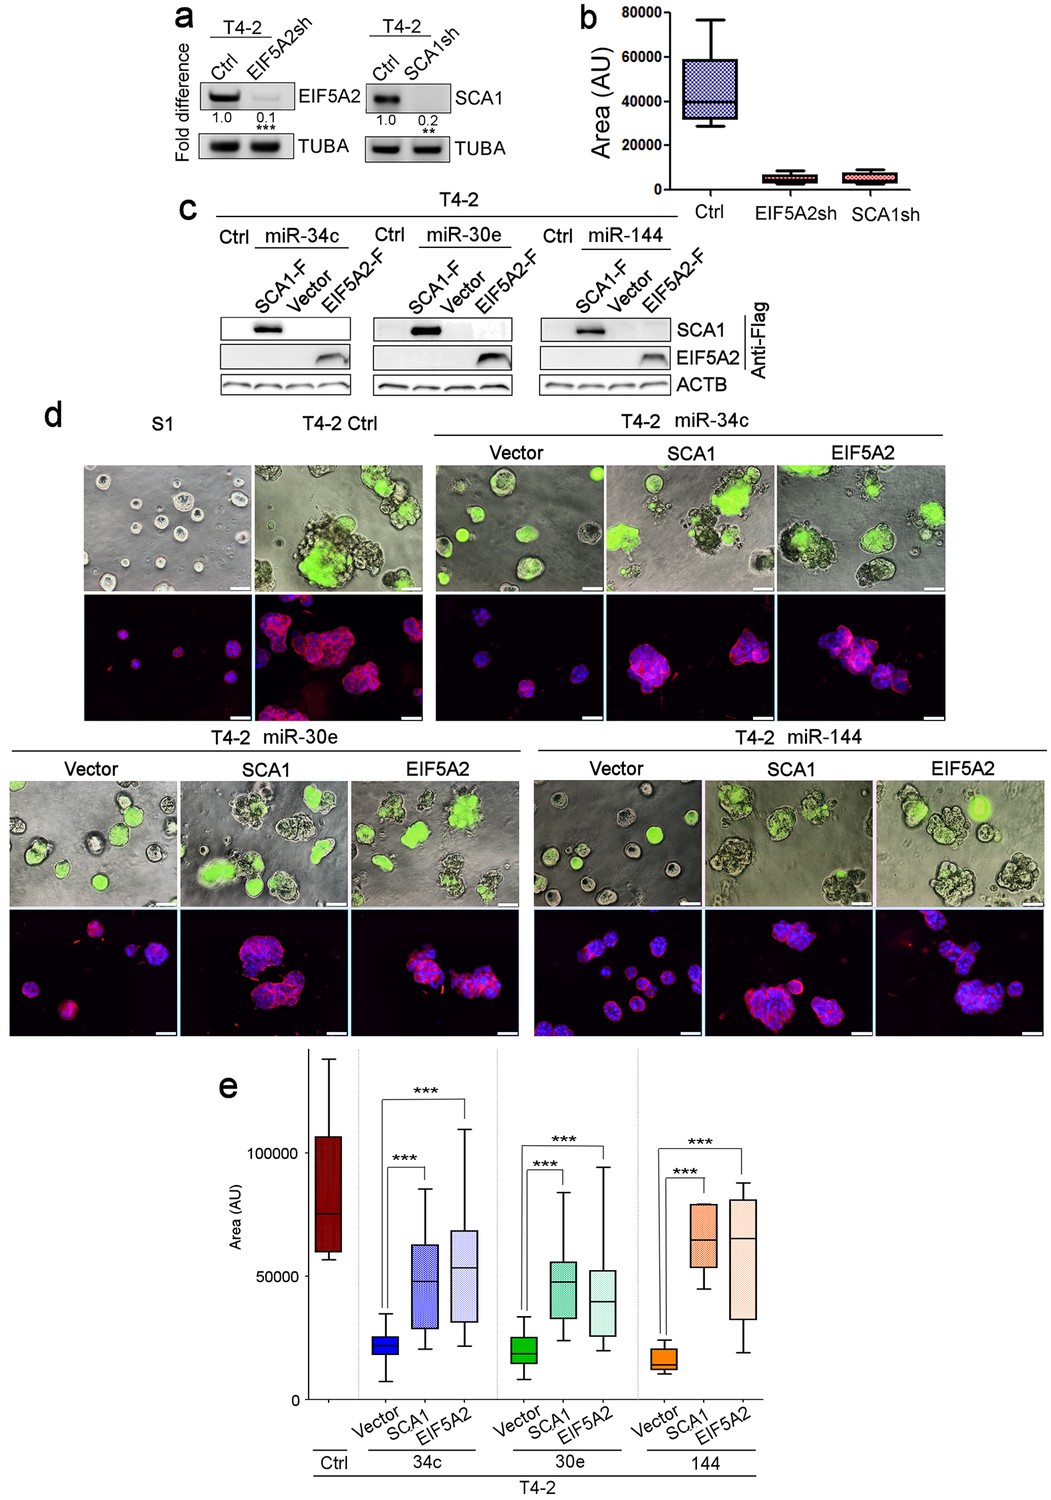
Identification of the downstream targets of the three miRNAs and generation of the promoter constructs of the miRNA genes.
(a) Construction of EIF5A2sh or SCA1sh T4-2 cells, as confirmed by semi-quantitative RT-PCR (n = 3, 10 measurements). (b) The mean area of colonies (n > 50) formed by T4-2 cells depleted of EIF5A2 or SCA1 in Figure 3b. (c) Overexpression of SCA1 or EIF5A2 cDNA in T4-2 cells that were expressing miR-34c, miR-30e or miR-144, as confirmed by western analysis. SCA1 and EIF5A2 DNAs were flag-tagged, and their expression was detected with an anti-flag antibody. (d) miRNA-expressing T4-2 cells that had restored expression of SCA1 or EIF5A2 and that were cultured in lrECM, in comparison to vector control. (Top) Phase images overlaid with FITI to indicate transduced cells. (Bottom) Red — integrin α6 (red); blue — DAPI. Scale bars: 20 μm. (e) The mean area of colonies (n > 20) formed by miRNA-expressing T4-2 cells with restored expression of SCA1 or EIF5A2 (d). Data are represented as mean ± SEM.
Figure 3—figure supplement 2
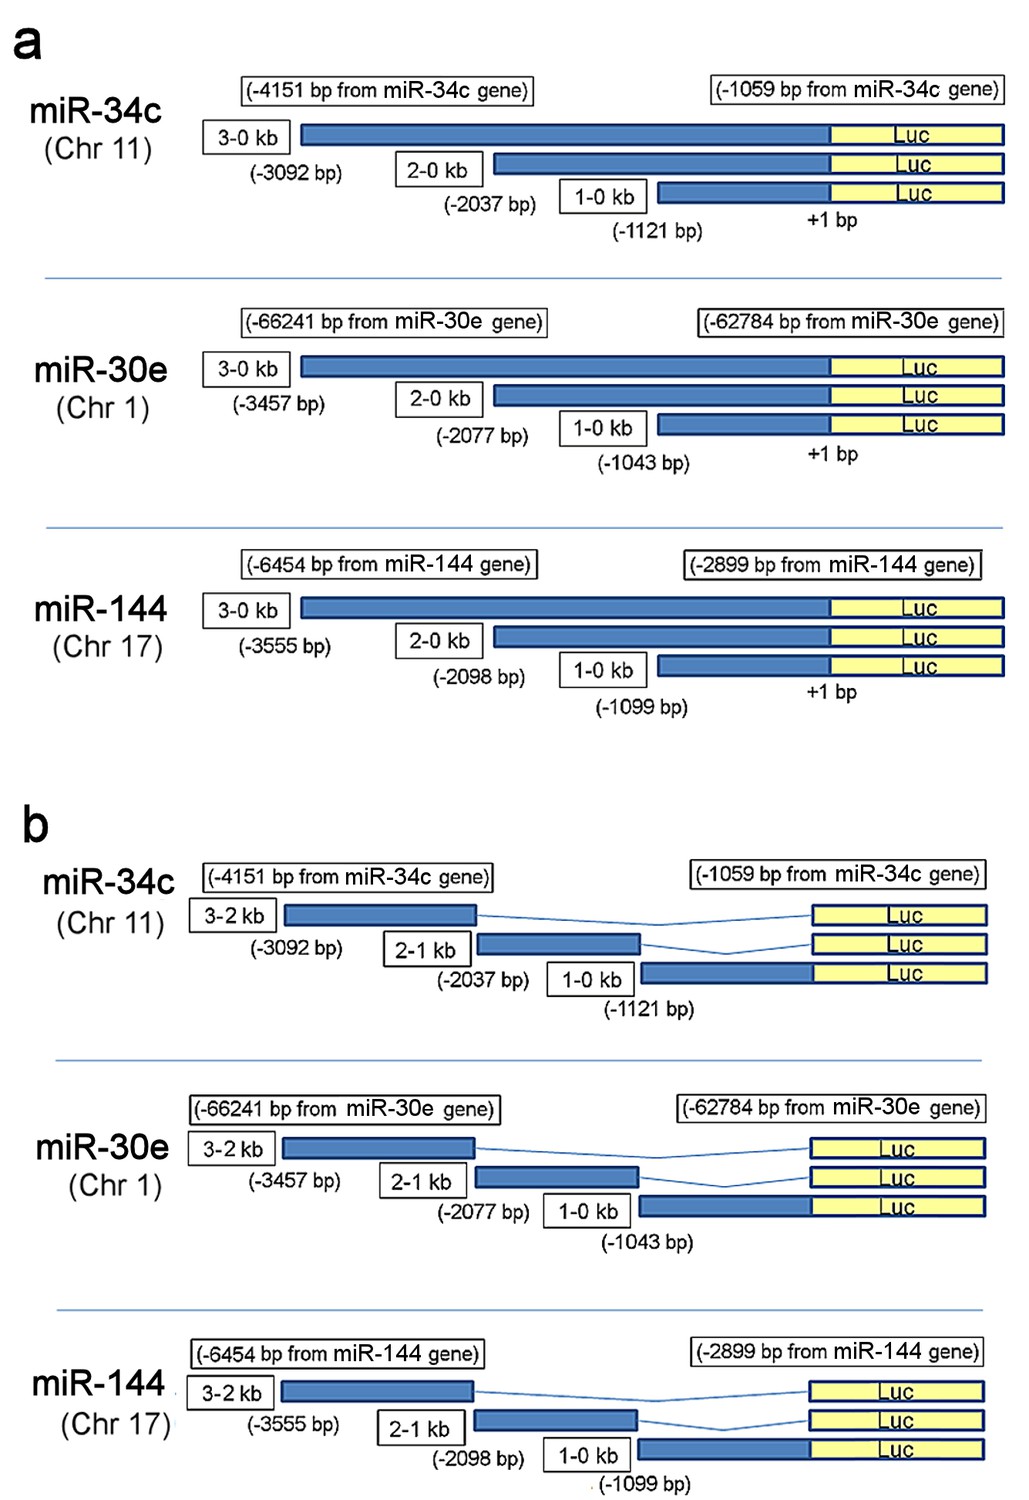
Scheme of reporter constructs derived from the promoter regions of the three miRNAs genes.
(a) Promoter constructs harboring 3–0, 2–0 or 1–0 kb regions upstream of the transcription start site of the three miRNA genes that drive luciferase expression. See Figure 3c for analysis. (b) Promoter constructs harboring 3–2, 2–1 or 1–0 kb regions upstream of the transcription start site of the three miRNA genes. See Figure 3d for analysis.
Figure 4 with 1 supplement
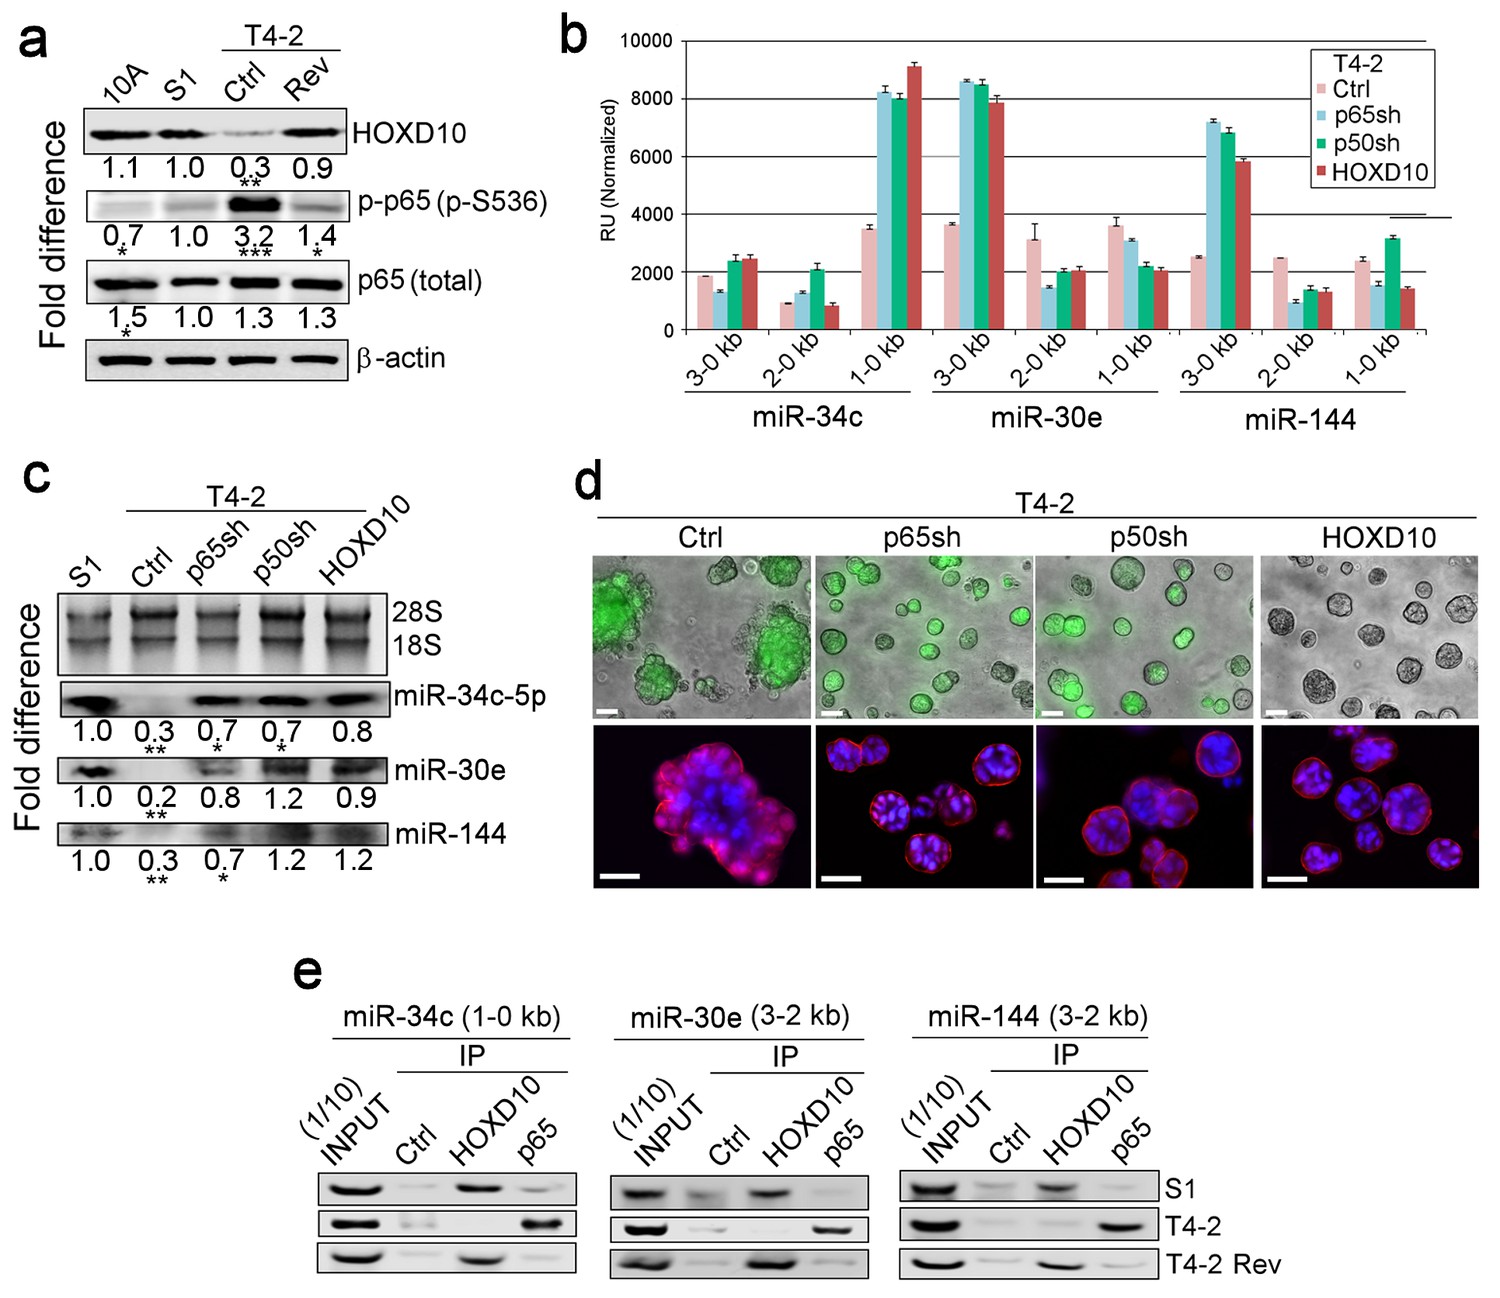
HOXD10 and NFκB regulate expression of the three miRNAs in opposite directions.
(a) Representative western blot result (n = 3) for HOXD10 level, phosphorylation of p65 subunit of NFκB (p-p65, S536), and total p65 level in MCF10A, S1, T4-2 and T4-2 Rev (treated with AG1478) cells. Fold difference was determined with respect to S1 cells. *p<0.05 and ***p<0.001. Note the opposing patterns of HOXD10 and p-p65 levels. (b) Activities of different miRNA promoters (n = 3) in Ctrl, P65sh-, p50sh- or HOXD10-expressing T4-2 cells. Note that a 1–0 kb fragment of miR-34c promoter, a 3–0 kb fragment of miR-30e promoter and a 3–0 kb fragment of miR-144 promoter (the same regions activated in S1 and T4-2 Rev cells, Figure 3—figure supplement 2a) were activated in p65sh-, p50sh- or HOXD10-expressing T4-2 cells. Data are represented as mean ± SEM. (c) Representative northern blot result (n = 3) for the expression of miR-34c-5p, miR-30e and miR-144 in Ctrl, p65sh-, p50sh- or HOXD10-expressing T4-2 cells. 28S and 18S serve as loading controls. Please note that for miR-30e and miR-144, both the sense (5 p) and antisense strands (3 p) are involved. *p<0.05 and **p<0.01. (d) Ctrl, p65sh-, p50sh- or HOXD10-expressing T4-2 cells grown in lrECM. (Top) Phase images overlaid with FITI to indicate transduced cells. (Bottom) red — integrin α6; blue — DAPI. Scale bars: 20 μm. See the quantification in Figure 4—figure supplement 1c. (e) Representative result for ChIP analysis (n = 3) for the binding of HOXD10 and the NFκB p65 subunit on the miRNA promoters. Note that binding of HOXD10 and p65 to the mRNA promoters are mutually exclusive. See the quantification in Figure 4—figure supplement 1e. For each analysis, replicate experiments (n = 3) were performed, and representative data are shown.
Figure 4—figure supplement 1
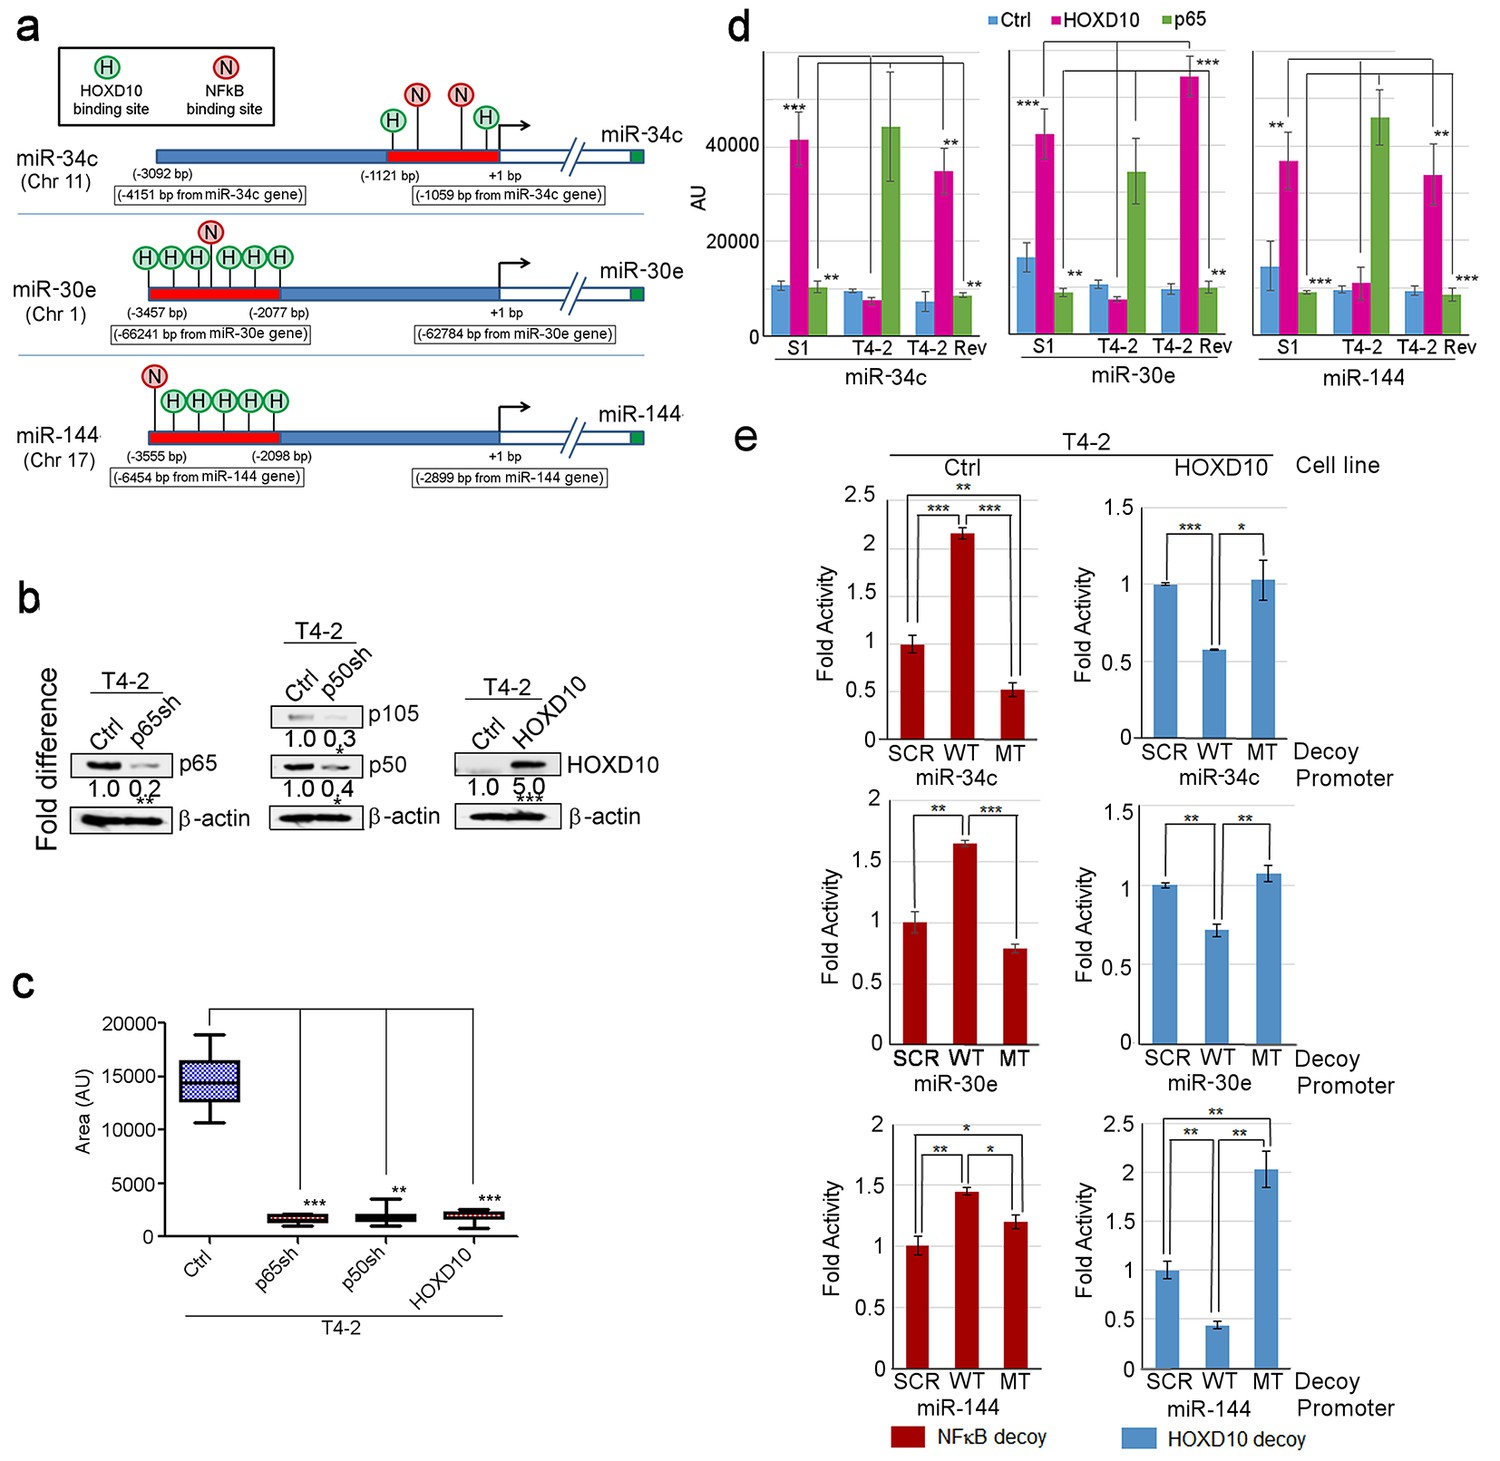
HOXD10 and NFκB positively and negatively regulate the miRNA expression, respectively.
(a) The promoter region of the three miRNAs activated in S1 and T4-2 Rev cells contained multiple binding sites for HOXD10 and NFκB. (b) Representative result of western analysis (n = 3, n = 10 measurements) confirming generation of T4-2 cells that were stably depleted of the p65 (left) or p50 (processed)/p105 (unprocessed) subunit (middle) of NFκB or that overexpressed HOXD10 (right). β-actin was used as a loading control. (c) The mean area of colonies (n > 50) formed by T4-2 cells depleted of p65 or p50 subunit of NFκB or T4-2 cells overexpressing HOXD10 as in Figure 4d. (d) Quantification of the ChIP analyses (n = 3, n = 10 measurements) for the binding of HOXD10 and of the NFκB p65 subunit on the miRNA promoters in Figure 4e. Data are represented as mean ± SEM. (e) miRNA promoter activity after expression of (scramble [SCR], WT or MT) decoys for NFκB or HOXD10. Ctrl cells were transfected with a pool of NFκB decoys derived from the predicted binding sites in each miRNA promoter (Table 7), whereas HOXD10-overexpressing cells were transfected with a pool of HOXD10 decoys. Note that WT NFκB decoys, but not MT decoys, derepressed the activity of the three promoters in Ctrl cells, indicating that WT decoys sequestered NFκB, whereas the MT decoys did not. Similarly, WT HOXD10 decoys, but not MT decoys, inhibited the promoter activities in HOXD10-overexpressing cells, indicating that WT decoys sequestered HOXD10, whereas MT decoys did not.
Figure 5 with 1 supplement
p53 activation is another requirement for tumor-cell reversion by the miRNAs.
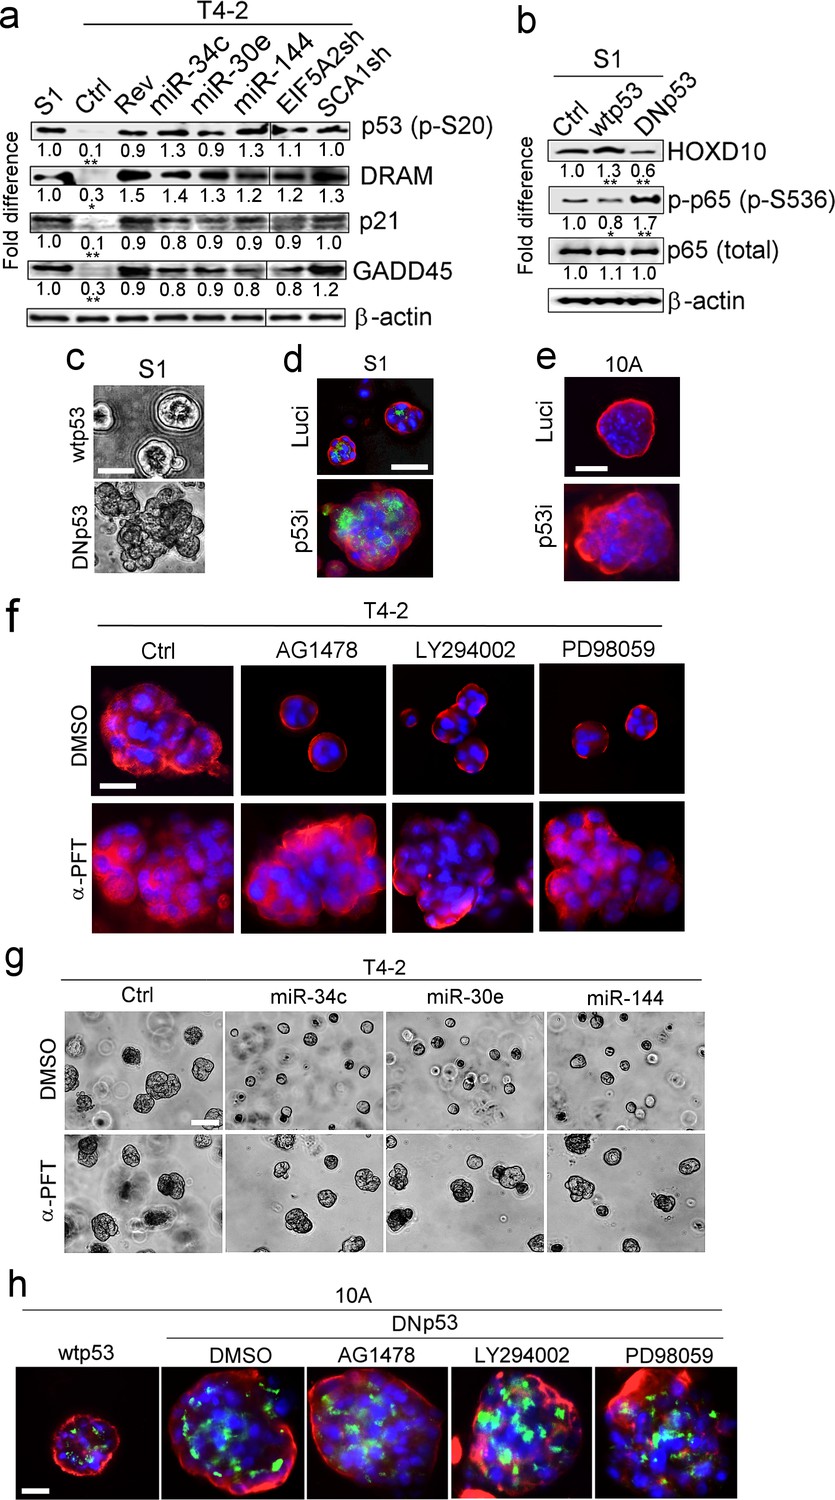
(a) Representative result of western analysis (n = 3) for the level and activation of proteins in the p53 pathway [p53 (p-Ser20), DRAM, p21 and GADD45] in S1, T4-2 and T4-2 Rev cells. T4-2 Rev cells include those treated with AG1478, those expressing the three miRNAs and those depleted of the two target genes (EIF5A2 and SCA1). Fold difference was determined with respect to S1 cells. *p<0.05 and **p<0.01. (b) Representative result of western analysis (n = 3) for the activities of HOXD10 and p65 (p-p65) in Ctrl S1 cells and in S1 cells that were overexpressing the wild-type (wt) or dominant-negative mutant (DN) p53. Note the opposing effects of wtp53 or DNp53 expression on HOXD10 vs. p-p65. Fold difference was determined with respect to Ctrl S1. *p<0.05 and **p<0.01. (c) Representative image for S1 cells overexpressing wtp53 (top) or DNp53 (bottom) grown in lrECM. Ctrl S1 cells were un-transduced. See the quantification of 3D colony size in Figure 5—figure supplement 1a. (d) Representative image for Ctrl S1 (top) and S1 cells depleted of p53 (bottom) grown in lrECM. Red — α6, green; apical marker GM130. See the confirmation of p53 depletion and quantification of the 3D colony size in Figure 5—figure supplement 1b. (e) Representative image for Ctrl MCF10A cells (top) and MCF10A cells depleted of p53 (bottom) grown in lrECM. See the confirmation of p53 depletion and quantification of the 3D colony size in Figure 5—figure supplement 1c. (f) Representative image of 3D morphologies of T4-2 cells co-treated with a reverting agent [AG1478 (EGFR inhibitor), LY294002 (PI3K inhibitor) or PD98059 (MEK inhibitor)] along with p53 inhibitor α-pifithrin (α-PFT). Note that α-PFT treatment abrogated reversion of T4-2 cells. See the quantification of 3D colony size in Figure 5—figure supplement 1d. (g) Representative image of 3D morphologies of miRNA-overexpressing T4-2 cells co-treated with a reverting agent [AG1478 (EGFR inhibitor), LY294002 (PI3K inhibitor) or PD98059 (MEK inhibitor)] along with p53 inhibitor α-pifithrin (α-PFT). Note that α-PFT treatment abrogated the reversion of T4-2 cells after expressing miRNAs. See the quantification of the 3D colony size in Figure 5—figure supplement 1e. (h) Representative image of 3D morphologies of DNp53-expressing MCF10A cells treated with a reverting agent [AG1478 (EGFR inhibitor), LY294002 (PI3K inhibitor) or PD98059 (MEK inhibitor)]. Note that DNp53-expressing cells are more proliferative, fail to form acini and are resistant to a reverting agent. See the quantification of the 3D colony size in Figure 5—figure supplement 1f. Red — integrin α6; green — Golgi marker, GM130; and blue — DAPI. Scale bars: 20 μm. For each analysis, replicate experiments (n = 3) were performed, and representative data are shown.
Figure 5—figure supplement 1
p53 activation is essential for acinar formation and tumor-cell reversion.
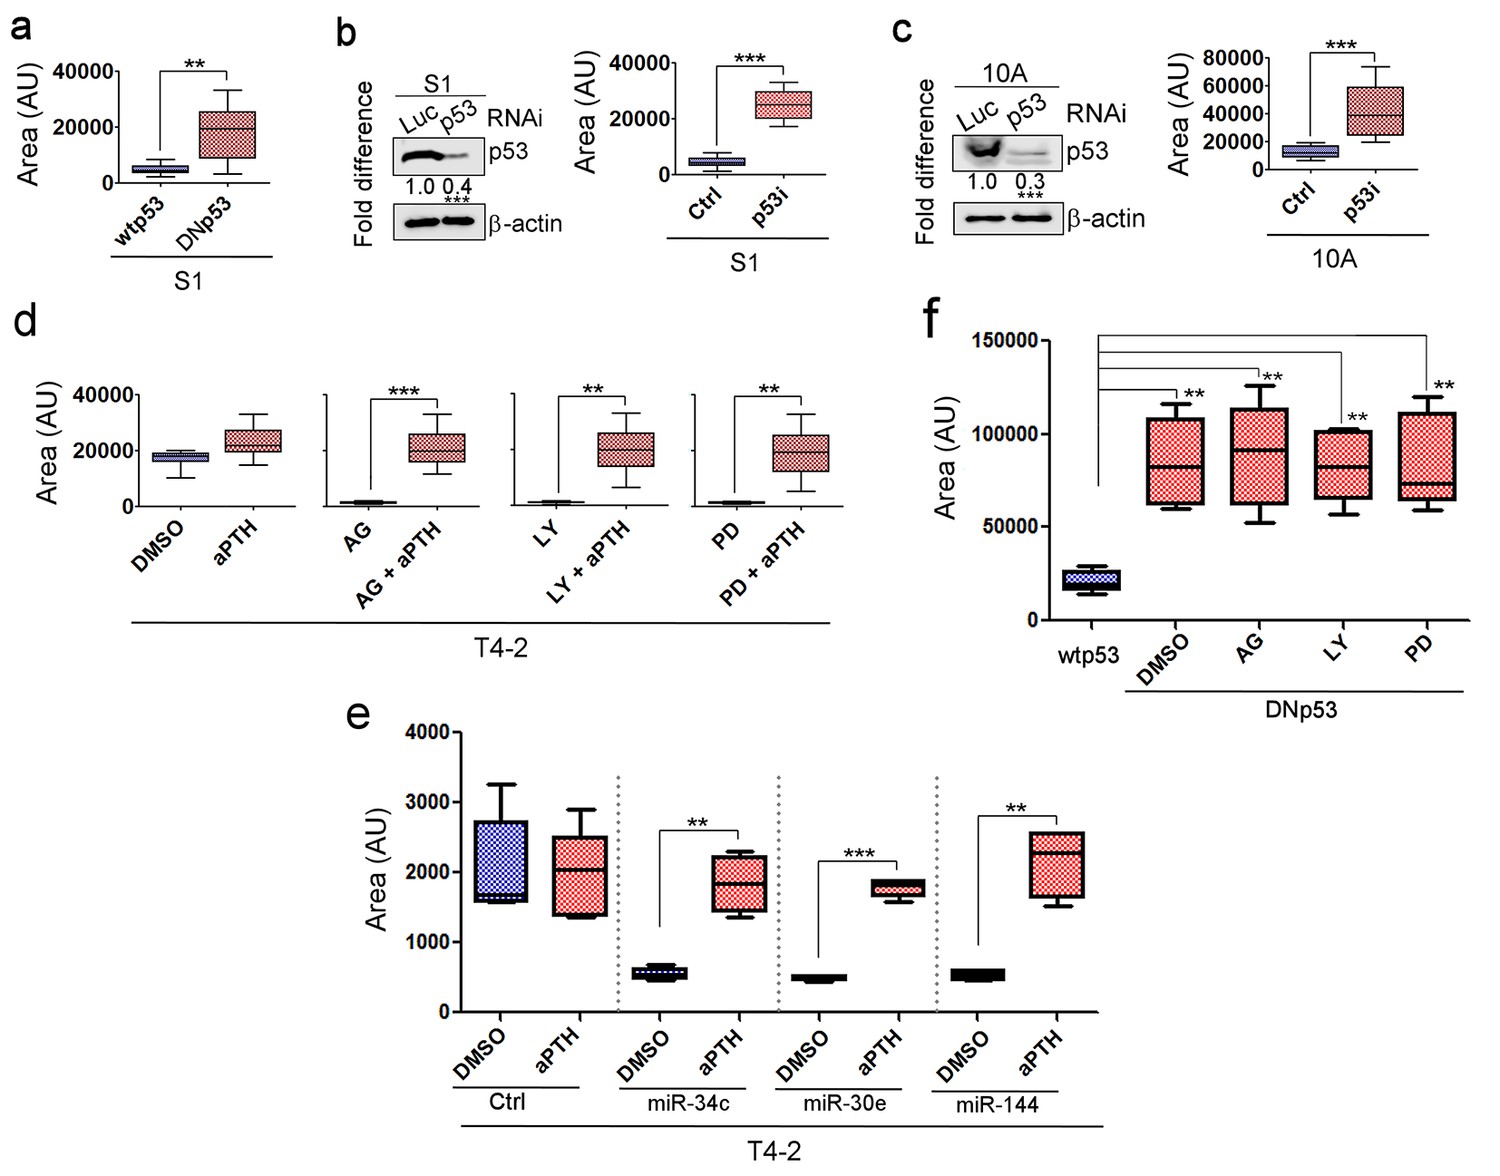
(a) The mean area of colonies (n > 50) formed by S1 cells expressing wild-type or dominant-negative mutant p53 as in Figure 5c. (b) (Left) Representative result of western analysis (n = 3) confirming depletion of p53 in S1 cells with siRNA of proprietary sequence (sc-29435, Santa Cruz). (Right) The mean area of 3D colonies (n > 50) of S1 cells treated with luci vs. p53i as in Figure 5d. (c) (Left) Representative result of western analysis (n = 3) confirming depletion of p53 in MCF10A cells with RNAi used in (b). (Right) The mean area of 3D colonies (n > 50) of MCF10A cells treated with luci vs. p53i as in Figure 5e. (d) The area of colonies of T4-2 cells (n > 50) co-treated with AG1478, LY294002 or PD98059 along with p53 inhibitor α-pifithrin (α-PFT) as in Figure 5f. (e) The mean area of colonies of miRNA-overexpressing T4-2 cells (n > 50) co-treated with AG1478, LY294002 or PD98059 along with α-pifithrin (α-PFT) as in Figure 5g. (f) The mean area of colonies of DNp53-expressing MCF10A cells (n > 50) treated with AG1478, LY294002 or PD98059 as in Figure 5h.
Figure 6 with 2 supplements
MMP-9 degrades LN5 and prevents tumor-cell reversion; miRNAs’ ability to revert T4-2 cells is connected to inhibition of MMP-9 and the rescue of LN5.
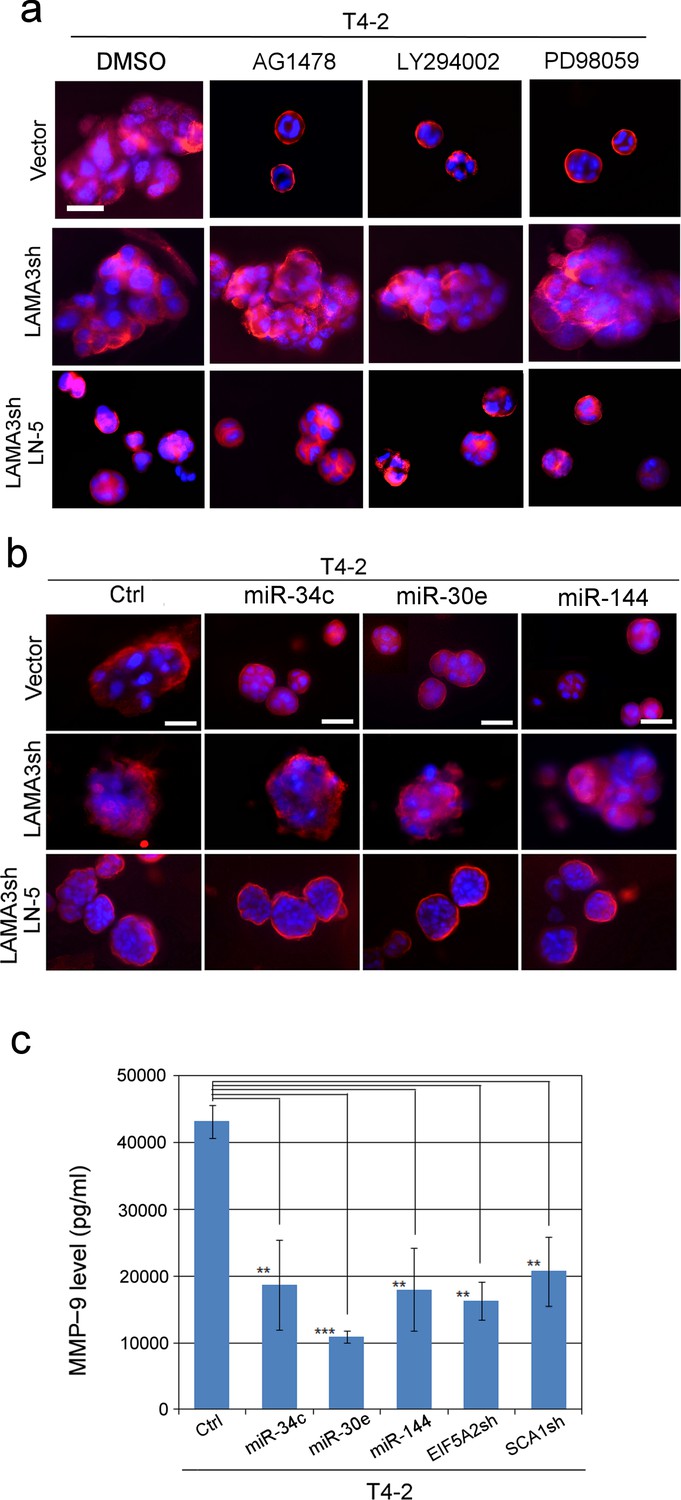
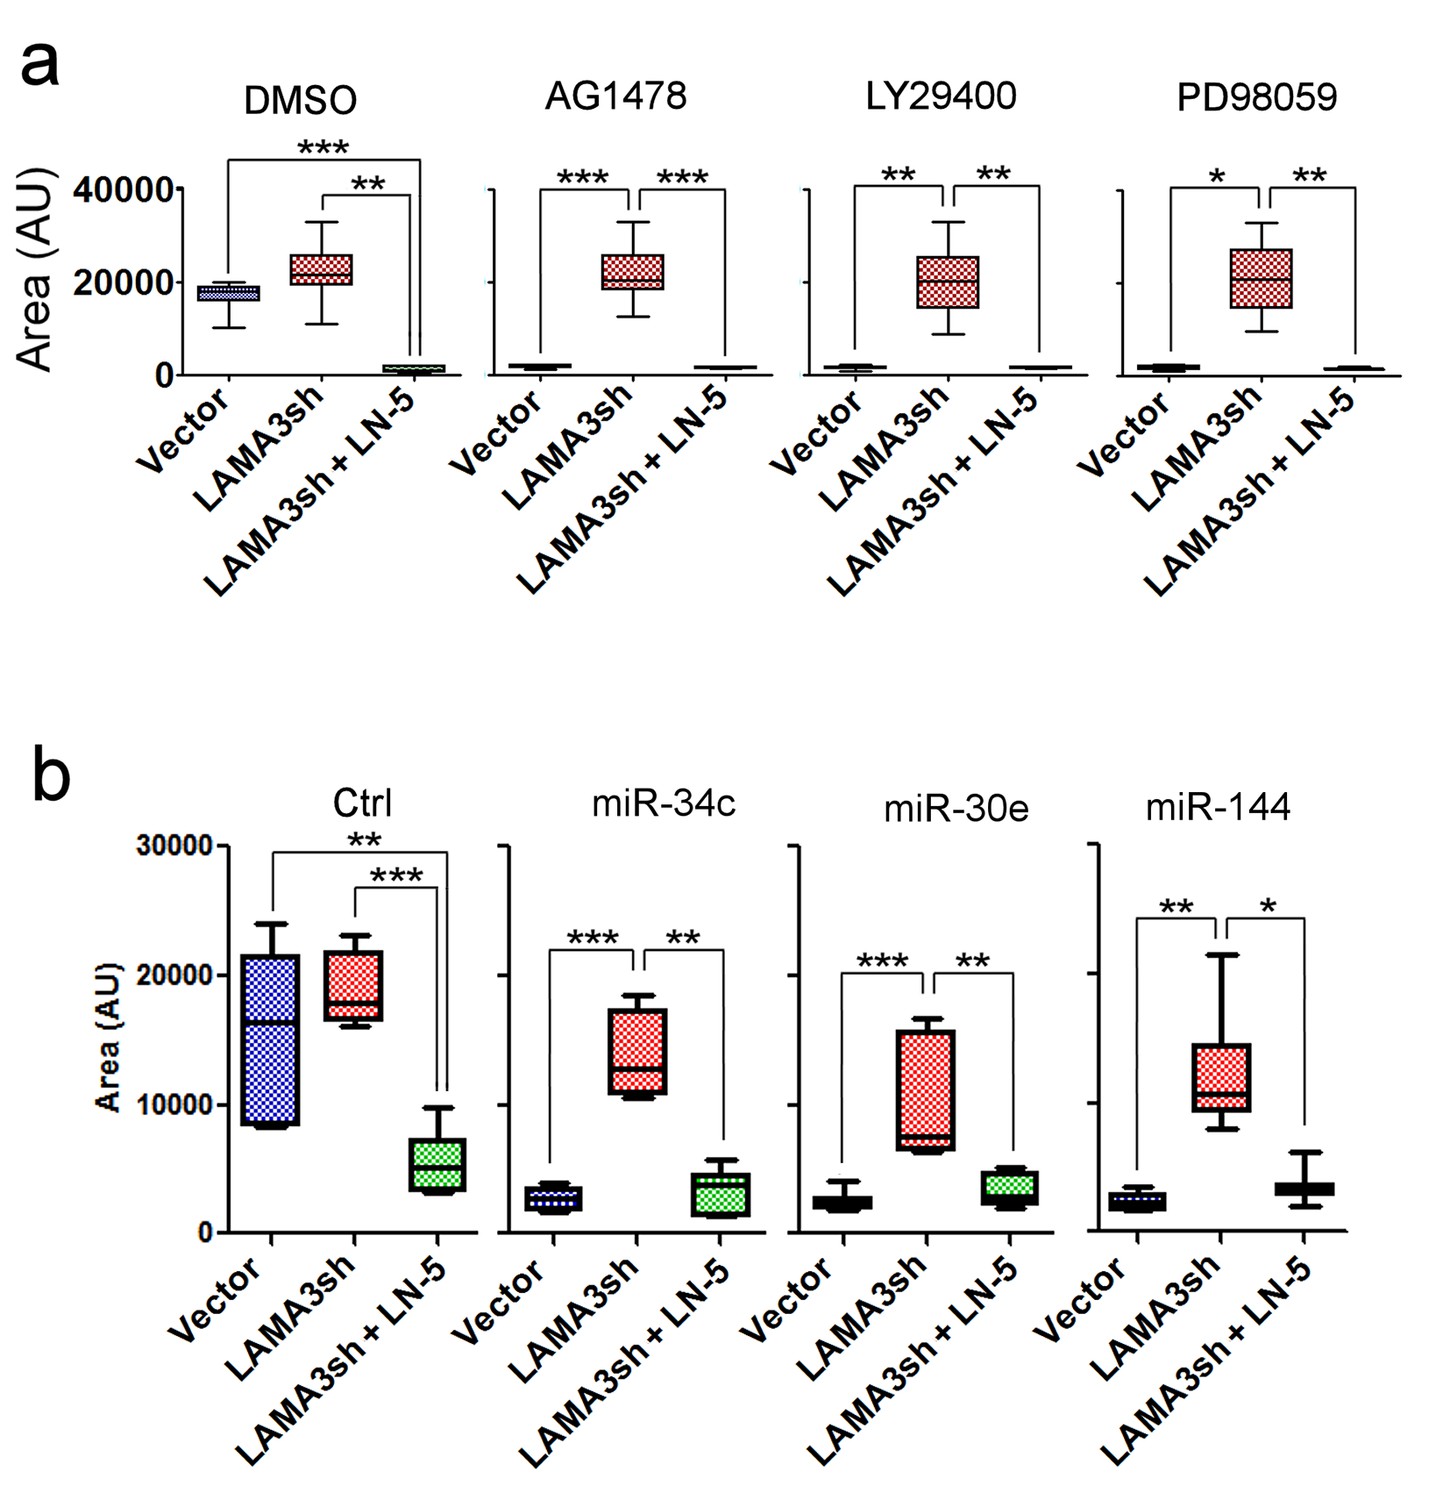
(a) Representative images of repricate experiments (n = 3) of 3D morphologies of T4-2 cells (vector, LAMA3sh, LAMA3sh + LN5) reverted with a reverting agent, AG1478, LY294002 or PD98059. See the quantification of the 3D colony size in Figure 6—figure supplement 2a. Note that the depletion of LAMA3 abrogated the reverting effect, which was rescued by ectopic addition of LN5 (1 μg/ml). Red — α6 integrin; blue — DAPI. Scale bars: 20 μm. (b) Representative images of replicate experiments (n = 3) of 3D morphologies of T4-2 cells (vector, LAMA3sh, LAMA3sh + LN5) overexpressing individual miRNAs. See the quantification of the 3D colony size in Figure 6—figure supplement 2b. Note that the depletion of LAMA3 abrogated the reverting effect of the miRNAs, which was rescued by ectopic addition of LN5. (c) The mean MMP-9 level (n = 9) in the CM of T4-2 cells, T4-2 cells expressing one of the three miRNAs or T4-2 cells depleted of the two target genes, EFI5A2 and SCA1, was determined 24 hr after addition of lrECM (5% Matrigel). The concentration of MMP-9 was determined using the MMP-9 standard. Data represented as mean ± SEM. **p<0.01 and ***p<0.001.
Figure 6—figure supplement 1

LN5 expression is upregulated in T4-2 cells overexpressing the three miRNAs or depleted of their target genes.
(a) Mean result of western analysis (n = 3, n = 10 measurements) to determine the level of pan-LN in the cell lysates and in CM. E-cadherin serves as a loading control. For each analysis, replicate experiments (n > 3) were performed, and representative data are shown. Data measurements were performed at least three times. (b) The mean level of different laminin α chains detected by different antibody clones on protein arrays (n = 3). LAMA1 M-20 is from mouse; the remaining are from humans. (c) The mean level of different laminin β chains detected by different antibodies on protein arrays (n = 3). LAMB2 SPM412 is from cows; the remaining are from humans. (d) The mean level of different laminin γ chains detected by different antibodies on protein arrays (n = 3). All are for human antibodies. Data represented as mean ± SEM.
Figure 6—figure supplement 2
LN5 expression is required for reversion of tumor cells in 3D.
(a) The mean area of 3D colonies (n > 50) of T4-2 cells, T4-2 cells treated with LAMA3sh (alpha chain of LN5) and T4-2 cells treated with LAMA3sh plus ectopic LN5 in the presence of AG1478, LY294002 or PD98059. (b) The mean area of 3D colonies (n > 50) of T4-2 cells treated with LAMA3sh (alpha chain of LN5) and T4-2 cells treated with LAMA3sh plus ectopic LN5 after overexpressing miR-34c, miR-30e or miR-144. Data represented as mean ± SEM.
Figure 7 with 1 supplement
LNs activate p53 through production of NO.
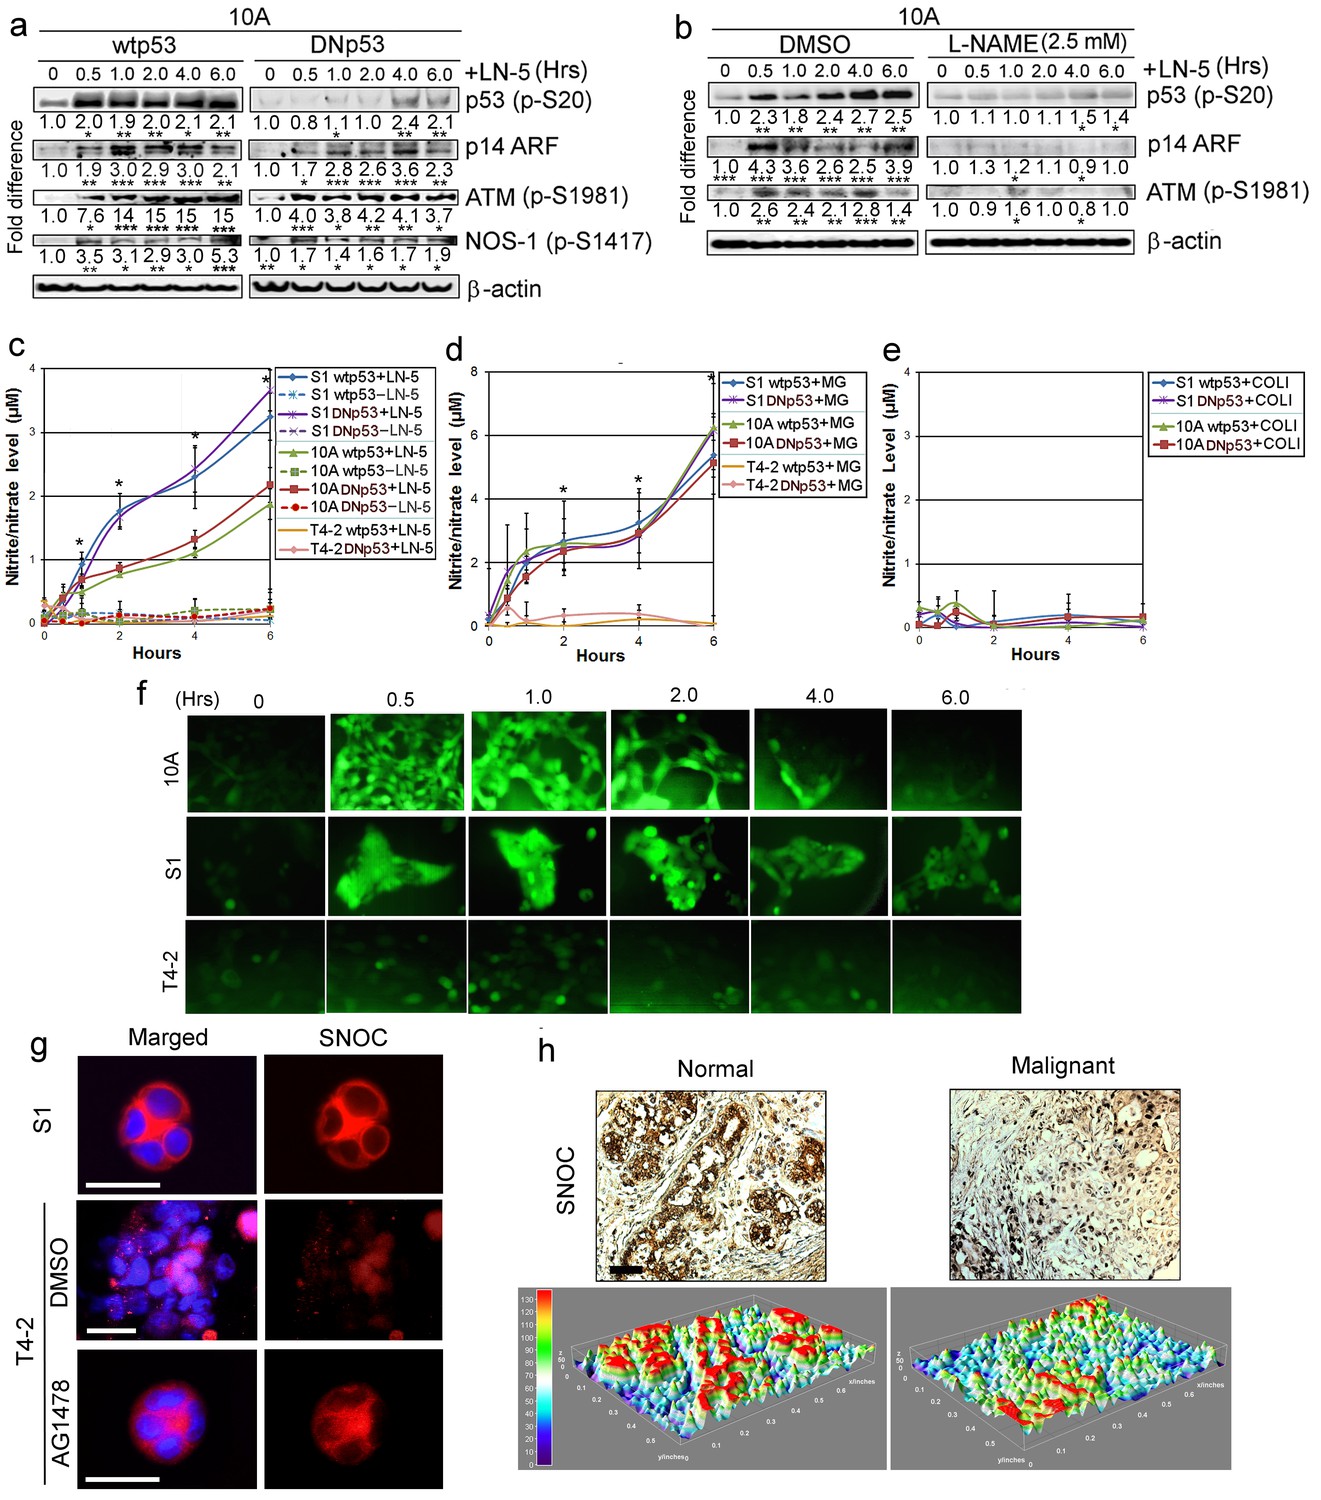
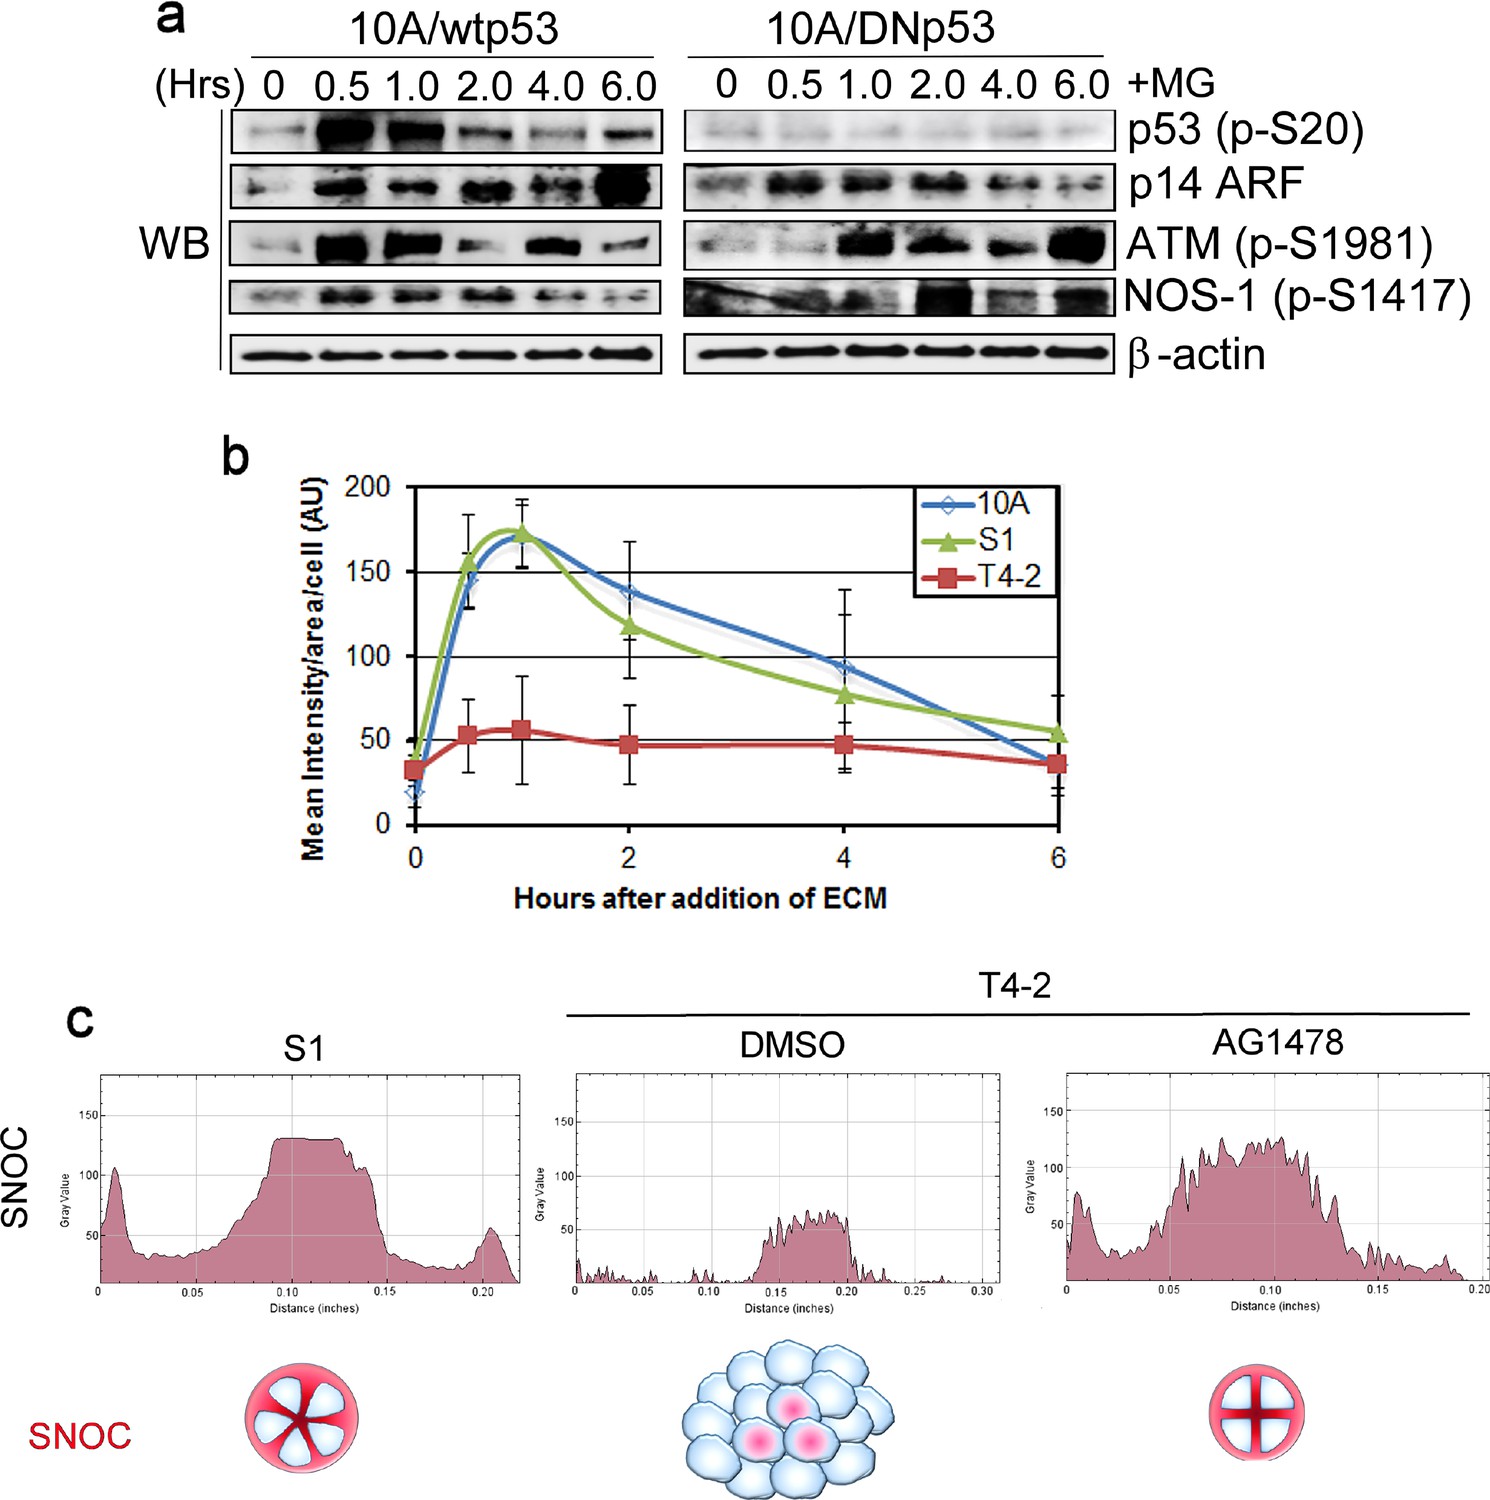
(a) Representative results of western analysis (n = 3) for MCF10A cells expressing either wtp53 or DNmtp53, showing the level of activated p53 (p-Ser20) after addition of exogenous LN5 (1 μg/ml). Other lanes indicate the levels of p14 ARF and activation of ATM and NOS-1 after LN5 addition. Fold differences were determined first by normalization with respect to β-actin and then by normalization with respect to the value at time 0. *p<0.05; **p<0.01 and ***p<0.001. See similar results after the addition of Matrigel (5%) in Figure 7—figure supplement 1a. (b) Representative results of western analysis (n = 3) showing the levels of activation of ATM, p14 ARF and p53 in the absence or the presence of an NO inhibitor, L-NAME. (c–e) The mean level of NO metabolites (nitrite or nitrate, n = 9) in CM after addition of LN5 (1 μg/ml) (c), lrECM (5% Matrigel) (d) or COL1 (500 μg/ml) (e); please note that this amount is equivalent to the total protein level of 5% Matrigel. Nitrite or nitrate level was determined with a fluorescent probe DAN using the nitrite/nitrate standard. Data are represented as mean ± SEM. *p<0.05. Note that S1 and MCF10A cells, but not T4-2 cells, produced NO in response to LN5 (c) and lrECM (d), irrespective of whether they express wild-type or mutant p53. (e) COL1 did not induce NO production. (f) Representative images (n = 3) showing the level of intracellular NO in MCF10A, S1 and T4-2 cells after addition of 5% MG, as determined with a fluorescent NO probe DAF-FM DA. See the quantification of NO level in Figure 7—figure supplement 1b. (g) Representative images (n = 3) of S-nitrosocysteine (SNOC, NO indicator)-stained HMT3522 cells (S1, T4-2 and T4-2 Rev cells with AG1478) in lrECM cultures for 1 wk. Note that SNOC was enriched in the basolateral surface of S1 and T4-2 Rev cells, whereas it was weakly diffused in T4-2 cells treated with DMSO. Red —SNOC; blue — nuclei. Scale bars: 20 μm. (h) Representative images of normal (n = 8) vs. cancerous (n = 32) breast tissues stained for SNOC presented as IHC (top) and heat map of surface plot (bottom). Positive staining (intensity >+1): 8/8 for normal vs. 8/32 for cancerous tissues. Scale bars: 50 μm.
Figure 7—figure supplement 1
Acinar-forming breast cells produce NO in response to LNs.
(a) Representative result of western analysis (n = 3, n = 10 measurements) showing upregulation of p53 along with activation of NOS-1, ATM and p14 ARF in MCF10A cells in response to LN1-rich Matrigel (5%). β-actin serves as a loading control. (b) Quantification of the signal per cell treated with live NO dye DAF-FM DA as in Figure 7f. Data represented as mean ± SEM (n = 50). (c) Histograms of the representative distributions of SNOC across individual 3D colonies (n = 50) as in Figure 7g.
Figure 8 with 1 supplement
NO is involved critically in breast acinar formation and mammary gland morphogenesis.
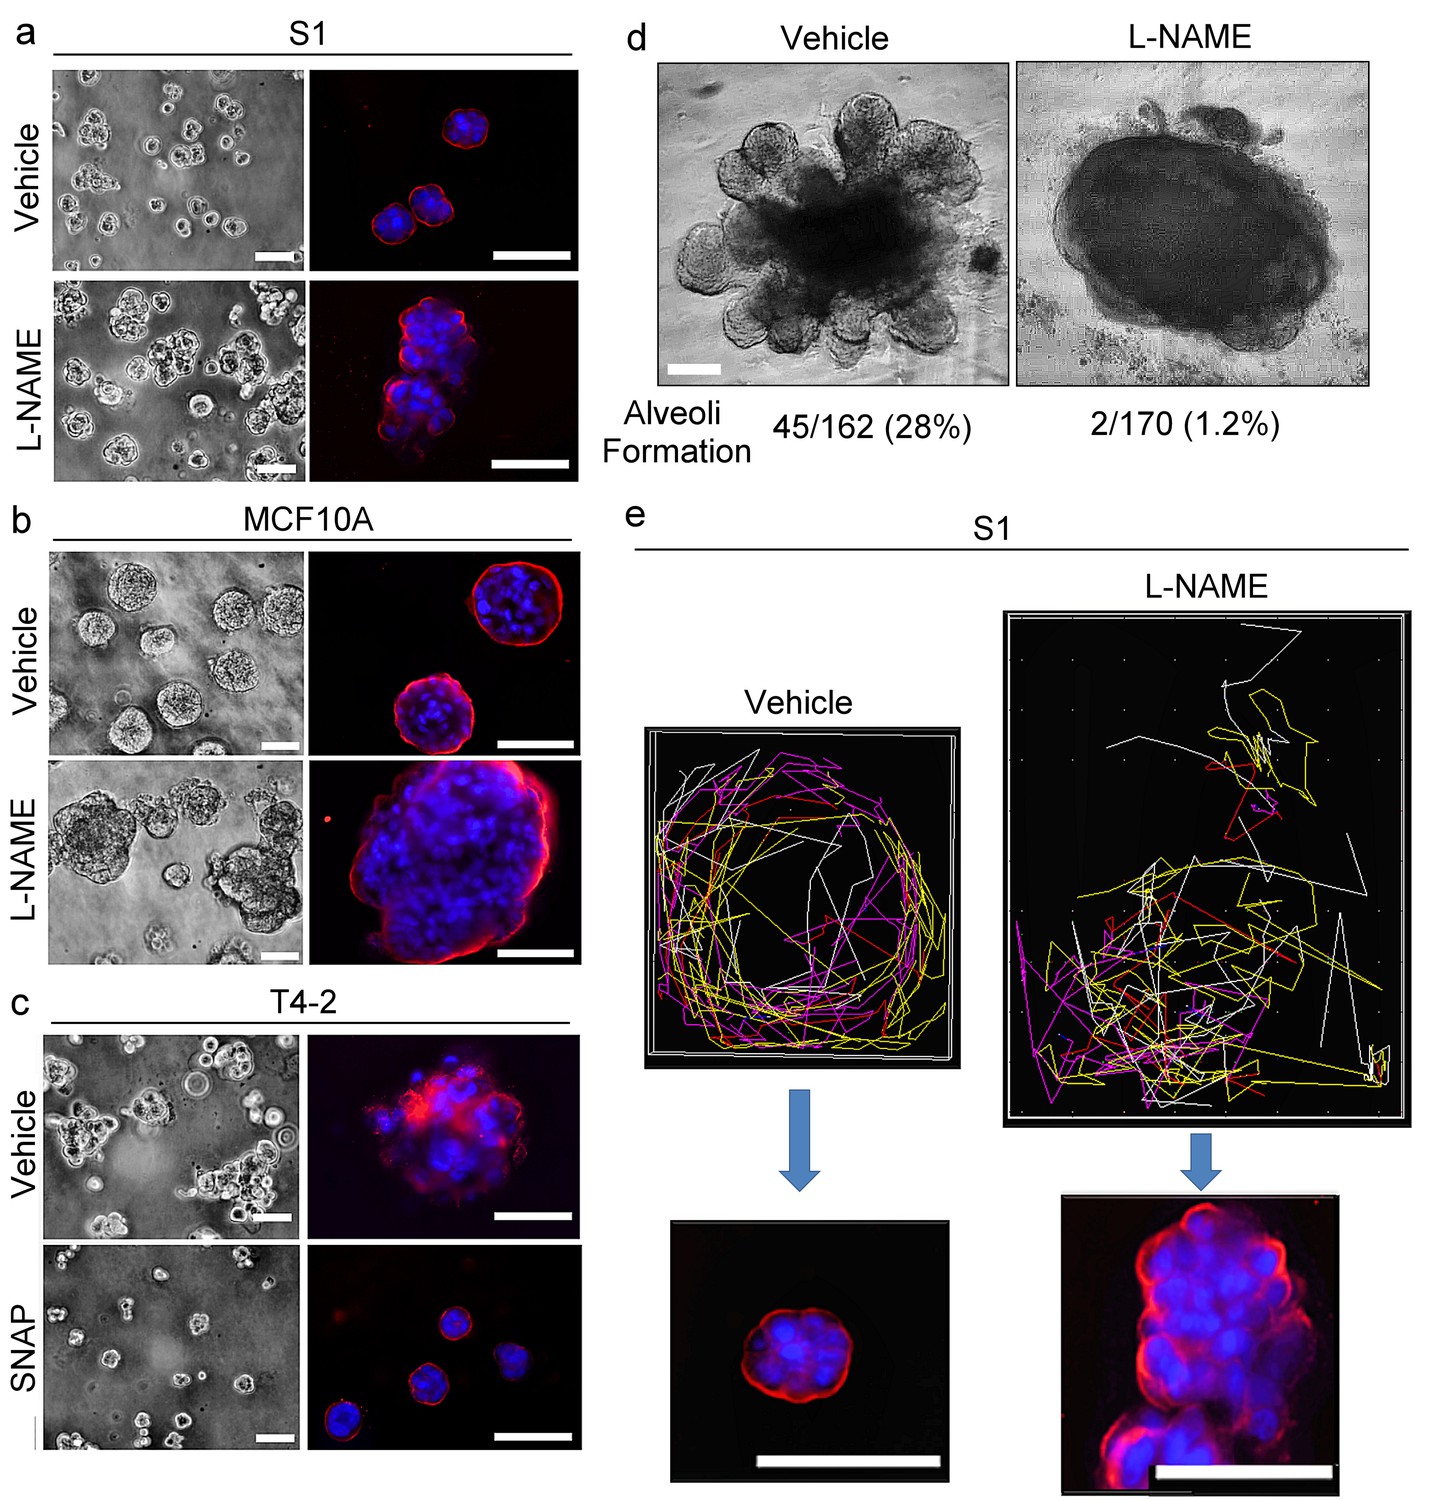
(a–b) Representative images (n = 3) of S1 (a) and MCF10A (b) cells grown in lrECM in the absence (vehicle only) or presence of an NO inhibitor, L-NAME (2.5 mM). Scale bars: 20 μm. (c) Representative image (n = 3) of T4-2 cells grown in lrECM in the absence (vehicle only) or presence of an NO donor, SNAP (10 μM). (a–c) (Left) Phase images. (Right) Cells stained for integrin α6 (red) and nuclei (blue). Scale bars: 20 μm. See the quantification of colony size in Figure 8—figure supplement 1a–c. (d) Representative images of ex vivo cultures of normal human mammary gland organoids grown in lrECM for 1 week. The numbers of organoids that underwent alveologenesis were 45 out of 162 vehicle-treated, and only 2 out of 170 L-NAME-treated organoids. (e) (Top) Representative result (n = 5) of tracking analysis for the movement of S1 cells during 48 hr of growth in lrECM in the absence (vehicle only) or presence of L-NAME. (Bottom) Representative image of the colonies (n = 5) formed by cells after respective treatments for 10 days. Red — integrin α6; blue —nucleus. Scale bars: 50 μm. Note that vehicle-treated S1 cells moved in a coherent rotatory fashion in a confined area, whereas L-NAME-treated S1 cells moved in a disorganized fashion in a larger area.
Figure 8—figure supplement 1
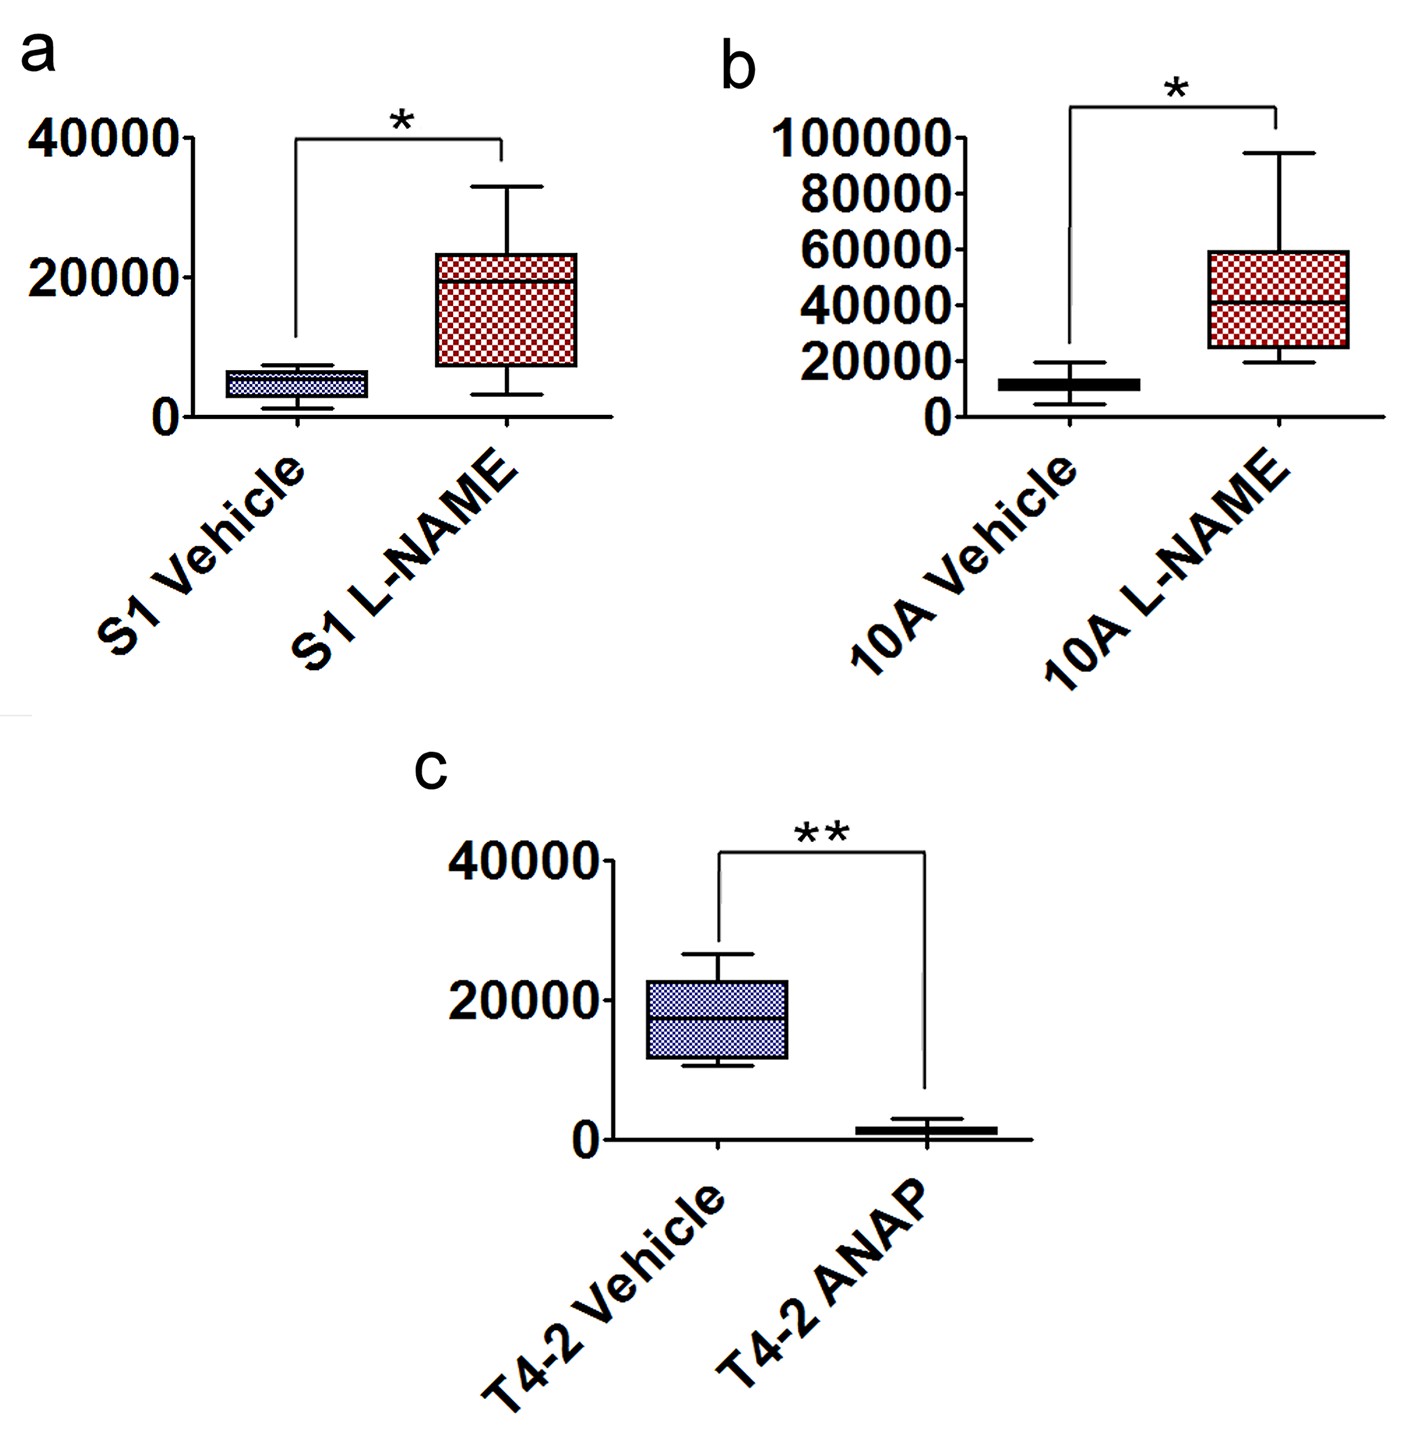
NO is critical for breast cells to form growth-arrested colonies in 3D.
(a–c) Quantification of the 3D colony size (n = 50) of S1 cells treated with or without L-NAME (a), MCF10A cells treated with or without L-NAME (b) and T4-2 cells treated with or without SNAP (c). Data represented as mean ± SEM. See the micrograms of cell colonies in Figure 8a–c.
Figure 9 with 1 supplement
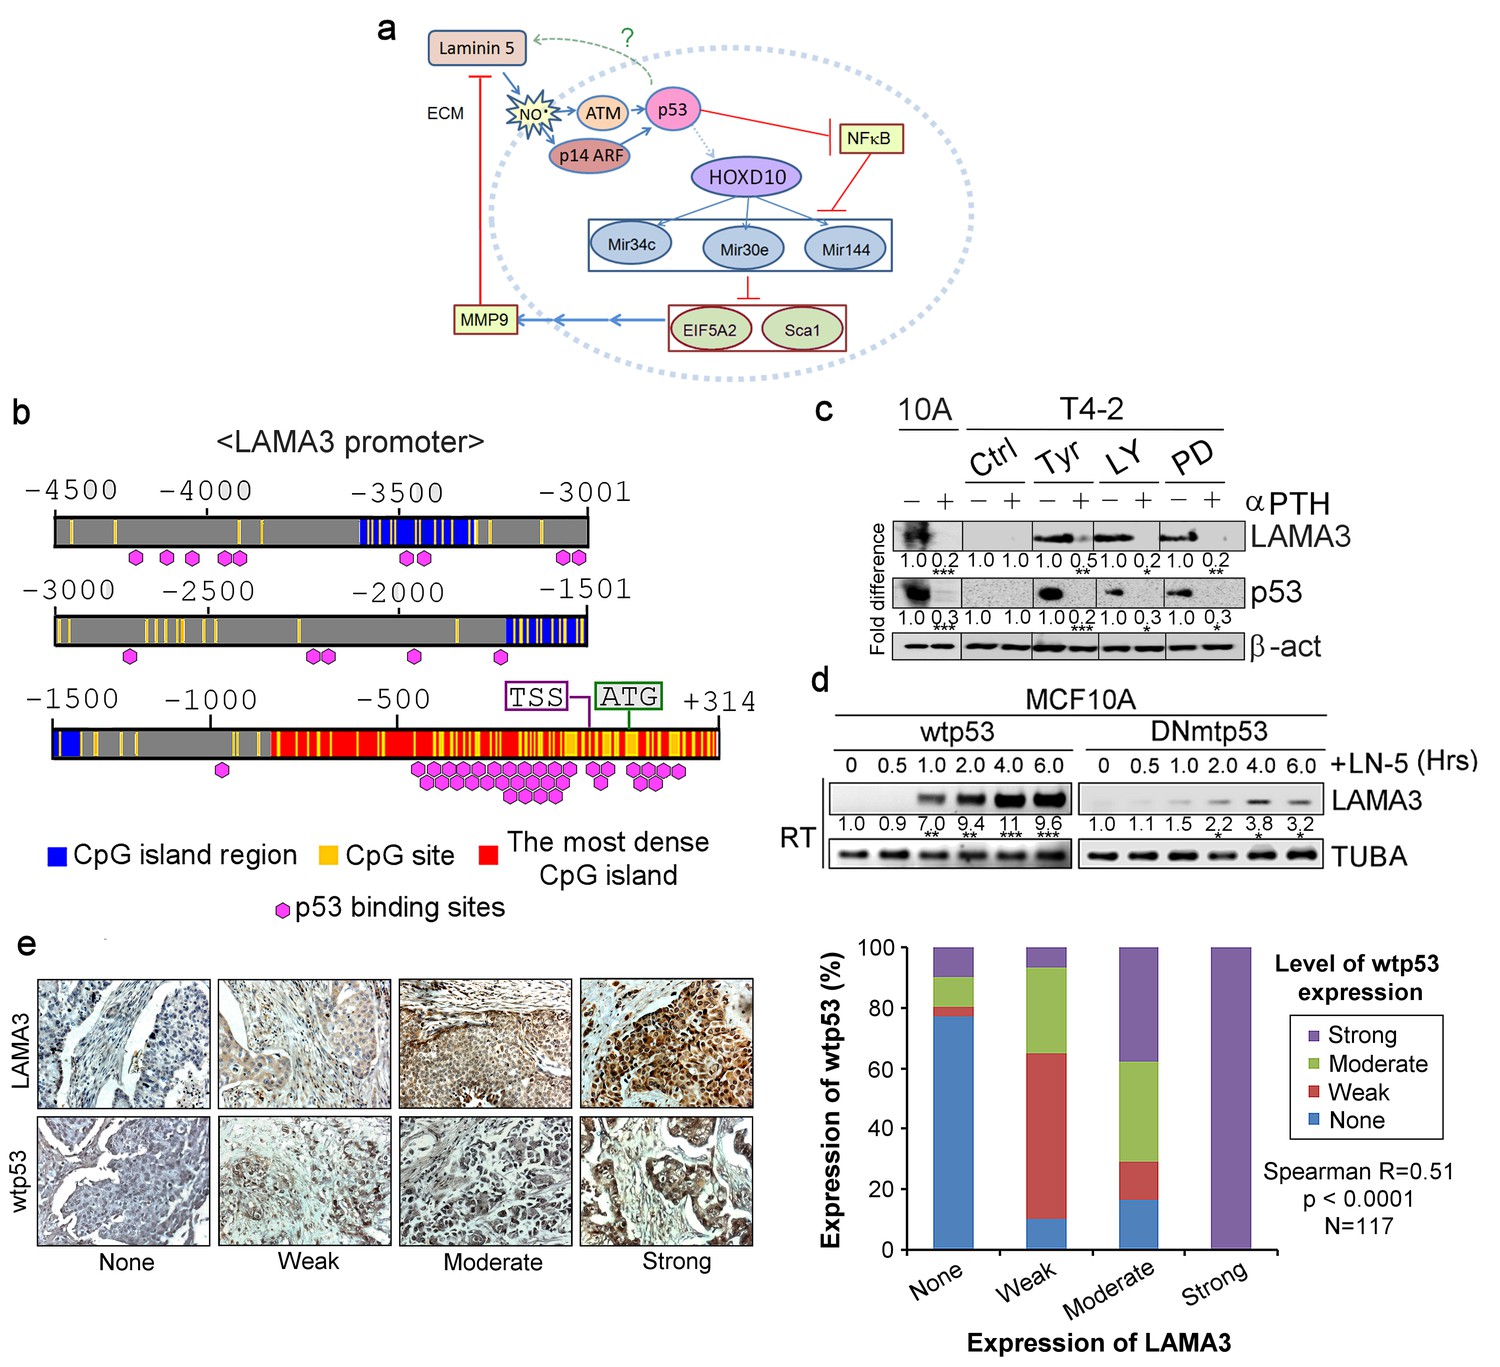
Activated p53 in turn upregulates expression of the endogenous alpha chain of LN5.
(a) A schematic of the morphogenetic loop dissected to date with a predicted feedback loop between p53 and LN5. (b) The promoter region of the LAMA3 gene contained the CpG island that harbors numerous p53-binding sites around the transcription start site (TSS). (c) Representative result of western analysis (n = 3) for LAMA3 expression in T4-2 cells treated with a reverting agent (AG1478, LY294002 or PD98059) in the absence or presence of a p53 inhibitor, α-PFT. β-actin serves as a loading control. Fold difference was determined with respect to the Ctrl T4-2. *p<0.05; **p<0.01 and ***p<0.001. For each analysis, replicate experiments (n = 3) were performed, and representative data are shown. (d) Representative result of RT-PCR analysis (n = 3) showing that exogenous LN5 (1 μg/ml) upregulated LAMA3 transcription in MCF10A cells expressing wild-type p53, but not in cells expressing DNp53. α-tubulin (TUBA) was used as a control. Fold difference was determined with respect to time 0. *p<0.05; **p<0.01 and ***p<0.001. (e) (Left) Representative images of the IHC staining of breast cancer tissues (n = 117) for LAMA3 and wild-type p53. (Right) Correlation analysis between LAMA3 expression and wild-type p53 expression in breast tumors.
Figure 9—figure supplement 1
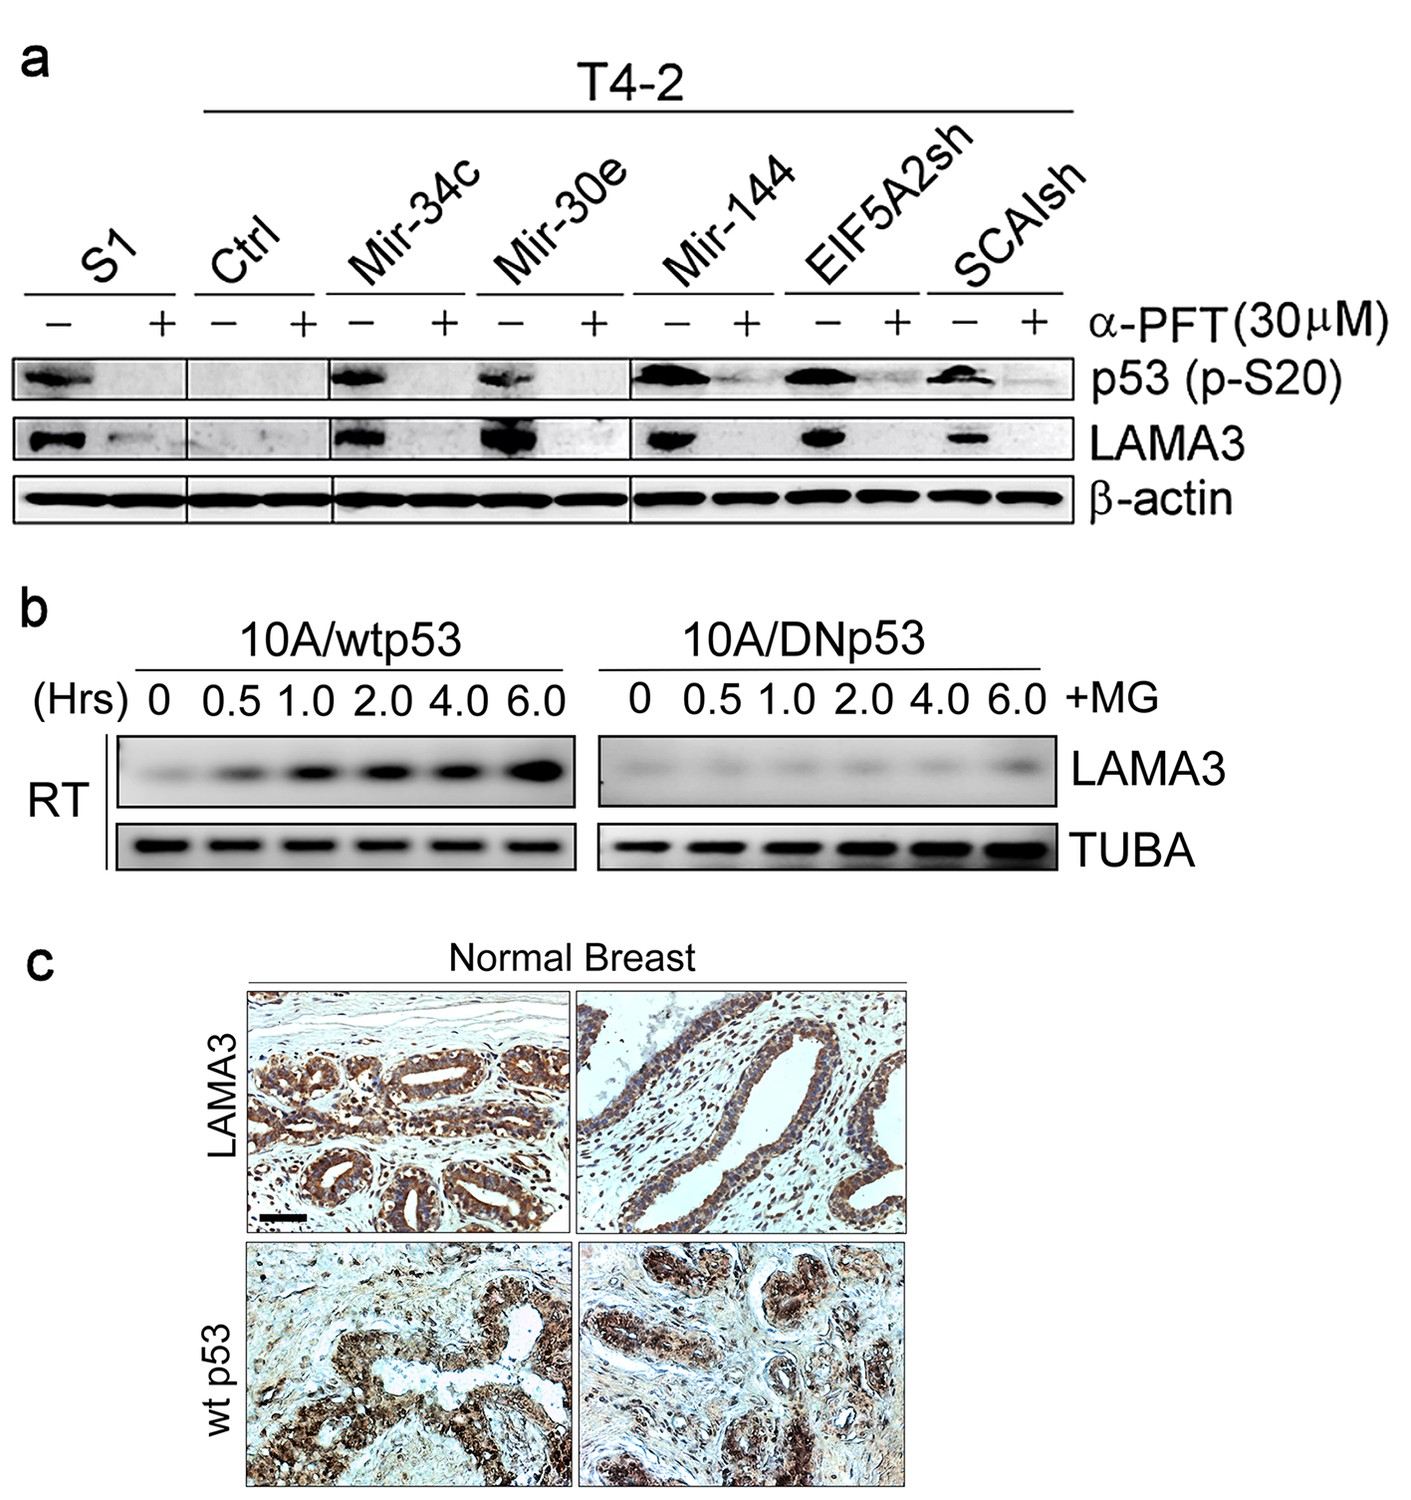
LAMA3 expression depends on p53 activation.
(a) Representative result of western analysis (n = 3, n = 10 measurements) for LAMA3 expression in T4-2 cells expressing the three miRNAs or depleted of the two target genes in the absence or presence of a p53 inhibitor, α-PFT. β-actin is used as a loading control. (b) Representative result of RT-PCR analysis (n = 3, n = 10 measurements) showing that LN1-rich Matrigel (5%) upregulated LAMA3 transcription in MCF10A cells expressing wild-type p53, but not in cells expressing DNp53. α-tubulin (TUBA) was used as a control. (c) Representative result of IHC staining of normal breast cancer tissues (n = 10) in tissue arrays for LAMA3 and wild-type p53 (pAb1620).
Figure 10

Schematic for acinar morphogenesis and phenotypic reversion of tumor cells in response to LN1 or LN5.
https://doi.org/10.7554/eLife.26148.035
Author response image 1
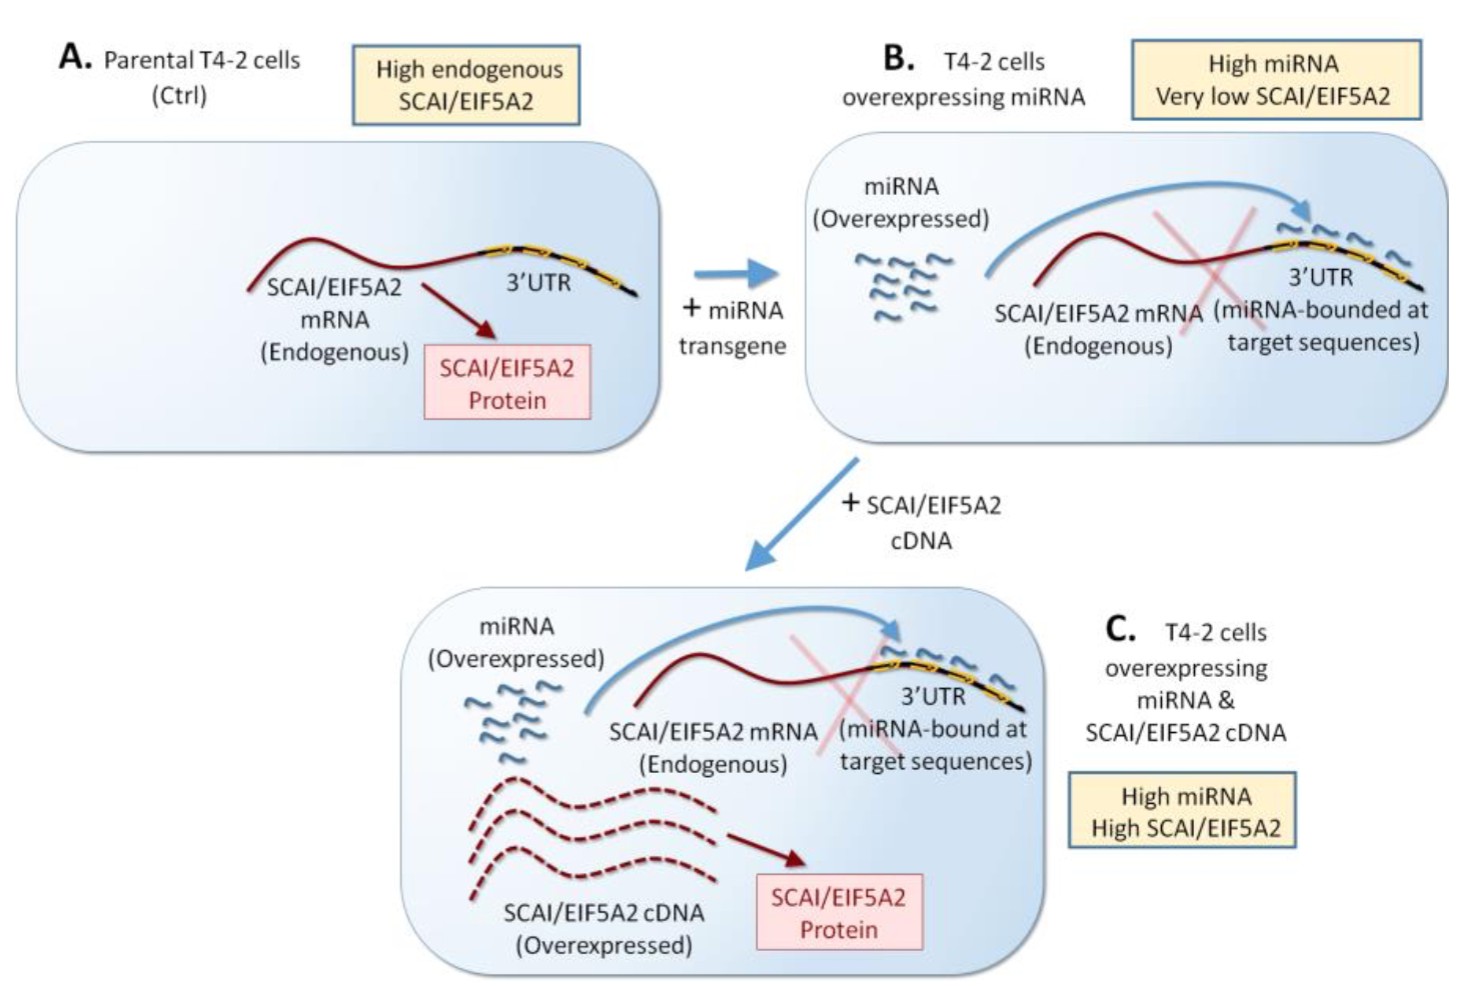
Scheme of overexpression of miRNA target gene (SCAI/EIF5A2) without miRNA binding sites in the 3’UTR.
(A, B) T4-2 cells overexpressing each of the three miRNAs (Mir-34c, Mir-30e, and Mir-144) are generated. (C) These miRNA-overexpressing cells will be transfected with SCAI/EIF5A2 cDNA (no 3’UTR, no miRNA binding sites).
Author response image 2
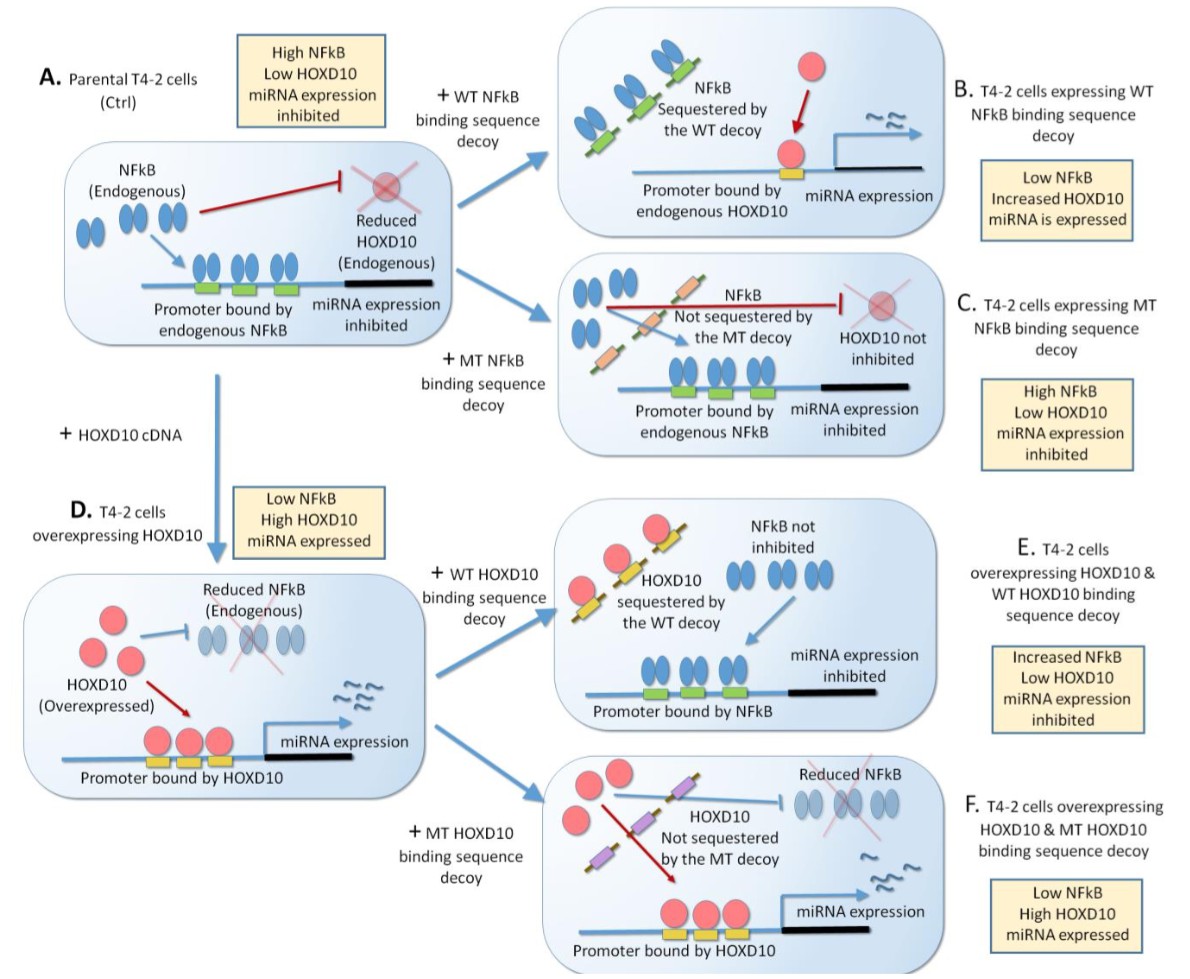
Scheme of expressing of NFkB or HOXD10 decoy that sequesters the transcription factor.
(A) Parental T4-2 cells have a high level of NFkB and low level of HOXD10. These two transcription factors are proposed to antagonize each other. Binding of NFkB to the miRNA promoter inhibits miRNA expression. (B) T4-2 cells will be transfected with the wild-type NFkB binding sequence decoy, which will sequester NFkB. This will inhibit NFkB binding to the miRNA promoter, but promote HOXD10 binding to the promoter, leading to miRNA expression. (C) In contrast, expression of the mutant NFkB binding sequence decoy will not sequester NFkB, and miRNA expression will remain inhibited. (D) T4-2 overexpressing HOXD10 cDNA promotes its binding to the miRNA promoter, elevating the expression of the miRNA. (E) T4-2 cells overexpressing HOXD10 will be transfected with the wild-type HOXD10 binding sequence decoy, which will sequester HOXD10. This will promote NFkB binding to the promoter and inhibits miRNA expression. (F) In contrast, expression of the mutant decoy in T4-2 cells overexpressing HOXD10 will not sequester HOXD10. HOXD10 will stay bind to the miRNA promoter, promoting miRNA expression.
Videos
Video 1
Representative movie of alveologenesis of normal human mammary gland organoids in ex vivo 3D culture for 2 weeks.
https://doi.org/10.7554/eLife.26148.028
Video 2
Representative movie of impaired alveologenesis of L-NAME-treated normal human mammary gland organoids in ex vivo 3D culture for 2 weeks.
https://doi.org/10.7554/eLife.26148.029
Video 3
Representative time-lapse movie of S1 cells undergoing coherent axial rotation in lrECM culture for 48 hr.
https://doi.org/10.7554/eLife.26148.030
Video 4
Representative time-lapse movie of L-NAME-treated S1 cells undergoing stochastic amoeboid movement in lrECM culture for 48 hr.
https://doi.org/10.7554/eLife.26148.031Tables
Table 1
List of 60 genes downregulated in T4-2 revertants to the level found in S1 but unmodulated in T4-2 cells in lrECM (p-value<0.05 was considered significant) (Rizki et al., 2008).
https://doi.org/10.7554/eLife.26148.007| Ensembl gene ID | Ensembl transcript ID | Gene name |
|---|---|---|
| ENSG00000107796 | ENST00000224784 | ACTA2 |
| ENSG00000109321 | ENST00000264487 | AREG |
| ENSG00000102606 | ENST00000317133 | ARHGEF7 |
| ENSG00000134107 | ENST00000256495 | BHLHB2 |
| ENSG00000101189 | ENST00000217161 | C20ORF20 |
| ENSG00000115009 | ENST00000358813 | CCL20 |
| ENSG00000161570 | ENST00000293272 | CCL5 |
| ENSG00000169583 | ENST00000224152 | CLIC3 |
| ENSG00000165959 | ENST00000298912 | CLMN |
| ENSG00000176390 | ENST00000324238 | CRLF3 |
| ENSG00000105246 | ENST00000221847 | EBI3 |
| ENSG00000163577 | ENST00000295822 | EIF5A2 |
| ENSG00000187266 | ENST00000222139 | EPOR |
| ENSG00000085832 | ENST00000262674 | EPS15 |
| ENSG00000124882 | ENST00000244869 | EREG |
| ENSG00000197930 | ENST00000359133 | ERO1L |
| ENSG00000149573 | ENST00000278937 | EVA1 |
| ENSG00000141524 | ENST00000322933 | EVER1 |
| ENSG00000185862 | ENST00000330927 | EVI2B |
| ENSG00000180263 | ENST00000343958 | FGD6 |
| ENSG00000088726 | ENST00000314124 | FLJ11036 |
| ENSG00000137312 | ENST00000259846 | FLOT1 |
| ENSG00000100031 | ENST00000248923 | GGT1 |
| ENSG00000149435 | ENST00000286890 | GGTLA4 |
| ENSG00000051620 | ENST00000058691 | HEBP2 |
| ENSG00000178922 | ENST00000326220 | HT036 |
| ENSG00000172183 | ENST00000306072 | ISG20 |
| ENSG00000105655 | ENST00000357050 | ISYNA1 |
| ENSG00000119698 | ENST00000304338 | KIAA1622 |
| ENSG00000134121 | ENST00000256509 | L1CAM |
| ENSG00000110492 | ENST00000359803 | MDK |
| ENSG00000146232 | ENST00000275015 | NFKBIE |
| ENSG00000008517 | ENST00000008180 | NK4 |
| ENSG00000157045 | ENST00000287706 | NTAN1 |
| ENSG00000135124 | ENST00000356268 | P2R × 4 |
| ENSG00000110218 | ENST00000227638 | PANX1 |
| ENSG00000145431 | ENST00000274071 | PDGFC |
| ENSG00000166289 | ENST00000299373 | PLEKHF1 |
| ENSG00000083444 | ENST00000196061 | PLOD |
| ENSG00000107758 | ENST00000342558 | PPP3CB |
| ENSG00000011304 | ENST00000350092 | PTBP1 |
| ENSG00000073756 | ENST00000186982 | PTGS2 |
| ENSG00000118508 | ENST00000237295 | RAB32 |
| ENSG00000013588 | ENST00000014914 | RAI3 |
| ENSG00000168501 | ENST00000307470 | RDBP |
| ENSG00000136643 | ENST00000259161 | RPS6KC1 |
| ENSG00000124788 | ENST00000244769 | SCA1 |
| ENSG00000181788 | ENST00000312960 | SIAH2 |
| ENSG00000136603 | ENST00000259119 | SKIL |
| ENSG00000173262 | ENST00000340749 | SLC2A14 |
| ENSG00000059804 | ENST00000075120 | SLC2A3 |
| ENSG00000160326 | ENST00000291725 | SLC2A6 |
| ENSG00000086300 | ENST00000338523 | SNX10 |
| ENSG00000061656 | ENST00000080856 | SPAG4 |
| ENSG00000141380 | ENST00000269137 | SS18 |
| ENSG00000198203 | ENST00000251481 | SULT1C1 |
| ENSG00000152284 | ENST00000282111 | TCF7L1 |
| ENSG00000035862 | ENST00000262768 | TIMP2 |
| ENSG00000125657 | ENST00000245817 | TNFSF9 |
| ENSG00000115652 | ENST00000283148 | UXS1 |
Table 2
List of 30 miRNAs that were upregulated in S1 and T4-2 revertants and downmodulated in T4-2 in lrECM (p-value<0.05 was considered significant).
https://doi.org/10.7554/eLife.26148.008| Mature ID | Fold regulation S1 vs T4-2 | Fold regulation T4 rev vs T4 | P value |
|---|---|---|---|
| miR-450b-5p | 30.3789 | 869.8262 | 0.049943 |
| miR-105 | 11.1967 | 783.9313 | 0.007486 |
| miR-383 | 52.5275 | 735.6709 | 0.042511 |
| miR-432 | 17.7736 | 541.6623 | 0.020574 |
| miR-495 | 455.6135 | 510.0813 | 0.004495 |
| miR-30e | 65.4581 | 228.7297 | 0.047957 |
| miR-190 | 48.2236 | 221.0022 | 0.044772 |
| miR-369–3 p | 14.1069 | 158.4536 | 0.041128 |
| miR-323–3 p | 13.8486 | 118.1588 | 0.015214 |
| miR-127–5 p | 10.5195 | 115.9948 | 0.005194 |
| miR-330–3 p | 39.2603 | 113.8705 | 0.044612 |
| miR-382 | 24.6754 | 82.0207 | 0.021385 |
| miR-337–3 p | 36.2104 | 35.2915 | 0.003663 |
| miR-423–3 p | 55.2984 | 32.9948 | 0.045694 |
| miR-125b | 48.925 | 29.9434 | 0.04939 |
| miR-376a | 212.9199 | 11.2032 | 0.049943 |
| miR-296–5 p | 42.5671 | 8.5618 | 0.045775 |
| miR-135a | 60.0253 | 7.5379 | 0.045617 |
| miR-144 | 1234.0342 | 7.3743 | 0.003973 |
| miR-301b | 32.1668 | 7.1892 | 0.043739 |
| miR-376c | 49.8377 | 6.2803 | 0.046834 |
| miR-487a | 68.5143 | 6.2243 | 0.035722 |
| miR-590–3 p | 14.4952 | 5.9622 | 0.035266 |
| miR-301a | 30.8564 | 5.4045 | 0.047854 |
| miR-98 | 33.6103 | 5.1012 | 0.041169 |
| miR-34c-5p | 31.215 | 4.8038 | 0.043702 |
| miR-496 | 42.8632 | 3.2108 | 0.044913 |
| miR-543 | 74.4569 | 2.897 | 0.01967 |
| miR-143 | 590.5164 | 2.2076 | 0.042274 |
| miR-374a | 11.1001 | 1.1926 | 0.013047 |
Table 3
List of 12 miRNAs that were upregulated in S1 and T4-2 revertants and downmodulated in T4-2, and that could target more than 10 genes among the 60 genes that showed the opposite expression patterns.
https://doi.org/10.7554/eLife.26148.009| Mature ID | Fold regulation T4 vs Control | Fold regulation T4 Rev vs T4 | p-value | # Targets / 60 genes | Gene locus | Type | |
|---|---|---|---|---|---|---|---|
| miR-450b-5p | −30.3789 | 869.8262 | 0.000304 | 15 | Xq26.3 | Intergenic | |
| miR-495 | −455.6135 | 510.0813 | 0.028964 | 12 | 14q32.31 | Intergenic | |
| miR-30e* | −65.4581 | 228.7297 | 0.008983 | 11 | 1p34.2 | Intronic | Down (p<0.05) |
| miR-330–3 p | −39.2603 | 113.8705 | 0.007481 | 22 | 19q13.32 | Intronic | |
| miR-382 | −24.6754 | 82.0207 | 0.001901 | 12 | 14q32.31 | Intergenic | |
| miR-423–3 p | −55.2984 | 32.9948 | 0.011304 | 14 | 17q11.2 | Intronic | |
| miR-135a | −60.0253 | 7.5379 | 0.039409 | 13 | 3p21.1 | Intergenic | |
| 12q23.1 | Intergenic | ||||||
| miR-144* | −1234.0342 | 7.3743 | 0.010599 | 12 | 17q11.2 | Intergenic | Down (p<0.05) |
| miR-301b | −32.1668 | 7.1892 | 0.028553 | 16 | 22q11.21 | Intergenic | |
| miR-590–3 p | −14.4952 | 5.9622 | 0.043351 | 21 | 7q11.23 | Intronic | |
| miR-301a | −30.8564 | 5.4045 | 0.044539 | 13 | 17q22 | Intronic | |
| miR-34c-5p* | −31.215 | 4.8038 | 0.01567 | 10 | 11q23.1 | Intergenic | Down (0 < 0.05) |
-
*The three miRNAs in bold that were the focus of this study.
†p-values were obtained from the array results [GSE2564] (Petersen et al., 1998).
Table 4
List of genes targeted by miR-34c-5p, miR-30e and miR-144 among the cluster of 60 genes that were downmodulated in S1 and T4-2 revertants and upregulated in T4-2.
https://doi.org/10.7554/eLife.26148.013| miR-144 (12 targets) | miR-30e (11 targets) | mir-34c-5p (10 targets) |
|---|---|---|
| AREG | ||
| BHLHB2 | ||
| C20ORF20 | ||
| CCL20 | ||
| EIF5A2 | EIF5A2 | EIF5A2 |
| EREG | ||
| ERO1L | ERO1L | |
| FGD6 | ||
| ISG20 | ||
| NK4 | ||
| KIAA1622 | ||
| L1CAM | L1CAM | |
| PTBP1 | ||
| PTGS2 | PTGS2 | |
| RDBP | RDBP | |
| SCA1 (ATXN1) | SCA1 (ATXN1) | SCA1 (ATXN1) |
| SIAH2 | SIAH2 | |
| SLC2A14 | ||
| SLC2A3 | ||
| SNX10 | SNX10 | |
| SS18 | SS18 | |
| TIMP2 |
Table 5
Predicted binding sites of three miRNAs at 3′UTR of SCA1 and EIF5A2.
https://doi.org/10.7554/eLife.26148.014| miRNA | Seed | miRNA binding site in 3′UTR of mRNA |
|---|---|---|
| SCA1 | ||
| hsa-miR-34c | GGCAGUG | 691, 913, 6461 |
| hsa-miR-30e | GUAAACA | 3588, 4308, 4603, 4770, 5440, 6092, 6233 |
| hsa-miR-144 | GAUAUCA | 47, 987, 1113, 1160, 4557, 5426, 6267 |
| EIF5A2 | ||
| hsa-miR-34c | GGCAGUG | 297, 802, 2656 |
| hsa-miR-30e | GUAAACA | 3264, 3312, 3525, 3652, 3643, 4113 |
| hsa-miR-144 | GAUAUCA | 2642, 2742, 2977, 4123, 4541, 4570 |
Table 6
miRNA promoter regions harboring binding sites of TFs, NFκB (p65) and HOXD10.
https://doi.org/10.7554/eLife.26148.017| Frequency (random expectancy x 10–3) | |||||||
|---|---|---|---|---|---|---|---|
| miRNA promoter | TXN bound | Start nt from TSS | End nt from TSS | String | Dissimilarity (%) | Equally | Query |
| miR-34c | RelA | −787 | −778 | AGGGAATCAA | 14 | 1 × 10⁻⁵ | 1 × 10⁻⁵ |
| −769 | −760 | TGGGAAGTTT | 11 | 3 × 10⁻⁵ | 5 × 10⁻⁵ | ||
| −427 | −418 | TGGGAACCTT | 11 | 4 × 10⁻⁵ | 3 × 10⁻⁵ | ||
| −64 | −55 | TGGGAAGCCG | 13 | 4 × 10⁻⁵ | 4 × 10⁻⁵ | ||
| −56 | −47 | CGCTTTCCCA | 12 | 5 × 10⁻⁵ | 4 × 10⁻⁵ | ||
| -3 | 6 | GGGGAATGAG | 13 | 3 × 10⁻⁵ | 3 × 10⁻⁵ | ||
| HOXD10 | −864 | −855 | AGTTTGTATT | 10 | 1 × 10⁻⁴ | 2 × 10⁻⁴ | |
| −385 | −376 | CCCTTCTATT | 12 | 3 × 10⁻⁵ | 4 × 10⁻⁵ | ||
| miR-30e | RelA | −2888 | −2879 | GATATTCCCA | 2 | 6 × 10⁻⁶ | 5 × 10⁻⁶ |
| HOXD10 | −2553 | −2544 | TGGTTGTATT | 10 | 1 × 10⁻⁴ | 2 × 10⁻⁴ | |
| −2230 | −2221 | GCGTGATATT | 11 | 1 × 10⁻⁴ | 1 × 10⁻⁴ | ||
| −2122 | −2113 | TTTTTTTATT | 4 | 1 × 10⁻⁵ | 4 × 10⁻⁵ | ||
| −1967 | −1967 | TACTCATATT | 9 | 1 × 10⁻⁴ | 2 × 10⁻⁴ | ||
| miR-144 | RelA | −3207 | −3198 | AGGGAATTTG | 10 | 5 × 10⁻⁵ | 5 × 10⁻⁵ |
| HOXD10 | −2850 | −2841 | AATAGAATGA | 10 | 1 × 10⁻⁴ | 2 × 10⁻⁴ | |
| −2715 | −2706 | AATACAAAAA | 10 | 1 × 10⁻⁴ | 2 × 10⁻⁴ | ||
| −2412 | −2403 | CCATATTATT | 11 | 1 × 10⁻⁴ | 1 × 10⁻⁴ | ||
| −2336 | −2327 | AATAAGAGTA | 7 | 5 × 10⁻⁵ | 7 × 10⁻⁵ | ||
| −2312 | −2303 | ATTTATTATT | 10 | 1 × 10⁻⁴ | 2 × 10⁻⁴ | ||
Table 7
Decoy sequences of NFκB and HOXD10 for each miRNA promoter.
https://doi.org/10.7554/eLife.26148.018| miRNA promoter | TXN bound | Start from TSS | End from TSS | Predicted binding sequence | Wt decoy sequence (5′ → 3′) (Ds DNA) | Mt decoy sequence (5′→ 3′) (Ds DNA) | Transfected T4-2 cells | ||
|---|---|---|---|---|---|---|---|---|---|
| Scramble | F | TTGCCGTACCTGACTTAGCC | |||||||
| R | GGCTAAGTCAGGTACGGCAA | ||||||||
| miR-34c | NFκB | −787 | −778 | AGGGAATCAA | F | CCTTGAAAGGGAATCAATCC | F | CCTTGAAAtGtAcTaAcTCC | Ctrl (pDCF1) |
| R | GGATTGATTCCCTTTCAAGG | R | GGAgTtAgTaCaTTTCAAGG | ||||||
| −769 | −760 | TGGGAAGTTT | F | CCTTGAATGGGAAGTTTTCC | F | CCTTGAATtGtAcGgTgTCC | Ctrl (pCDF1) | ||
| R | GGAAAACTTCCCATTCAAGG | R | GGAcAcCgTaCaATTCAAGG | ||||||
| −427 | −418 | TGGGAACCTT | F | CCTTGAATGGGAACCTTTCC | F | CCTTGAATtGtAcCaTgTCC | Ctrl (pCDF1) | ||
| R | GGAAAGGTTCCCATTCAAGG | R | GGAcAtGgTaCaATTCAAGG | ||||||
| −64 | −55 | TGGGAAGCCG | F | CCTTGAATGGGAAGCCGTCC | F | CCTTGAATtGtAcGaCtTCC | Ctrl (pCDF1) | ||
| R | GGACGGCTTCCCATTCAAGG | R | GGAAGtCgTaCaATTCAAGG | ||||||
| −56 | −47 | CGCTTTCCCA | F | CCTTGAACGCTTTCCCATCC | F | CCTTGAACtCgTgCaCcTCC | Ctrl (pCDF1) | ||
| R | GGATGGGAAAGCGTTCAAGG | R | GGAgGtGcAcGaGTTCAAGG | ||||||
| -3 | 6 | GGGGAATGAG | F | CCTTGAAGGGGAATGAGTCC | F | CCTTGAAGtGtAcTtAtTCC | HOXD10/pCDF1 | ||
| R | GGACTCATTCCCCTTCAAGG | R | GGAaTaAgTaCaCTTCAAGG | ||||||
| HOXD10 | −864 | −855 | AGTTTGTATT | F | CCTTGAAAGTTTGTATTTCC | F | CCTTGAAAtTgTtTcTgTCC | HOXD10/pCDF1 | |
| R | GGAAATACAAACTTTCAAGG | R | GGAcAgAaAcAaTTTCAAGG | ||||||
| −385 | −376 | CCCTTCTATT | F | CCTTGAACCCTTCTATTTCC | F | CCTTGAACaCgTaTcTgTCC | HOXD10/pCDF1 | ||
| R | GGAAATAGAAGGGTTCAAGG | R | GGAcAgAtAcGtGTTCAAGG | ||||||
| miR-30e | NFκB | −2888 | −2879 | GATATTCCCA | F | CCTTGAAGATATTCCCATCC | F | CCTTGAAGcTcTgCaCcTCC | Ctrl (pCDF1) |
| R | GGATGGGAATATCTTCAAGG | R | GGAgGtGcAgAgCTTCAAGG | ||||||
| HOXD10 | −2553 | −2544 | TGGTTGTATT | F | CCTTGAATGGTTGTATTTCC | F | CCTTGAATtGgTtTcTgTCC | HOXD10/pCDF1 | |
| R | GGAAATACAACCATTCAAGG | R | GGAcAgAaAcCaATTCAAGG | ||||||
| −2230 | −2221 | GCGTGATATT | F | CCTTGAAGCGTGATATTTCC | F | CCTTGAAGaGgGcTcTgTCC | HOXD10/pCDF1 | ||
| R | GGAAATATCACGCTTCAAGG | R | GGAcAgAgCcCtCTTCAAGG | ||||||
| −2122 | −2113 | TTTTTTTATT | F | CCT TGAATTTTTTTATTTCC | F | CCTTGAATgTgTgTcTgTCC | HOXD10/pCDF1 | ||
| R | GGAAATAAAAAAATTCAAGG | R | GGAcAgAcAcAcATTCAAGG | ||||||
| −1967 | −1967 | TACTCATATT | F | CCTTGAATACTCATATTTCC | F | CCTTGAATcCgCcTcTgTCC | HOXD10/pCDF1 | ||
| R | GGAAATATGAGTATTCAAGG | R | GGAcAgAgGcGgATTCAAGG | ||||||
| miR-144 | NFκB | −3207 | −3198 | AGGGAATTTG | F | CCTTGAAAGGGAATTTGTCC | F | CCTTGAAAtGtAcTgTtTCC | Ctrl (pCDF1) |
| R | GGACAAATTCCCTTTCAAGG | R | GGAaAcAgTaCaTTTCAAGG | ||||||
| HOXD10 | −2850 | −2841 | AATAGAATGA | F | CCTTGAAAATAGAATGATCC | F | CCTTGAAAcTcGcAgGcTCC | HOXD10/pCDF1 | |
| R | GGATCATTCTATTTTCAAGG | R | GGAgCcTgCgAgTTTCAAGG | ||||||
| −2715 | −2706 | AATACAAAAA | F | CCTTGAAAATACAAAAATCC | F | CCTTGAAAcTcCcAcAcTCC | HOXD10/pCDF1 | ||
| R | GGATTTTTGTATTTTCAAGG | R | GGAgTgTgGgAgTTTCAAGG | ||||||
| −2412 | −2403 | CCATATTATT | F | CCTTGAACCATATTATTTCC | F | CCTTGAACaAgAgTcTgTCC | HOXD10/pCDF1 | ||
| R | GGAAATAATATGGTTCAAGG | R | GGAcAgAcTcTtGTTCAAGG | ||||||
| −2336 | −2327 | AATAAGAGTA | F | CCTTGAAAATAAGAGTATCC | F | CCTTGAAAcTcAtAtTcTCC | HOXD10/pCDF1 | ||
| R | GGATACTCTTATTTTCAAGG | R | GGAgAaTaTgAgTTTCAAGG | ||||||
| −2312 | −2303 | ATTTATTATT | F | CCTTGAAATTTATTATTTCC | F | CCTTGAAAgTgAgTcTgTCC | HOXD10/pCDF1 | ||
| R | GGAAATAATAAATTTCAAGG | R | GGAcAgAcTcAcTTTCAAGG | ||||||
-
Note: the transcription factor binding sites are underlined, whereas mutated nucleotides are indicated in lower case.
Table 8
LAMA3 promoter regions harboring binding sites of p53.
https://doi.org/10.7554/eLife.26148.034| Frequency (random expectancy x 10–3) | |||||||
|---|---|---|---|---|---|---|---|
| Promoter | TXN bound | Start nt from TSS | End nt from TSS | String | Dissimilarity (%) | Equally | Query |
| LAMA3 | p53 | −4245 | −4239 | TGAGCCC | 8.8 | 2 × 10⁻³ | 2 × 10⁻³ |
| −4143 | −4137 | GGGCAGA | 1.7 | 9 × 10⁻⁴ | 8 × 10⁻⁴ | ||
| −4063 | −4057 | TCTGCCC | 1.7 | 9 × 10⁻⁴ | 8 × 10⁻⁴ | ||
| −3597 | −3591 | GGTGCCC | 4 | 1 × 10⁻³ | 1 × 10⁻³ | ||
| −3585 | −3579 | CACGCCC | 3.3 | 1 × 10⁻³ | 1 × 10⁻³ | ||
| −3451 | −3445 | GGCGCCC | 7.4 | 1 × 10⁻³ | 1 × 10⁻³ | ||
| 813 | 819 | ACTGCCC | 3.5 | 1 × 10⁻³ | 1 × 10⁻³ | ||
| −4547 | −4541 | CTTGCCC | 0.2 | 9 × 10⁻⁴ | 7 × 10⁻⁴ | ||
| −3094 | −3088 | TGAGCC | 6.7 | 2 × 10⁻³ | 2 × 10⁻³ | ||
| −2804 | −2798 | CACGCCC | 3.3 | 1 × 10⁻³ | 1 × 10⁻³ | ||
| −2718 | −2712 | TCTGCCC | 1.7 | 9 × 10⁻⁴ | 8 × 10⁻⁴ | ||
| −2347 | −2341 | CCAGCCC | 3.7 | 1 × 10⁻³ | 1 × 10⁻³ | ||
| −2328 | −2322 | GGGCTCT | 8.5 | 3 × 10⁻⁴ | 2 × 10⁻⁴ | ||
| −1914 | −1908 | GTCGCCC | 6.4 | 1 × 10⁻³ | 1 × 10⁻³ | ||
| −1798 | −1792 | ACCGCCC | 6.8 | 2 × 10⁻³ | 2 × 10⁻³ | ||
| −948 | −942 | GTCGCCC | 6.4 | 1 × 10⁻³ | 9 × 10⁻⁴ | ||
| −437 | −431 | TCTGCCC | 1.7 | 9 × 10⁻⁴ | 8 × 10⁻⁴ | ||
| −420 | −414 | GGGCGGC | 6.1 | 1 × 10⁻³ | 1 × 10⁻³ | ||
| −374 | −368 | GGGCGGC | 3.5 | 1 × 10⁻³ | 1 × 10⁻³ | ||
| −355 | −349 | GGGCGCG | 4.6 | 6 × 10⁻⁴ | 4 × 10⁻⁴ | ||
| −342 | −336 | CTGGCCC | 4.3 | 6 × 10⁻⁴ | 4 × 10⁻⁴ | ||
| −325 | −319 | GGGCCGC | 6.9 | 2 × 10⁻³ | 2 × 10⁻³ | ||
| −314 | −308 | GGGCGGG | 3.3 | 1 × 10⁻³ | 1 × 10⁻³ | ||
| −310 | −304 | GGGCAGG | 0 | 9 × 10⁻⁴ | 7 × 10⁻⁴ | ||
| −296 | −290 | GGGCACA | 3 | 1 × 10⁻³ | 1 × 10⁻³ | ||
| −256 | −250 | GCAGCCC | 6.5 | 1 × 10⁻³ | 9 × 10⁻⁴ | ||
| −236 | −230 | TCAGCCC | 5.5 | 1 × 10⁻³ | 1 × 10⁻³ | ||
| −223 | −217 | TCTGCCC | 1.7 | 9 × 10⁻⁴ | 8 × 10⁻⁴ | ||
| −183 | −177 | TCAGCCC | 5.5 | 1 × 10⁻³ | 1 × 10⁻³ | ||
| −1127 | −1121 | GGGCGCC | 7.4 | 1 × 10⁻³ | 1 × 10⁻³ | ||
| −126 | −120 | GGCGCCC | 7.4 | 1 × 10⁻³ | 1 × 10⁻³ | ||
| −96 | −90 | GGGCCAA | 6 | 1 × 10⁻³ | 1 × 10⁻³ | ||
| −85 | −79 | GGGCGGG | 3.3 | 1 × 10⁻³ | 1 × 10⁻³ | ||
| −75 | −69 | GGGCGGG | 3.3 | 1 × 10⁻³ | 1 × 10⁻³ | ||
| −70 | −64 | GGGCGGG | 3.3 | 1 × 10⁻³ | 1 × 10⁻³ | ||
| −65 | −59 | GGGCGCA | 6.4 | 1 × 10⁻³ | 1 × 10⁻³ | ||
| −40 | −34 | GGGCGGC | 6.1 | 1 × 10⁻³ | 1 × 10⁻³ | ||
| −24 | −18 | GGGCGGC | 6.1 | 1 × 10⁻³ | 1 × 10⁻³ | ||
| 1 | 7 | GGGCCAG | 4.3 | 6 × 10⁻⁴ | 4 × 10⁻⁴ | ||
| 7 | 13 | GGGCAGC | 2.8 | 1 × 10⁻³ | 1 × 10⁻³ | ||
| 45 | 51 | GGGCGCG | 4.6 | 6 × 10⁻⁴ | 4 × 10⁻⁴ | ||
| 101 | 107 | GGGCGTG | 3.3 | 1 × 10⁻³ | 1 × 10⁻³ | ||
| 155 | 161 | TGAGCCC | 6.7 | 2 × 10⁻³ | 2 × 10⁻³ | ||
| 160 | 166 | CCGGCCC | 4.1 | 1 × 10⁻³ | 1 × 10⁻³ | ||
| 216 | 222 | GGGCGGG | 3.3 | 1 × 10⁻³ | 1 × 10⁻³ | ||
| 200 | 206 | GGGCGGG | 3.3 | 1 × 10⁻³ | 1 × 10⁻³ | ||
| 206 | 212 | GGGCGGC | 6.1 | 1 × 10⁻³ | 1 × 10⁻³ | ||
| 220 | 226 | AAAGCCC | 7.2 | 1 × 10⁻³ | 1 × 10⁻³ | ||
| 236 | 242 | GGGCTGC | 6.5 | 1 × 10⁻³ | 1 × 10⁻³ | ||
| 251 | 257 | GGGCGCG | 4.6 | 6 × 10⁻⁴ | 4 × 10⁻⁴ | ||
Table 9
List of oligonucleotide sequences of molecules listed in the manuscript.
https://doi.org/10.7554/eLife.26148.036| Northern probes | |
|---|---|
| miR-450b-5p | 5′-TAT TCA GGA ACA TAT TGC AAA A-3′ |
| miR-495 | 5′-AAG AAG TGC ACC ATG TTT GTT T-3′ |
| miR-30e | 5′-CTT CCA GTC AAG GAT GTT TAC A-3′ |
| miR-330–3 p | 5′-TCT CTG CAG GCC GTG TGC TTT GC-3′ |
| miR-382 | 5′-CGA ATC CAC CAC GAA CAA CTT C-3′ |
| miR-423–3 p | 5′-ACT GAG GGG CCT CAG ACC GAG CT-3′ |
| miR-135a | 5′-TCA CAT AGG AAT AAA AAG CCA TA-3′ |
| miR-144 | 5′-AGT ACA TCA TCT ATA CTG TA-3′ |
| miR-301b | 5′-GCT TTG ACA ATA TCA TTG CAC TG-3′ |
| miR-590–3 p | 5′-ACT AGC TTA TAC ATA AAA TTA-3′ |
| miR-301a | 5′-GCT TTG ACA ATA CTA TTG CAC TG-3′ |
| miR-34c-5p | 5′-GCA ATC AGC TAA CTA CAC TGC CT-3′ |
| RT-PCR | |
| EIF5A2 | |
| FW | 5′-ATG GCA GAC GAA ATT GAT TTC ACT A-3′ |
| RV | 5′-CTC ATT GCA CAC ATG ACA GAC-3′ |
| SCA1 | |
| FW | 5′-ACG GTC ATT CAG ACC ACA CA-3′ |
| RV | 5′-CAG GGT TGA AGT TCT CGC TC-3′ |
| ITGB1 | |
| FW | 5′-CGC CGC GCG GAA AAG ATG AAT-3′ |
| RV | 5′-TGG GCT GGT GCA GTT CTG TTC A-3′ |
| c-RAF | |
| FW | 5′-CGA CCC ACA GTG GAC GAT CCA G-3′ |
| RV | 5′-AGA TAA TGC TGG CCG ACT GGC CT-3′ |
| MEK1 | |
| FW | 5′-AAG GGA ATC CCG GGC TGC CGA A-3′ |
| RV | 5′-GCC ATC GCT GTA GAA CGC ACC A-3′ |
| MAPK | |
| FW | 5′-GCA CCG TGA CCT CAA GCC TTC-3′ |
| RV | 5′-CAC CGA TGT CTG AGC ACG TCC AG-3′ |
| LAMA3 | |
| FW 5′-GAT GGC TCA GGC ATA TGT GTT-3′ | |
| RV 5′-CTG GCC ATT GCT GTT ACA ACT-3′ | |
| TUBA | |
| FW | 5′-TGA CCT GAC AGA ATT CCA GAC CA-3′ |
| RV | 5′-GCA TTG ACA TCT TTG GGA ACC AC-3′ |
| shRNA (target sequence underlined; BamH1/EcoR1 cohesive ends italicized) | |
| EIF5A2sh | |
| Sense | 5′-GAT CCG CTG CCA GAA GGT GAA CTA GCT TCC TGT CAG ATA TAT CTC TCC TTC CAC ACT TTT TG-3′ |
| Antisense | 5′-AAT TCA AAA ACT GCC AGA AGG TGA ACT AGT CTG ACA GGA AGT ATA TCT CTC CTT CCA CAC G-3′ |
| ScaIsh | |
| Sense | 5′-GAT CCG AAC CTG AAG AAC GGC TCT CTT CCT GTC AGA AGA GCC GTT CTT CAG GTT CTT TTT G-3′ |
| Antisense | 5′-AAT TCA AAA AGA ACC TGA AGA ACG GCT CTT CTG ACA GGA AGA GAG CCG TTC TTC AGG TTC G-3′ |
| p65sh | |
| Sense | 5′-GAT CCG GAC ATA TGA GAC CTT CAA CTT CCT GTC AGA TTG AAG GTC TCA TAT GTC CTT TTT G-3′ |
| Antisense | 5′-AAT TCA AAA AGG ACA TAT GAG ACC TTC AAT CTG ACA GGA AGT TGA AGG TCT CAT ATG TCC G-3′ |
| p50/p100sh | |
| Sense | 5′-GAT CCG AGC TAA TCC GCC AAG CAG CTT CCT GTC AGA CTG CTT GGC GGA TTA GCT CTT TTT G-3′ |
| Antisense | 5′-AAT TCA AAA AGA GCT AAT CCG CCA AGC AGT CTG ACA GGA AGC TGC TTG GCG GAT TAG CTC G-3′ |
| LAMA3sh | |
| Sense | 5′-GAT CCG GAG TCC TTC TGG ATT ACC CTT CCT GTC AGA GGT AAT CCA GAA GGA CTC CTT TTT G-3′ |
| Antisense | 5′-AAT TCA AAA AGG AGT CCT TCT GGA TTA CCT CTG ACA GGA AGG GTA ATC CAG AAG GAC TCC G-3′ |
| Overexpressing constructs | |
| HOXD10 | |
| FW | 5′-CGG CAG GCG CGC CGC CAC CAT GTC CTT TCC CAA CAG CTC TCC T-3′ (AscI site italicized) |
| RV | 5′-CCG GCC GAA TTC CTA AGA AAA CGT GAG GTT GGC GGT CAG-3′ (EcoR1 site italicized) |
| p53 | |
| FW | 5’-GAT CTC GGA TCC GCC ACC ATG GAG GAG CCG CAG TCA GAT CCT AGC-3’ (BamH1 site italicized) |
| RV | 5′-TAC AGG AAT TCT CAG TCT GAG TCA GGC CCT TCT GTC TTG AAC ATG-3′ (EcoR1 site italicized) |
| ATXN1 and EIF5A2 | |
| FW | 5′-TCT AGA GCC CGG GCG CGC CGG CCG CCG CGA TCG CCA TG-3′ |
| RV | 5-’′GCA GAT CCT TCG CGG CCG CGT TAA ACC TTA TCG TCG TCA TCC TTG TAA TCC AGG ATA TCA TTT GC-3′ |
| miRNA reporter constructs (Mlu1/Xho1 sites italicized) | |
| miR-34c | |
| 3–0 kb | |
| FW | 5′-GAC TAC GCG TAC CGC TGG CAG TTC ATT TTA GCT C-3′ (Mlu1 site italicized) |
| RV | 5′-GAC TCT CGA GCT AGA AGA TGG AGG CCC AGA TTC TTG AGA C-3′ (Xho1 site italicized) |
| 2–0 kb | |
| FW | 5′-GAC TAC GCG TCT TGG CTT CCT CCT AGT CAT CAA CCT-3′ (Mlu1 site italicized) |
| RV | 5′-GAC TCT CGA GTC TGA TCT AGC AGG AGG GAC AAA GAG-3′ (Xho1 site italicized) |
| 1–0 kb | |
| FW | 5′-GAC TAC GCG TTC CCT TCA CTA TGG GGT GTA CAG AAC-3′ (Mlu1 site italicized) |
| RV | 5′-GAC TCT CGA GCT AGA AGA TGG AGG CCC AGA TTC TTG AGA C-3′ (Xho1 site italicized) |
| 3–2 kb | |
| FW | 5′-GAC TAC GCG TTT ATA AAA ACC GCT GGC AGT TCA TTT TAG C-3′ (Mlu1 site italicized) |
| RV | 5′-GAC TCT CGA GAG GAG GAA GCC AAG AAG AGT GTA GAA AAC A-3′ (Xho1 site italicized) |
| 2–1 kb | |
| FW | 5′-GAC TAC GCG TCT ATT CTC CCA CCT CAG CC TCC AAG TAG-3′ (Mlu1 site italicized) |
| RV | 5′-GAC TCT CGA GCT GTA CAC CCC ATA GTG AAG GGA AAG AAA C-3′ (Xho1 site italicized) |
| miR-30e | |
| 3–0 kb | |
| FW | 5′-GAC TAC GCG TGC CAC CAT GCC CGG CTA A-3′ (Mlu1 site italicized) |
| RV | 5′-GAC TCT CGA GGG GAG CTC GAG ATC TGA GTT TTG ACC-3′ (Xho1 site italicized) |
| 2–0 kb | |
| FW | 5′-GAC TAC GCG TCT GGT CTT GAA CTC CTG ACC TCG TCA T-3′ (Mlu1 site italicized) |
| RV | 5′-GAC TCT CGA GTT CGG GAG CTC GAG ATC TGA GTT TTG-3′ (Xho1 site italicized) |
| 1–0 kb | |
| FW | 5′-GAC TAC GCG TTT AGA TCT GGG TAC AGA TGA AGG AAT TGA GAC TCC-3′ (Mlu1 site italicized) |
| RV | 5′-GAC TCT CGA GTT CGG GAG CTC GAG ATC TGA TGG TTG-3′ (Xho1 site italicized) |
| 3–2 kb | |
| FW | 5′-GAC TAC GCG TCT TTT TGA ACT CCA GCA GCA CAT GAA CTA T-3′ (Mlu1 site italicized) |
| RV | 5′-GAC TCT CGA GGG CCT TGT TTT GAC CAA TGA AAT ATG AGT A-3′ (Xho1 site italicized) |
| 2–1 kb | |
| FW | 5′-GAC TAC GCG TCT GGT CTT GAA CTC CTG ACC TCG TCA T-3′ (Mlu1 site italicized) |
| RV | 5′-GAC TCT CGA GAC ACT TGA CTT CAG GGA GTC TCA ATT CCT T-3′ (Xho1 site italicized) |
| miR-144 | |
| 3–0 kb | |
| FW | 5′-GAC TAC GCG TCT CAC TAT AAG ACT CGG GCC AAG CAC TTC-3′ (Mlu1 site italicized) |
| RV | 5′-GAC TCT CGA GGC CAG TTG TGG TGG CAT GTG-3′ (Xho1 site italicized) |
| 2–0 kb | |
| FW | 5′-GAC TAC GCG TGT TGC CCA GGC TGG AGT ACA ATA GGA T-3′ (Mlu1 site italicized) |
| RV | 5′-GAC TCT CGA GAA TTA GCC AGT TGT GGT GGC ATG TG-3′ (Xho1 site italicized) |
| 1–0 kb | |
| FW | 5′-GAC TAC GCG TGT ACT GGG GAG GCA GAG GAA TGG AAG-3′ (Mlu1 site italicized) |
| RV | 5′-GAC TCT CGA GAA TTA GCC AGT TGT GGT GGC ATG TG-3′ (Xho1 site italicized) |
| 3–2 kb | |
| FW | 5′-GAC TAC GCG TCC TAT TCC TAG CGG GTT TGT GCA TAG AG-3′ (Mlu1 site italicized) |
| RV | 5′-GAC TAG ATC TCT GGG CAA CAA GAG CAA AAC TGG ATC-3′ (Bgl1I site italicized) |
| 2–1 kb | |
| FW | 5′-GAC TAC GCG TCC CAG GCT GGA GTA CAA TAG GAT GAT CT-3′ (Mlu1 site italicized) |
| RV | 5′-GAC TCT CGA GGC CCA GGG CTG TTT TCC TGG ATA TT-3′ (Xho1 site italicized) |
| ChIP | |
| miR-34c (−1~0 kb) | |
| FW | 5′-GTG TCA GCA ATG GGT GCT CTA-3′ |
| RV | 5′-CCA GAG GAG GTG AGA CTT GAG-3′ |
| miR-30e (−3~−2 kb) | |
| FW | 5′-GAG GCA GTC TGA GAT ATT CCC-3′ |
| RV | 5′-CTG CAG CAT AAC ATG CTA GCT-3′ |
| miR-144 (−3~−2 kb) | |
| FW | 5′-CTG TGA TGA GGA CAA CAG TAA-3′ |
| RV | 5′-ATC CCC CTA CCT CAG CCT CTC-3′ |
Additional files
-
Transparent reporting form
- https://doi.org/10.7554/eLife.26148.037
Download links
A two-part list of links to download the article, or parts of the article, in various formats.
Downloads (link to download the article as PDF)
Open citations (links to open the citations from this article in various online reference manager services)
Cite this article (links to download the citations from this article in formats compatible with various reference manager tools)
Laminin signals initiate the reciprocal loop that informs breast-specific gene expression and homeostasis by activating NO, p53 and microRNAs
eLife 7:e26148.
https://doi.org/10.7554/eLife.26148


