Exophilin-8 assembles secretory granules for exocytosis in the actin cortex via interaction with RIM-BP2 and myosin-VIIa
- Institute for Molecular and Cellular Regulation, Gunma University, Japan
- RIKEN Center for Life Science Technologies, Japan
- Gunma University Initiative for Advanced Research, Japan
Figures
Figure 1 with 1 supplement
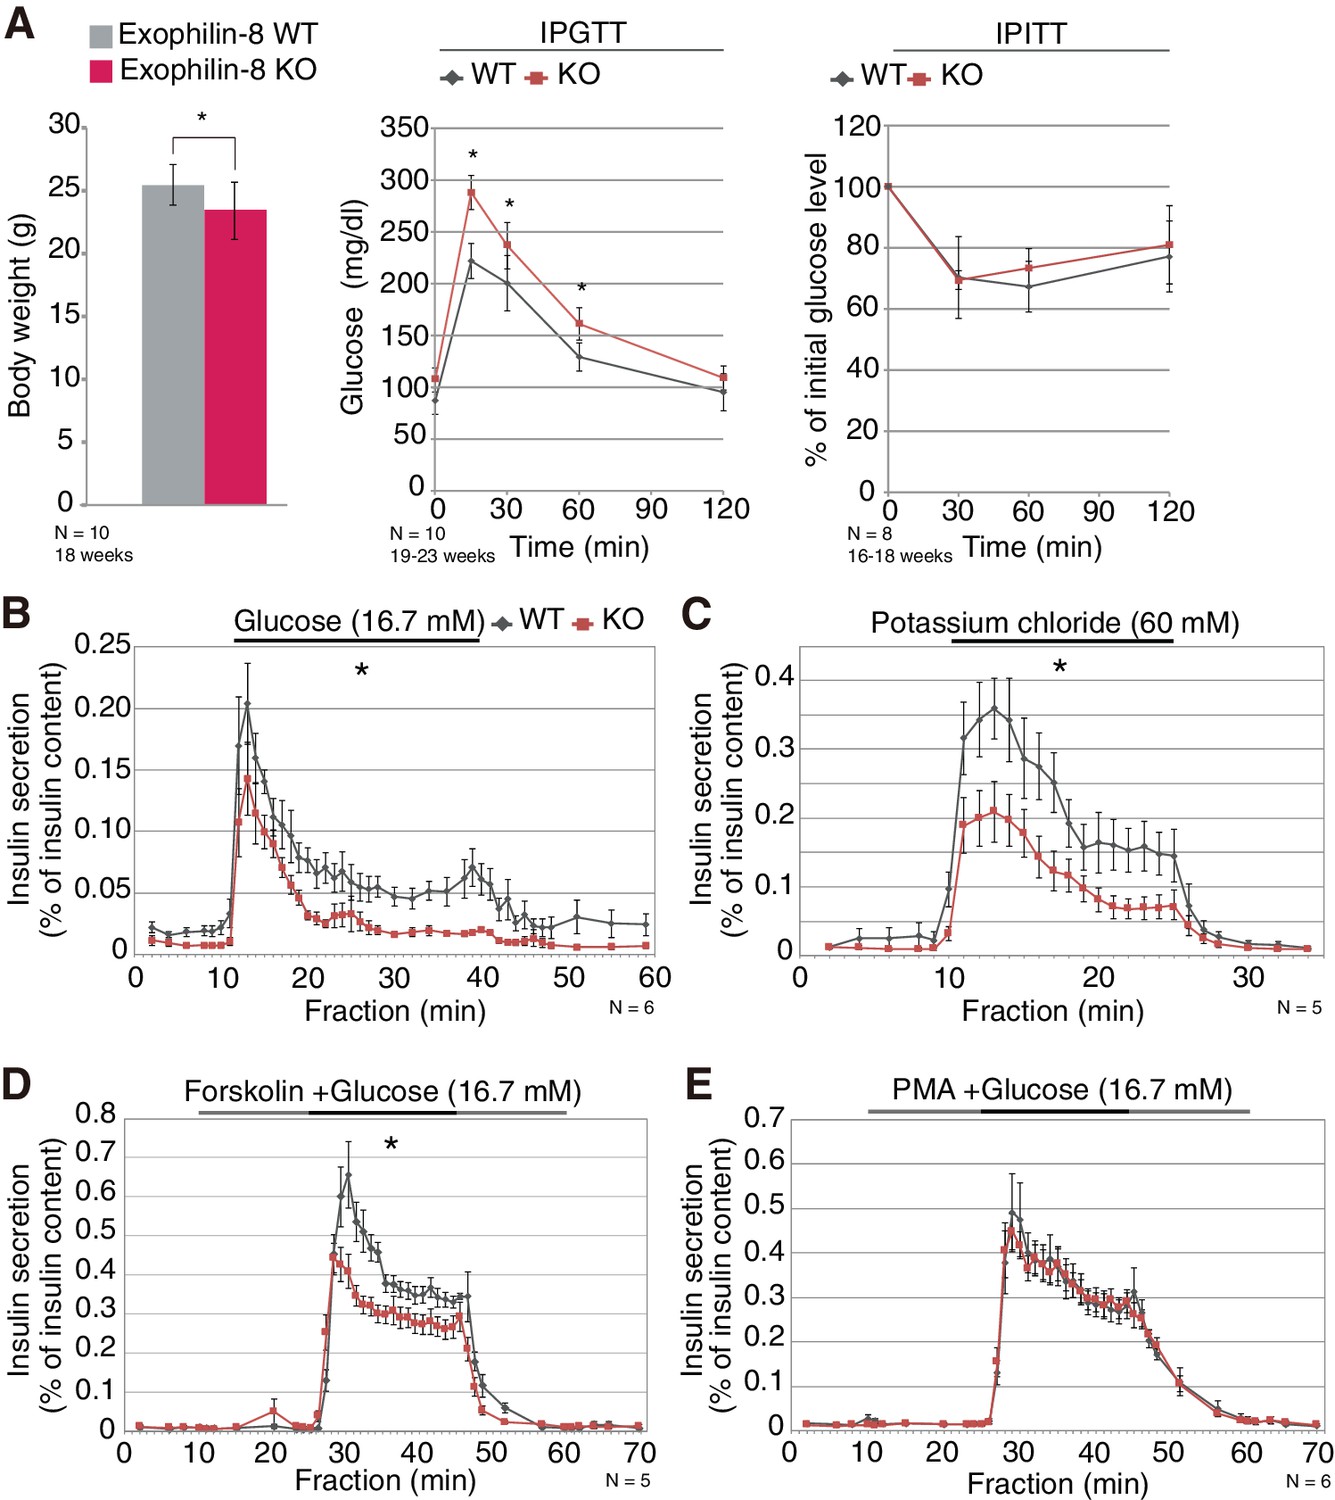
Phenotypes of exophilin-8 null mice.
(A) In vivo phenotypes of exophilin-8-knockout (KO) mice. Each measurement was performed in age-matched, wild-type (WT; gray bars and diamonds) and KO (red bars and squares) male mice: body weight (left; 18-weeks-old, n = 10); blood glucose concentrations during an intraperitoneal glucose tolerance test (IPGTT; middle; 19- to 23-week-old, n = 10); and percentage of starting blood glucose concentration during an intraperitoneal insulin tolerance test (IPITT; right; 16- to 18-weesk-old, n = 8). (B–E) Islets isolated from age-matched (16- to 25-week-old) WT or KO male mice (n = 6 for B and E, n = 5 for C and D) were stimulated by 16.7 mM glucose for 30 min (B), 60 mM KCl for 15 min (C), or 16.7 mM glucose for 20 min (horizontal black line) in the continuous presence of either 10 μM forskolin (D) or 0.5 μM PMA (E) (horizontal black and gray lines). They were then perifused with buffer containing 2.8 mM glucose. The amount of insulin secreted into each fraction was normalized by insulin content remaining in the cells, although the latter values were not significantly different between WT and KO islets. The area under the curve during stimulation was measured. Data are means ± SEM. *p values calculated using two-tailed unpaired t-test are 0.031 (A, body weight), 0.0027 (A, IPGTT 0 min), 3.0 × 10⁻⁷ (A, IPGTT 15 min), 6.6 × 10⁻³ (A, IPGTT 30 min), 2.8 × 10⁻⁴ (A, IPGTT 60 min), 7.7 × 10⁻³ (B), 3.1 × 10⁻³ (C), and 3.3 × 10⁻⁴ (D), respectively.
Figure 1—figure supplement 1
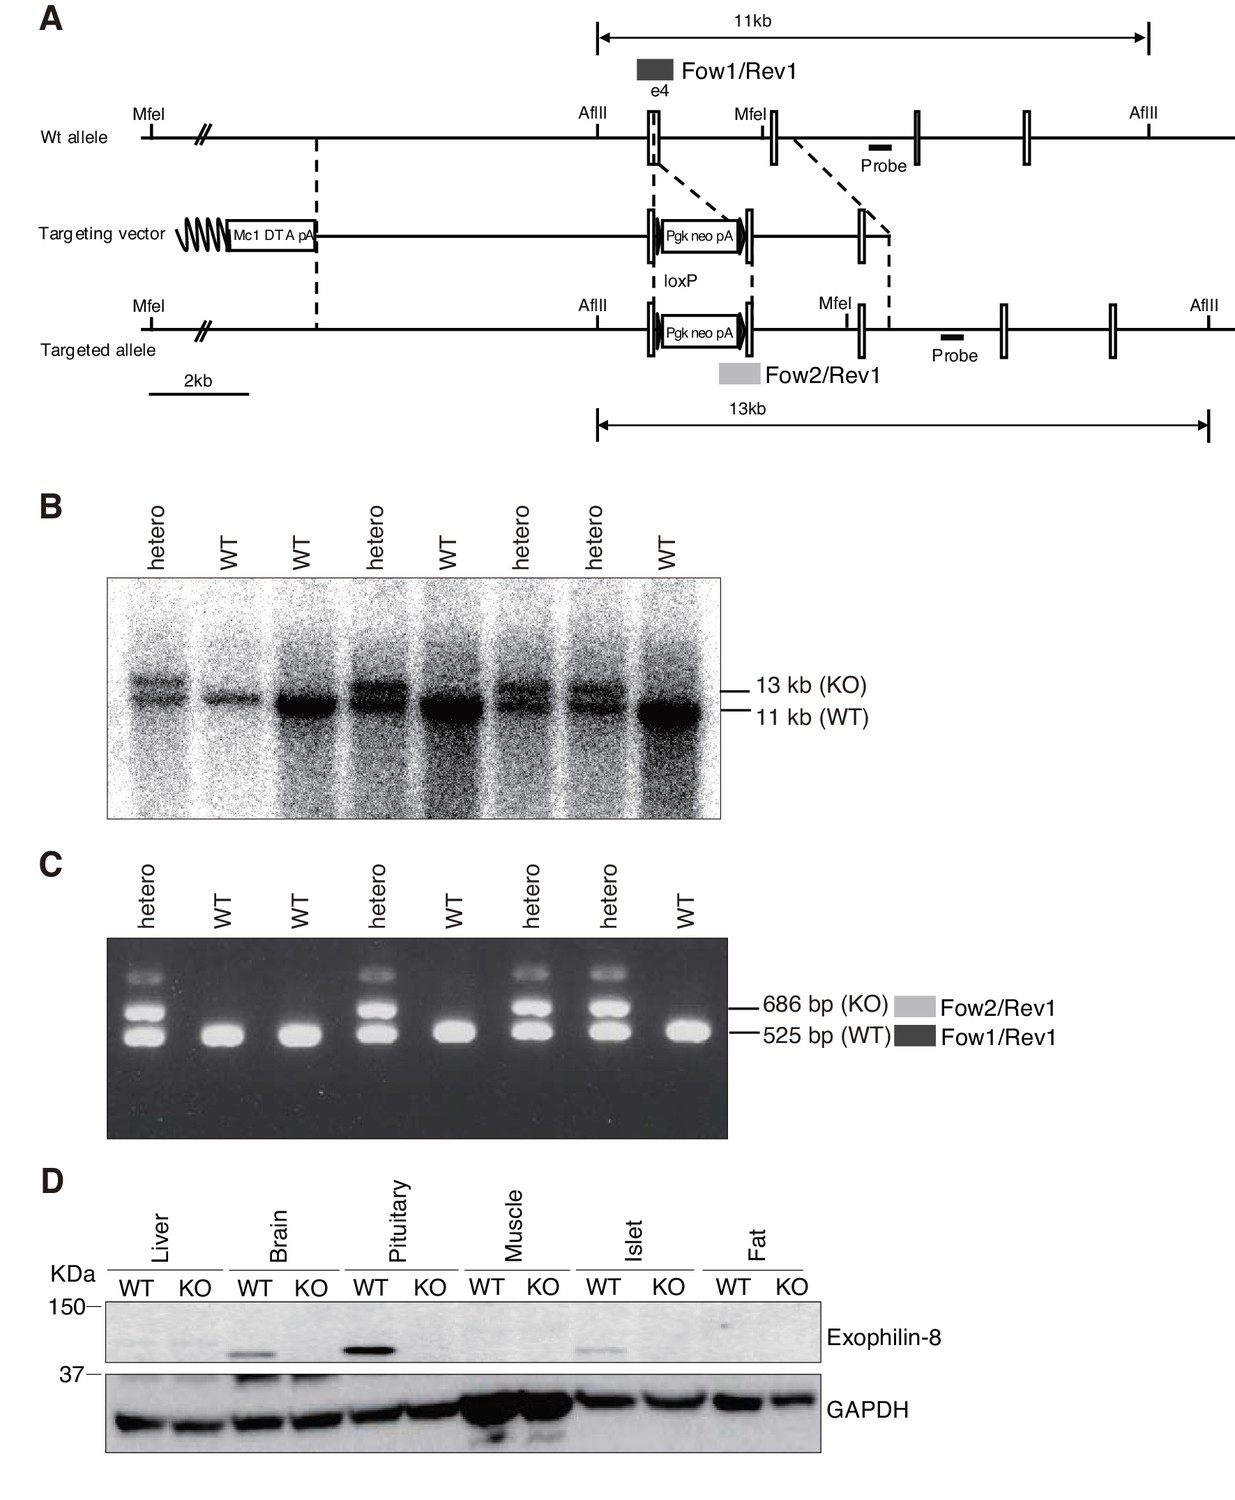
Generation of exophilin-8-null mice.
(A) Targeted disruption of the exophilin-8 (Myrip) gene on mouse chromosome 9. The targeting vector contains a neomycin resistance gene driven by the pgk promoter (pgk-neo) and a diphtheria toxin A-fragment gene driven by the MC1 promoter (MC1-DTA) as positive and negative selection markers, respectively. Exon structures are vertically lined and shown from the fourth exon to the seventh exon. Homologous recombination results in insertion of pgk-neo in the genomic region of exon4. (B) Genomic Southern hybridization analysis of the backcrossed progenies from a cross of chimeric mice with C57BL/6 mice. The location of the external probe is shown with horizontal closed lines in (A). The probe hybridizes to AflIII fragments of 11.0 kb and 13.0 kb from wild-type (WT) and mutant knockout (KO) alleles, respectively. (C) PCR genotyping of the offspring. PCR with Exo8/Fow1, Neo/Fow2, and Exo8/Rev1 yields 525 bp and 686 bp products for WT and KO alleles, as shown in dark and light gray boxes in (A), respectively. (D) An equal amount of protein (20 μg) from the tissues of WT and KO mice was electrophoresed for immunoblotting with antibodies toward exophilin-8 and GAPDH.
Figure 2
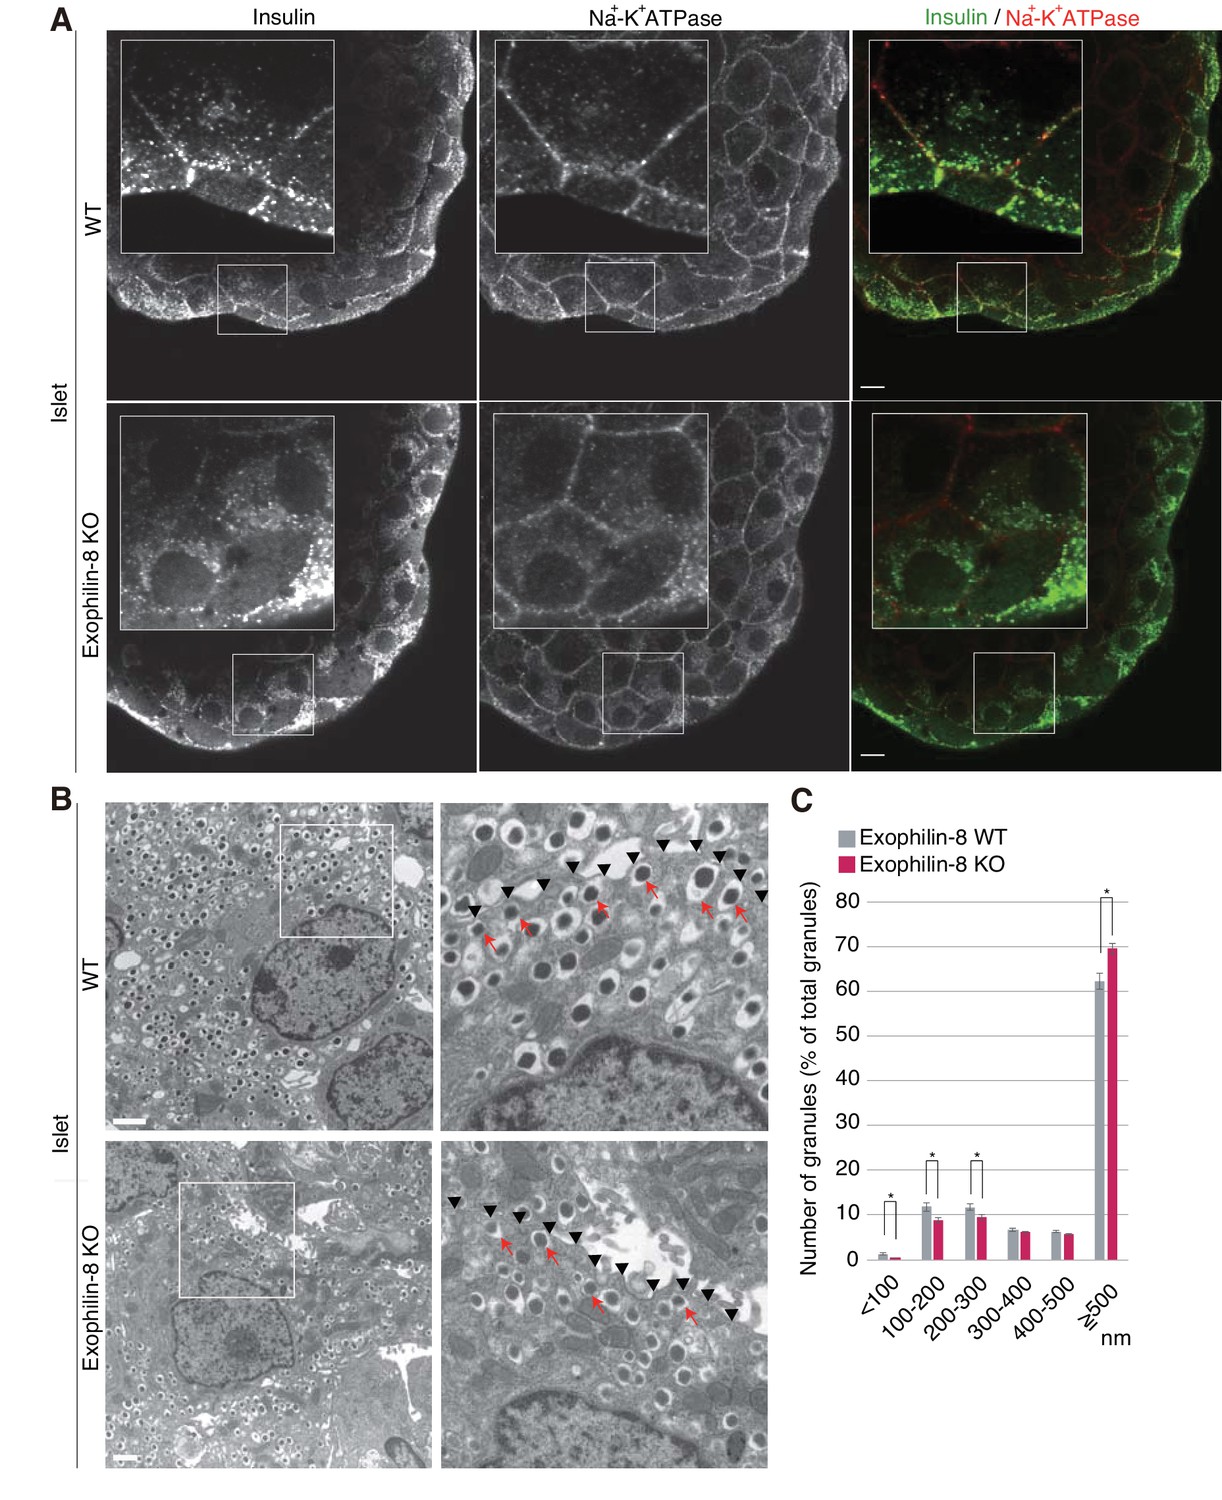
Distribution of insulin granules in exophilin-8-null β-cells.
(A) Islets isolated from WT and exophilin8-KO mice were coimmunostained with anti-insulin and anti-Na+-K+ ATPase antibodies. Note that the antibodies were accessible to only surface β-cells. Bars, 10 μm. Insets show details at a higher magnification. (B) The isolated islets were cultured overnight and incubated in 2.8 mM glucose buffer at 37°C for 1 hr. They were then fixed and processed in a standard fashion for electron microscopy. Bar, 1 μm. Squares in left panels are shown at a higher magnification in right panels. Black arrowheads indicate the position of the plasma membrane, whereas red arrows indicate granules directly attached to the plasma membrane. (C) The distributions of insulin granules were morphometrically analyzed by electron microscopy in a total of nine β cells from three, 20- to 22-week-old male WT (gray columns) or KO (red columns) mice (three cells from each individual mouse). All granules with centers that resided within 500 nm of the plasma membrane were categorized at 100 nm intervals. Data are shown as a percentage of the total granule number, and are shown as means ± SEM. *p values calculated using two-tailed unpaired t-test are 0.00182 (<100 nm), 0.01360 (100–200 nm), 0.021 (200–300 nm), and 1.4 × 10⁻³ (≥500 nm), respectively.
Figure 3
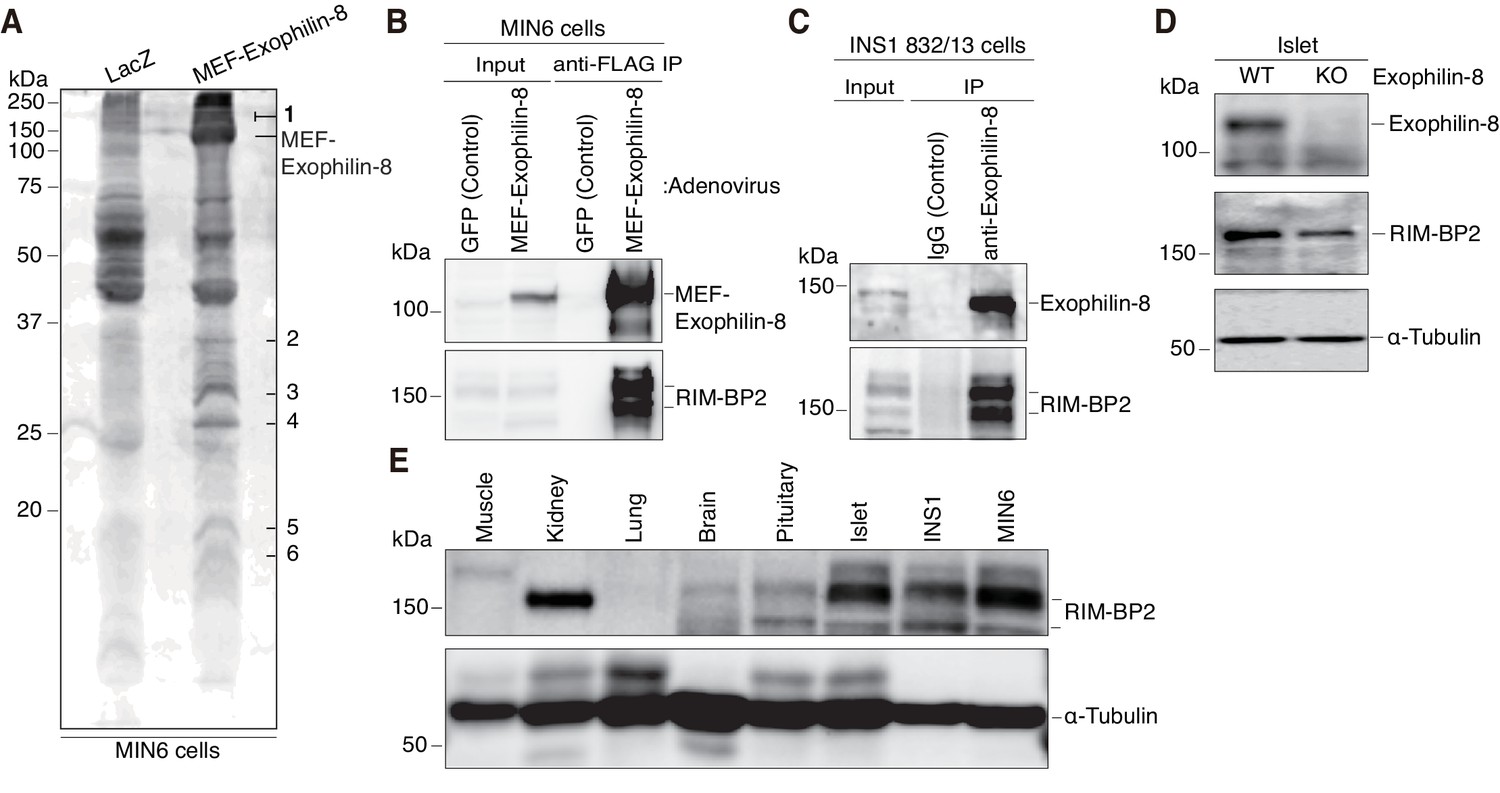
Identification of RIM-BP2 as an exophilin-8-interaction protein.
(A) MIN6 cells expressing MEF-exophilin-8 or control LacZ protein were lysed and subjected to MEF-tag based purification. Bound proteins were detected by SDS-PAGE and Oriole fluorescent gel staining. Six bands specific to MEF-exophilin-8 are numbered. The number 1 band was identified as RIM-BP2 by LC-MS/MS analysis. (B) MIN6 cells were infected by adenovirus encoding MEF-exophilin-8 or control GFP protein. The immunoprecipitates (IP) with anti-FLAG antibody, as well as 1/100 of the original extracts, were immunoblotted with anti-FLAG and anti-RIM-BP2 antibodies. (C) The immunoprecipitates with anti-exophilin-8 antibody or control immunoglobulin G (IgG) in INS-1 832/13 cells, as well as 1/100 of the original extract, were immunoblotted with anti-exophilin-8 and anti-RIM-BP2 antibodies. (D) The total islet protein lysates (20 μg) from wild-type (WT) or exophilin-8-knockout (KO) mice were analyzed by immunoblotting with antibodies against exophilin-8, RIM-BP2, and α-tubulin. (E) The protein lysates (20 μg) from wild-type mouse tissues or cultured β-cell lines were analyzed by immunoblotting with anti-RIM-BP2 and anti-α-tubulin antibodies.
Figure 4
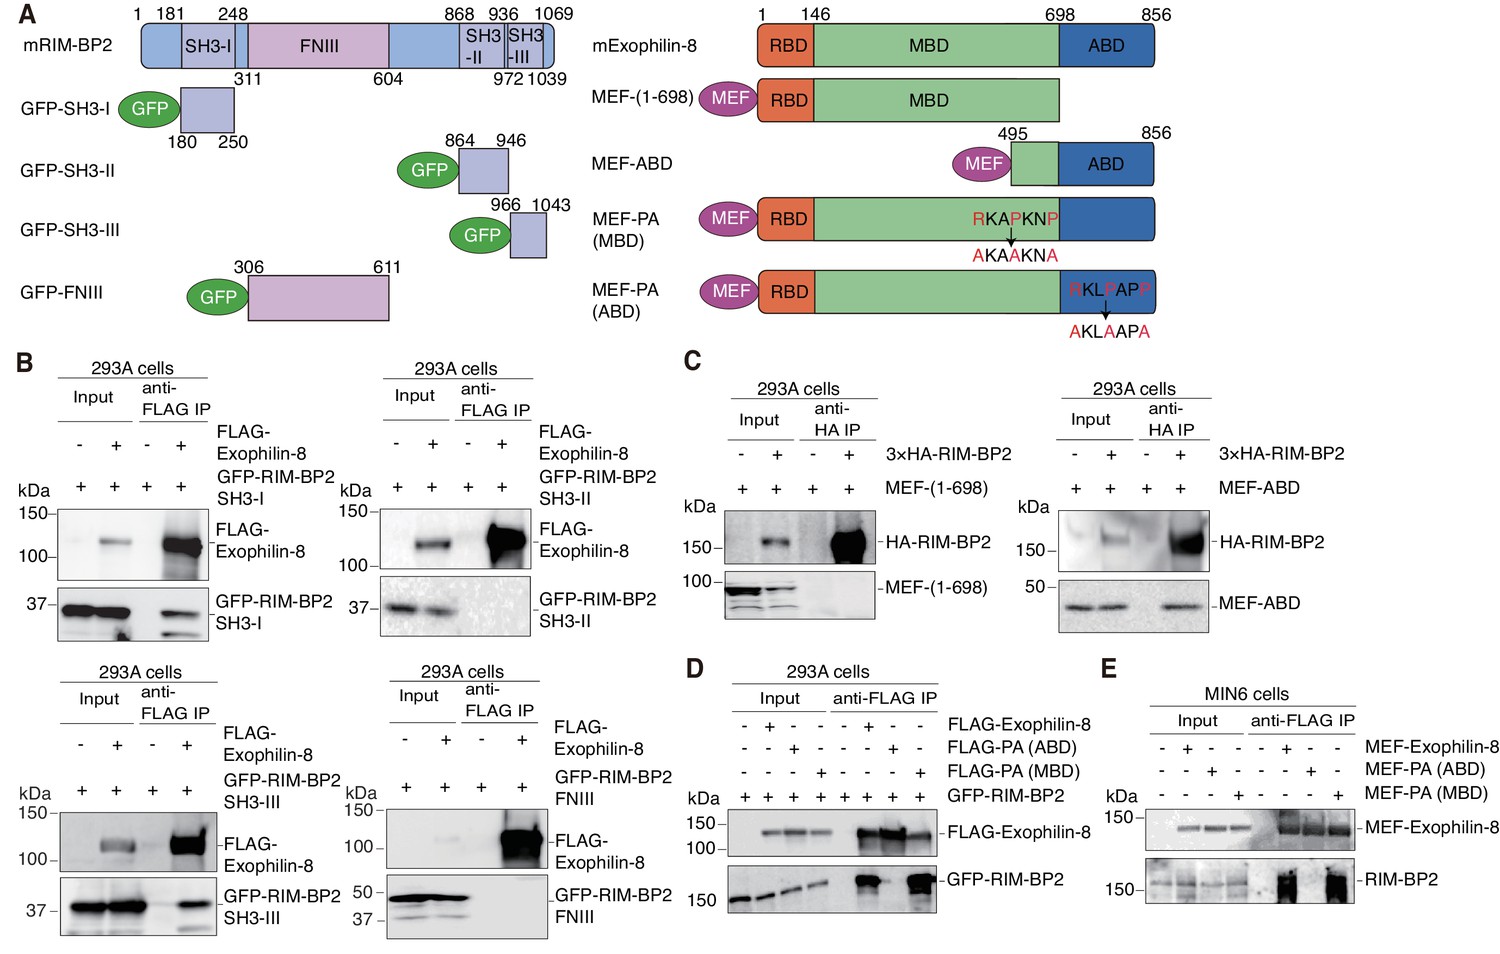
Protein domains responsible for the interaction between RIM-BP2 and exophilin-8.
(A) Schematic representation of mouse RIM-BP2 (left), mouse exophilin-8 (right), and their deletion or point mutants. (B–D) HEK293A cells were transfected with plasmids encoding the indicated proteins shown in (A). The immunoprecipitates with anti-FLAG (B, D) or anti-HA (C) antibodies, as well as 1/30 of the original extracts, were immunoblotted with anti-FLAG, anti-GFP, and anti-HA antibodies. (E) MIN6 cells were infected with adenovirus encoding the indicated proteins. The immunoprecipitates with anti-FLAG antibodies, as well as 1/100 of the original extracts, were immunoblotted with anti-FLAG and anti-RIM-BP2 antibodies.
Figure 5 with 1 supplement
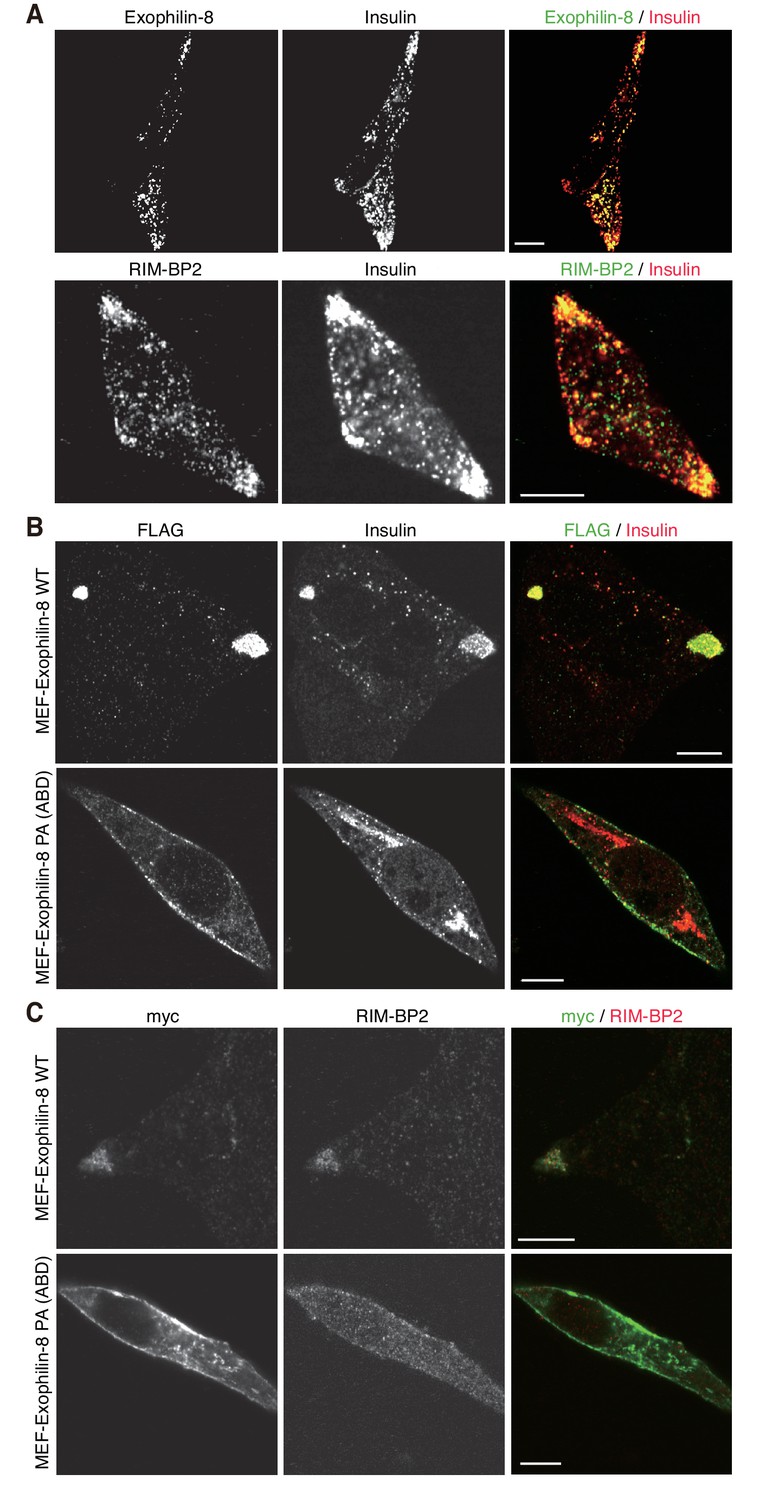
Exophilin-8 mutant deficient in binding to RIM-BP2 fails to cluster RIM-BP2 and insulin granules at cell corners.
(A) INS-1 832/13 cells were coimmunostained with anti-insulin and either anti-exophilin-8 (upper) or anti-RIM-BP2 (lower) antibodies. (B, C) INS-1 832/13 cells were infected with adenovirus encoding MEF-tagged, wild-type (WT) or PA (ABD) mutant exophilin-8. They were coimmunostained with anti-FLAG and anti-insulin antibodies (B) or with anti-myc and anti-RIM-BP2 antibodies (C). Bars, 10 μm.
Figure 5—figure supplement 1
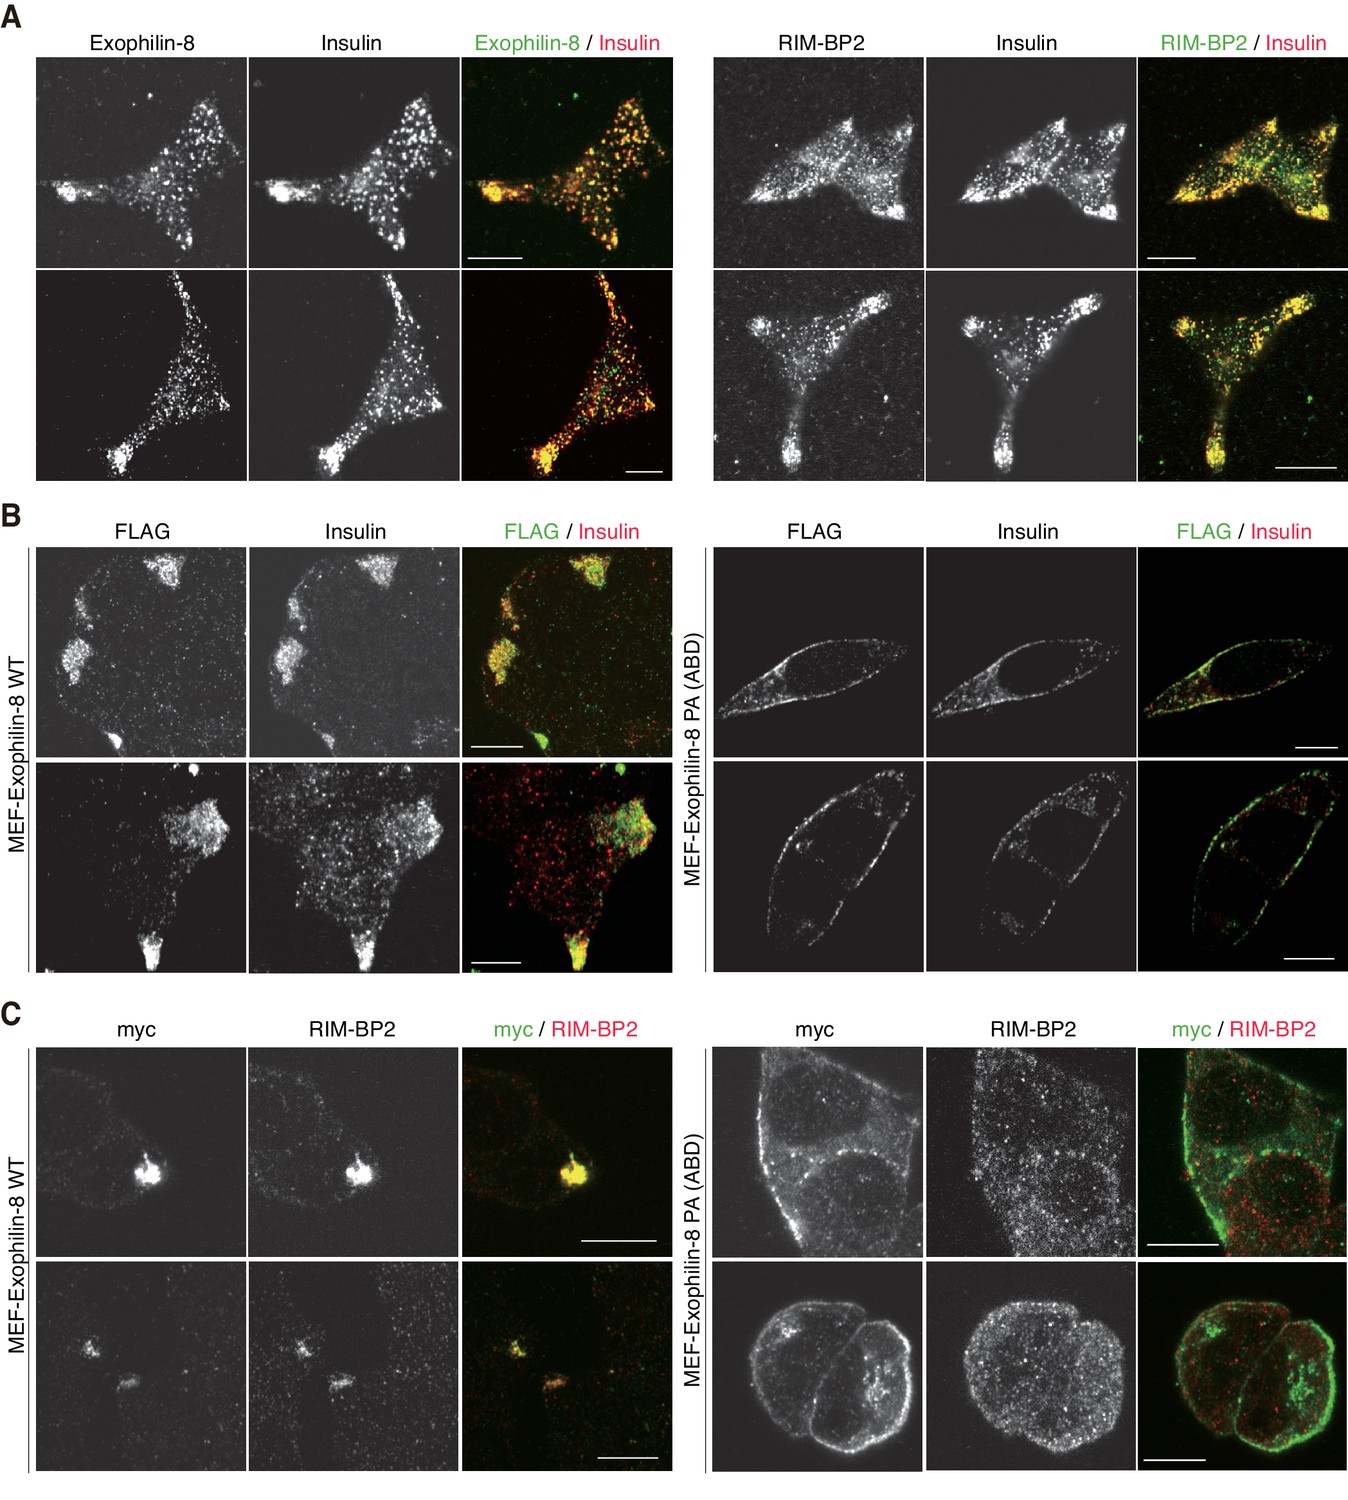
More images of INS-1 832/13 cells and those expressing wild-type or PA (ABD) mutant exophilin-8.
INS-1 832/13 cells and those expressing MEF-tagged, wild-type (WT) or PA (ABD) mutant exophilin-8 were coimmunostained with the indicated antibodies, as shown in Figure 5. Bars, 10 μm.
Figure 6 with 1 supplement
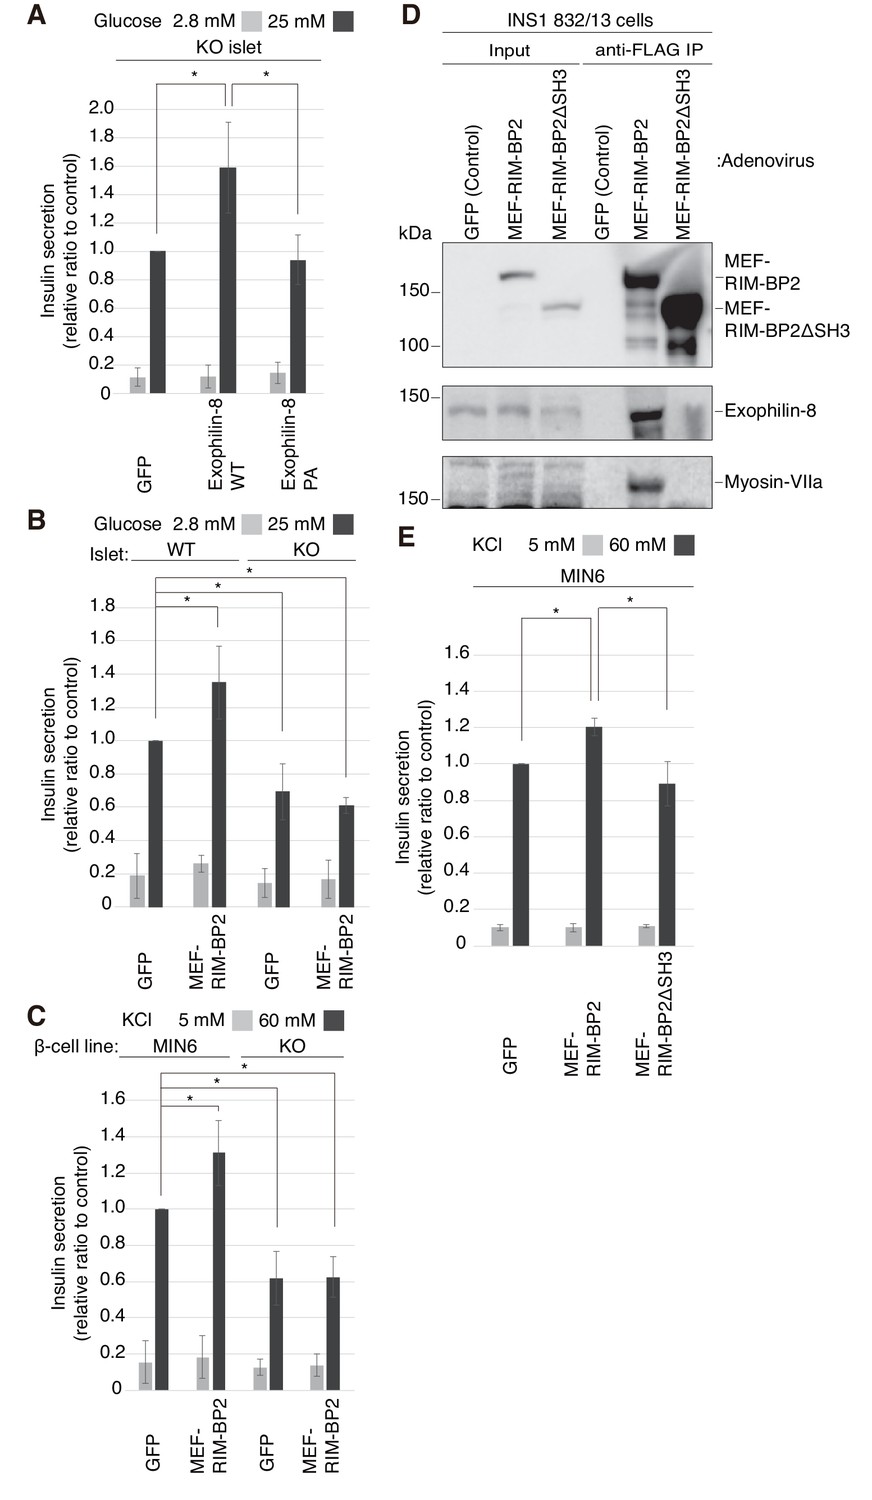
Exophilin-8 and RIM-BP2 potentiate insulin secretion through their mutual interaction.
(A) Pancreatic islets isolated from exophilin-8-knockout (KO) mice were infected with adenovirus encoding control GFP or MEF-tagged, wild-type (WT) or PA (ABD) mutant exophilin-8, as shown in Figure 6—figure supplement 1A,B, and were cultured in a fresh medium for 48 hr followed by Krebs-Ringer bicarbonate (KRB) buffer containing 2.8 mM glucose for 30 min. The cells were then incubated in the same buffer for 30 min (gray bars) followed by the buffer containing 25 mM glucose for 30 min (black bars). The ratios of insulin secreted into the medium to that remaining in the cells were normalized to those found in control cells stimulated by the secretagogue. (B, C) WT or KO islets (B), and MIN6 or exophilin-8-null β-cell lines (C) were infected with adenovirus encoding either GFP or MEF-RIM-BP2, as shown in Figure 6—figure supplement 1C and D, respectively, and were subjected to insulin secretion assays as in (A) stimulated by either 25 mM glucose (B) or 60 mM KCl (C) for 30 min. (D) INS-1 832/13 cells were infected with adenovirus encoding control GFP, wild-type MEF-RIM-BP2, or MEF-RIM-BP2ΔSH3 lacking all the SH3 domains, and the immunoprecipitates with anti-FLAG antibody, as well as 1/100 of the original extracts, were immunoblotted with anti-FLAG, anti-exophilin-8, and anti-myosin-VIIa antibodies. Note that RIM-BP2ΔSH3 lost binding activities to exophilin-8 and myosin-VIIa. (E) MIN6 cells were infected with adenovirus encoding control GFP, or wild-type or ΔSH3 RIM-BP2, as shown in Figure 6—figure supplement 1E, and were subjected to insulin secretion assays as in (C). All quantitative data are means ± SD (n = 3). *p values calculated using two-tailed unpaired t-test are as follows: (A) 0.03278 (GFP), 0.03607 (Exophilin-8 PA) vs Exophilin-8 WT, (B) 0.04952 (WT-islet MEF-RIM-BP2), 0.03503 (KO-islet GFP), 0.00015 (KO-islet MEF-RIM-BP2) vs WT-islet GFP, (C) 9.4 × 10⁻⁵ (MIN6 MEF-RIM-BP2), 2.5 × 10⁻⁶ (KO GFP), 1.3 × 10⁻⁷ (KO MEF-RIM-BP2) vs MIN6 GFP, and (E) 1.7 × 10⁻³ (MIN6 GFP), 0.014 (MIN6 MEF-RIM-BP2ΔSH3) vs MIN6 GFP MEF-RIM-BP2.
Figure 6—figure supplement 1

Expression levels of exophilin-8 and RIM-BP2.
(A, B) Pancreatic islets isolated from exophilin-8-knockout (KO) mice were infected with adenovirus encoding control GFP or MEF-tagged, wild-type (WT) or PA (ABD) mutant exophilin-8. The islet extracts, as well as those from noninfected WT mice, were immunoblotted with anti-β-actin and anti-exophilin-8 antibodies to compare the expression levels between either exogenous and endogenous exophilin-8 (A) or exogenous WT and PA (ABD) exophilin-8 (B). (C, D) WT or KO islets (C), and MIN6 or exophilin-8-null β-cell lines (D) were infected with adenovirus encoding either GFP or MEF-RIM-BP2. They were lysed for immunoblotting with anti-FLAG, anti-exophilin-8, and anti-β-actin (C) or anti-α-tubulin (D) antibodies. (E) MIN6 cells were infected with adenovirus encoding control GFP, or wild-type or ΔSH3 RIM-BP2, and the cell extracts were immunoblotted with anti-FLAG and anti-β-actin antibodies.
Figure 7 with 3 supplements

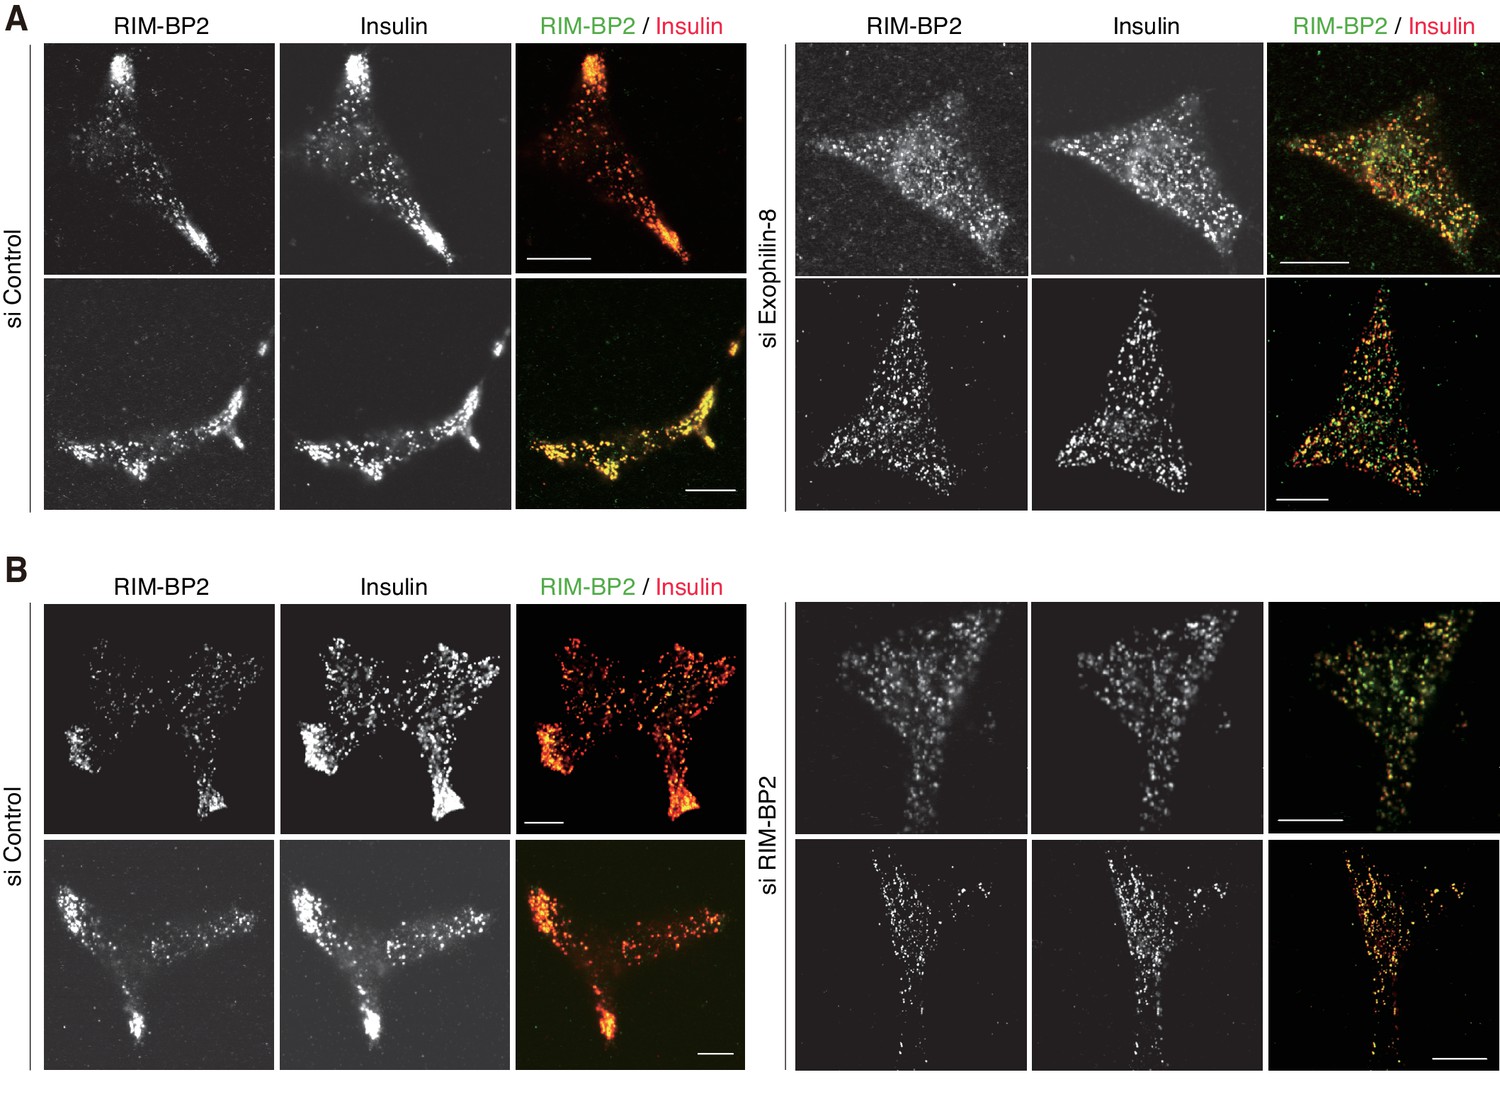
Silencing of exophilin-8 or RIM-BP2 decreases the cell-corner localization and exocytosis of insulin granules.
(A) INS-1 832/13 cells were transfected with control siRNA duplexes, or siRNA duplexes against exophilin-8 or RIM-BP2. The cell extracts were immunoblotted with anti- RIM-BP2, anti-exophilin-8, and anti-β-actin antibodies. (B) INS-1 832/13 cells treated with siRNA as shown in (A) were incubated for 2 hr in KRB buffer containing 2.8 mM glucose, and were then stimulated for 60 min in the same buffer (gray bars) or buffer containing 25 mM glucose (black bars). The ratios of insulin secreted into the medium to that remaining in the cells were normalized to those found in control cells stimulated by 25 mM glucose. (C–E) The cells treated with siRNA were immunostained with anti-insulin antibody and either anti-RIM-BP2 (D) or anti-exophilin-8 (E) antibodies. In each experiment, a total of 100 cells were visually inspected, and the fraction of cells exhibiting a higher granule density in at least one cell corner or extension than in the cell center was manually counted (C). Bars, 10 μm. (F, G) INS-1 832/13 cells treated with control siRNA or siRNA against RIM-BP2 were infected with adenovirus encoding control GFP, or wild-type or ΔSH3 MEF-RIM-BP2, as shown in Figure 7—figure supplement 2. They were subjected to insulin secretion assays (F) as in (B), or were immunostained with anti-insulin antibody to examine granule localization (G) as in (C). All quantitative data are means ± SD (n = 5 for B, and n = 4 for C, and n = 3 for F). *p values calculated using two-tailed unpaired t-test are as follows: (B) 1.9 × 10⁻⁷ (si Exophilin-8), 7.3 × 10⁻⁶ (si RIM-BP2) vs si Control, (C) 0.00010 (si Exophilin-8), 0.00025 (si RIM-BP2) vs si Control, (F) 3.7 × 10⁻³ (si RIM-BP2, GFP), 8.2 × 10⁻³ (si RIM-BP2, MEF-RIM-BP2) vs si Control, GFP, and 0.033 (si RIM-BP2, GFP), 0.060 (si RIM-BP2, MEF-RIM-BP2ΔSH3; marked by #) vs si RIM-BP2, MEF-RIM-BP2, and (G) 1.1 × 10⁻³ (si RIM-BP2, GFP), 5.5 × 10⁻³ (si RIM-BP2, MEF-RIM-BP2) vs si Control, GFP, and 7.7 × 10⁻³ (si RIM-BP2, GFP), 7.1 × 10⁻⁵ (si RIM-BP2, MEF-RIM-BP2ΔSH3) vs si RIM-BP2, MEF-RIM-BP2.
Figure 7—figure supplement 1
More images of INS-1 832/13 cells treated with siRNA.
INS-1 832/13 cells treated with control siRNA or siRNA against exophilin-8 or RIM-BP2 were immunostained with anti-insulin antibody and either anti-RIM-BP2 or anti-exophilin-8 antibodies, as shown in Figure 7D,E. Bars, 10 μm.
Figure 7—figure supplement 2
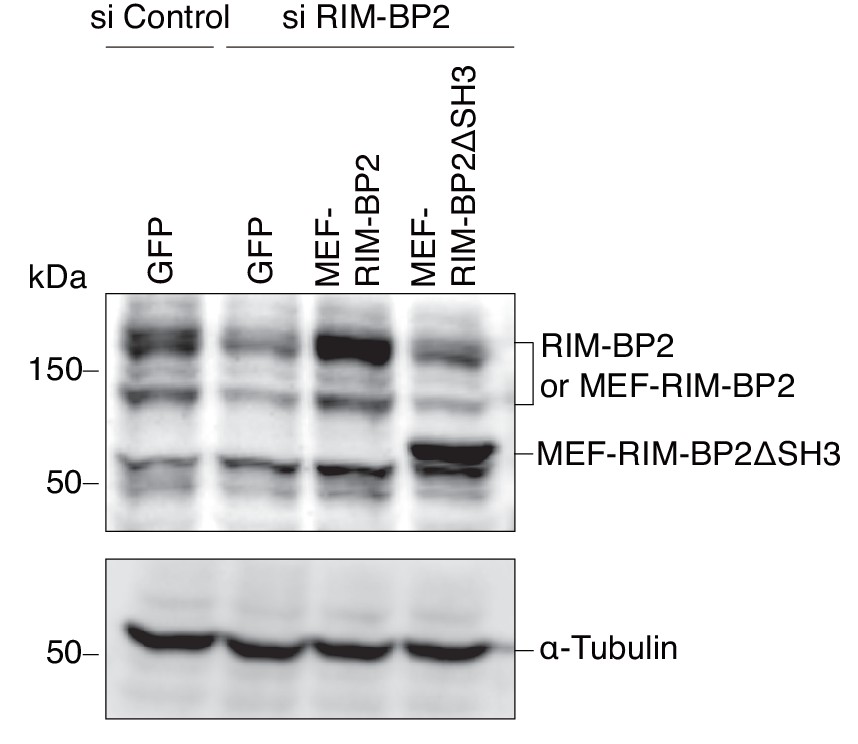
Expression levels of endogenous and exogenous RIM-BP2.
INS-1 832/13 cells treated with control siRNA or siRNA against RIM-BP2 were infected with adenovirus encoding control GFP, or wild-type or ΔSH3 MEF-RIM-BP2. The cell extracts were immunoblotted with anti-RIM-BP2 and anti-α-tubulin antibodies.
Figure 7—figure supplement 3
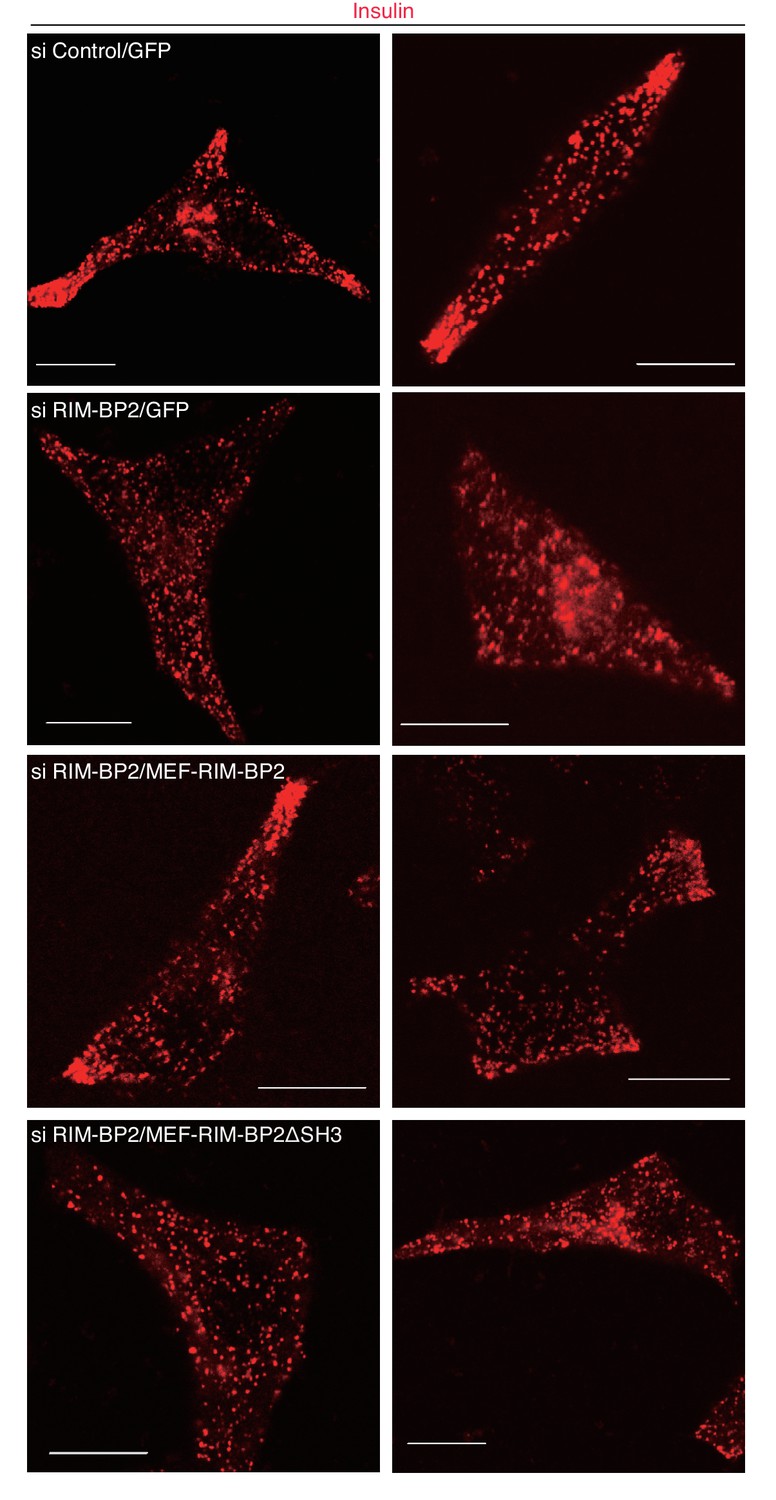
Granule localization in INS-1 832/13 cells treated with siRNA against RIM-BP2 and then expressing wild-type or ΔSH3 RIM-BP2.
INS-1 832/13 cells were treated with control siRNA or siRNA against RIM-BP2 and then infected adenovirus expressing either GFP, or wild-type or ΔSH3 RIM-BP2, as shown in Figure 7—figure supplement 2. They were immunostained with anti-insulin antibody to examine granule localization. Bars, 10 μm.
Figure 8

Exophilin-8 indirectly interacts with myosin-VIIa via RIM-BP2 in INS-1 832/13 cells.
(A, B) INS-1 832/13 cells were infected with adenoviruses expressing HA-RIM-BP2 and either control GFP, or MEF-tagged, wild-type (WT) or PA (ABD) mutant exophilin-8 (A, B), and with that expressing MEF-exophilin-3 (B). The immunoprecipitates with anti-FLAG antibody, as well as 1/100 of the original extracts, were immunoblotted with the indicated antibodies to investigate the interacting proteins. The protein bands found in Input lanes of Munc13-1 are non-specific proteins, whereas those found in the immunoprecipitates of SNAP25 are immunoglobulin G. (C) Exophilin-8-null β-cell lines were infected with adenoviruses expressing GFP, HA-tagged wild-type exophilin-8, and/or MEF-RIM-BP2. The immunoprecipitates with anti-FLAG antibody were immunoblotted with the indicated antibodies as in (B).
Figure 9 with 1 supplement

The molecular mass of myosin-VIIa interacted with RIM-BP2 in INS-1 832/13 cells is 170 kDa, whereas that directly binds exophilin-8 in HEK293A cells is 260 kDa.
(A) HEK293A cells were transfected with plasmids expressing RIM-BP2, myosin-VIIa, and/or OSF-tagged, wild-type or PA mutant exophilin-8 ABD. Exophilin-8 ABD and the binding proteins were pulled down using Strep-Tactin beads, and were subjected to SDS-PAGE and Coomassie Brilliant Blue staining. (B) HEK293A cells were transfected with plasmids expressing wild-type or PA mutant exophilin-8 ABD, myosin-VIIa, and OSF-tagged RIM-BP2. RIM-BP2 and the binding proteins were pulled down as in (A). (C) INS-1 832/13 cells were transfected with control siRNA duplexes or siRNA duplexes against myosin-VIIa, and the cell extracts were immunoblotted with anti-myosin-VIIa and anti-α-tubulin antibodies. Note that both 260 kDa and major 170 kDa protein bands were downregulated by myosin-VIIa siRNA. (D) INS-1 832–13 cells were transfected with plasmids expressing myosin-VIIa and/or OSF-tagged RIM-BP2. Because the transfection efficiency in these cells are poor compared with that in HEK293A cells, the binding proteins were detected by immunoblotting. The anti-myosin-VIIa used in this figure was that generated by our laboratory (αMyo7), in contrast to the commercially available antibody used in Figures 6D, 8, 9C and 10 (see Materials and methods). (E) Illustration of the cortical F-actin network with secretory granules and the plasma membrane, the exophilin-8–RIM-BP2–170 kDa myosin-VIIa complex found in the present study, and the previously known, exocytic protein interactions (Südhof, 2013). The exact molecular nature of the 170 kDa form of myosin-VIIa and whether it directly interacts with RIM-BP2 are currently unknown.
Figure 9—figure supplement 1

Sucrose density gradient centrifugation analysis of the exophilin-8–RIM-BP2–myosin-VIIa complex.
Molecular mass markers (A), bovine serum albumin (67 kDa), aldorase (160 kDa), and thyroglobulin (660 kDa), or the cytosolic fraction of INS1 832/13 cells (B) were separated using sucrose density gradient centrifugation. Fractions were subjected by SDS-PAGE separated using sucrose density gradient centrifugation.
Figure 10 with 3 supplements
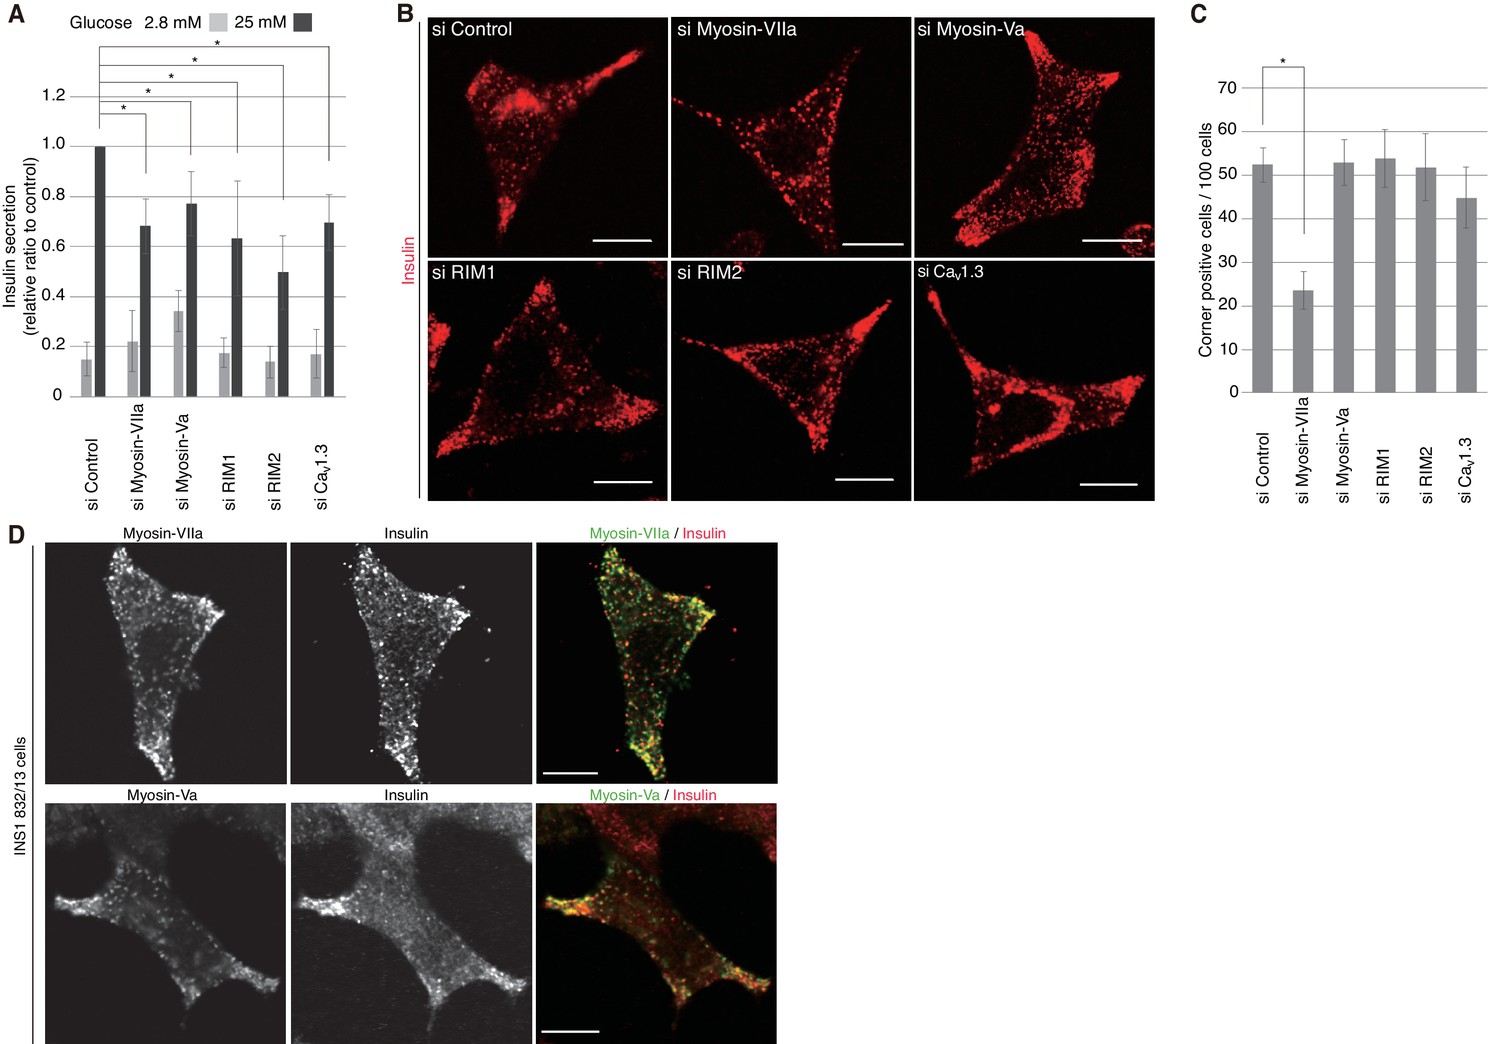
Myosin-VIIa clusters granules at cell corners.
(A–C) INS-1 832–13 cells were transfected with control siRNA duplexes or siRNA duplexes against the indicated proteins (Figure 9B, Figure 10—figure supplement 1) and were subjected to insulin secretion assays (A) as described in Figure 7B, or to insulin immunostaining (B, C) to examine the peripheral accumulation of granules as described in Figure 6C–E. (D) INS-1 832/13 cells were coimmunostained with anti-insulin antibody and either with anti-myosin-Va or -VIIa antibody. Bars, 10 μm. All quantitative data are means ± SD (n = 4). *p values calculated using two-tailed unpaired t-test are as follows: (A) 0.00029 (si Myosin-VIIa), 0.01168 (si Myosin-Va), 0.01881 (si RIM1), 0.00688 (si RIM2), 0.00045 (si Cav1.3) vs si Control, and (B) 6.2 × 10⁻⁵ (si Myosin-VIIa) vs si Control.
Figure 10—figure supplement 1
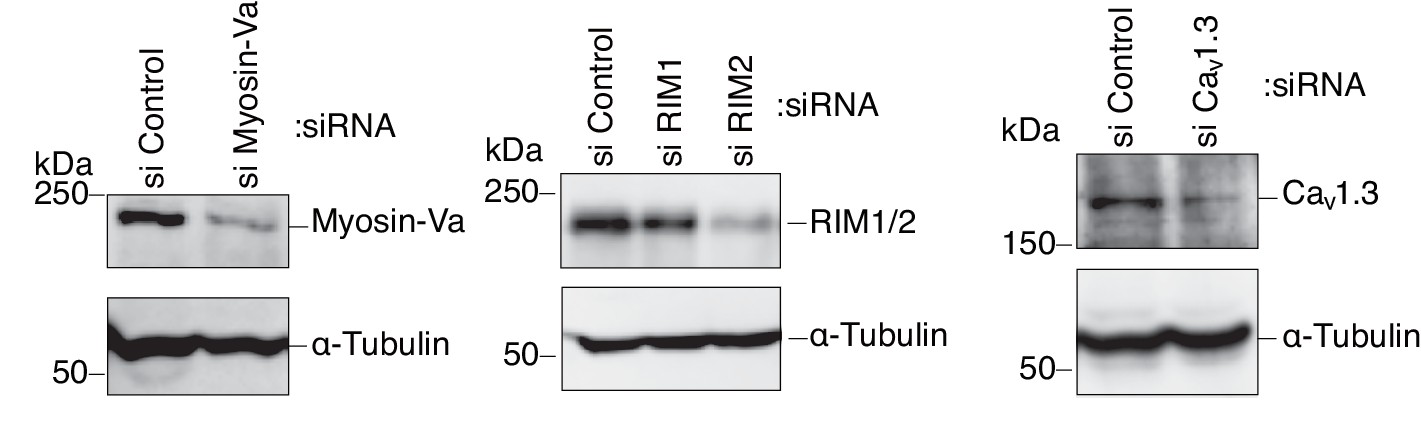
Silencing of myosin-Va, RIM, and Cav1.3 by siRNA.
INS-1 832/13 cells were transfected with control siRNA duplexes or siRNA duplexes against the indicated protein. The cell extracts were immunoblotted with the indicated antibody to evaluate its downregulation.
Figure 10—figure supplement 2
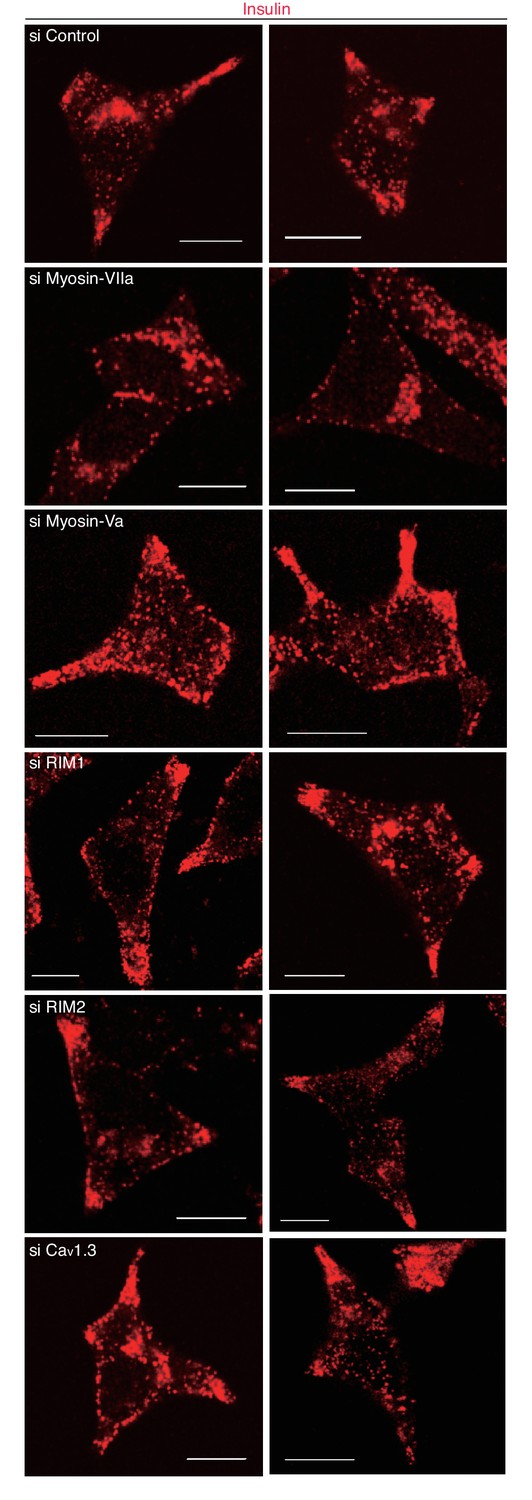
More images of INS-1 832–13 cells treated with siRNA.
INS-1 832/13 cells treated with siRNA against the indicated protein were immunostained with anti-insulin antibody, as shown in Figure 10B. Bars, 10 μm.
Figure 10—figure supplement 3
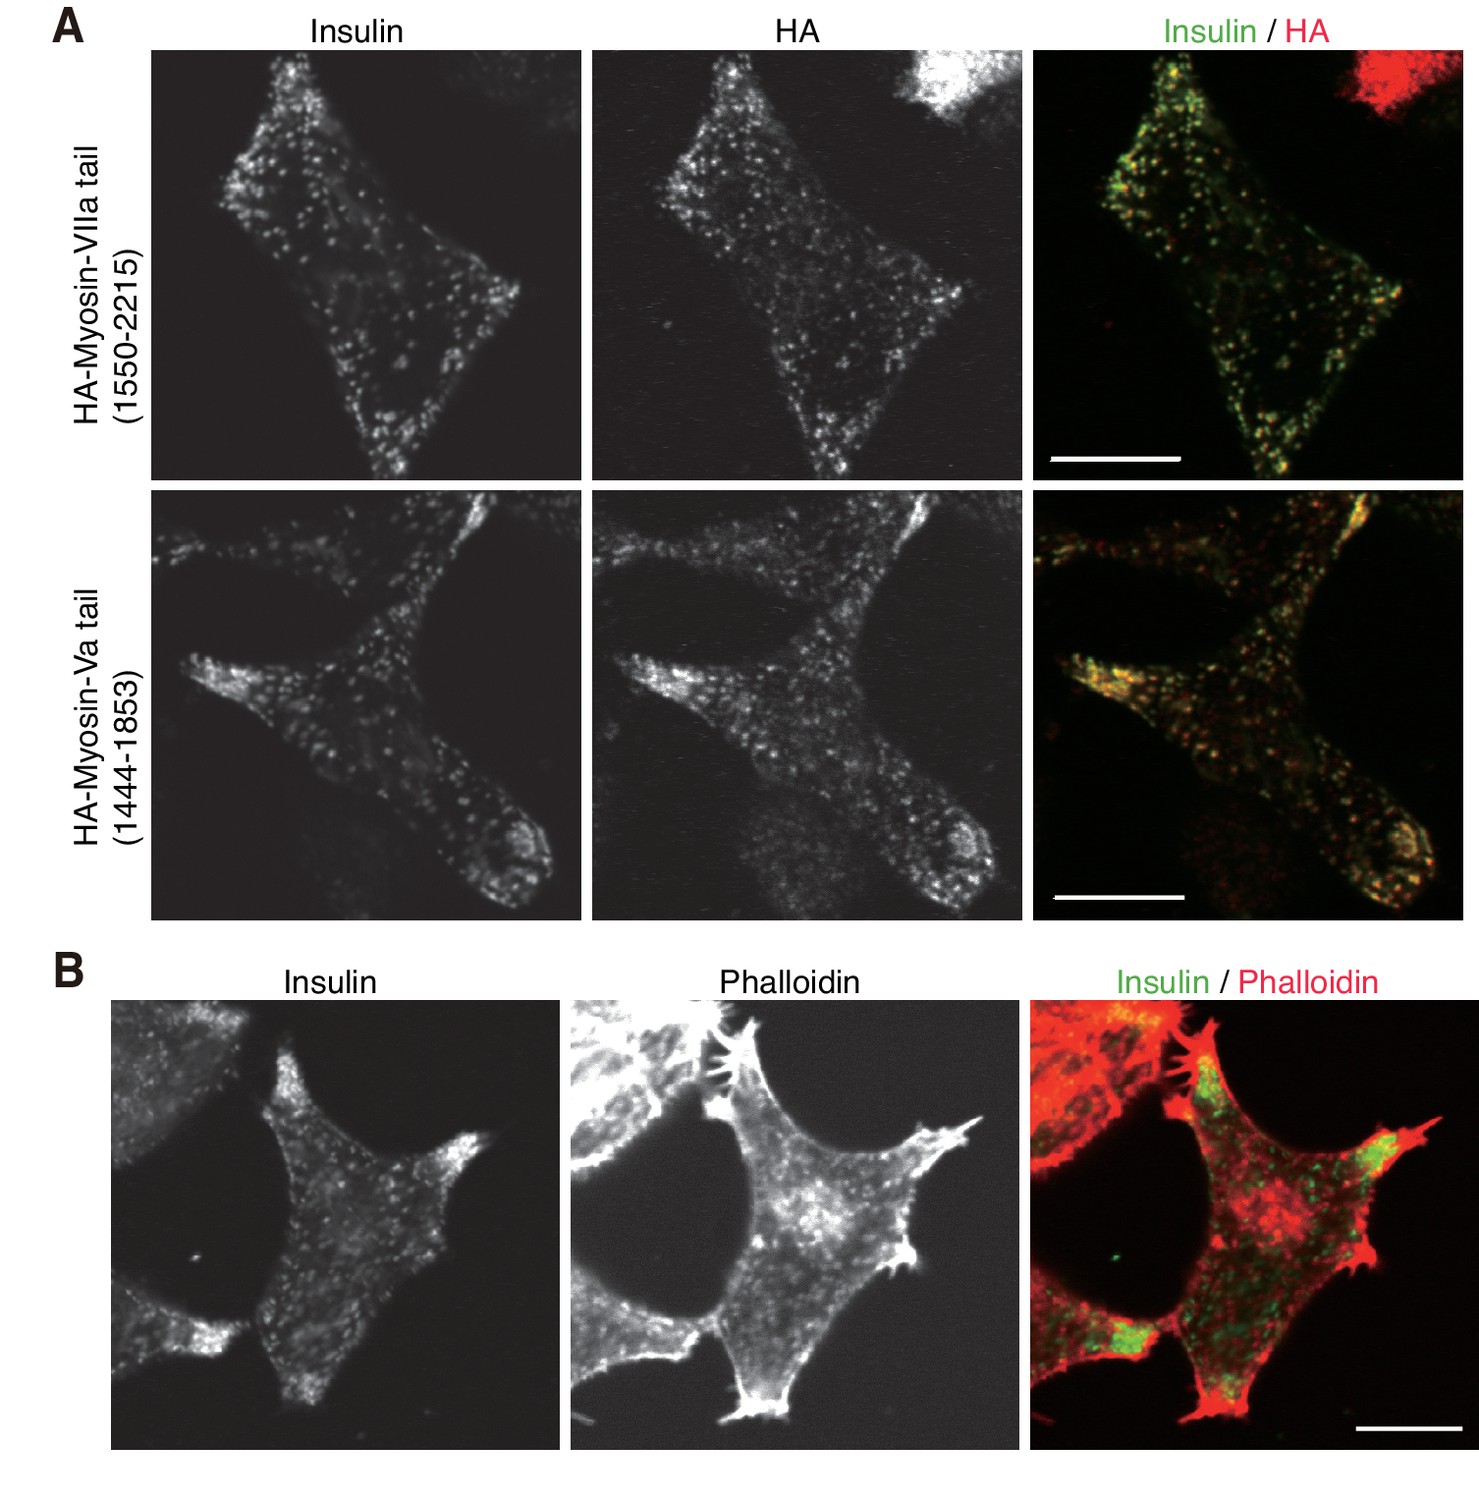
Localization of F-actin and its motor proteins.
(A) INS-1 832/13 cells expressing the C-terminal tail of HA-tagged myosin-VIIa (1550–2215 amino acids) or -Va (1444–1853 amino acids) were coimmunostained with anti-insulin and anti-HA antibodies. (B) INS-1 832/13 cells were costained with anti-insulin antibody and rhodamine-labeled phalloidin. Bars, 10 μm.
Download links
A two-part list of links to download the article, or parts of the article, in various formats.
Downloads (link to download the article as PDF)
Open citations (links to open the citations from this article in various online reference manager services)
Cite this article (links to download the citations from this article in formats compatible with various reference manager tools)
Exophilin-8 assembles secretory granules for exocytosis in the actin cortex via interaction with RIM-BP2 and myosin-VIIa
eLife 6:e26174.
https://doi.org/10.7554/eLife.26174


