An inhibitory gate for state transition in cortex
- Department of Neuroscience and Brain Technologies, Istituto Italiano di Tecnologia, Italy
- Istituto Italiano di Tecnologia, Italy
- Center for Neuroscience and Cognitive Systems @UniTn, Istituto Italiano di Tecnologia, Italy
Figures
Figure 1 with 1 supplement

Firing activity of PV and SST interneurons during cortical up and down states in vivo.
(a) Fluorescence image showing a glass pipette (dotted white line) used for juxtasomal recordings from a PV positive interneuron (red cell) in a PVxTdTomato bigenic transgenic animal. (b) Representative traces of simultaneous LFP (top) and juxtasomal (bottom) recordings from an identified PV interneuron during up and down states. Pink and purple colours in the background indicate up and down states that were identified from the LFP signal, respectively. The white background colour indicates indeterminate states (see Materials and methods). (c) Action potentials fired by PV cells in the three identified periods (up, down and indeterminate, p = 7E-8, one-way ANOVA, N = 16 cells from five animals). In this as well in other figures: grey dots and lines indicate single experiment; black dots and lines indicate the average value represented as mean ± s.e.m; n.s., p>0.05; *p<0.05; **p<0.01; ***p<0.001. (d) Percentage of active up states and active down states (p = 3E-16, unpaired Student’s t-test, N = 16 cells from five animals). (e) Number of spikes fired by PV cells per single up or down state (p = 8E-6, Mann-Whitney test, N = 16 cells from five animals). (f–g) Same as in a, b but in SSTxTdTomato bigenic transgenic animals. (h–j) Same as in c-e for SST interneurons. In h, p = 2E-8, Friedman test, N = 19 cells from seven animals. In i, p = 1E-7, Mann-Whitney test, N = 19 cells from seven animals. In j, p = 9E-3, Mann-Whitney test, N = 19 cells from seven animals.
-
Figure 1—source data 1
Source data for the analysis of the firing activity of PV and SST interneurons during up and down states.
- https://doi.org/10.7554/eLife.26177.003
Figure 1—figure supplement 1
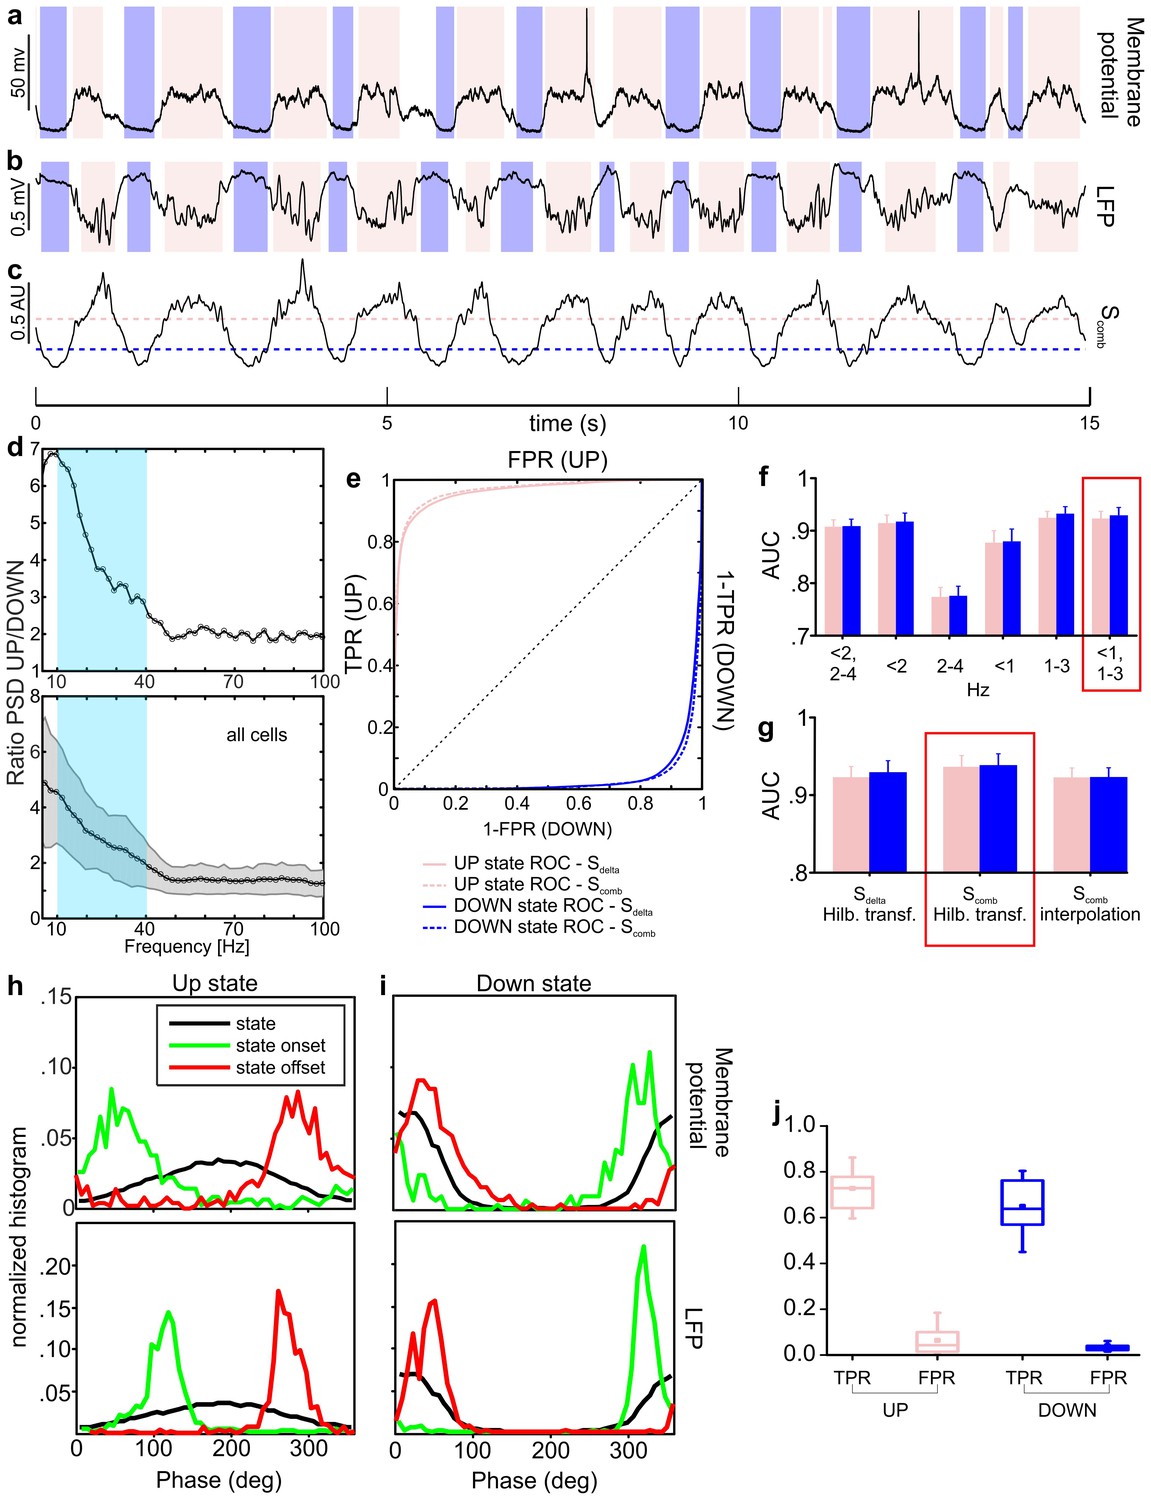
Up and down state detection from the LFP signal.
(a–c) Representative example of up/down state detection results. Up/down state periods (pink and purple shadows, respectively) as detected from membrane potential are shown in a, whereas states detected in the LFP signal (and based on the decision variable trace shown in c) are reported in b. In c, the up state threshold is marked by the dotted pink line, whereas the down state threshold by the purple dotted line. (d) Ratio between power spectral densities (PSD) of LFP in up/down states (representative cell in upper panel, mean ± s.d. of all cells in lower panel). The light blue square indicates the 10–40 Hz range used in our algorithm. (e–g) ROC curves for the detection of up (pink) and down (purple) states using either Sdelta or Scomb are reported in e (representative cell). Up/down state ROC curves are shown either in the top left or in the bottom right half of the xy plane, respectively. The area under ROC curve (AUC) using different frequency bands for the computation of Sdelta is shown in f. The AUC for the various metrics (i.e. Sdelta or Scomb) or phase computation methods (i.e. Hilbert transform or interpolation) are shown in g. Red rectangles highlight the combinations of parameters giving the maximum performance. (h–i) Statistical distributions of instantaneous phase during up/down states (up in h, down in i, black curves), state onset (in green), and state offsets (in red). Upper panels refer to state detection based on membrane potential, lower panels to state detection based on LFP. (j) True positive (TPR) and false positive rates (FPR) obtained by detecting up/down states on Scomb traces ([0, 1]-[1, 3] Hz frequency bands, instantaneous phase computed by Hilbert transform, and thresholds set as described in Materials and methods).
-
Figure 1—figure supplement 1—source data 1
Source data for Up and Down state detection from the LFP signal.
- https://doi.org/10.7554/eLife.26177.005
Figure 2 with 4 supplements
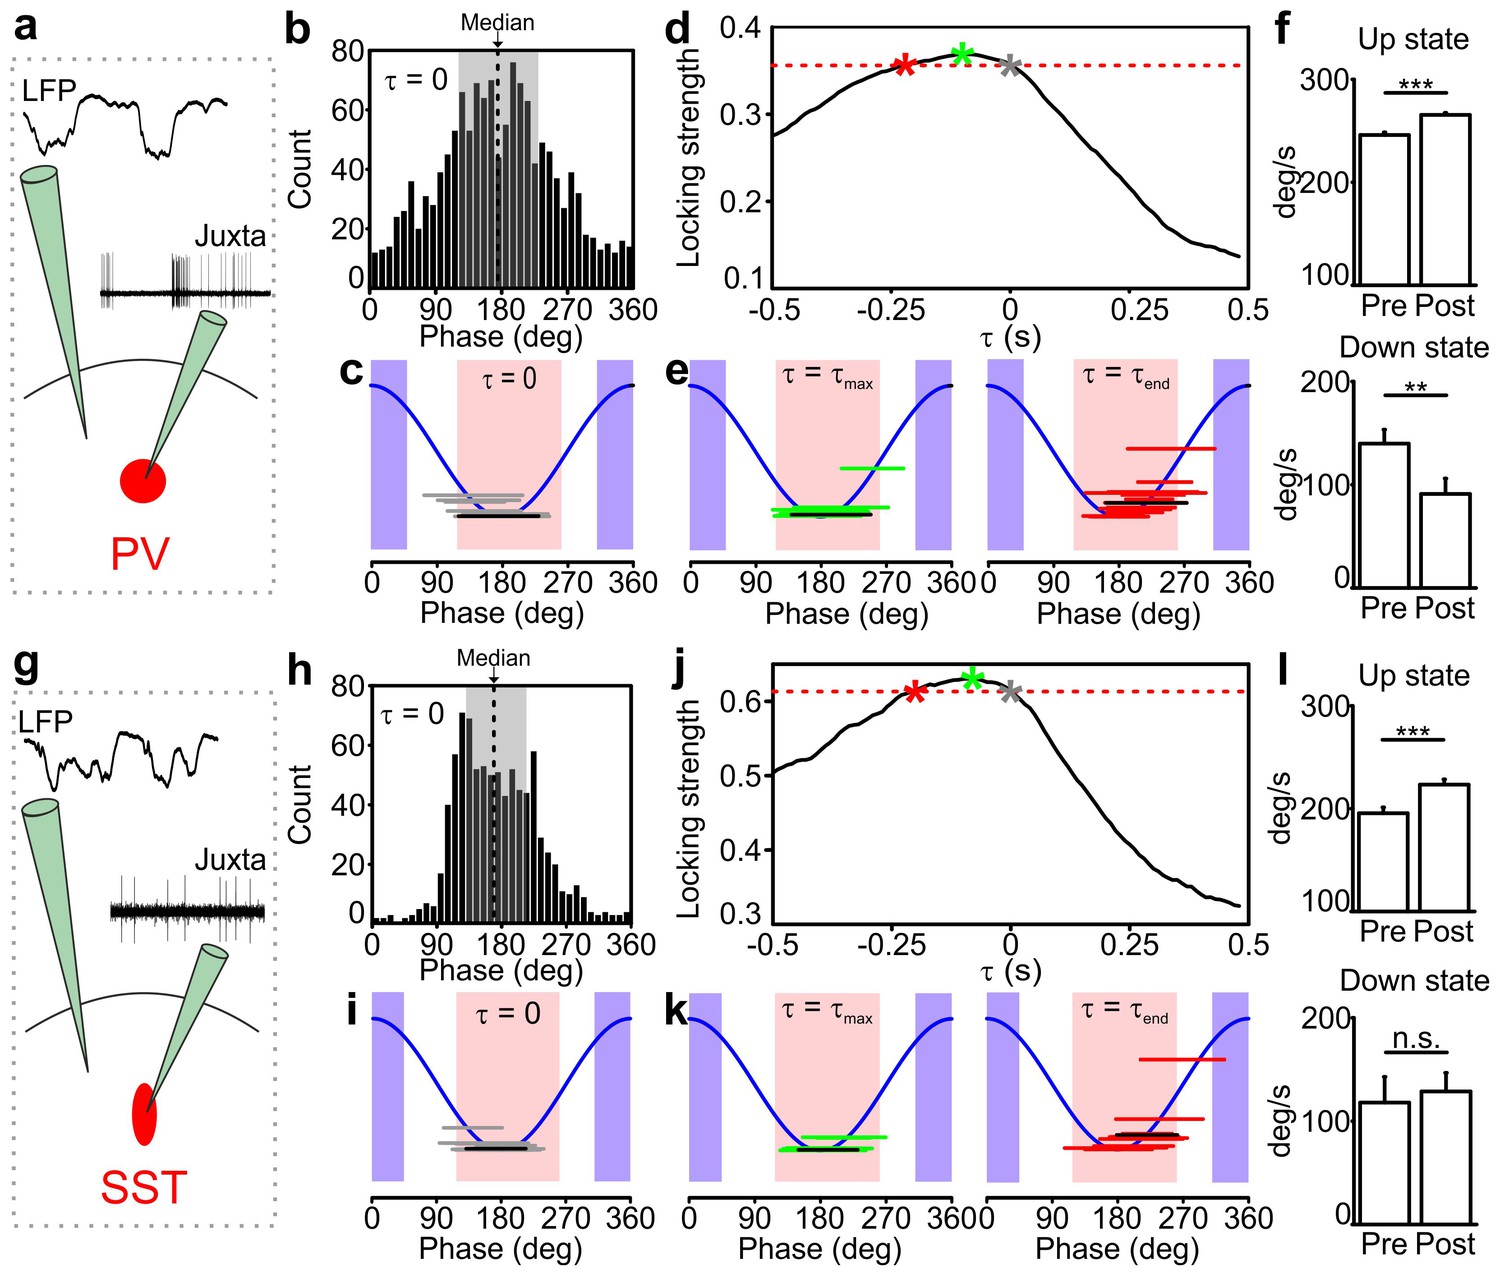
Temporal correlation between the activity of PV and SST interneurons and the LFP.
(a) Schematic representation of the experimental configuration for simultaneous LFP recording and fluorescence targeted juxtasomal recordings from PV interneurons. (b) Phase of firing distribution of one representative PV interneuron in the absence of temporal shift (τ = 0). The dashed line indicates the median. The shaded area indicates the range of preferred phase of firing defined as between the 25th and the 75th percentile. (c) The horizontal grey lines indicate the range of preferred phase of firing for each recorded cell. The blue lines plot a cosine function used to show the phase convention in terms of LFP peaks and troughs. The crossing between each grey line and the blue sinusoid occurs at the median value of phase of firing for each recorded cell. The black line represents the values of the cell shown in b. Pink and purple regions indicate phase ranges belonging to up states and down states, respectively. (d) Locking strength as a function of the time shift τ for the representative PV interneuron displayed in b. The grey asterisk indicates the locking strength corresponding to the τ = 0 value, the green asterisk that corresponding to the τmax value and the red asterisk that corresponding to the τend value. (e) Same as in c but in presence of temporal shift τ = τmax (left panel) and τ = τend (right panel). (f) LFP phase speed averaged over 200 ms before any PV interneuron spike lying between −400 ms and −200 ms from a state end and the LFP phase speed averaged over 200 ms after the same spikes. The post-spike phase speed is significantly higher than the pre-spike phase speed in up states (top panel), while it is significantly smaller in down states (bottom panel, for up states, p=2E-13, one-tailed paired Student’s t-test, N = 8911 stretches from 16 cells; for down state, p=8E-3, one-tailed paired Student’s t-test, N = 199 stretches from 11 cells). (g–k) Same as in a-e but for SST interneurons. (l) Spike-triggered phase speed analysis of SST interneurons as in f: the post-spike phase speed is significantly larger than the pre-spike phase speed in up states (top panel, p=2E-5, one-tailed paired Student’s t-test, N = 1346 stretches from 15 cells), while there is no significant difference between the post-spike and the pre-spike phase speed in down states (bottom panel, p=0.6, one-tailed paired Student’s t-test, N = 12 stretches from 7 cells).
-
Figure 2—source data 1
Source data for the analysis of the preferred phase of firing for PV and SST interneurons.
- https://doi.org/10.7554/eLife.26177.007
-
Figure 2—source data 2
Source data for the analysis of the spike triggered phase speed velocity.
- https://doi.org/10.7554/eLife.26177.008
Figure 2—figure supplement 1
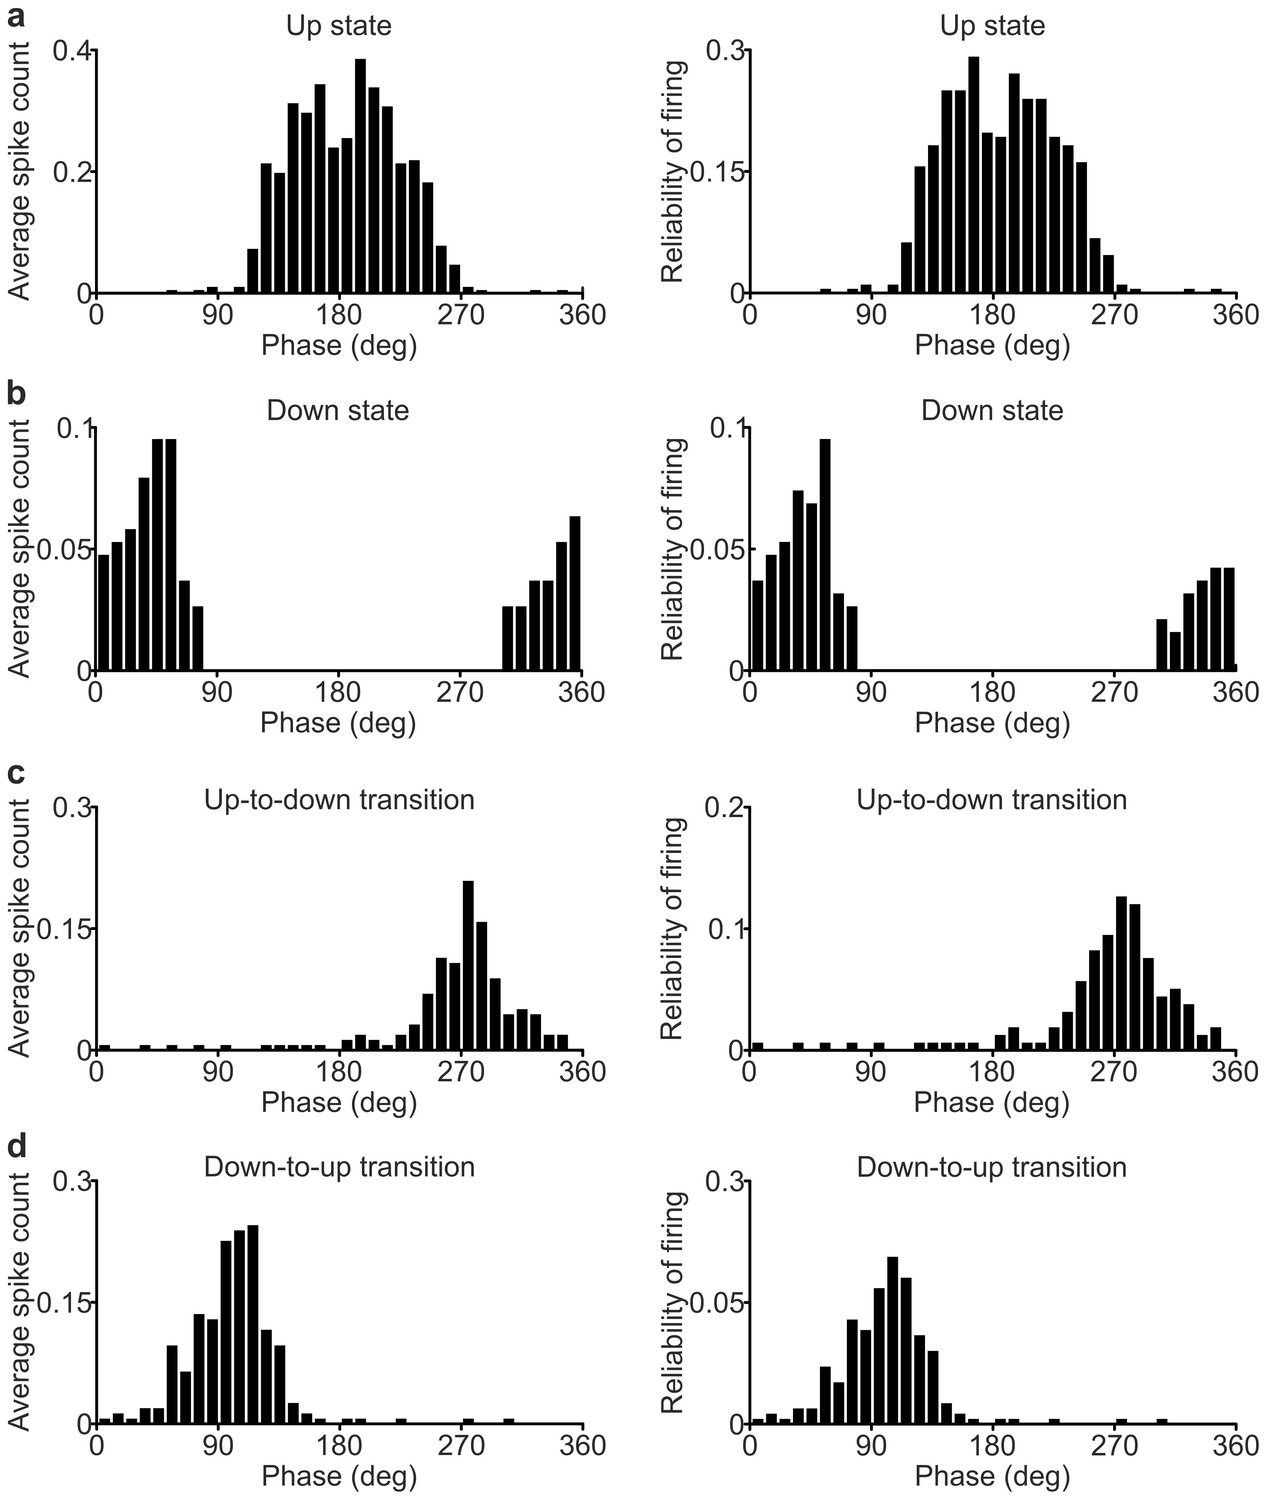
Phase of firing strength and phase of firing reliability in PV interneurons.
(a) Histogram of the phase of firing strength (left) and histogram of the phase of firing reliability (right) for the representative PV interneuron showed in Figure 2b. Only spikes occurring during up states were considered. (b–d) Same as in a for spikes fired during down states (b), up-to-down transitions (c) and down-to-up transitions (d).
Figure 2—figure supplement 2
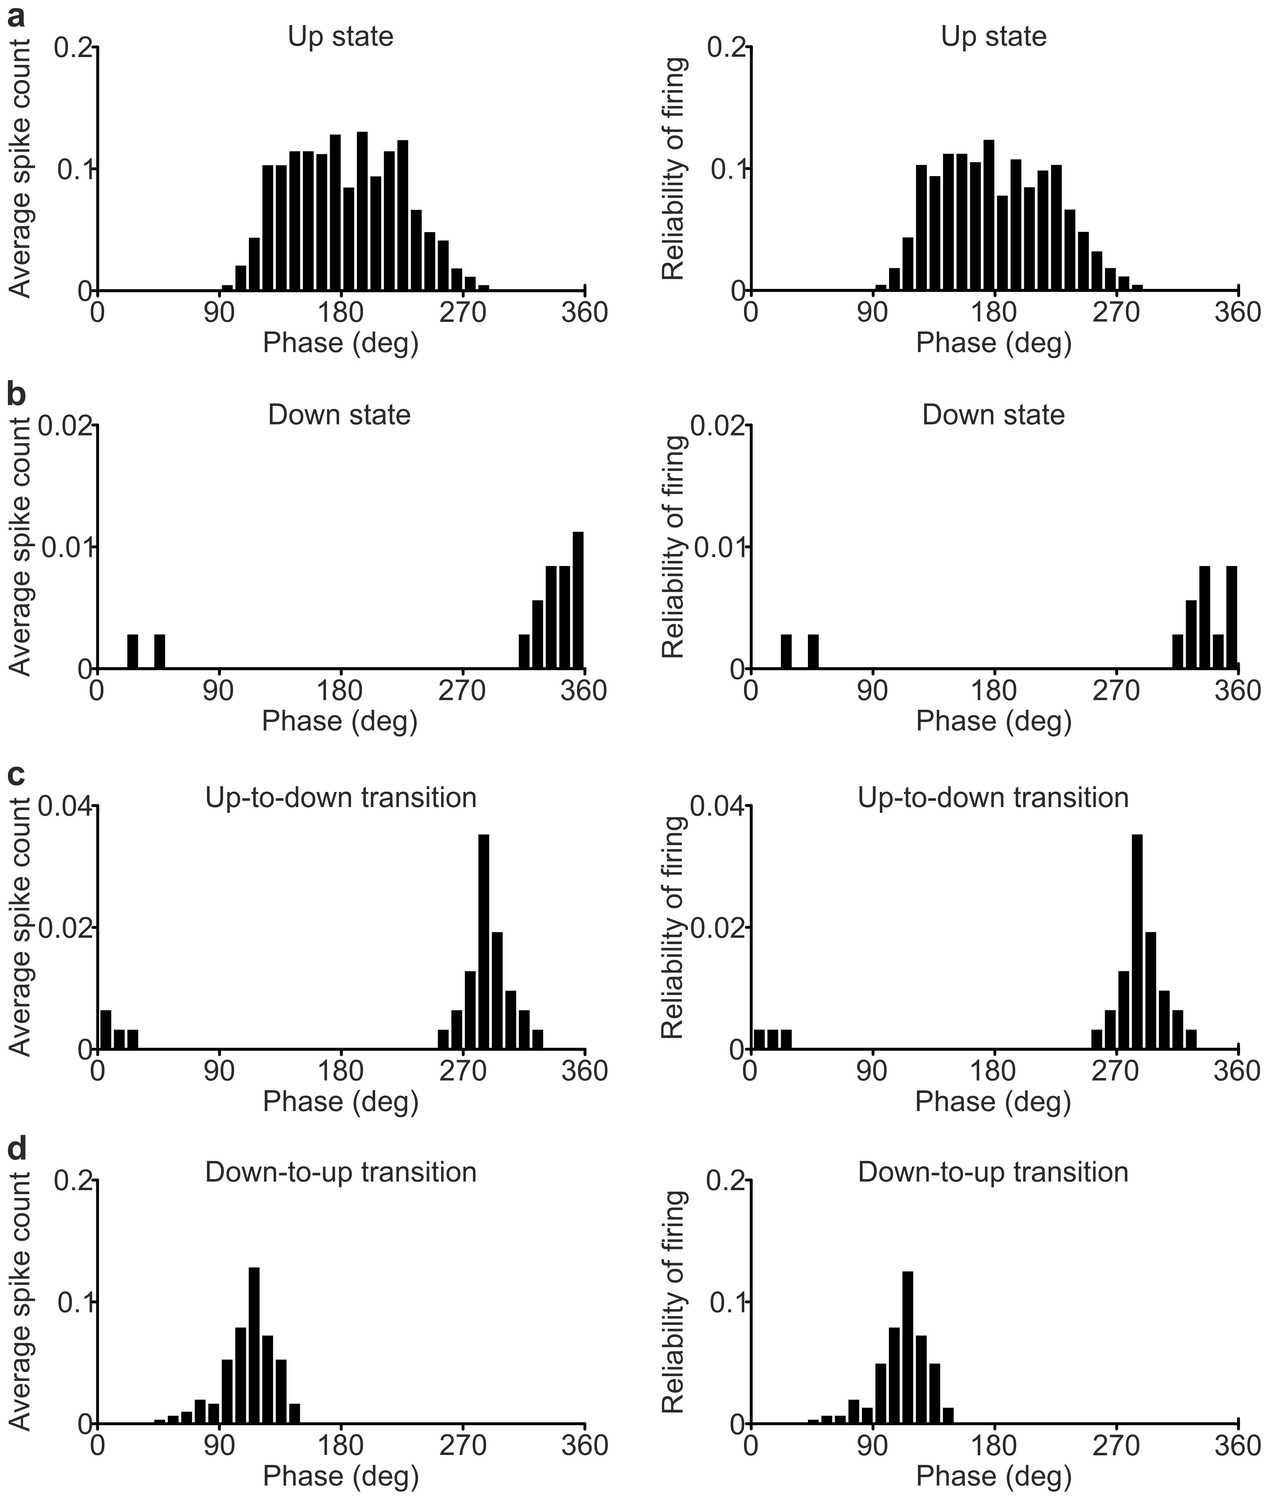
Phase of firing strength and phase of firing reliability in SST interneurons.
(a) Histogram of the phase of firing strength (left) and histogram of the phase of firing reliability (right) for the representative SST interneuron showed in Figure 2h. Only spikes occurring during up states were considered. (b–d) Same as in a for spikes fired during down states (b), up-to-down transitions (c) and down-to-up transitions (d).
Figure 2—figure supplement 3
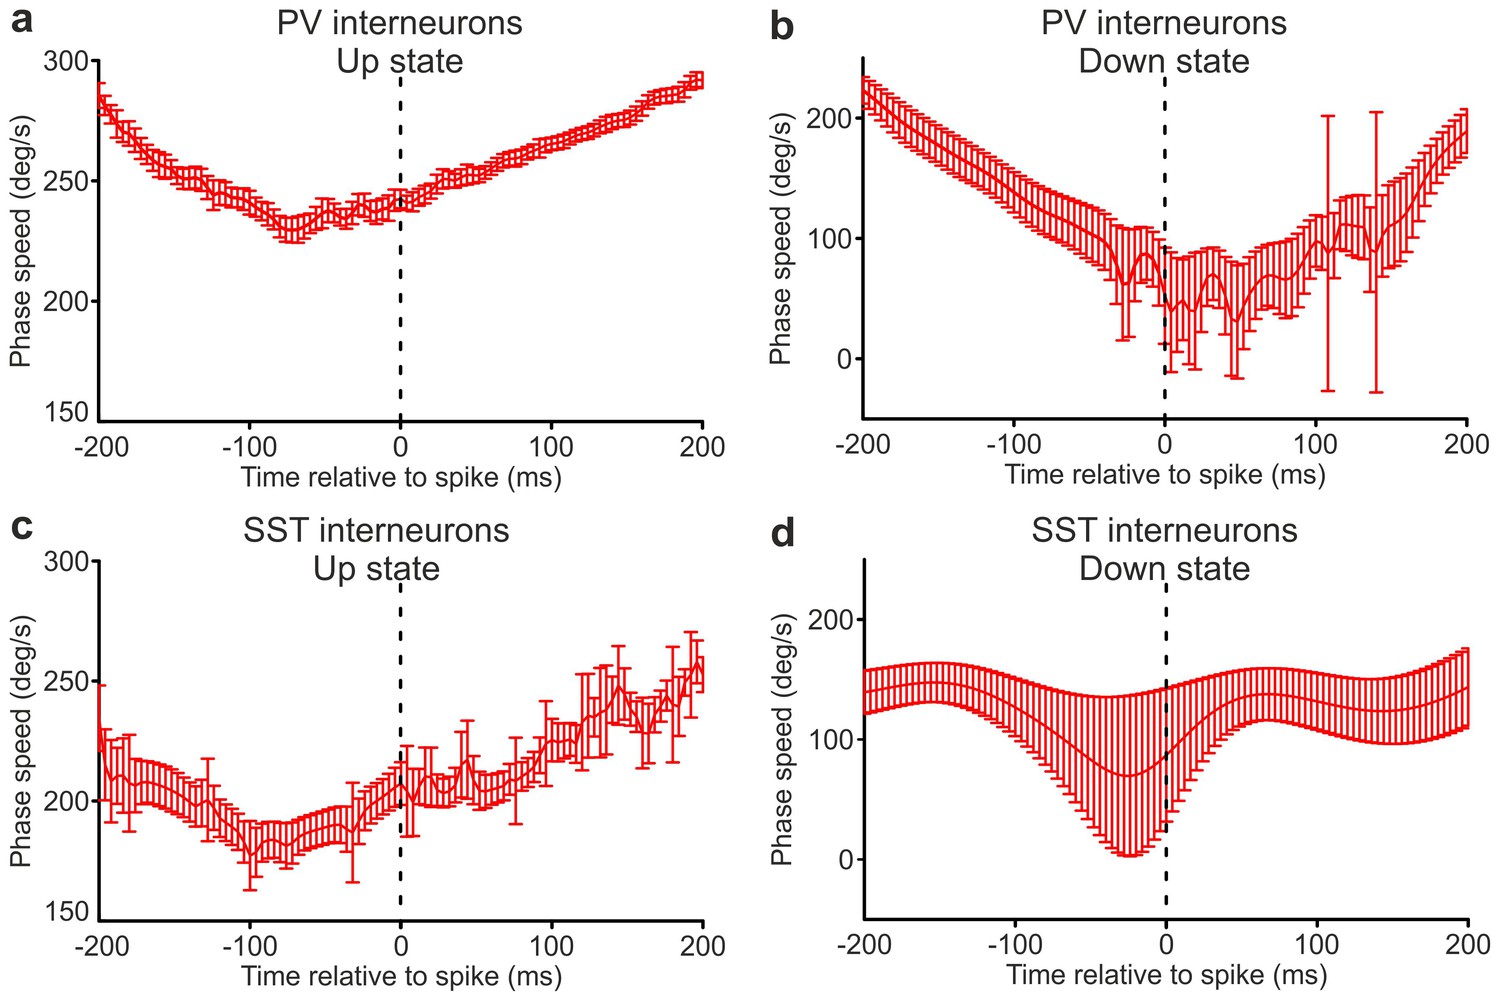
Spike-triggered phase speed across the times of interneuron spikes close to state end.
(a) Phase speed of the recorded LFP (mean ± s.e.m.) triggered on a PV interneuron spike that was fired between 400 and 200 ms before the end of an up state, as a function of time. The spikes were selected with the only criterion that the entire stretch of considered phase speed lays within the same up state. (b) Same as in a, but the phase speed corresponds to down states. (c–d) as in a-b, but the analysed phase speed was triggered on SST interneuron spikes.
Figure 2—figure supplement 4
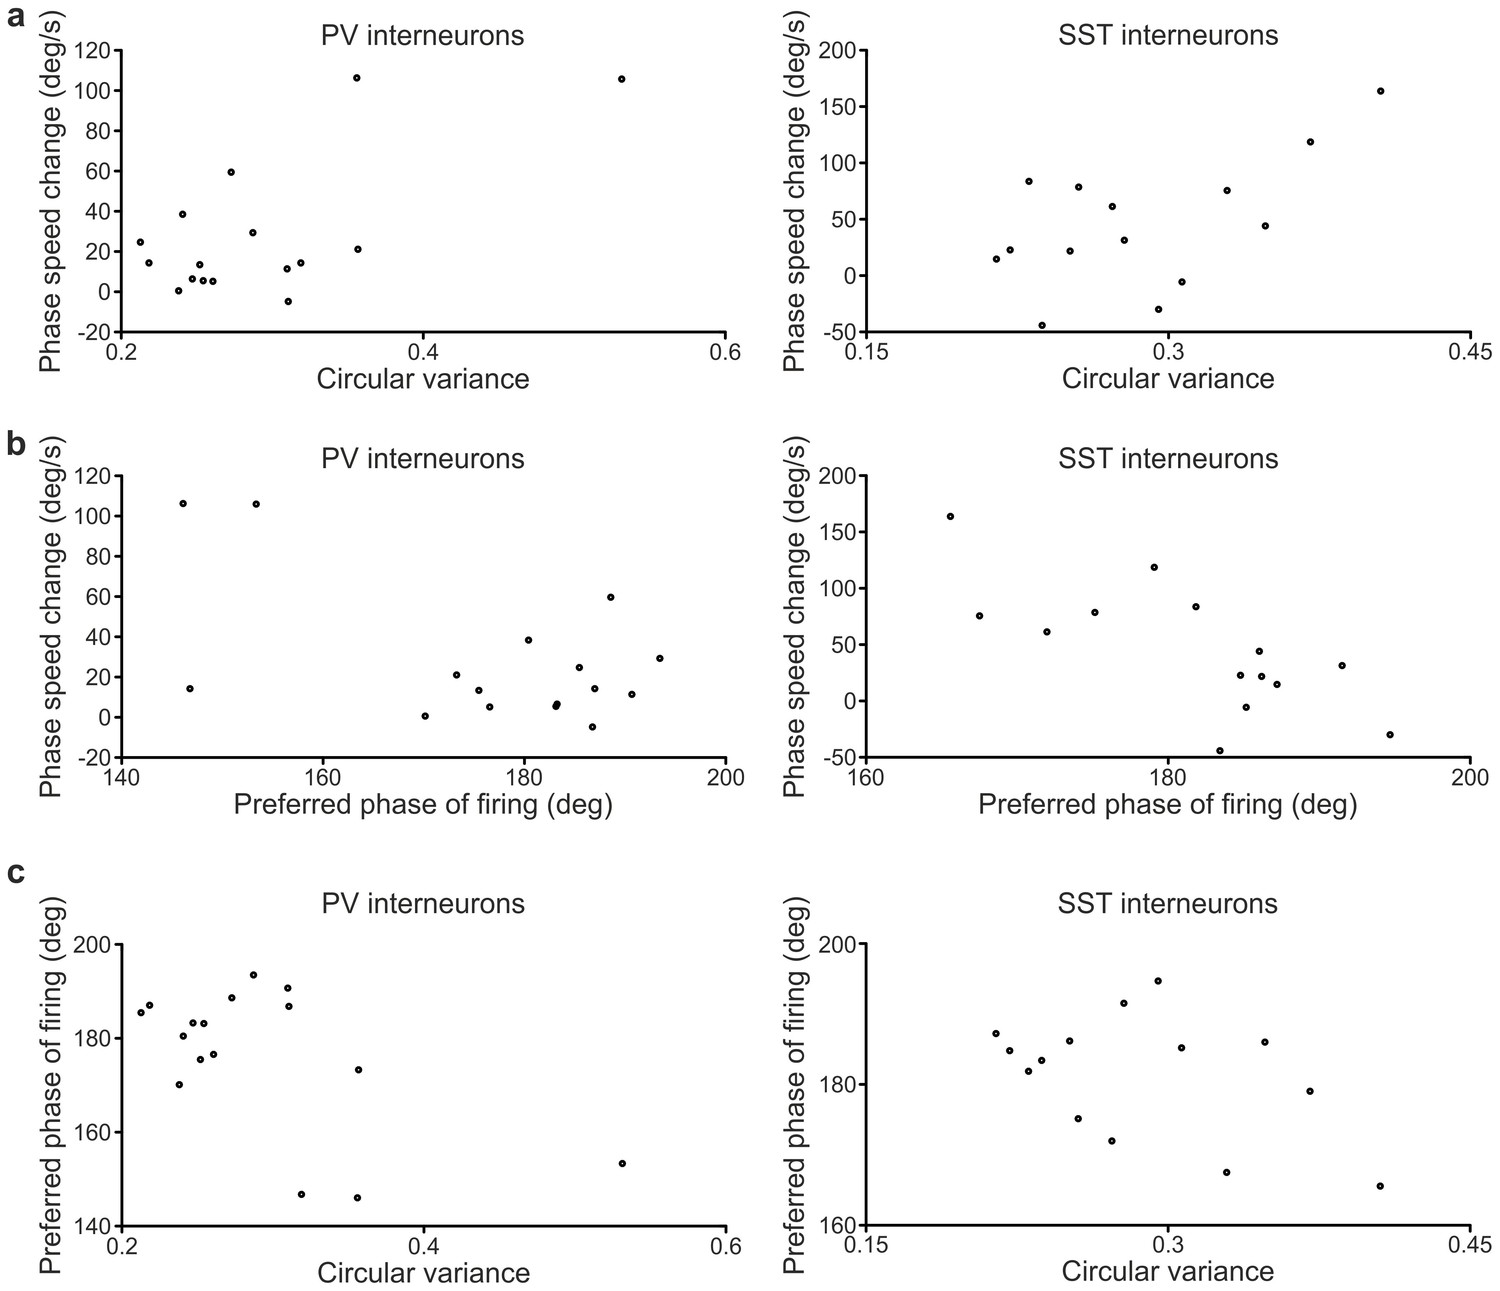
Correlation between LFP phase speed changes and firing properties of cortical interneurons.
(a) Plots of the LFP phase speed changes triggered by spikes close to the end of up states as a function of the circular variance of the phases of firing distributions in up states for PV (left) and SST (right) interneurons. Each dot represents one recorded cell. In this as well as in the other panels, only cells with at least ten data stretches (see Materials and methods) in the up state were considered. (b) LFP phase speed changes triggered by spikes close to the end of up states as a function of the preferred phase of firing in up states of PV (left) and SST (right) cells. (c) Correlation plots between the preferred phase of firing for PV (left) and SST (right) interneurons and the circular variance of the phases of firing distributions in up states.
Figure 3 with 6 supplements
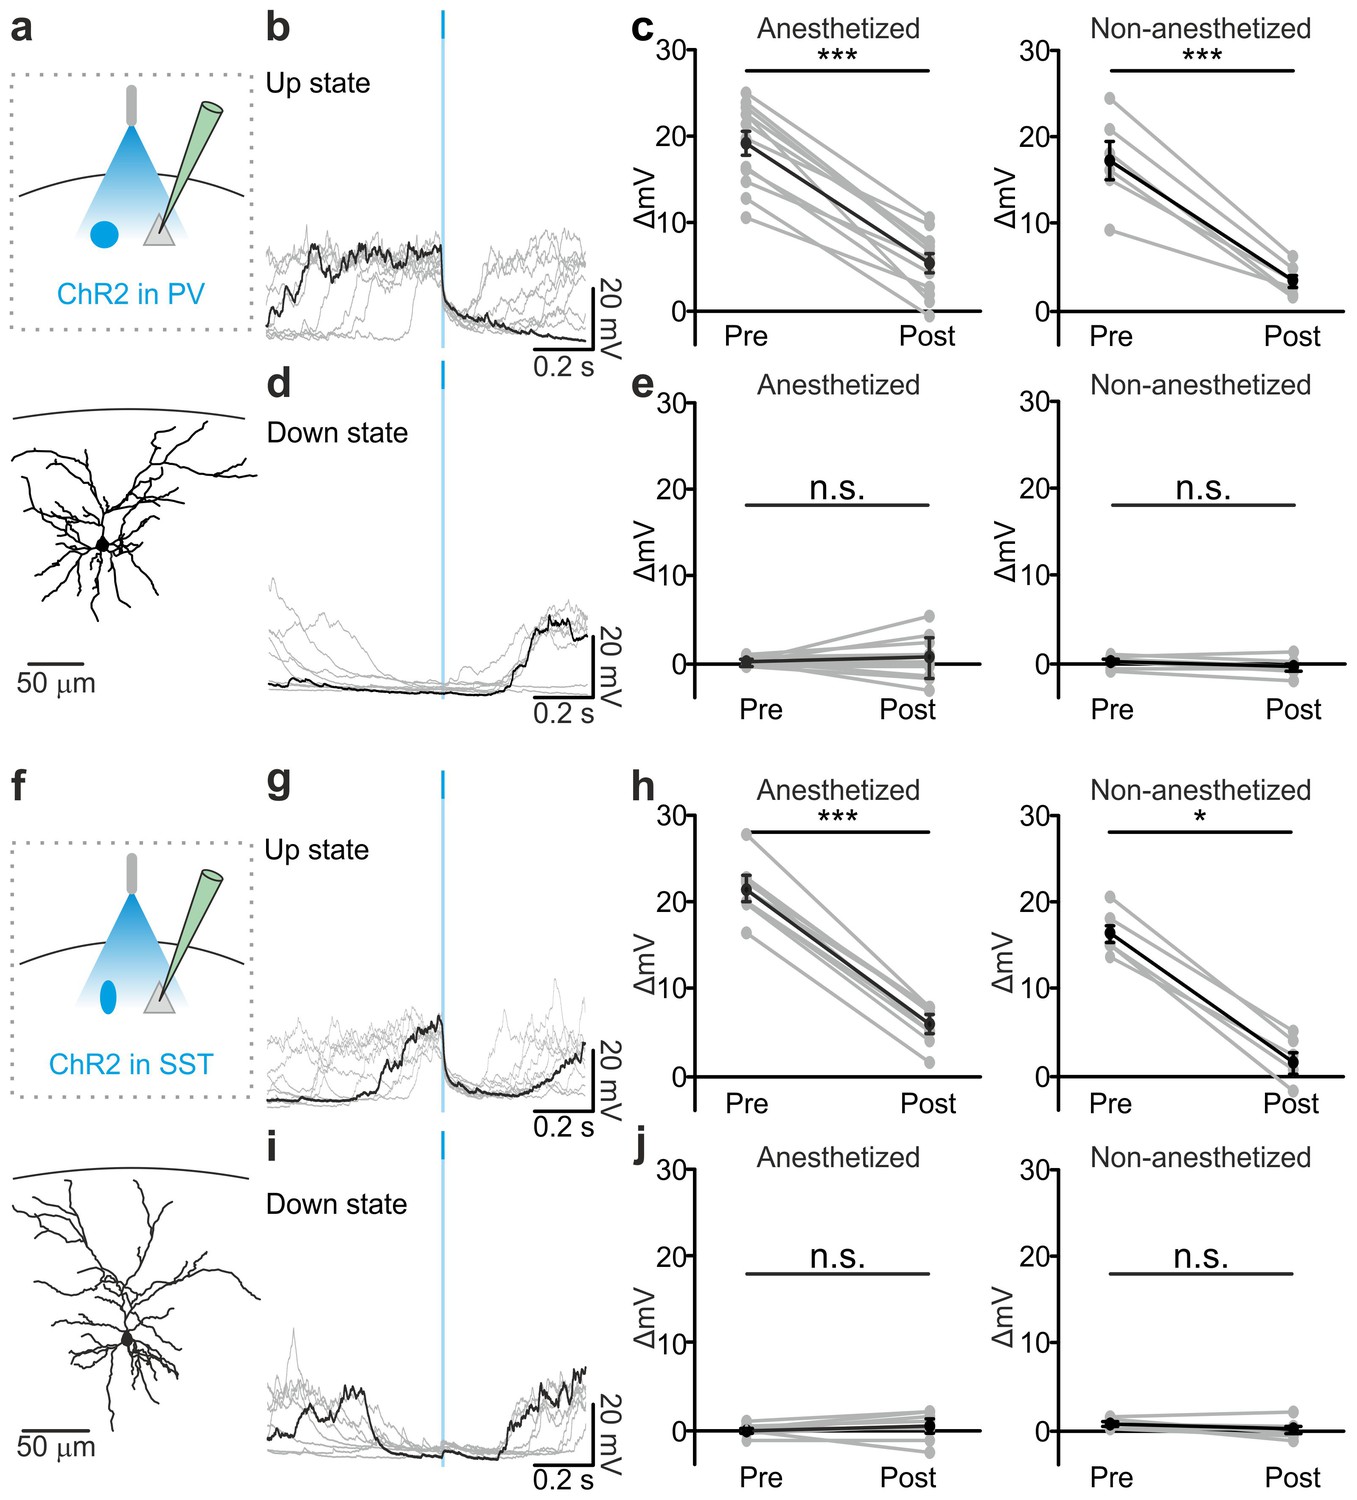
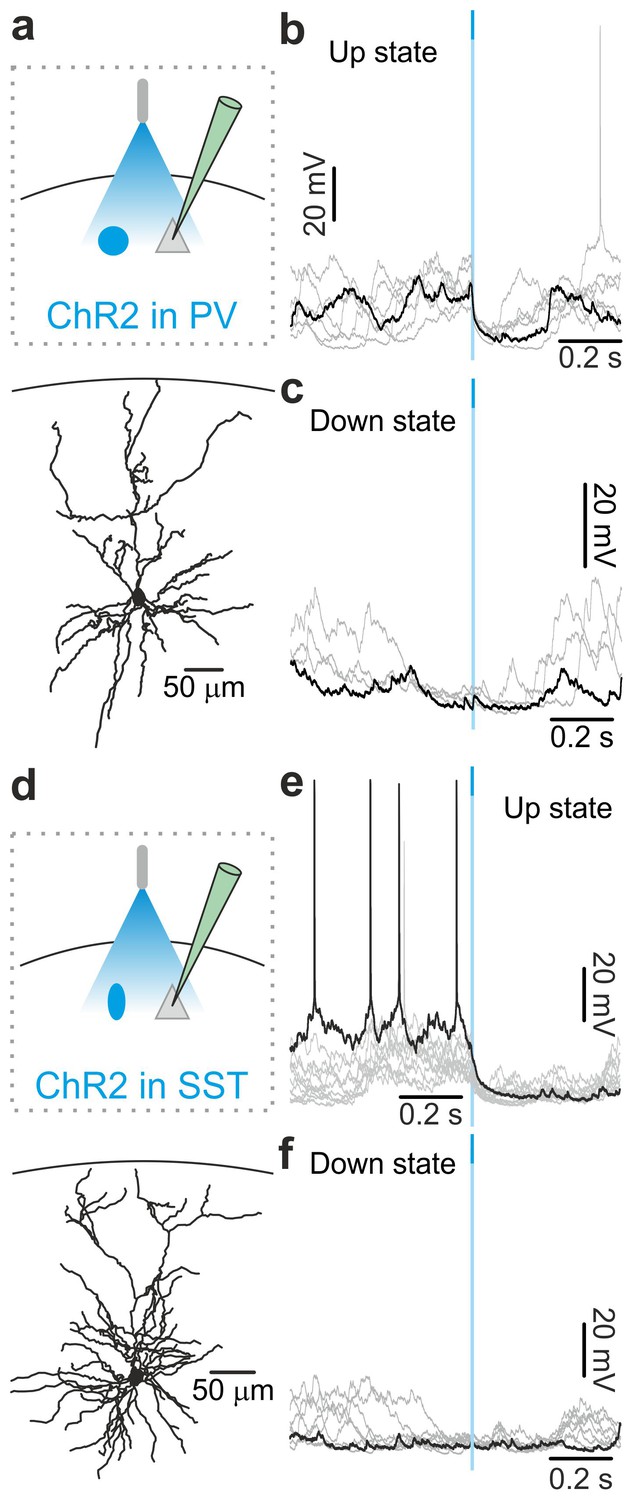
Optogenetic activation of PV and SST interneurons triggers up-to-down transitions.
(a) Top: schematic of the experimental configuration. ChR2 is expressed in PV cells (blue round circle) and intracellular recordings are performed from pyramidal neurons (grey triangle). Bottom: morphological reconstruction of one recorded layer II/III pyramidal neuron. (b) Representative intracellular recordings showing the effect of PV interneuron activation when light (blue line) was delivered during an ongoing up state. Ten different trials are shown (one in black and the other in grey). (c) Change in the membrane potential of recorded cells (ΔmV) before (Pre) and after (Post) PV interneuron activation during an ongoing up state in anesthetized (left) and non-anesthetized (right) mice. Left, p = 7E-8, paired Student’s t-test, N = 12 cells from seven animals; right, p = 5E-4, paired Student’s t-test, N = 6 cells from three animals. (d–e) Same as in b-c but for PV activation during ongoing down states. In e: left, p = 5E-1, paired Student’s t-test, N = 12 cells seven animals; right, p = 7E-2, paired Student’s t-test, N = 6 cells from three animals. (f–j) Same as in a-e but for photoactivation of SST interneurons. In h: left, p = 1E-8, paired Student’s t-test, N = 9 cells from six animals; right, p = 3E-2, Wilcoxon signed rank test, N = 6 cells from three animals. In j: left, p = 2E-1, paired Student’s t-test, N = 9 cells from six animals; right, p = 2E-1, paired Student’s t-test, N = 6 cells from three animals.
-
Figure 3—source data 1
Source data for the analysis of membrane potential changes during photostimulation of PV or SST interneurons.
- https://doi.org/10.7554/eLife.26177.014
Figure 3—figure supplement 1
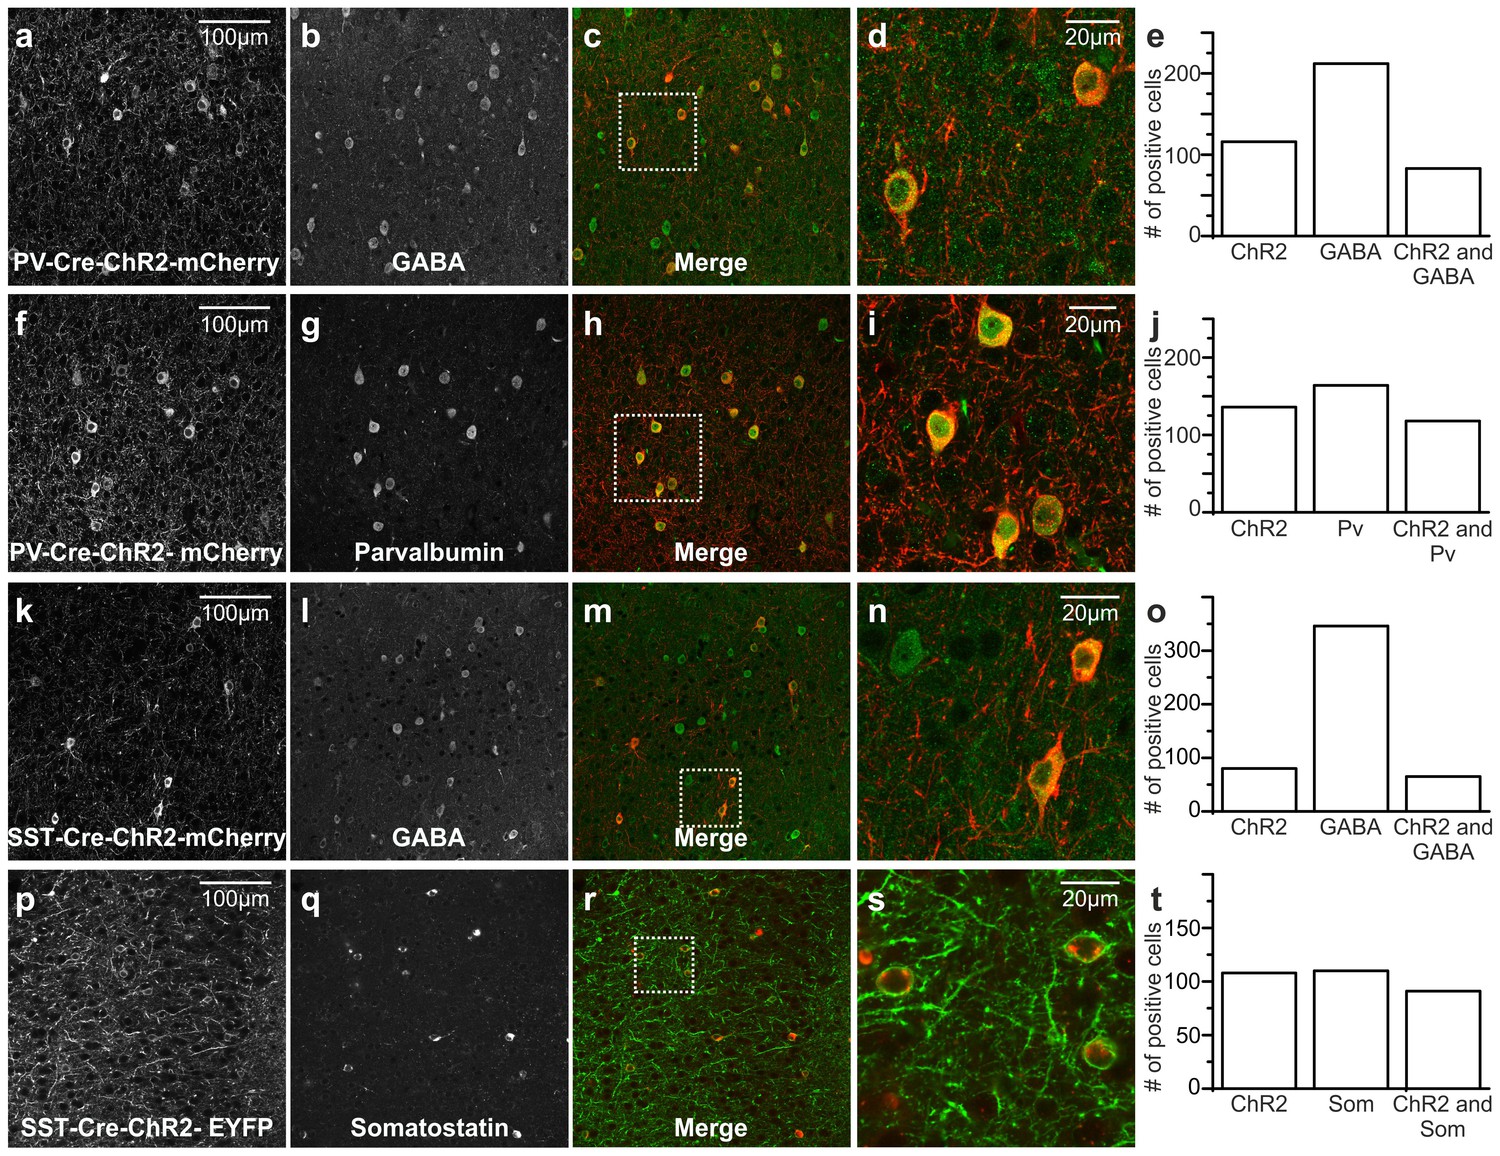
Immunohistochemical analysis of ChR2 positive cells in PV- and SST-Cre animals.
(a–d) Confocal images of coronal cortical sections from a PV-Cre animal injected with AAV trasducing ChR2-mCherry. ChR2 positive cells (shown in a) largely stain for GABA (shown in b). ChR2-mCherry and GABA stainings are shown merged in c and the zoom of the region within the white square box is reported in d. (e) Total number of ChR2-positive, GABA-positive and ChR2 and GABA-positive neurons in PV-Cre injected mice (N = 4 animals, three sections per animal). (f–i) Same as in a-d but with a fluorescence immunostaining for parvalbumin. (j) Same as in e but for immunostaining for parvalbumin positive neurons (N = 4 animals, three sections per animal). (k–t) Same as in a-j but for SST-Cre animal injected with AAV trasducing ChR2-mCherry. In o, N = 4 animals, three sections per animal. In t, N = 4 animals, three sections per animal.
-
Figure 3—figure supplement 1—source data 1
Source data for the immunohistochemical analysis of ChR2 positive cells in PV-Cre and SST-Cre injected mice.
- https://doi.org/10.7554/eLife.26177.016
Figure 3—figure supplement 2
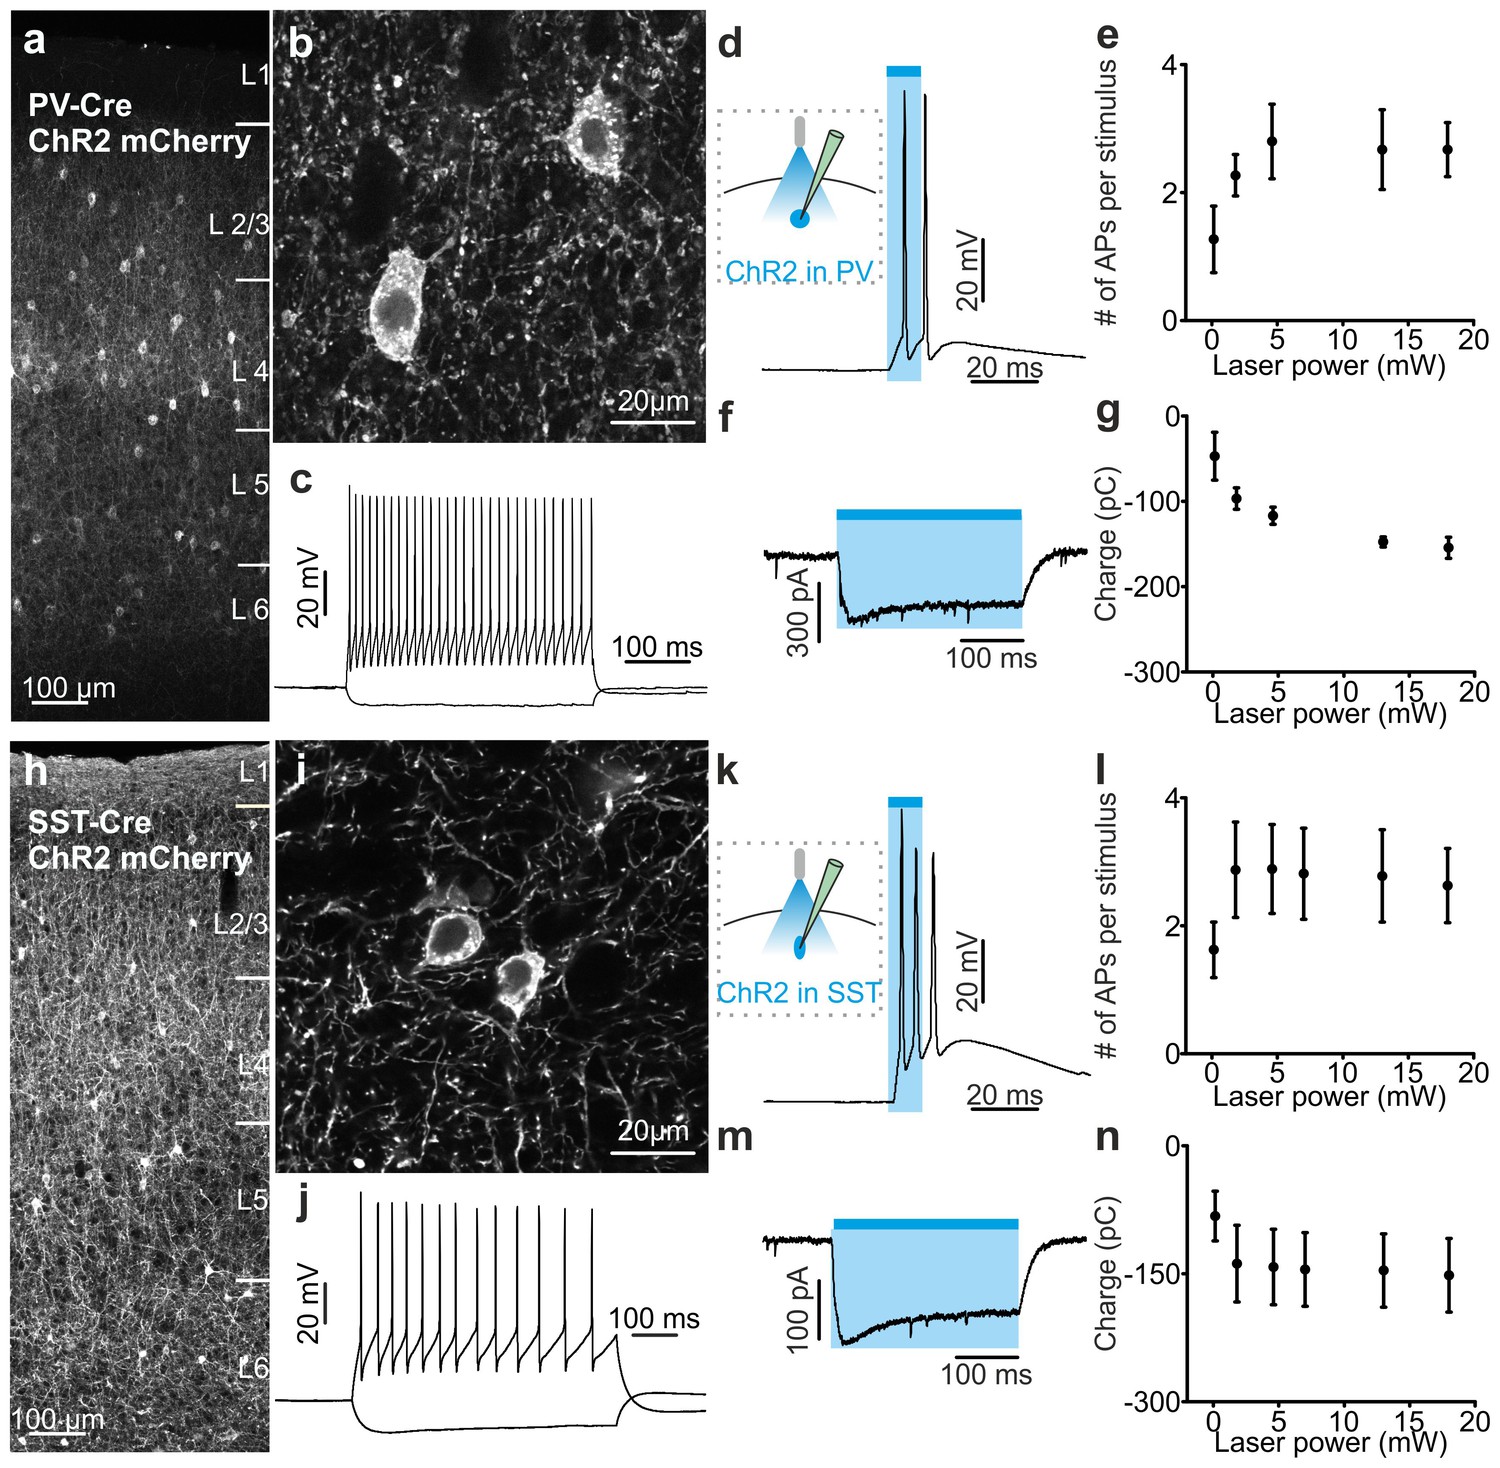
Functional analysis of PV and SST positive cells expressing ChR2.
(a–b) Confocal images of one coronal cortical section showing the expression of ChR2-mCherry in PV-Cre mice. Cells are shown at an expanded time scale in b. (c) Representative current-clamp patch-clamp recordings in slices, showing the typical firing pattern of a PV cell positive for ChR2. (d) Left: schematic configuration for intracellular recordings from PV interneurons expressing ChR2 in coronal slices. Right: membrane depolarization and action potential (AP) firing in response to a 10 ms pulse of light. (e) Number of APs fired as a function of the light intensity (N = 5 cells from two animals). (f) Voltage-clamp patch-clamp recording showing the photocurrent evoked in response to 300 ms of light stimulus. (g) Quantification of the total amount of net charge passing through the cell membrane as a function of the light intensity (N = 3 cells from two animals). (h–n) Same as in a-g but for SST cells positive for ChR2. In l, N = 9 cells from three animals. In n, N = 5 cells from two animals.
-
Figure 3—figure supplement 2—source data 1
Source data for the functional characterization of PV and SST interneurons expressing ChR2.
- https://doi.org/10.7554/eLife.26177.018
Figure 3—figure supplement 3
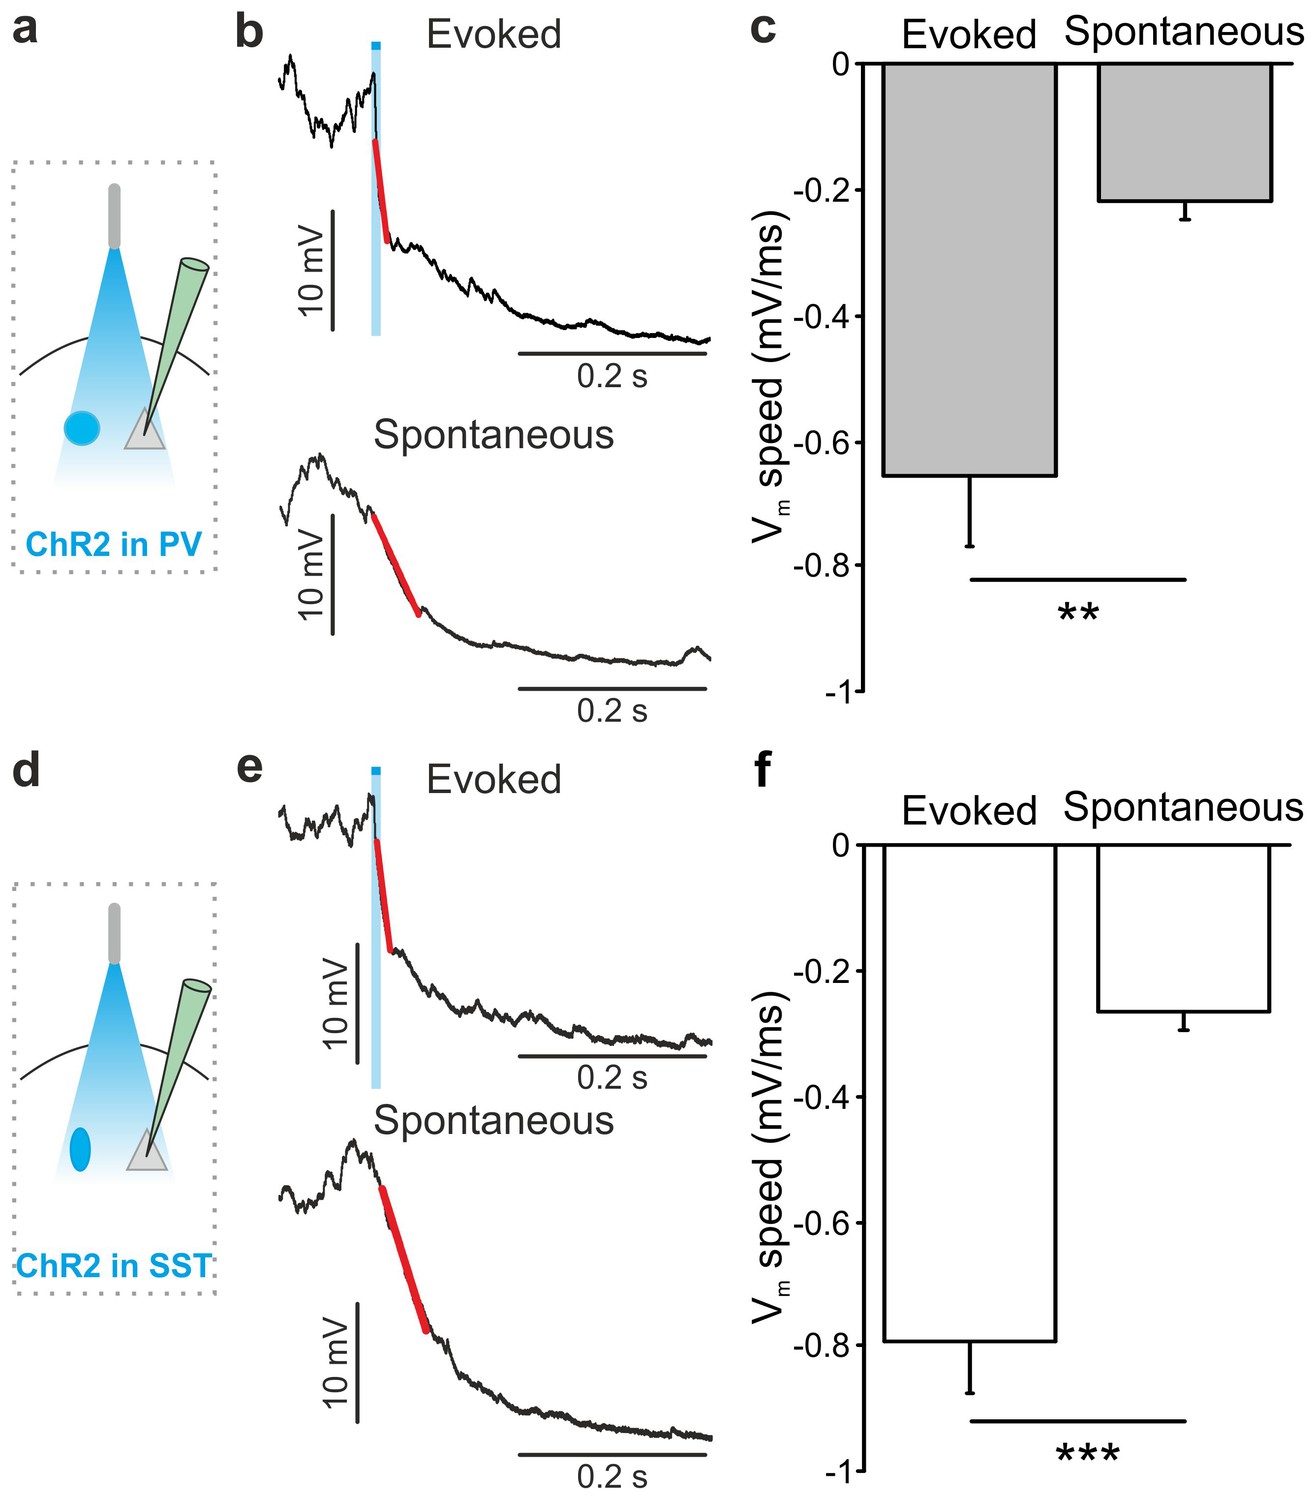
Membrane potential speed in pyramidal neurons during optogenetically-evoked and spontaneous up-to-down state transitions.
(a) Schematic of the experimental configuration. (b) Representative intracellular recording showing an up-to-down state transition evoked by optogenetic activation (blue bar) of PV interneurons (top) or spontaneously occurring (bottom). A linear fit (red line) was used to evaluate membrane potential speed during the transition. (c) Average membrane potential speed in pyramidal neurons during optogenetically-triggered and spontaneous up-to-down state transitions (paired Student’s t-test, N = 12 cells from seven animals, p = 2E-3). (d–f) Same as in a-c but for optogenetic activation of SST interneurons (evoked vs spontaneous, paired Student’s t-test, N = 9 cells from six animals, p = 5E-4). The slope of optogenetically-evoked transitions was not significantly different when SST and PV cells were stimulated (SST vs PV, Student’s t-test, N = 9 cells and N = 12 respectively, p = 4E-1).
-
Figure 3—figure supplement 3—source data 1
Source data for the analysis of membrane potential speed during optogenetically-evoked and spontaneous up-to-down state transitions.
- https://doi.org/10.7554/eLife.26177.020
Figure 3—figure supplement 4
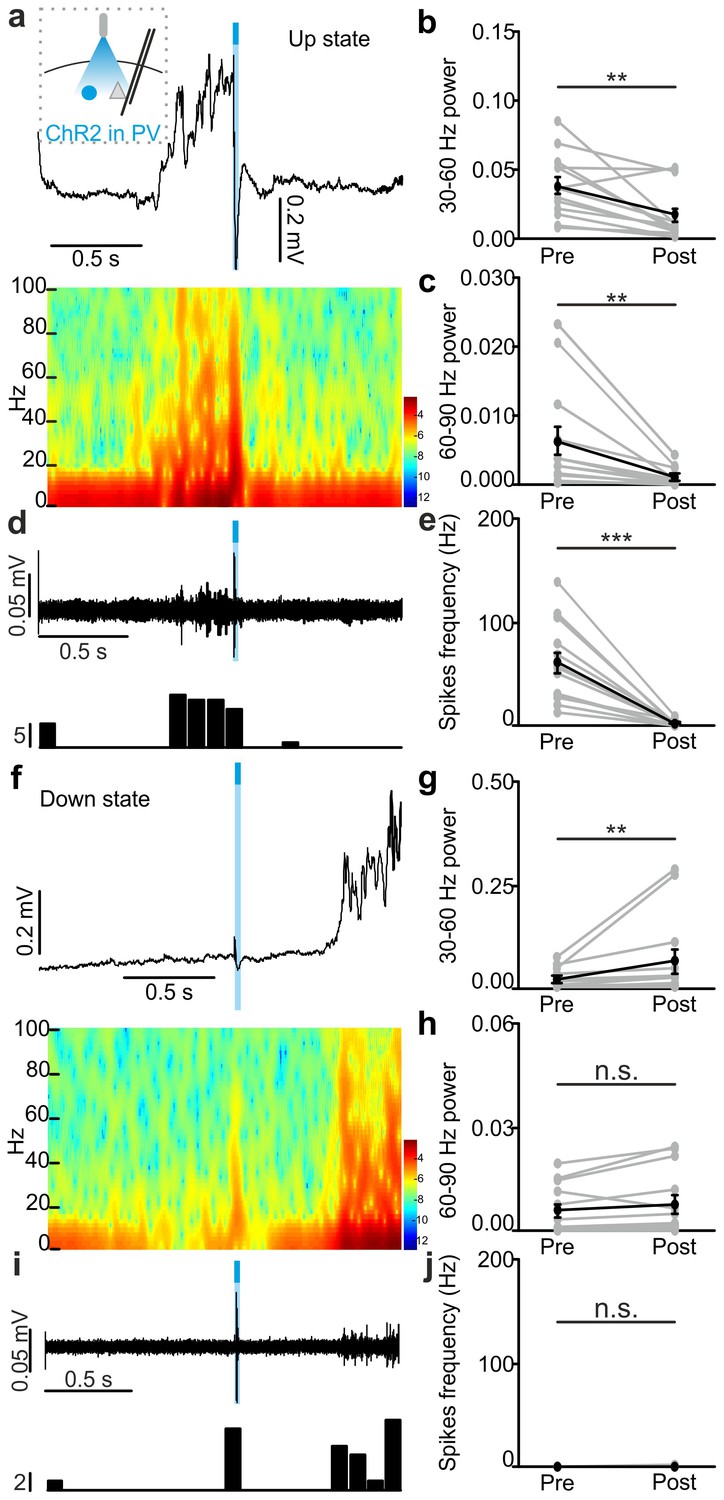
In vivo extracellular recordings of spontaneous cortical dynamics and photostimulation of PV positive interneurons expressing ChR2.
(a) Representative trace of an in vivo LFP recording (top) and corresponding spectrogram (bottom) showing the effect of optogenetic activation of PV interneurons during an ongoing up state. The schematic of the experimental configuration is shown in the inset (top panel). (b–c) Average power in the 30–60 (b) and 60–90 (c) Hz frequency band before (Pre), and after (Post) light stimulation. Power values are normalized to the total power in the ‘Pre’ time window. In b, p = 2E-3, Wilcoxon signed-rank test, N = 13 animals. In c, p = 4E-3, Wilcoxon signed-rank test, N = 13 animals. (d) Top: multi-unit signal corresponding to the trace showed in a. Bottom: peri-stimulus time histogram (PSTH) of the trace showed in the top panel. (e) Average firing frequency of spikes (Hz) recorded in the multi-unit signal before (Pre) and after (Post) light stimulus (p = 2E-4, Wilcoxon signed-rank test, N = 13 animals). (f–j) Same as in a-e but for optogenetic activation of PV interneurons during an ongoing down state. In g, p = 5E-3, Wilcoxon signed-rank test, N = 13 animals. In h, p = 5E-2, Wilcoxon signed-rank test, N = 13 animals. In j, p = 3E-1, Wilcoxon signed-rank test, N = 13 animals.
-
Figure 3—figure supplement 4—source data 1
Source data for the effect of PV photoactivation during up states on network activity.
- https://doi.org/10.7554/eLife.26177.022
-
Figure 3—figure supplement 4—source data 2
Source data for the effect of PV photoactivation during down states on network activity.
- https://doi.org/10.7554/eLife.26177.023
Figure 3—figure supplement 5
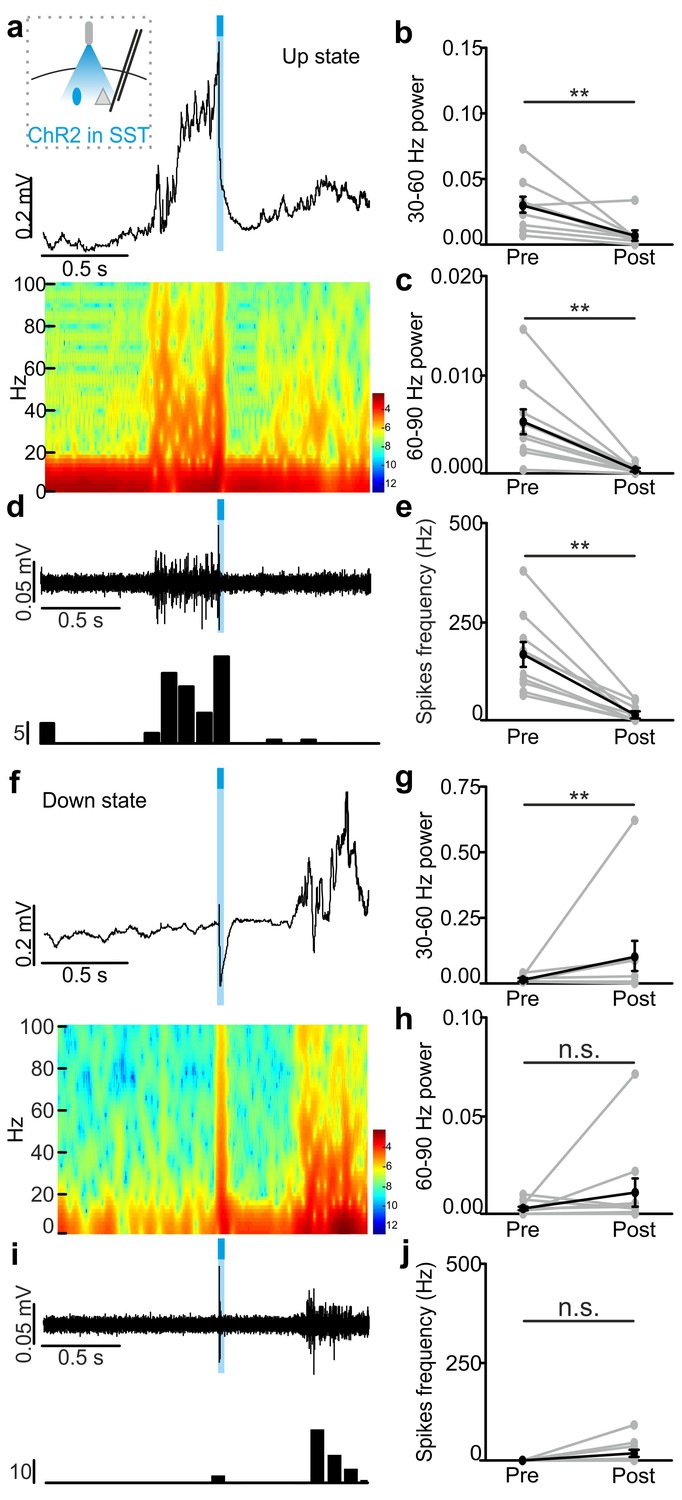
In vivo extracellular recordings of spontaneous cortical dynamics and photostimulation of SST positive interneurons expressing ChR2.
(a) Representative trace of an in vivo LFP recording (top) and corresponding spectrogram (bottom) showing the effect of optogenetic activation of SST interneurons expressing ChR2 during an ongoing up state. The schematic of the experimental configuration is shown in the inset (top panel). (b–c) Average power in the 30–60 (b) and 60–90 (c) Hz frequency band before (Pre), and after (Post) light stimulation. Power values are normalized to the total power in the ‘pre’ time window. In b, p = 4E-3, Wilcoxon signed-rank test, N = 10 animals. In c, p = 9E-3, Wilcoxon signed-rank test, N = 10 animals. (d) Multi-unit signal (top) and corresponding PSTH (bottom) related to the trace showed in a. (e) Average firing frequency of spikes (Hz) recorded in the multi-unit signal before (Pre) and after (Post) light stimulus (p = 2E-3, Wilcoxon signed-rank test, N = 10 animals). (f–j) Same as in a-e but for optogenetic activation of SST interneurons during an ongoing down state. In g, p = 8E-3, Wilcoxon signed-rank test, N = 10 animals. In h, p = 6E-1, Wilcoxon signed-rank test, N = 10 animals. In j, p = 1E-1, Wilcoxon signed-rank test, N = 10 animals.
-
Figure 3—figure supplement 5—source data 1
Source data for the effect of SST photoactivation during up states on network activity.
- https://doi.org/10.7554/eLife.26177.025
-
Figure 3—figure supplement 5—source data 2
Source data for the effect of SST photoactivation during down states on network activity.
- https://doi.org/10.7554/eLife.26177.026
Figure 3—figure supplement 6
In vivo intracellular recordings of spontaneous cortical dynamics and photostimulation of PV or SST positive interneurons in non-anesthetized animals.
(a) Top: schematic of the experimental configuration. Bottom: morphological reconstruction of a recorded layer II/III pyramidal neuron. (b) Representative intracellular recordings showing the effect of PV interneuron activation on the membrane potential of the recorded pyramidal neuron when light (blue line) was delivered during ongoing up states in a non-anesthetized mouse. (c) Same as in b but for photoactivation of PV interneurons during down states. (d–f) Same as in a-c but in mice expressing ChR2 in SST interneurons.
Figure 4 with 4 supplements
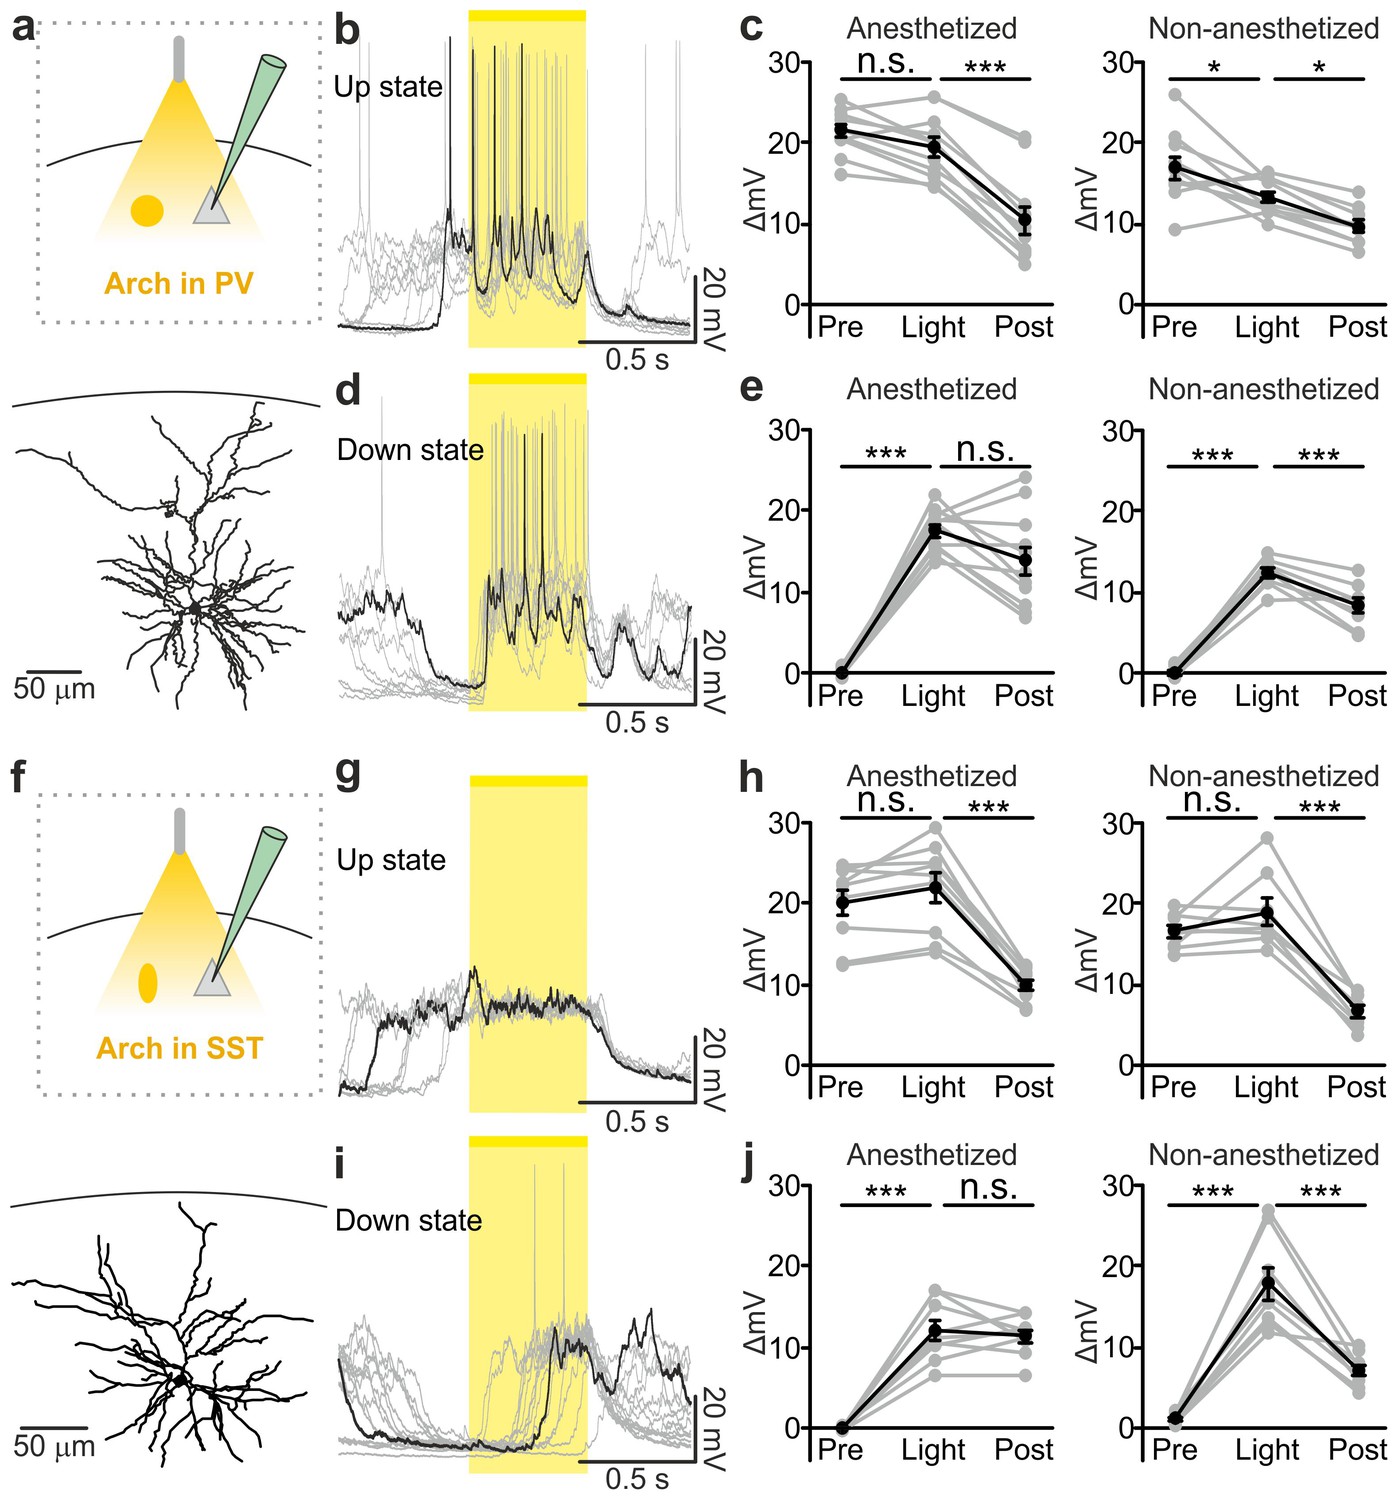
Optogenetic inhibition of PV and SST cells prolongs the up state and triggers down-to-up transitions.
(a) Top: schematic of the experimental configuration. Bottom: morphological reconstruction of a representative recorded neuron. (b) Representative recordings from a pyramidal cell during optogenetic inhibition (yellow line) of PV interneurons during an up state. (c) Change in the membrane potential (ΔmV) of recorded neurons before (Pre), during (Light), and after (Post) optogenetic suppression of PV cells in anesthetized (left) and non-anesthetized (right) mice. Left: p = 3E-8, one-way ANOVA, N = 11 cells from four animals; right: p = 2E-8, one-way ANOVA, N = 10 cells from four animals. (d–e) Same as in b-c but for PV suppression during ongoing down states. In e: left, p = 7E-8, one-way ANOVA, N = 11 cells from four animals; right, p = 2E-6, one-way ANOVA, N = 8 cells from four animals. (f–j) Same as in a-e but for optogenetic inhibition of SST interneurons. In h: left, p = 1E-6, one-way ANOVA, N = 9 cells from five animals; right, p = 7E-7, one-way ANOVA, N = 8 cells from five animals. In j: left, p = 1E-6, one-way ANOVA, N = 9 cells from five animals; right, p = 2E-5, one-way ANOVA, N = 8 cells from five animals.
-
Figure 4—source data 1
Source data for the analysis of membrane potential changes during photoinhibition of PV or SST interneurons.
- https://doi.org/10.7554/eLife.26177.029
Figure 4—figure supplement 1
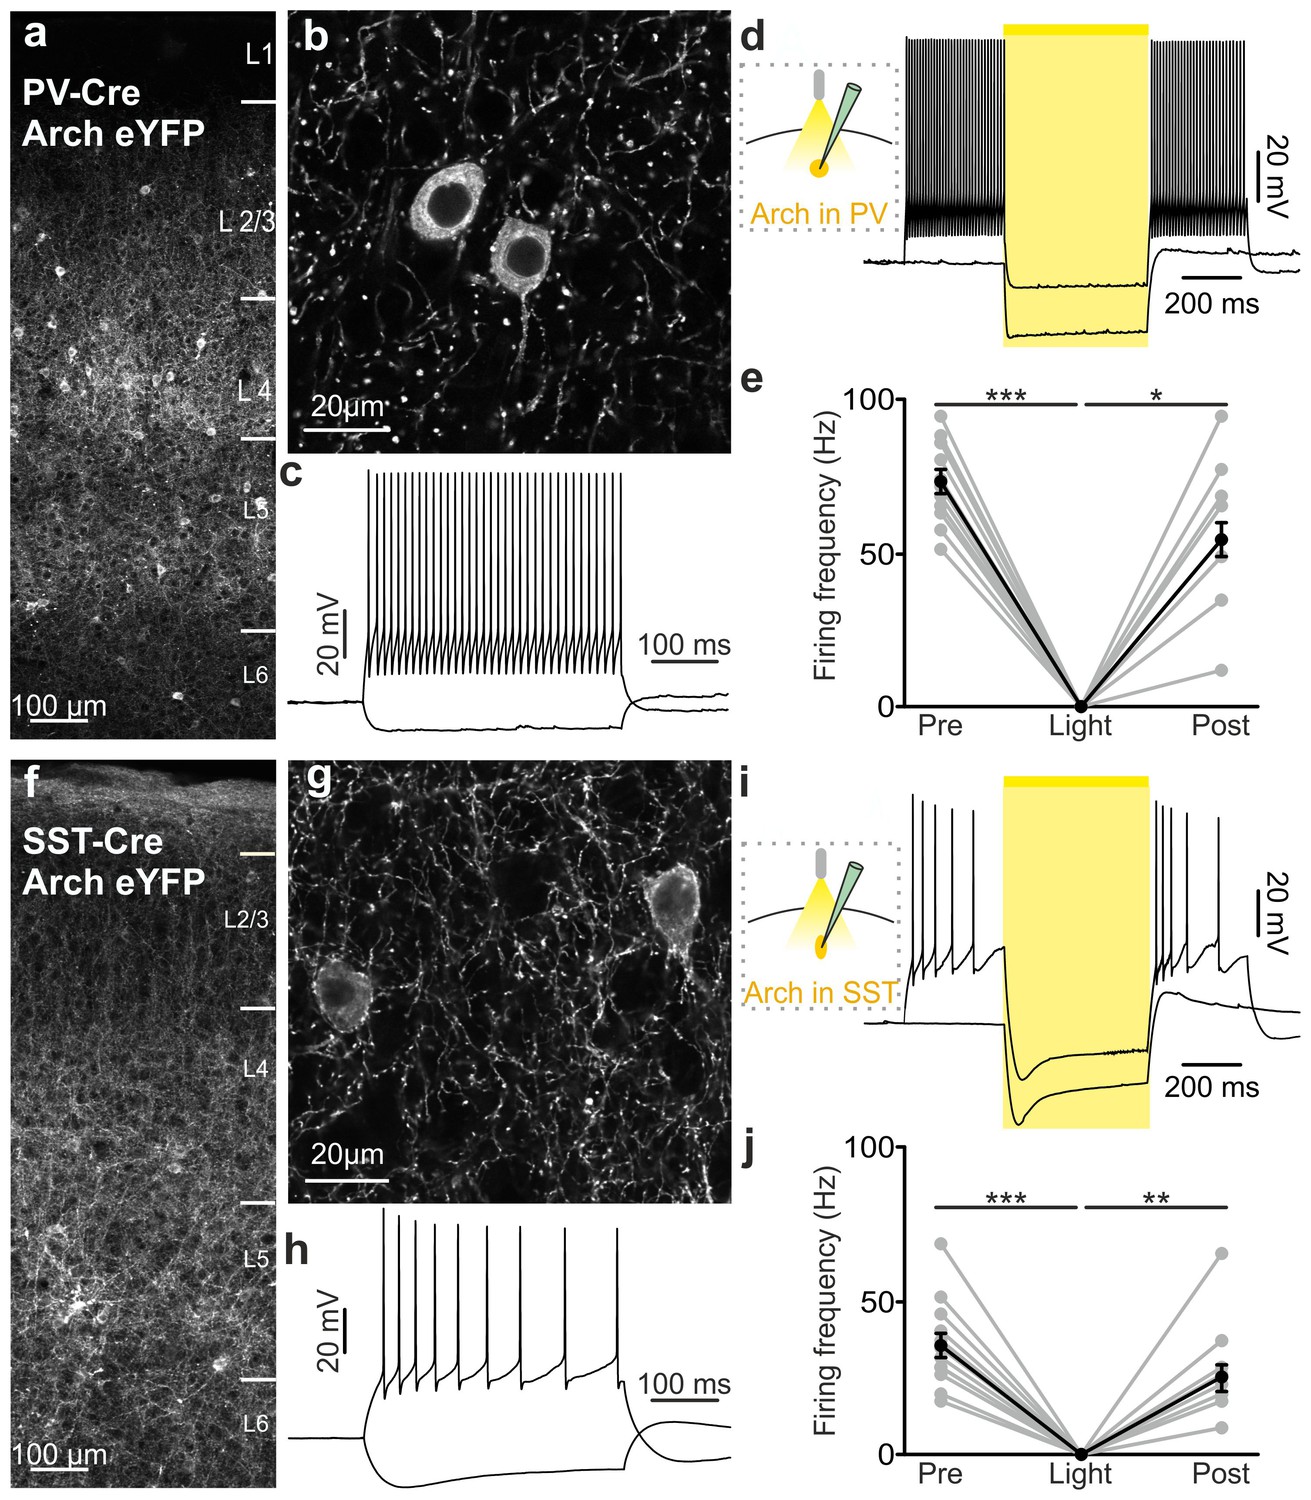
Functional analysis of PV and SST positive cells expressing Arch.
(a–b) Confocal images of coronal cortical sections showing the expression of Arch-eYFP in PV-Cre mice. (c) Representative current-clamp patch-clamp recordings in slices, showing the typical firing pattern of a PV cell that was also positive for Arch. (d) Left: schematic of the experimental configuration. Right: membrane potential response to 500 ms of light stimulation. AP discharge was induced by current injection. (e) Quantification of the average firing frequency before (Pre), during (Light), and after (Post) light stimulation (p = 9E-6, Friedman test, N = 13 cells from four animals). (f–j) Same as in a-e but for SST positive interneurons that express Arch. In j, p = 2E-5, Friedman test, N = 13 cells from six animals.
-
Figure 4—figure supplement 1—source data 1
Source data for functional characterization of PV and SST interneurons expressing Arch.
- https://doi.org/10.7554/eLife.26177.031
Figure 4—figure supplement 2
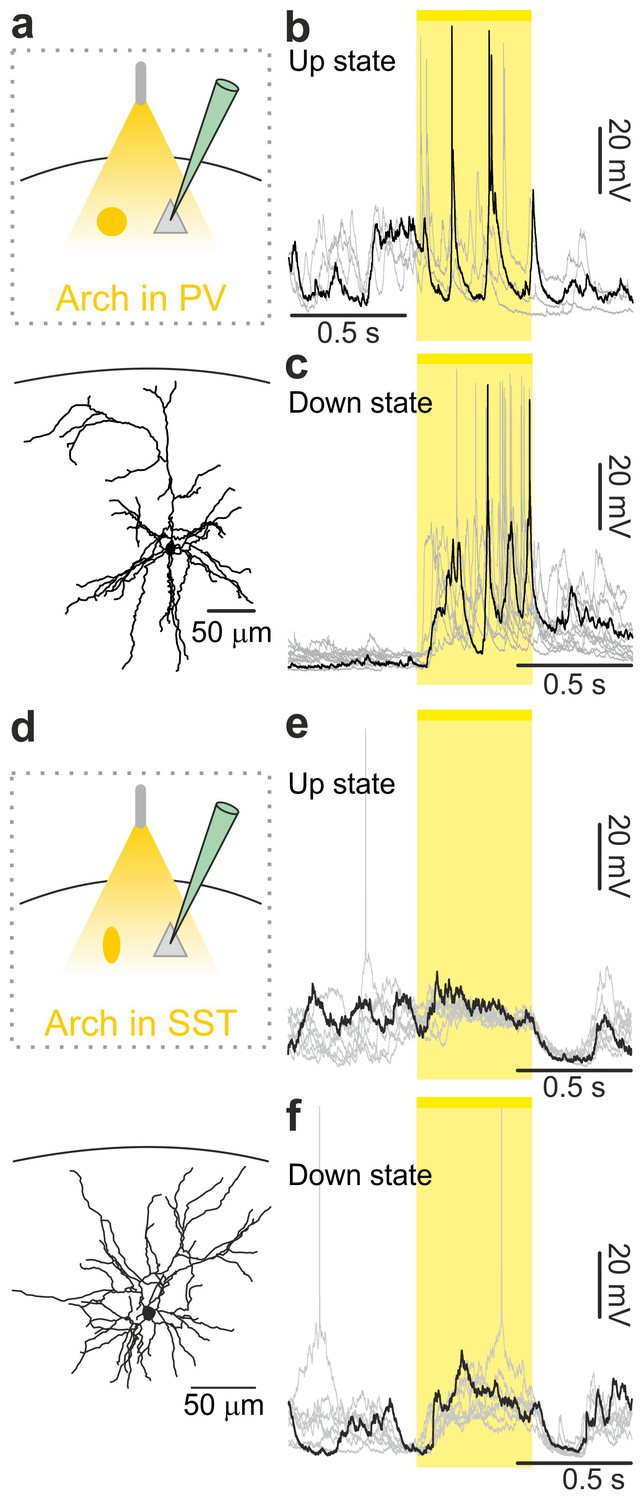
In vivo intracellular recordings of spontaneous cortical dynamics and photoinhibition of PV or SST positive interneurons in non-anesthetized animals.
(a) Top: schematic representation of the experimental configuration. Bottom: morphological reconstruction of a recorded layer II/III pyramidal neuron. (b) Representative intracellular recordings showing the effect of the optogenetic inhibition of PV interneurons on the membrane potential of the recorded pyramidal neuron when light (yellow line and shadow) was delivered during up states in a non-anesthetized mouse. (c) Same as in b but for optogenetic inhibition of PV interneurons during down states. (d–f) Same as in a-c but in mice expressing Arch in SST interneurons.
Figure 4—figure supplement 3
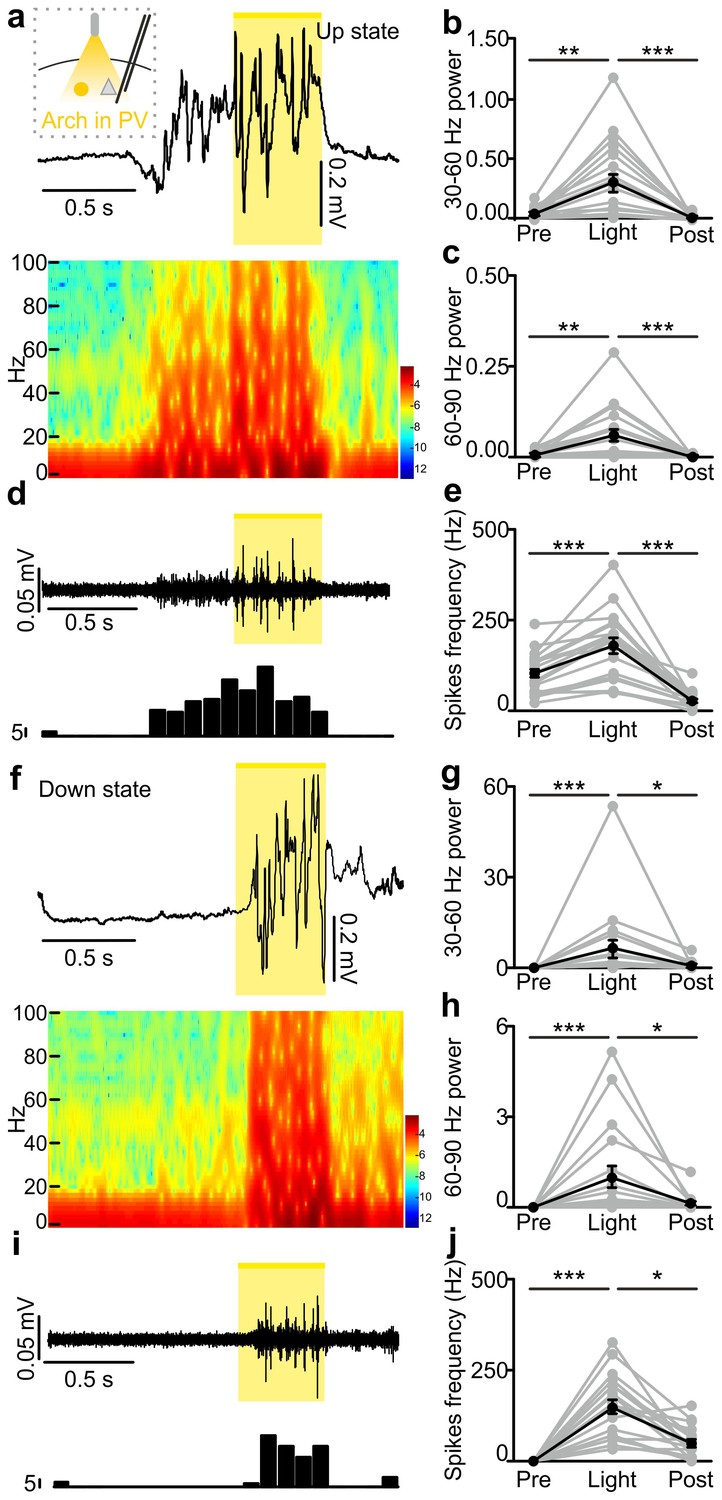
In vivo extracellular recordings of spontaneous cortical dynamics and photoinhibition of PV positive interneurons expressing Arch.
(a) Representative trace of an in vivo LFP recording (top) and corresponding spectrogram (bottom) showing the effect of optogenetic stimulation (yellow line) of PV interneurons expressing Arch during an ongoing up state. The schematic of the experimental configuration is shown in the inset (top panel). (b–c) Average power in the 30–60 (b) and 60–90 (c) Hz frequency band before (Pre), during (Light) and after (Post) light stimulation. Power values are normalized to the total power in the ‘pre’ time window. In b, p = 1E-7, Friedman test, N = 19 animals. In c, p = 9E-9, Friedman test, N = 19 animals. (d) Multi-unit signal (top) and corresponding PSTH (bottom) related to the trace showed in a. (e) Average firing frequency of spikes (Hz) recorded in the multiunit signal before (Pre), during (Light), and after (Post) light stimulus (p = 1E-7, one-way ANOVA, N = 19 animals). (f–j) Same as in a-e but for photoinhibition of PV positive interneurons during an ongoing down state. In g, p = 1E-8, Friedman test, N = 19 animals. In h, p = 2E-8, Friedman test, N = 19 animals. In j, p = 3E-8, Friedman test, N = 19 animals.
-
Figure 4—figure supplement 3—source data 1
Source data for the effect of PV photoinhibition during up states on network activity.
- https://doi.org/10.7554/eLife.26177.034
-
Figure 4—figure supplement 3—source data 2
Source data for the effect of PV photoinhibition during down states on network activity.
- https://doi.org/10.7554/eLife.26177.035
Figure 4—figure supplement 4
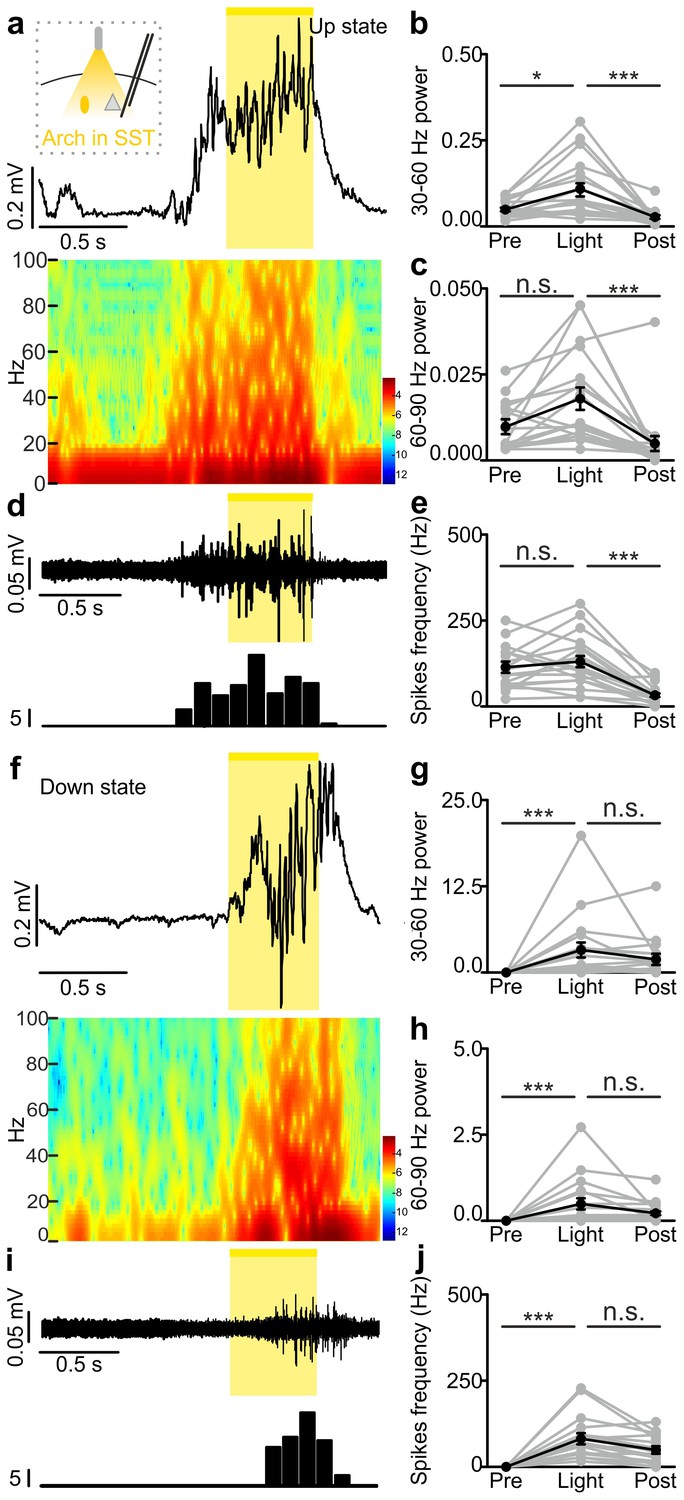
In vivo extracellular recordings of spontaneous cortical dynamics and photoinhibition of SST positive interneurons expressing Arch.
(a) Representative trace of an in vivo LFP recording (top) and corresponding spectrogram (bottom) showing the effect of optogenetic stimulation (yellow line) of SST interneurons expressing Arch during an ongoing up state. The schematic of the experimental configuration is shown in the inset (top panel). (b–c) Average power in the 30–60 (b) and 60–90 (c) Hz frequency band before (Pre), during (Light), and after (Post) light stimulation. In b, p = 3E-7, Friedman test, N = 18 animals. In c, p = 3E-6, Friedman test, N = 18 animals. (d) Multi-unit signal (top) and corresponding PSTH (bottom) related to the trace showed in a. (e) Average firing frequency of spikes (Hz) recorded in the multi-unit signal before (Pre), during (Light), and after (Post) light stimulus (p = 4E-6, Friedman test, N = 18 animals). (f–j) Same as in a-e but for optogenetic inhibition of SST interneurons during an ongoing down state. In g, p = 1E-6, Friedman test, N = 18 animals. In h, p = 3E-7, Friedman test, N = 18 animals. In j, p = 3E-7, Friedman test, N = 18 animals.
-
Figure 4—figure supplement 4—source data 1
Source data for the effect of SST photoinhibition during up states on network activity.
- https://doi.org/10.7554/eLife.26177.037
-
Figure 4—figure supplement 4—source data 2
Source data for the effect of SST photoinhibition during down states on network activity.
- https://doi.org/10.7554/eLife.26177.038
Figure 5 with 1 supplement
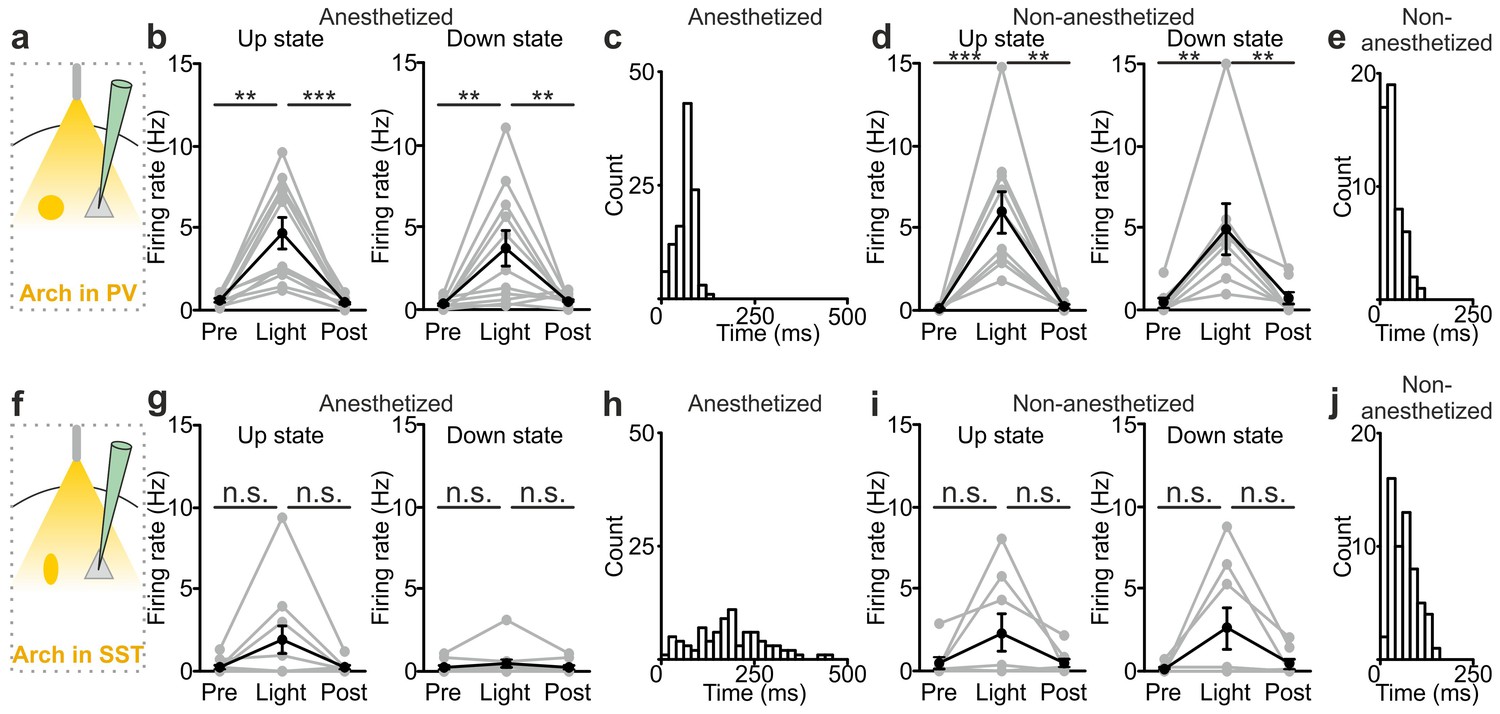
Interneuron type-specific effect of optogenetic inhibitory manipulations.
(a) Schematic of the experimental configuration where PV cells were photoinhibited. (b) Firing rate of pyramidal neurons before (Pre), during (Light), and after (Post) PV photoinhibition during up (left) or down (right) state in anesthetized mice. Left: p = 2E-4, Friedman test, N = 11 cells from four animals; right: p = 1E-3, one-way ANOVA, N = 11 cells from four animals. (c) Distribution of the latency of the down-to-up state transition triggered by photoinhibition of PV cells during an ongoing down state in anesthetized mice. (d–e) Same as in b-c but in non-anesthetized mice. In d: left, p = 2E-4, Friedman test, N = 10 cells from four animals; right, p = 3E-4, Friedman test, N = 8 cells from four animals. (f) Schematic of the experimental configuration where SST interneurons were photoinhibited. (g) Same as in b but during photoinhibition of SST interneurons. Left: p = 6E-1, Friedman test, N = 9 cells from five animals; right: p = 2E-1, Friedman test, N = 9 cells from five animals. (h) Distribution of the latency of the down-to-up state transition triggered by photoinhibition of SST during an ongoing down state in anesthetized mice. (i–j) Same as in g-h but in non-anesthetized mice. In i: left, p = 7E-1, Friedman test, N = 8 cells from five animals; right, p = 5E-1, Friedman test, N = 8 cells from five animals.
-
Figure 5—source data 1
Source data for the analysis of the interneuron type-specific effect of optogenetic inhibitory manipulations.
- https://doi.org/10.7554/eLife.26177.040
Figure 5—figure supplement 1
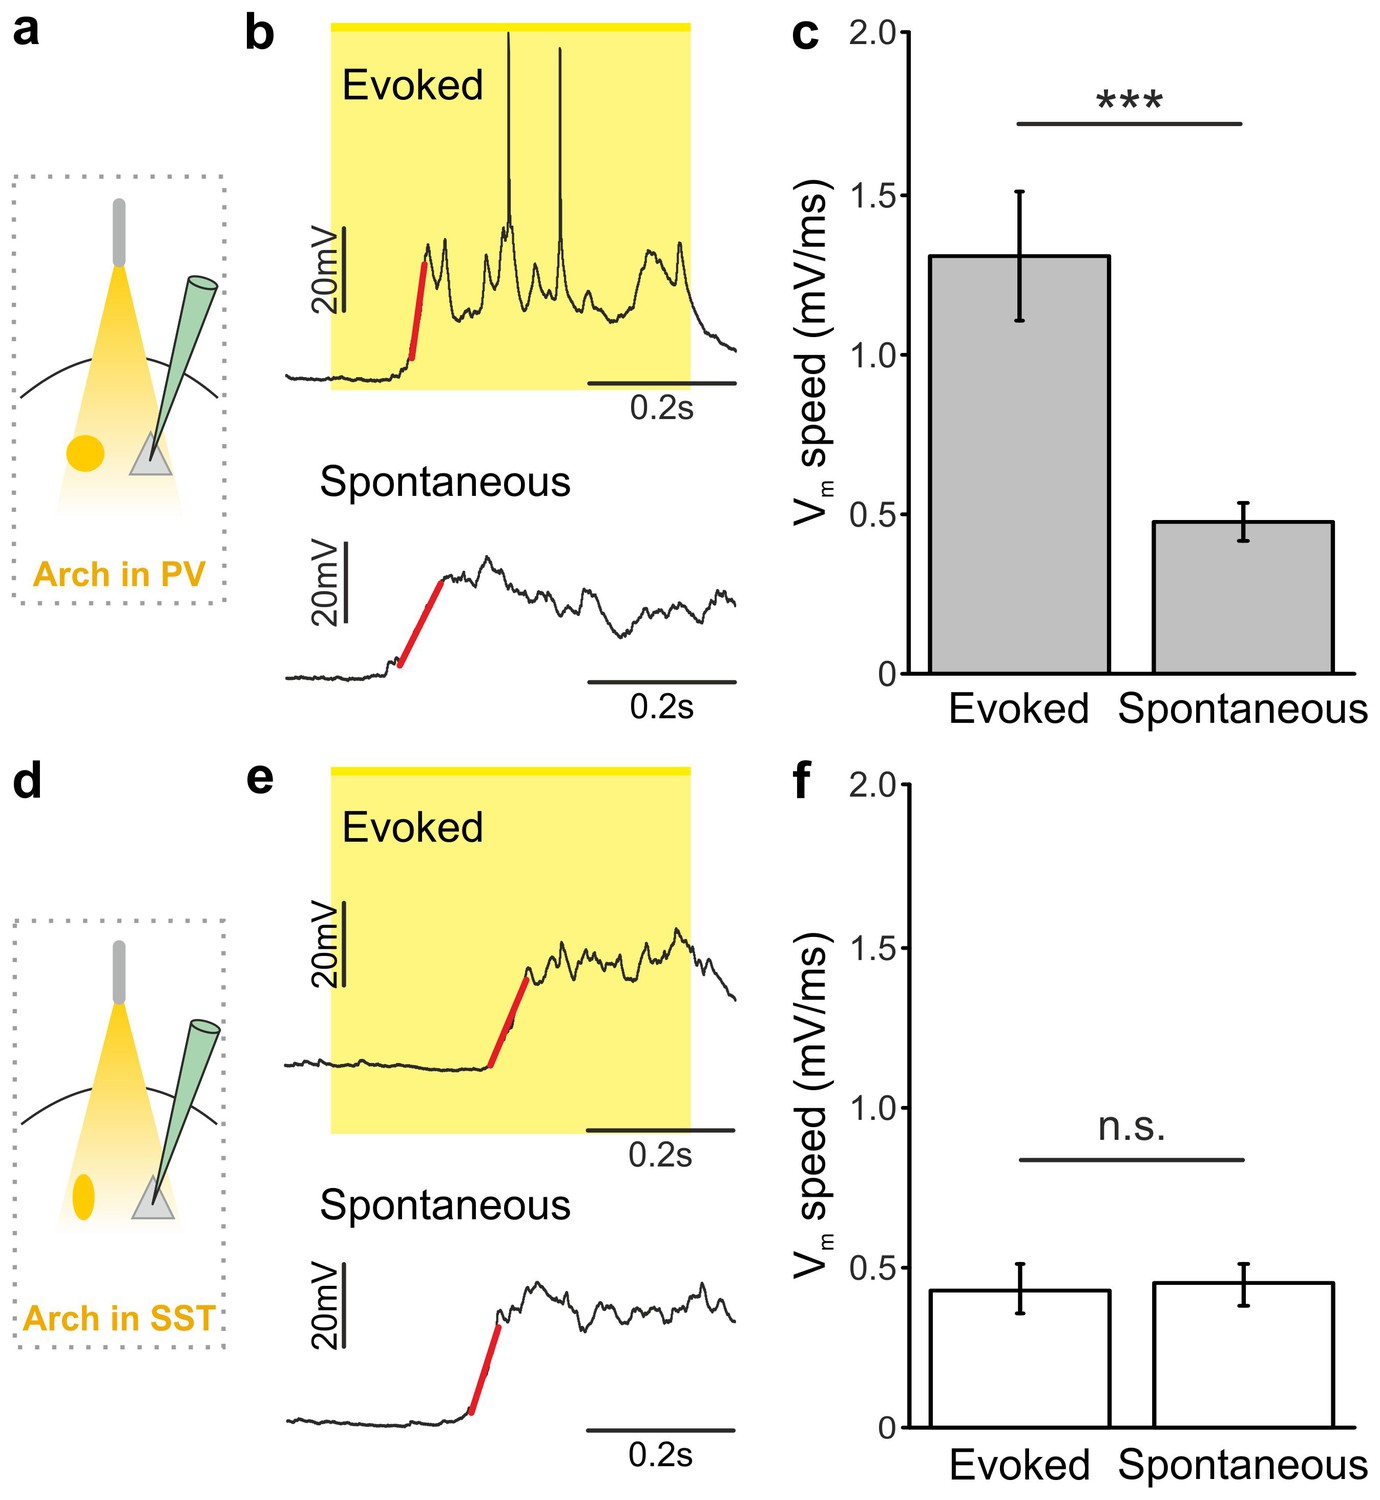
Membrane potential speed in pyramidal neurons during optogenetically-evoked and spontaneous down-to-up state transitions.
(a) Schematic of the experimental configuration. (b) Representative intracellular recording showing a down-to-up state transition evoked by optogenetic inhibition (yellow bar) of PV interneurons (top) or spontaneously occurring (bottom). A linear fit (red line) was used to evaluate membrane potential speed during the transition. (c) Average membrane potential speed in pyramidal neurons during optogenetically-triggered and spontaneous down-to-up state transitions (paired Student’s t-test, N = 11 cells from four animals, p = 3E-4). (d–f) Same as in a-c but for optogenetic inhibition of SST interneurons (paired Student’s t-test, N = 9 cells from five animals, p = 7E-1).
-
Figure 5—figure supplement 1—source data 1
Source data for the analysis of the membrane potential speed during optogenetically-evoked and spontaneous down-to-up state transitions.
- https://doi.org/10.7554/eLife.26177.042
Figure 6 with 6 supplements
Local modulation of cortical interneurons causes large-scale state transitions.
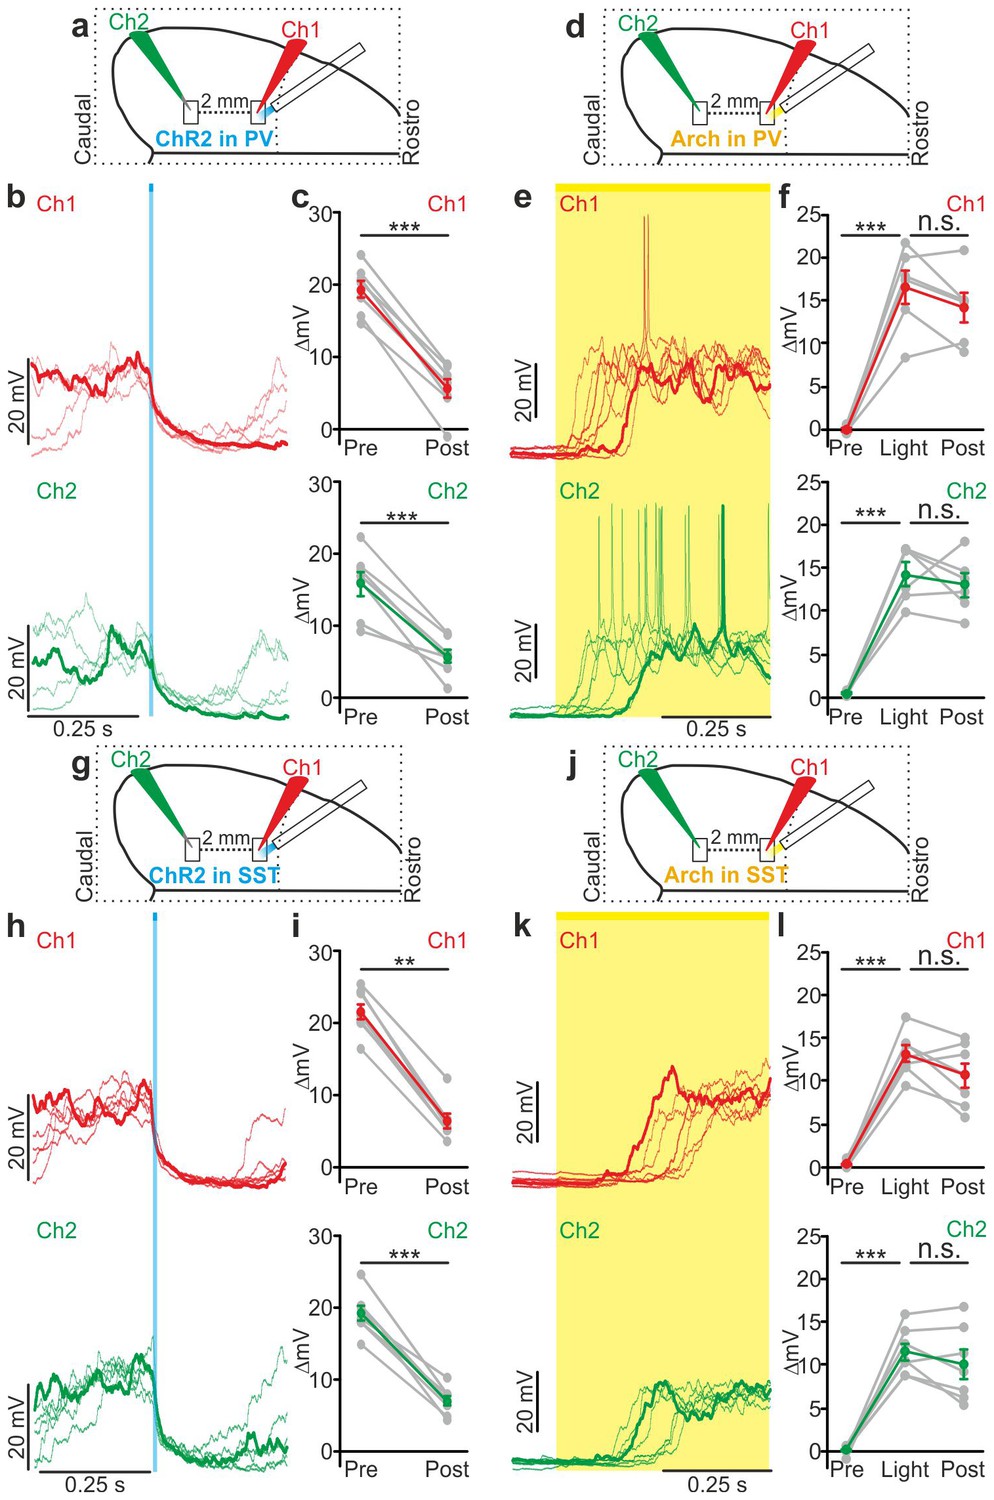
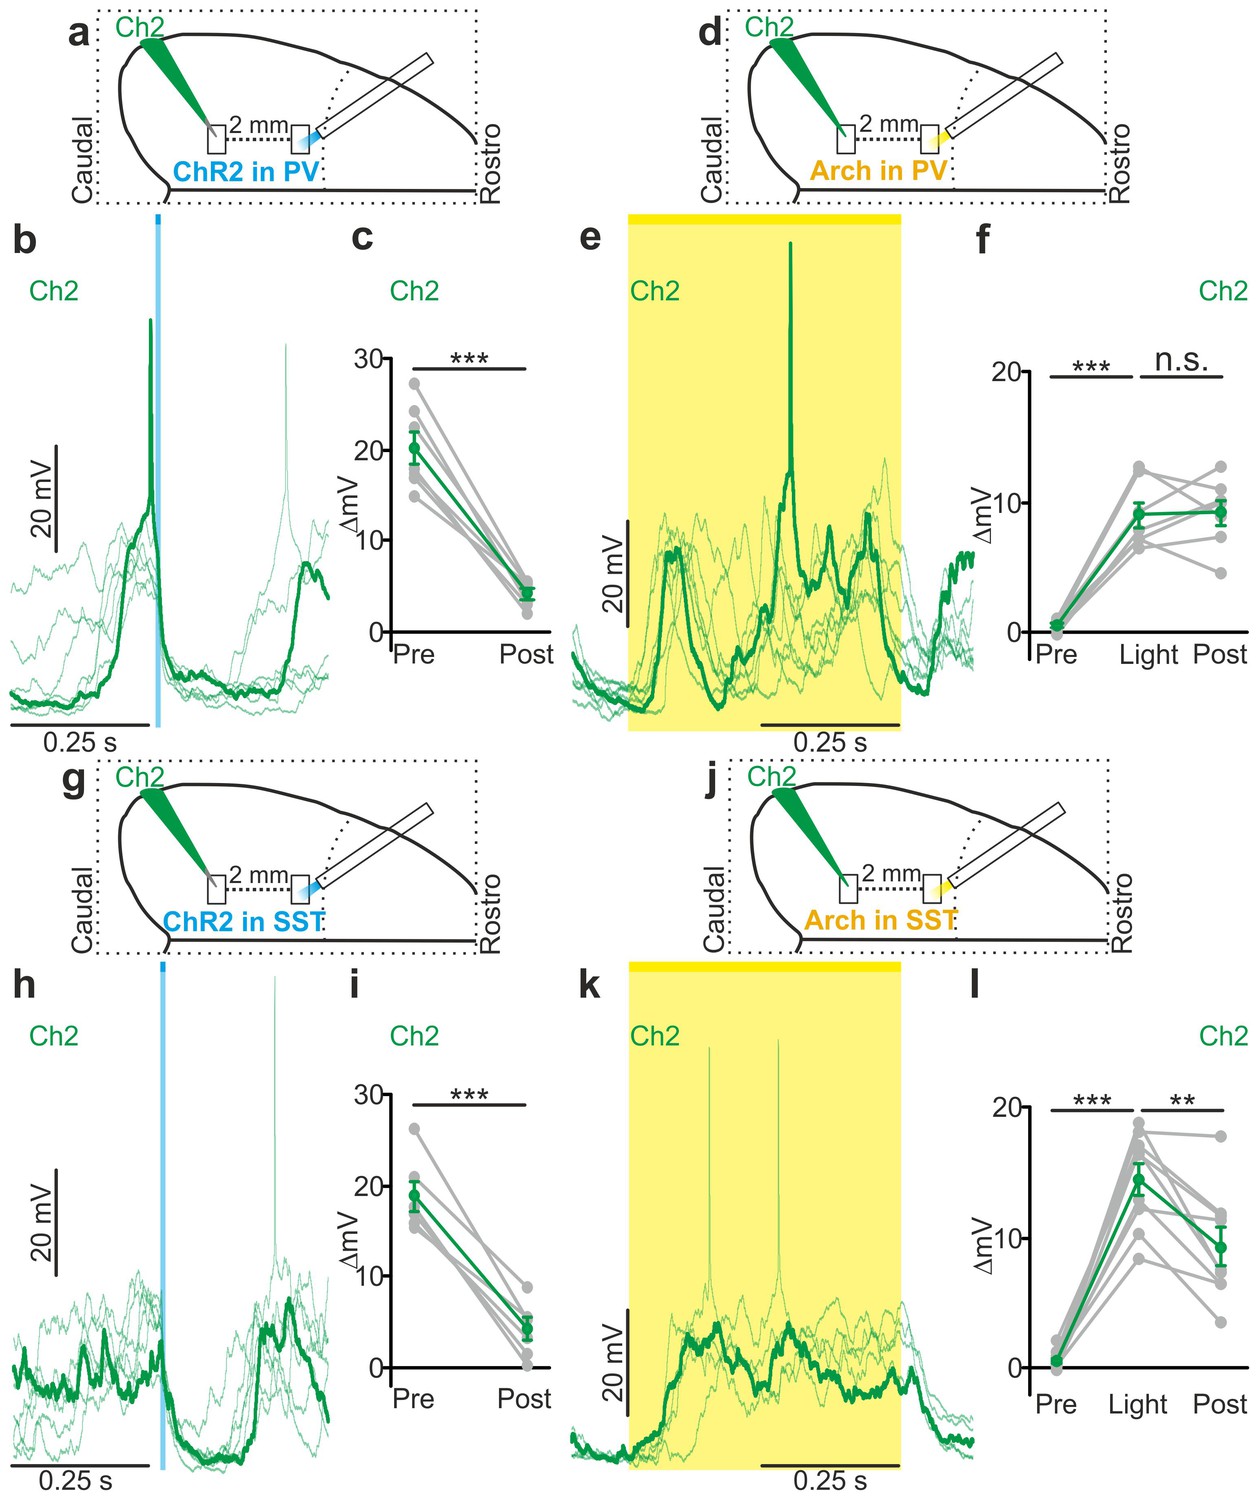
(a) Schematic representation of the experimental configuration. Simultaneous dual patch-clamp recordings were performed in anesthetized mice during photoactivation of PV interneurons expressing ChR2: Ch1 (red) indicates the recording site located close to the illuminated area, whereas Ch2 (green) represents the recording site placed 2 mm away from Ch1 in the caudal direction. (b) Representative traces of two simultaneously recorded neurons (top, Ch1, red trace; bottom, Ch2 green trace) during photoactivation of PV interneurons. Bold red (Ch1) and green (Ch2) lines show a single representative trial. (c) Change in the membrane potential (ΔmV) of recorded neurons before (Pre) and after (Post) PV activation during an ongoing up state. Grey dots and lines indicate single experiments, red (Ch1) or green (Ch2) dots and lines indicate the average value represented as mean ± s.e.m. Top: p = 7E-6, paired Student’s t-test, N = 7 cells from three animals; bottom: p = 6E-4, paired Student’s t-test, N = 7 cells from three animals. (d) Schematic of the experimental configuration for dual patch-clamp recordings during photoinhibition of PV interneurons. (e) Representative traces from two simultaneously recorded neurons (Ch1, red; Ch2, green) when photoinhibition of PV interneurons occurred during cortical down states. (f) Change in the membrane potential (ΔmV) of recorded neurons before (Pre), during (Light), and after (Post) photoinhibition of PV cells. Top: p = 4E-4, one-way ANOVA, N = 6 cells from four animals; bottom: p = 4E-5, one-way ANOVA, N = 6 cells from four animals. (g) Schematic representation of the experimental configuration for dual-patch clamp recording in mice expressing ChR2 in SST interneurons. (h–i) Same as in b-c but during photoactivation of SST interneurons. In i: top, p = 8E-3, Wilcoxon signed-rank test, N = 8 cells from six animals; bottom, p = 7E-6, paired Student’s t-test, N = 8 cells from six animals. (j) Schematic representation of the experimental configuration for paired patch-clamp recording in mice expressing Arch in SST interneurons. (k–l) Same as in h-i but inhibiting SST interneurons. In l: top, p = 3E-5, one-way ANOVA, N = 7 cells from four animals; bottom, p = 1E-4, one-way ANOVA, N = 7 cells from four animals.
-
Figure 6—source data 1
Source data for the analysis of membrane potential changes in simultaneously recorded neurons during local optogenetic perturbation of PV and SST interneurons.
- https://doi.org/10.7554/eLife.26177.044
Figure 6—figure supplement 1
Optogenetic activation of interneurons modulates network multi-unit activity over large cortical territories in anesthetized animals.
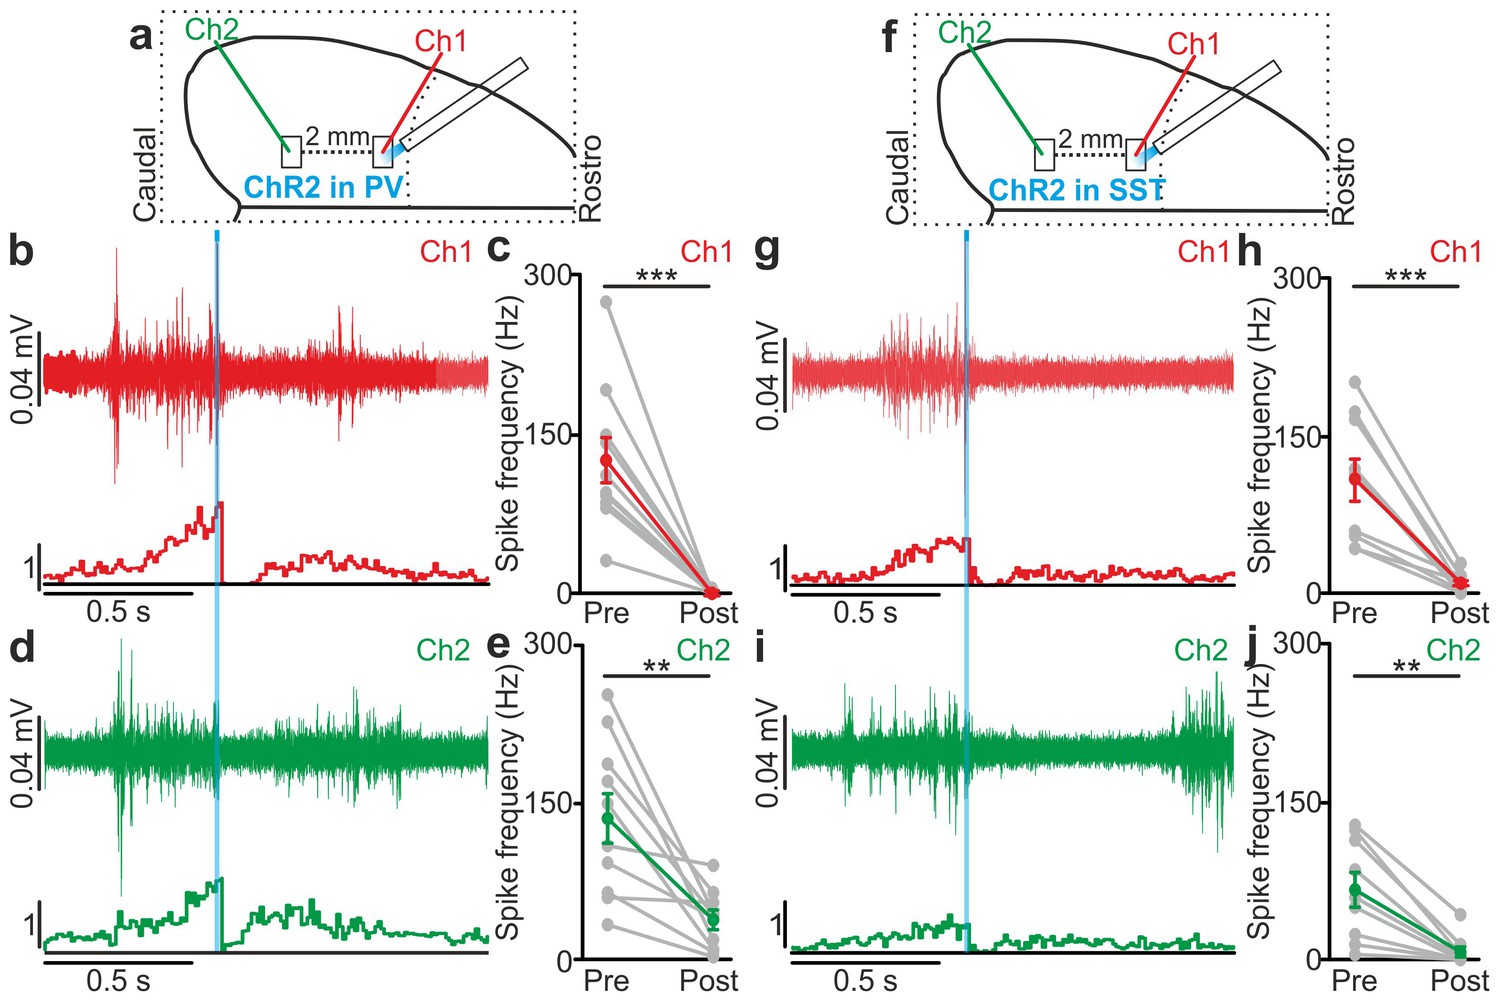
(a) Schematic representation of the experimental setup. Simultaneous extracellular recordings are performed in anesthetized mice during photoactivation of PV interneurons expressing ChR2. In this as well in other figures, Ch1 (red) indicates the recording site located close to the illuminated area, whereas Ch2 (green) represents the recording site placed 2 mm away from Ch1 in the caudal direction. (b) Top: example of a multi-unit signal recorded in Ch1 during optogenetic activation of PV interneurons (blue line). Bottom: average PSTH of Ch1 for all recorded animals (N = 10). (c) Average frequency of spikes recorded in Ch1 before (Pre) and after (Post) light stimulation (p = 3E-4, paired Student’s t-test, N = 10 animals). In this as well in other figures: grey dots and lines in this type of graph indicate single experiments, red dots and lines indicate the average value represented as mean ± s.e.m. (d) Top: multi-unit signal recorded in Ch2 simultaneously with the signal in Ch1 show in b (top panel). Bottom: average PSTH of Ch2 for all recorded animals (N = 10). (e) Same as in c but for recordings in Ch2 (p = 3E-3, paired Student’s t-test, N = 10 animals). Green dots and lines indicate the average value represented as mean ± s.e.m. (f–j) Same as in a–e but during photostimulation of SST interneurons expressing ChR2. In h, p = 9E-4, paired Student’s t-test, N = 9 animals. In j, p = 4E-3, Wilcoxon signed-rank test, N = 9 animals.
-
Figure 6—figure supplement 1—source data 1
Source data for the effect of local PV activation on network activity over large cortical territories.
- https://doi.org/10.7554/eLife.26177.046
-
Figure 6—figure supplement 1—source data 2
Source data for the effect of local SST activation on network activity over large cortical territories.
- https://doi.org/10.7554/eLife.26177.047
Figure 6—figure supplement 2
Large scale effect of PV and SST activation on multiunit activity using spatially-restricted DMD-based illumination.
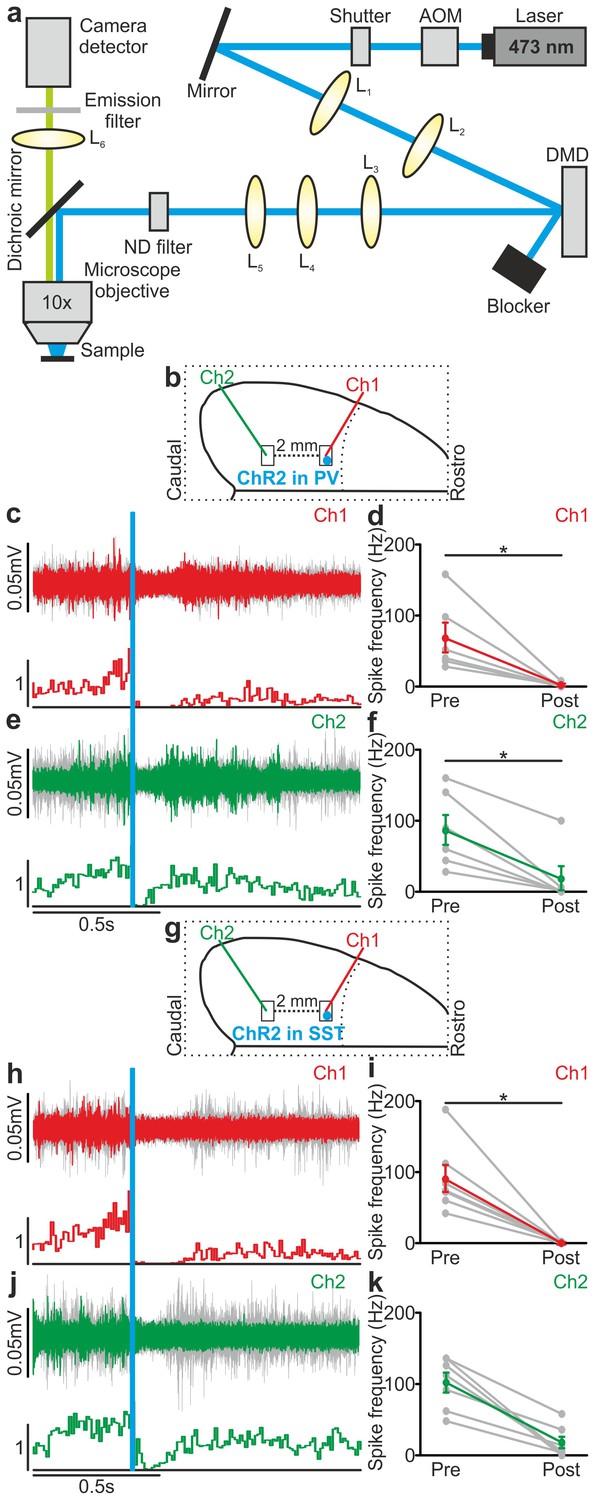
(a) Optical setup for patterned illumination with a DMD (see Materials and methods for details). (b) Schematic configuration for simultaneous extracellular recordings during photoactivation of PV interneurons expressing ChR2. The blue spot indicates the illuminated cortical region (200 µm diameter). (c) Top: example of multi-unit signals recorded in Ch1 during optogenetic activation of PV interneurons (blue line). Bottom: average PSTH of Ch1 for all recorded animals (N = 7 animals). (d) Average frequency of spikes recorded in Ch1 before (Pre) and after (Post) light stimulation (p = 3E-2, Wilcoxon signed-rank test, N = 6 animals). (e) Top: multi-unit traces in Ch2 simultaneously recorded with signals in a (top panel). Bottom: average PSTH of Ch2 for all recorded animals (N = 6 animals). (f) Average frequency of spikes recorded in Ch2 in the two time windows (p = 3E-2, N = 6 animals). (g–k) Same as in b-f but during optogenetic activation of SST interneurons expressing ChR2. In i, p = 2E-2, Wilcoxon signed-rank test, N = 7 animals. In k, p = 1E-3, paired Student’s t-test, N = 7 animals.
-
Figure 6—figure supplement 2—source data 1
Source data for the large scale effect of PV activation on multiunit activity using spatially-restricted DMD-based illumination.
- https://doi.org/10.7554/eLife.26177.049
-
Figure 6—figure supplement 2—source data 2
Source data for large scale effect of SST activation on multiunit activity using spatially-restricted DMD-based illumination.
- https://doi.org/10.7554/eLife.26177.050
Figure 6—figure supplement 3
Temporal lag of optogenetically-induced state transitions across cortical areas.
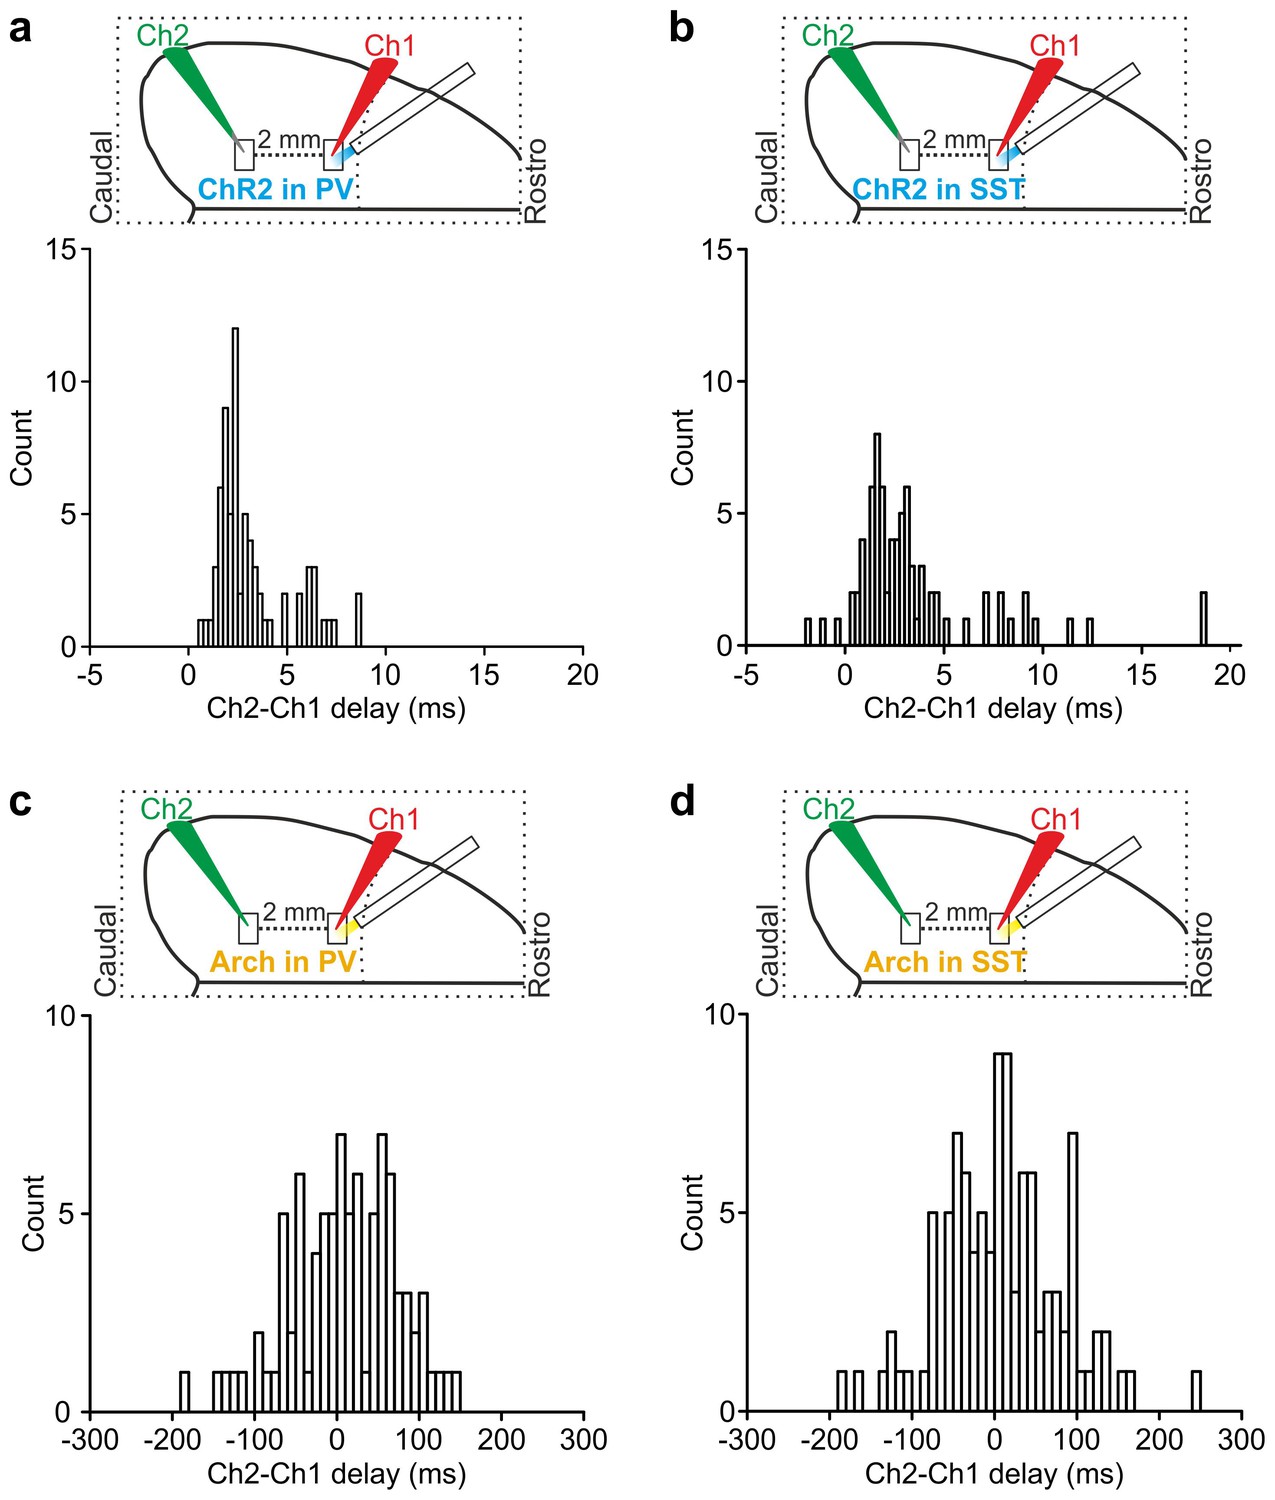
(a) Top: schematic of the experimental configuration for dual patch-clamp recordings from two cortical neurons (Ch1 and Ch2) located 2 mm apart during local optogenetic manipulation of PV cells in the area where Ch1 was recorded. Bottom: distribution of time lags (Ch2-Ch1 delay) of up-to-down transitions triggered by optogenetic activation of PV cells in the two simultaneously recorded neurons (bin width: 0.25 ms). (b) Same as in a for optogenetic activation of SST cells (bin width: 0.25 ms). (c–d) Same as in a-b for optogenetic inhibition of PV (c) or SST (d) neurons (bin width: 10 ms).
Figure 6—figure supplement 4
Local optogenetic modulation of interneurons modulates superficial pyramidal neurons over large cortical territories in non-anesthetized animals.
(a) Schematic representation of the experimental configuration for intracellular recordings of superficial pyramidal neurons in non-anesthetized animals during photoactivation of PV interneurons expressing ChR2. Recorded neurons (Ch2, green) are located two millimetres apart from the illuminated region in the caudal direction. (b) Representative traces showing membrane potential effect of PV interneurons photoactivation (blue line) during up states. (c) Average membrane potential values before (Pre) and after (Post) light stimulation (p = 7E-5, paired Student’s t-test, N = 7 cells from three animals). (d) Schematic configuration for intracellular recordings of layer II/III pyramidal neurons during optogenetic inhibition of PV interneurons expressing Arch in non-anesthetized animals. Light stimulation is delivered two millimetres apart in the rostral direction from the recording site (Ch2, green). (e) Representative traces showing the effect of PV interneurons photoinhibition (yellow line) on the membrane potential of the recorded cell during down states. (f) Average membrane potential values before (Pre), during (Light) and after (Post) light stimulation (p = 1E-6, one-way ANOVA, N = 7 cells from four animals). (g–l) Same as in a-f but during optogenetic modulation of SST interneurons. In i, p = 3E-4, paired Student’s t-test, N = 6 cells from three animals. In l, p = 3E-4, one-way ANOVA, N = 9 cells from three animals.
-
Figure 6—figure supplement 4—source data 1
Source data for the analysis of membrane potential changes in pyramidal neurons located 2 mm far from modulated PV and SST cells in awake mice.
- https://doi.org/10.7554/eLife.26177.053
Figure 6—figure supplement 5
Local optogenetic inhibition of interneurons modulates network MUA over large cortical territories in anesthetized animals.
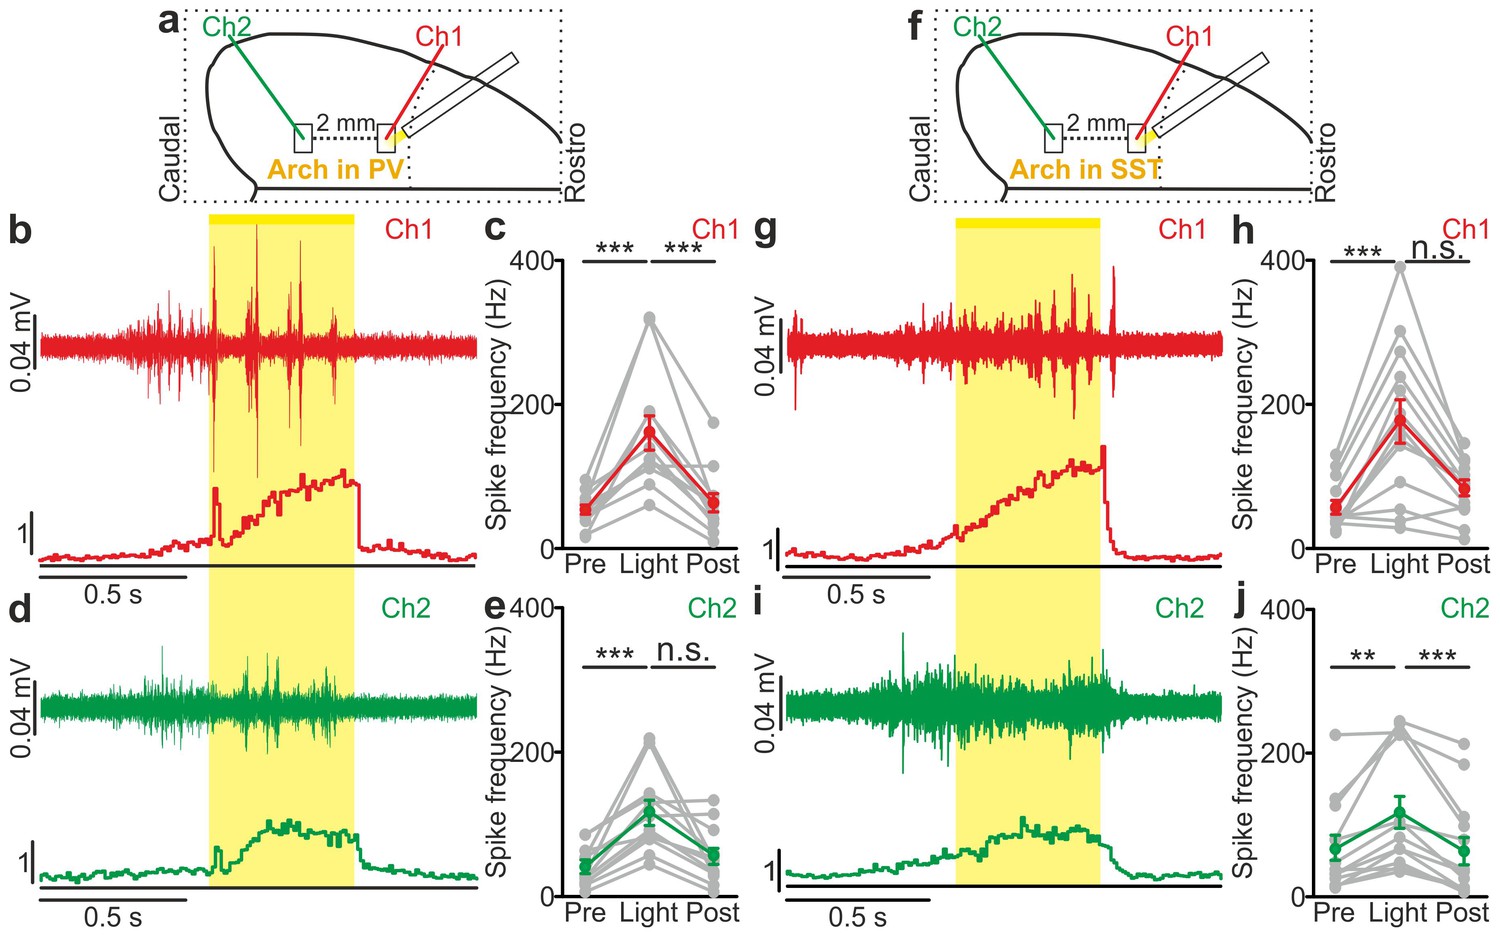
(a) Schematic of the experimental setup. Simultaneous extracellular recordings are performed in anesthetized mice during photoinhibition of PV interneurons expressing Arch. (b) Top: example of a multi-unit signal recorded in Ch1 during optogenetic inhibition of PV interneurons (yellow line). Bottom: average PSTH of Ch1 for all recorded animals (N = 12). (c) Average frequency of spikes recorded in Ch1 before (Pre), during (Light) and after (Post) light stimulation (p = 1E-4, Friedman test, N = 12 animals). (d) Top: multi-unit signal recorded in Ch2 simultaneously with the signal in Ch1 shown in b (top panel). Bottom: average PSTH of Ch2 for all recorded animals (N = 12). (e) Same as in c but for recordings in Ch2 (p = 6E-4, Friedman test, N = 12 animals). (f–j) Same as in a-e but during photoinhibition of SST interneurons expressing Arch. In h, p = 2E-3, Friedman test, N = 13 animals. In j, p = 2E-4, Wilcoxon signed-rank test, N = 13 animals.
-
Figure 6—figure supplement 5—source data 1
Source data for the effect of local PV inhibition on network activity over large cortical territories.
- https://doi.org/10.7554/eLife.26177.055
-
Figure 6—figure supplement 5—source data 2
Source data for the effect of local SST inhibition on network activity over large cortical territories.
- https://doi.org/10.7554/eLife.26177.056
Figure 6—figure supplement 6
Light transmission through the cortical tissue and density of opsin positive cells.
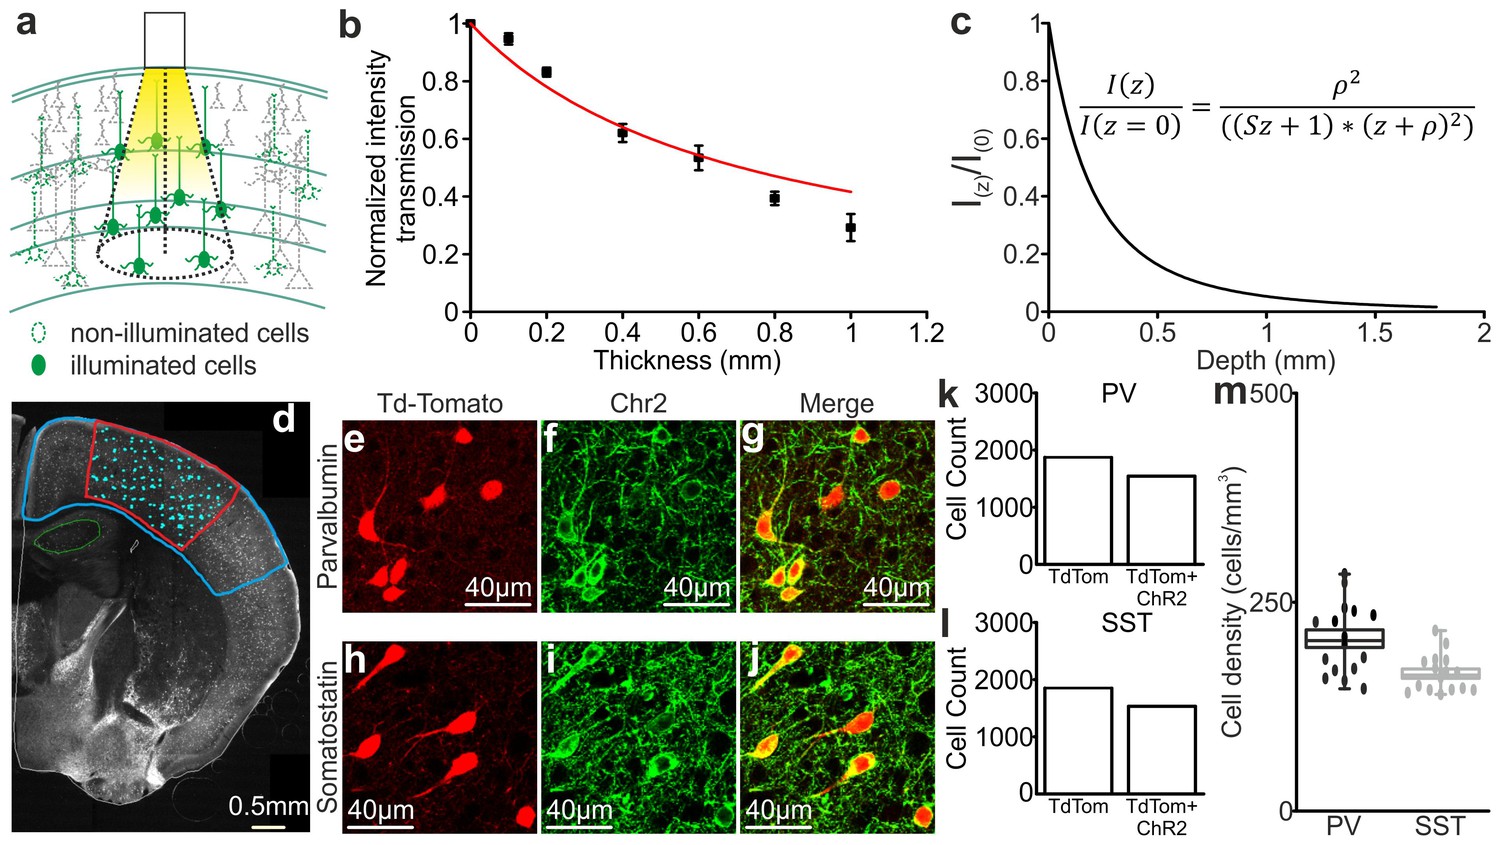
(a) Schematic representation of the illuminated brain volume using fiber optics. (b) Transmission fraction for yellow (λ = 594 nm) laser light as a function of the thickness of the cortical tissue. The red curve indicates the fit that was used to calculate the scattering coefficient (see Materials and Methods for details). (c) Light intensity as a function of cortical depth. The intensity values are normalized to the value at depth z = 0 mm. The inset shows the equation corresponding to the black curve. (d) An epifluorescence image of a representative coronal cortical section from a SST-Cre x TdTomato mouse injected with ChR2-eYFP that was used to evaluate cell density. The blue line indicates the region where the virus spread. The red line indicates the region with higher ChR2-eYFP expression, which was used for the cell count of TdTomato positive cells (light cyan dots indicate individual TdTomato positive cells). (e–j) Representative confocal images of PV (top) and SST (bottom) interneurons expressing TdTomato and ChR2 used to evaluate the percentage of double labelled (TdTomato and ChR2-eYFP) cells. (k–l) Total number of TdTomato positive (TdTom) or TdTomato and ChR2 positive (TdTom + ChR2) cells in mice expressing ChR2 in PV (shown in k) and SST (shown in l) interneurons. (m) A box plot of the density of double-labelled PV and SST cells in four different animals. The filled dots indicate the density values from all the individual coronal sections that were analysed.
-
Figure 6—figure supplement 6—source data 1
Source data for the evaluation of light transmission through cortical tissue and of the density of opsin-positive cells.
- https://doi.org/10.7554/eLife.26177.058
Additional files
-
Source code 1
UP/DOWN state detection on LFP recordings and quantification of inhibitory interneurons firing properties.
Functions and scripts contained in this file have been used to produce data and plots reported in Figure 1 and Figure 1—figure supplement 1.
- https://doi.org/10.7554/eLife.26177.059
-
Source code 2
Analysis of LFP and MUA recordings during optogenetic manipulation of interneurons.
Functions and scripts contained in this file have been used to produce data and plots reported in Figure 3—figure supplements 4 and 5 and Figure 4—figure supplements 3 and 4.
- https://doi.org/10.7554/eLife.26177.060
Download links
A two-part list of links to download the article, or parts of the article, in various formats.
Downloads (link to download the article as PDF)
Open citations (links to open the citations from this article in various online reference manager services)
Cite this article (links to download the citations from this article in formats compatible with various reference manager tools)
An inhibitory gate for state transition in cortex
eLife 6:e26177.
https://doi.org/10.7554/eLife.26177


