Pilot study of large-scale production of mutant pigs by ENU mutagenesis
- Institute of Zoology, Chinese Academy of Sciences, China
- Chinese Swine Mutagenesis Consortium, China
- Third Military Medical University, China
- Chinese PLA General Hospital, China
- Northeast Agricultural University of China, China
- Chinese Academy of Agricultural Sciences, China
- Pearl Laboratory Animal Sci. & Tech. Co. Ltd, China
- Tsinghua University, China
Figures
Figure 1 with 1 supplement

Protocol used for ENU treatment and estimation of mutation spectrum by 2b-RAD sequencing.
(A) A scheme for ENU treatment. (B) Pedigrees of two families treated with different doses of ENU (65 and 85 mg/kg) were selected for analysis. Each family consisted of an ENU-treated G0 boar, an untreated sow, and five G1 boars. (C) Spectrum of ENU-induced mutations revealed by RAD sequencing. ENU treatment predominantly introduced G>A transitions, which are marked in red. (D) Transversion mutations occurred at a frequency of 28.8%, whereas transition mutations occurred at a frequency of 71.2%. (E) Most induced mutations were located in intergenic and intron regions, whereas only a small percentage of mutations resided in the genomic regions containing exons, 5' UTRs and 3' UTRs.
-
Figure 1—source data 1
ENU-induced mutations revealed by RAD sequencing.
- https://doi.org/10.7554/eLife.26248.003
Figure 1—figure supplement 1
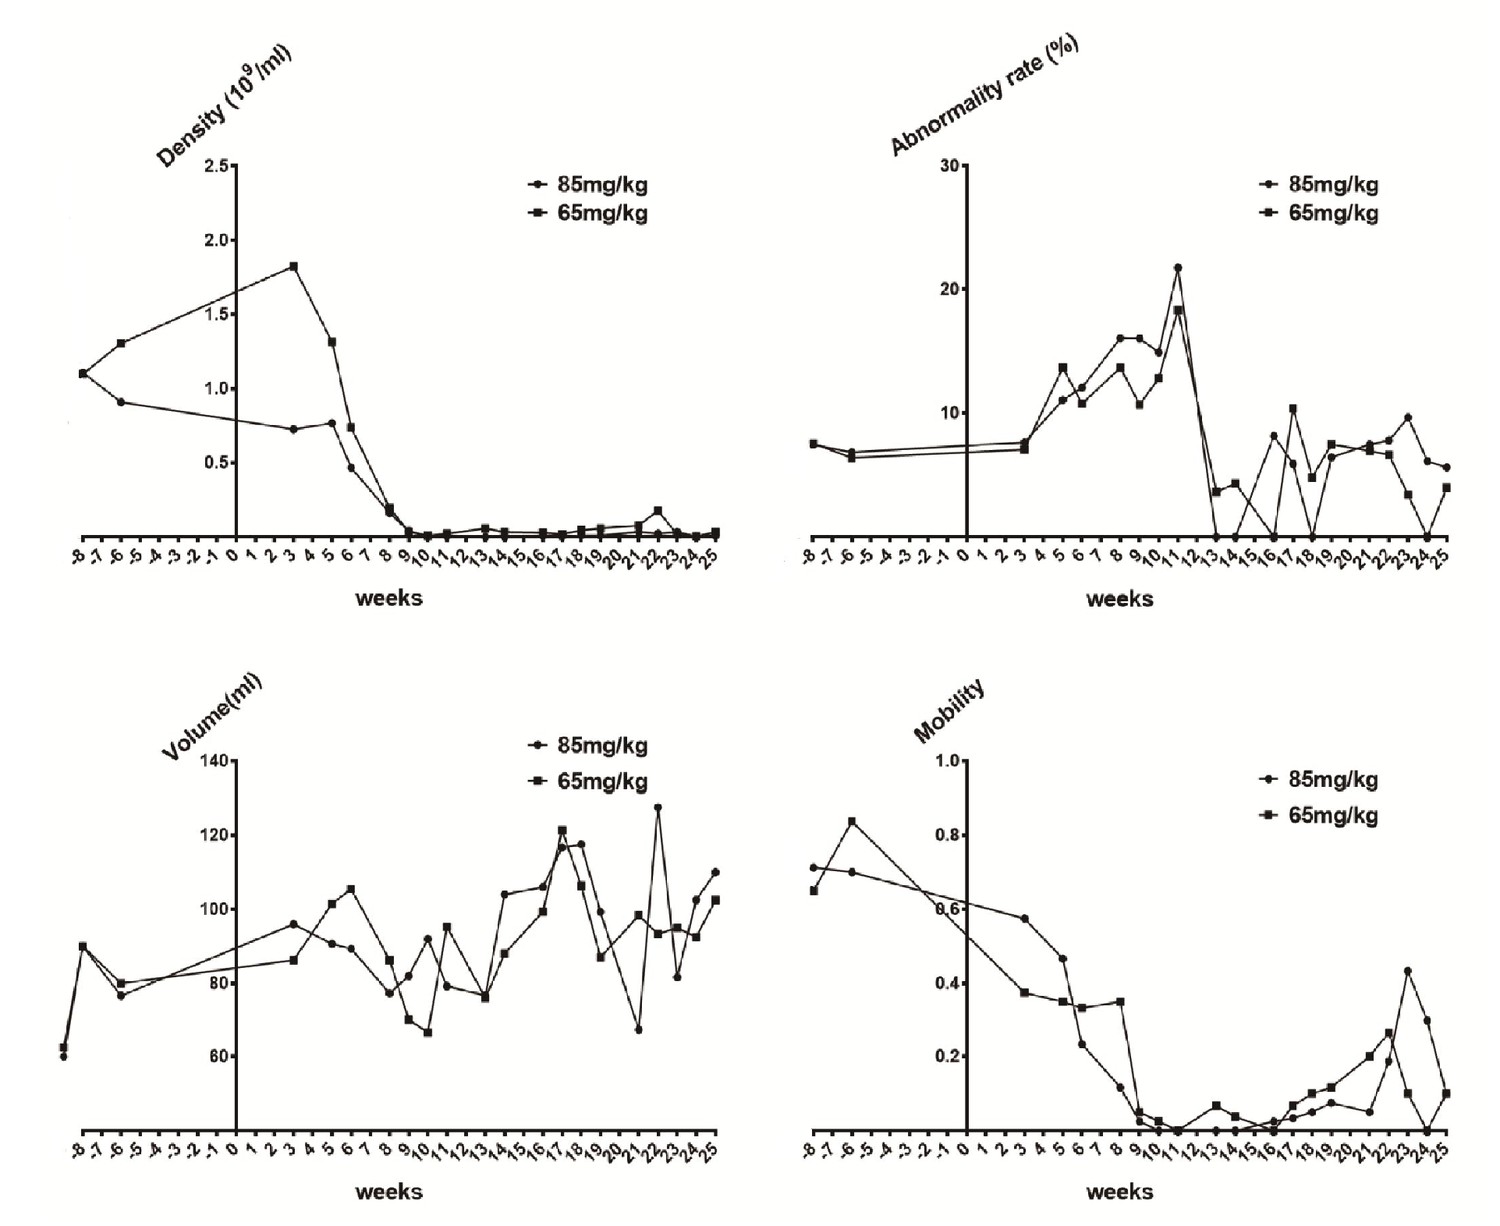
Sperm quality assessment in pigs pre- and after ENU treatment.
(A) Sperm density was dramatically decreased for 2–3 weeks after treatment and then slightly increased. (B) The sperm abnormality rate increased after ENU treatment, peaked at 11 weeks, and subsequently recovered to almost normal at 19 weeks. (C) Sperm volume showed no significant changes (p>0.05). (D) Sperm mobility was decreased to almost zero at 9 weeks after treatment and then started to recover from 14 to 16 weeks. Sperm quality assessment was performed in the boars treated with ENU at concentrations of 65 mg/kg (n = 4) and 85 mg/kg (n = 4), and no obvious difference in sperm quality was observed between the two treatment groups (all p>0.05). Statistical differences were examined by unpaired Student's t-test.
Figure 2
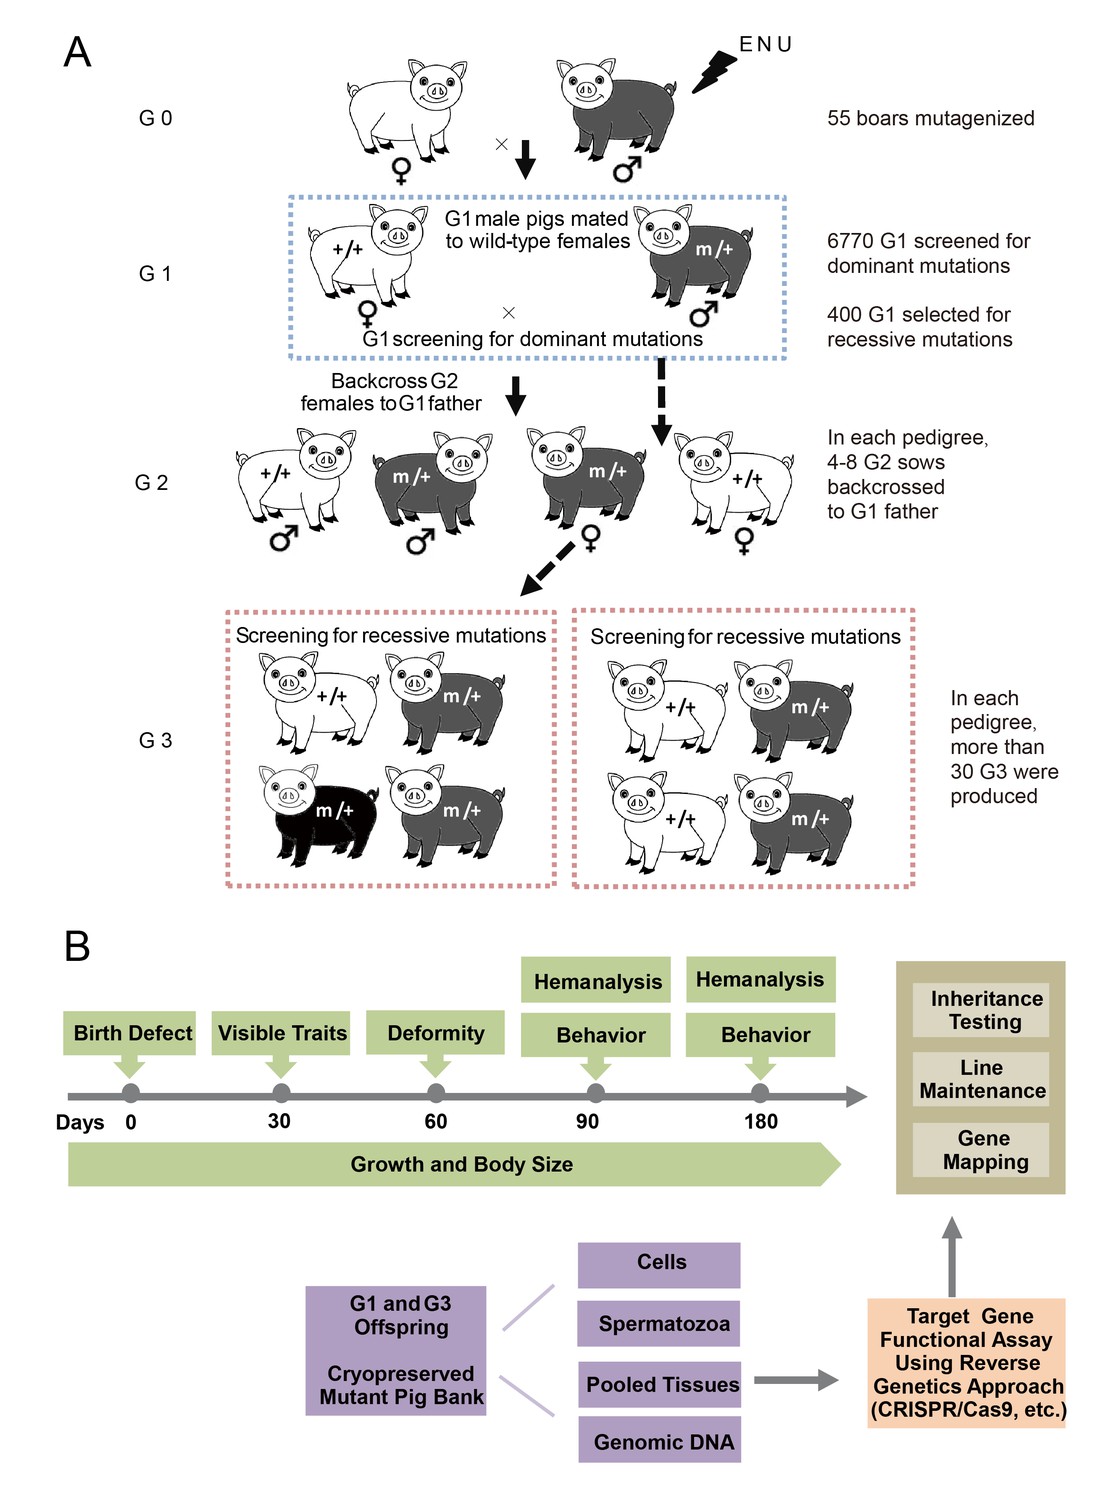
The breeding scheme used to screen dominant and recessive mutations and a phenotype screen pipeline, and the establishment of the mutant database in pig ENU mutagenesis.
(A) A three-generation breeding scheme for mutation screening. ENU treatment-induced mutations were transmitted to the G1 generation. The G1 offspring that were heterozygous for ENU-induced mutations were screened for aberrant phenotypes. The G1 boars were mated to wild-type sows to produce G2 offspring. The G2 daughters were mated back to their father, and recessive mutations were then detected in the G3 progenies. (B) To minimize the number of pigs used in the mutant screen, offspring bred from the ENU-treated individuals were screened by different methods. Sperm, DNA, tissues and cells were archived from the G1 offspring.
Figure 3
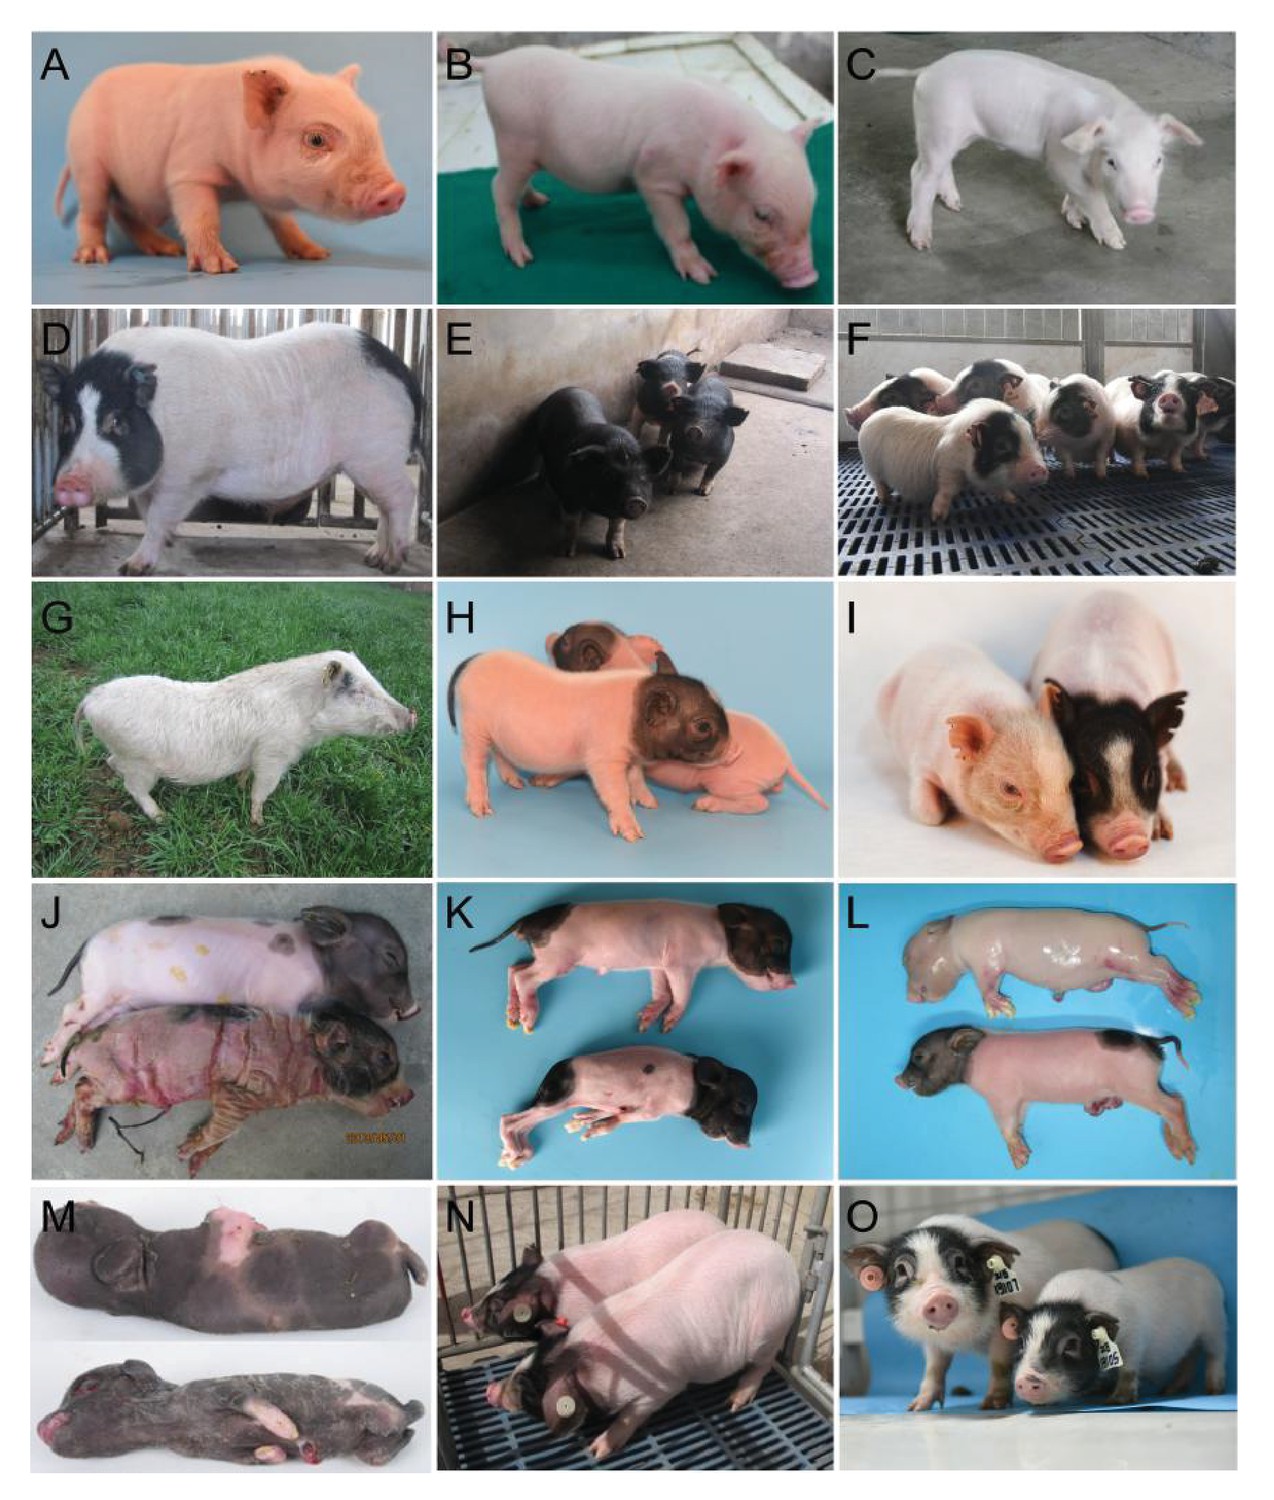
Phenotypes of confirmed dominant and recessive mutant pigs.
(A) The mutant exhibited white coat color, diluted iris pigmentation and hearing loss. Histologic sections were examined from the cochleas of mutant pigs, and the striae vascularis exhibited enlarged marginal cell nuclei and tectorial membrane, indicating an abnormal organ of Corti. (B) The mutant exhibited white coat color and hearing loss. Histologic analyses of the cochleas from mutant pigs showed an extensive collapse of Reissner’s membrane onto the stria vascularis and the organ of Corti. In addition, the auditory hair cells were absent or severely diminished, and the supporting cells displayed severe abnormalities. (C) The mutant was characterized by shaking and trembling, and progressive muscle weakness was also observed. (D) The mutant presented elevated blood glucose levels (hyperglycemia). Thesemutants exhibited 212.8% higher blood glucose concentrations (mutants: 8.3 mg/dL, WT: 3.9 mg/dL). (E) The mutant was identified by its black coat color. (F) the mutant showed short limbs and small body size, and this phenotype was inherited with a dominant model. (G) Line TBB007T095. The mutant was characterized by hearing loss, white coat color and diluted iris pigmentation. SOX10 was identified as the causative gene, and this mutant may represent the first inherited animal model of human Mondini dysplasia. The mutant phenotypes shown in (A–G) exhibit dominant inheritance. (H) The mutants from three mutant lines (Z0017, Z0022 and Z0040) presented ‘single-end black’ coat color phenotype. Linkage analysis of line Z0040 revealed a significant signal at chr13: 49–76 Mb region. The G1 boars of lines Z0017, Z0022 and Z0040 were derived from different G0 boars, and further analysis might identify additional linkage regions in lines Z0017 and Z0022. (I) The mutant displayed diluted brown coat color (line Z0015). (J) The mutant showed ectropion, flattening of the ears and large, thick, plate-like scales over the entire body (line Z0009). (K) The mutant showed neonatal death, congenital malformations of the limbs, and a shortened lower jaw (line Z0037). (L) The mutant, presenting an autosomal recessive pattern of inheritance, displayed weak in vitality and nude skin (line Z0013). (M) The mutants from lines Z0078 and Z0079 presented abnormal facial and limb development. The G1 boars of lines Z0078 and Z0079 were derived from the same G0 boar, suggesting the same causative genes for these two mutant lines. (N) The mutant line had increased body weight and high daily weight gain that was inherited in a recessive manner (line Z0006). (O) The mutant, which is inherited with a recessive model, is associated with short limbs, small body size, and low body weight (line Z0071). The mutant phenotypes (H–O) exhibit recessive inheritance.
Figure 4 with 2 supplements
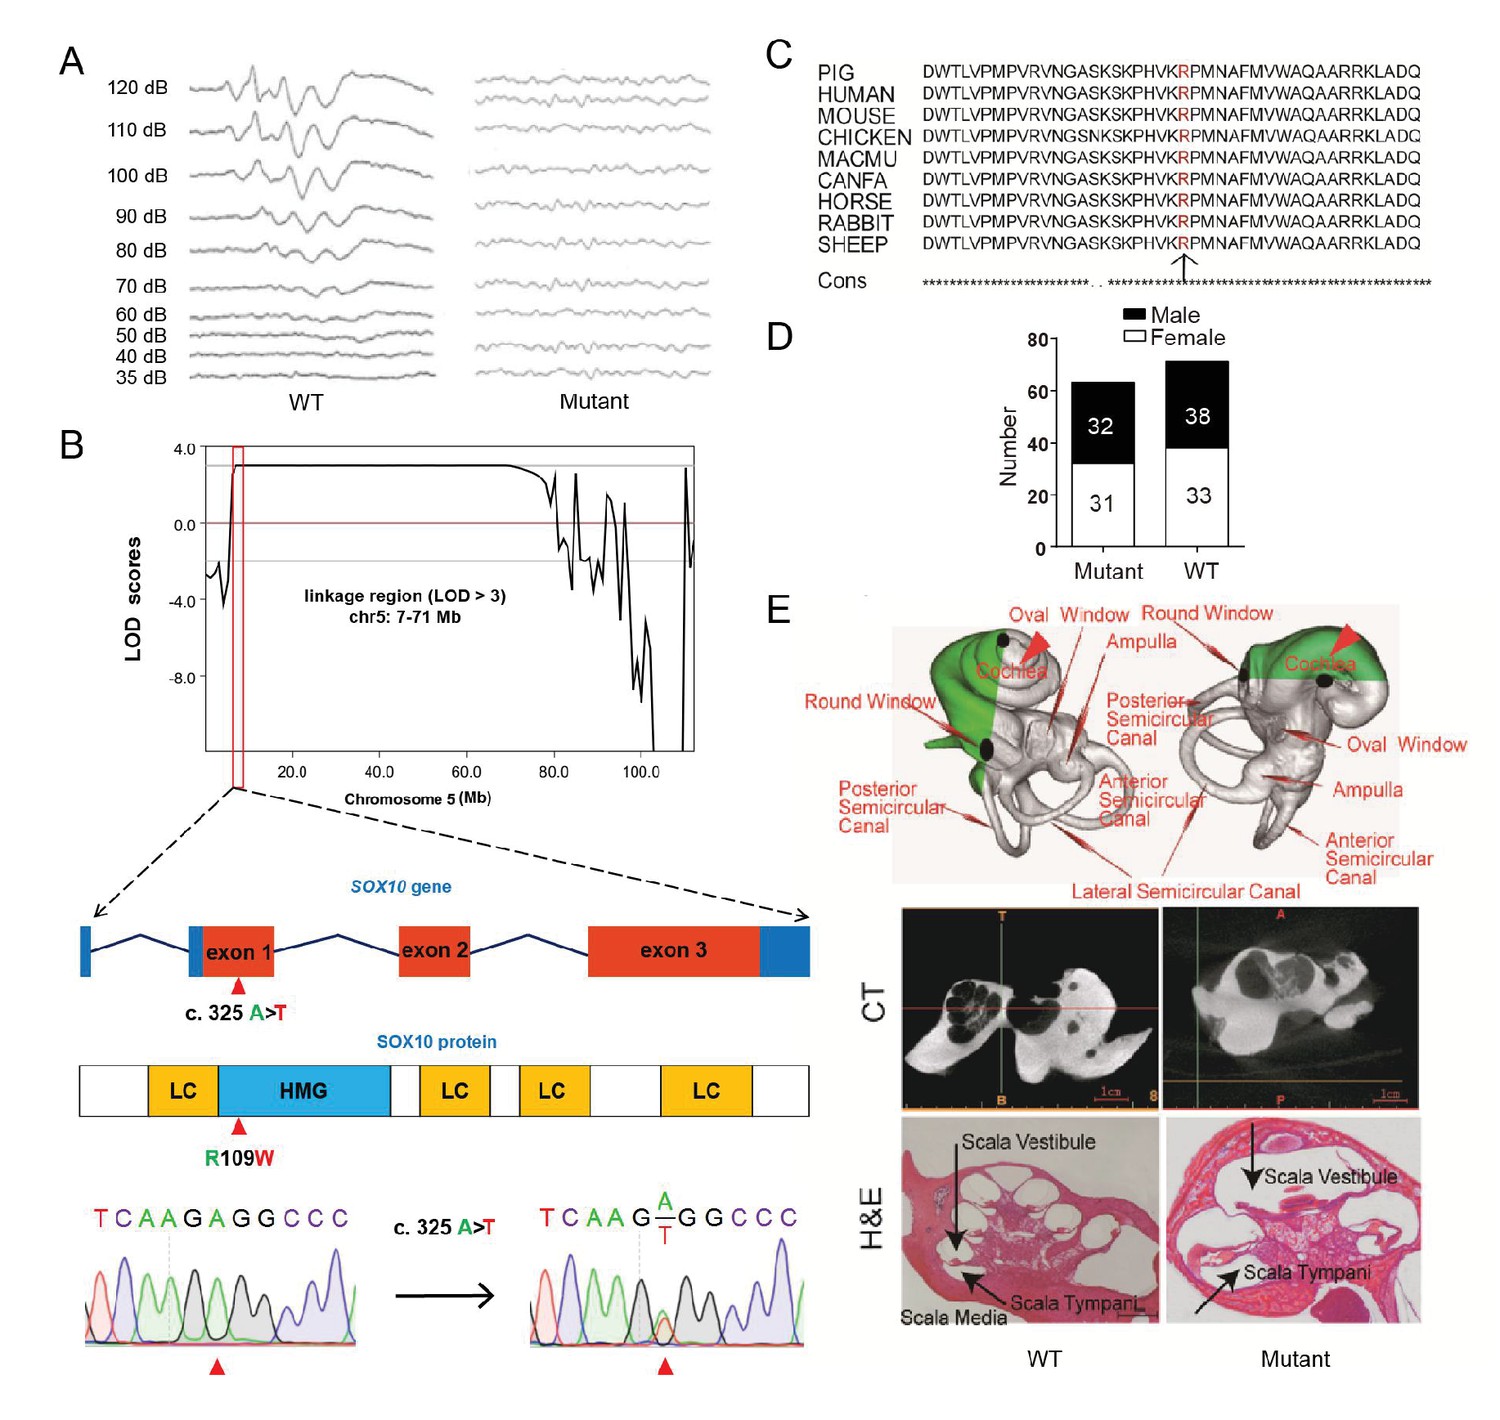
A miniature pig model of human Mondini dysplasia.
(A) ABR tests showed profound hearing loss in both the left and right ears of mutant pigs at postnatal day 7. (B) GWLS results showed significant linkage at the chr5: 7–71 Mb region, within which a causative mutation (c. 325 A>T) in the exon 1 of SOX10 locus was identified. This mutation may disrupt the SOX10 HMG domain, which is involved in DNA binding and protein–protein interactions. HMG, high mobility group; LC, low complexity regions. (C) The mutation resulted in a single amino acid change (R109W) at a highly conservative region and was predicted to have a deleterious effect on gene function using SIFT software. (D) The causative mutation completely co-segregated with the phenotype of mutant pigs in the TBB007T095 pedigree, and the ratio of wild-type and mutant pigs confirmed that the hearing loss syndrome had an autosomal dominant inheritance pattern. (E) Representative images of the inner ear of the wild-type and mutant pigs. Upper panel: micro-CT 3D reconstruction results showed that the mutant had a hypoplastic inner ear malformation and fewer coils (1.5 vs. 3.5) in the cochlea, which precisely mimics the syndrome of human Mondini dysplasia. Middle panel: CT scans of the miniature pig temporal bone showed visible cochlear tip structure in the wild-type and mutant miniature pigs. Lower panel: collodion H&E staining of the wild-type pig cochlea showed three and a half turns and structural integrity of Corti's organ within the cochlear partition, which is similar to the human inner ear. Cochlea in the mutant showed fewer cochlear turns, a short modiolus, an incomplete cochlear partition, and a visible bottom of Corti’s organ and spiral ganglion structure. Scale bar: 1 mm.
-
Figure 4—source data 1
Genome-wide parametric LOD score analyses for white coat color and hearing-loss mutant pedigree.
- https://doi.org/10.7554/eLife.26248.010
Figure 4—figure supplement 1
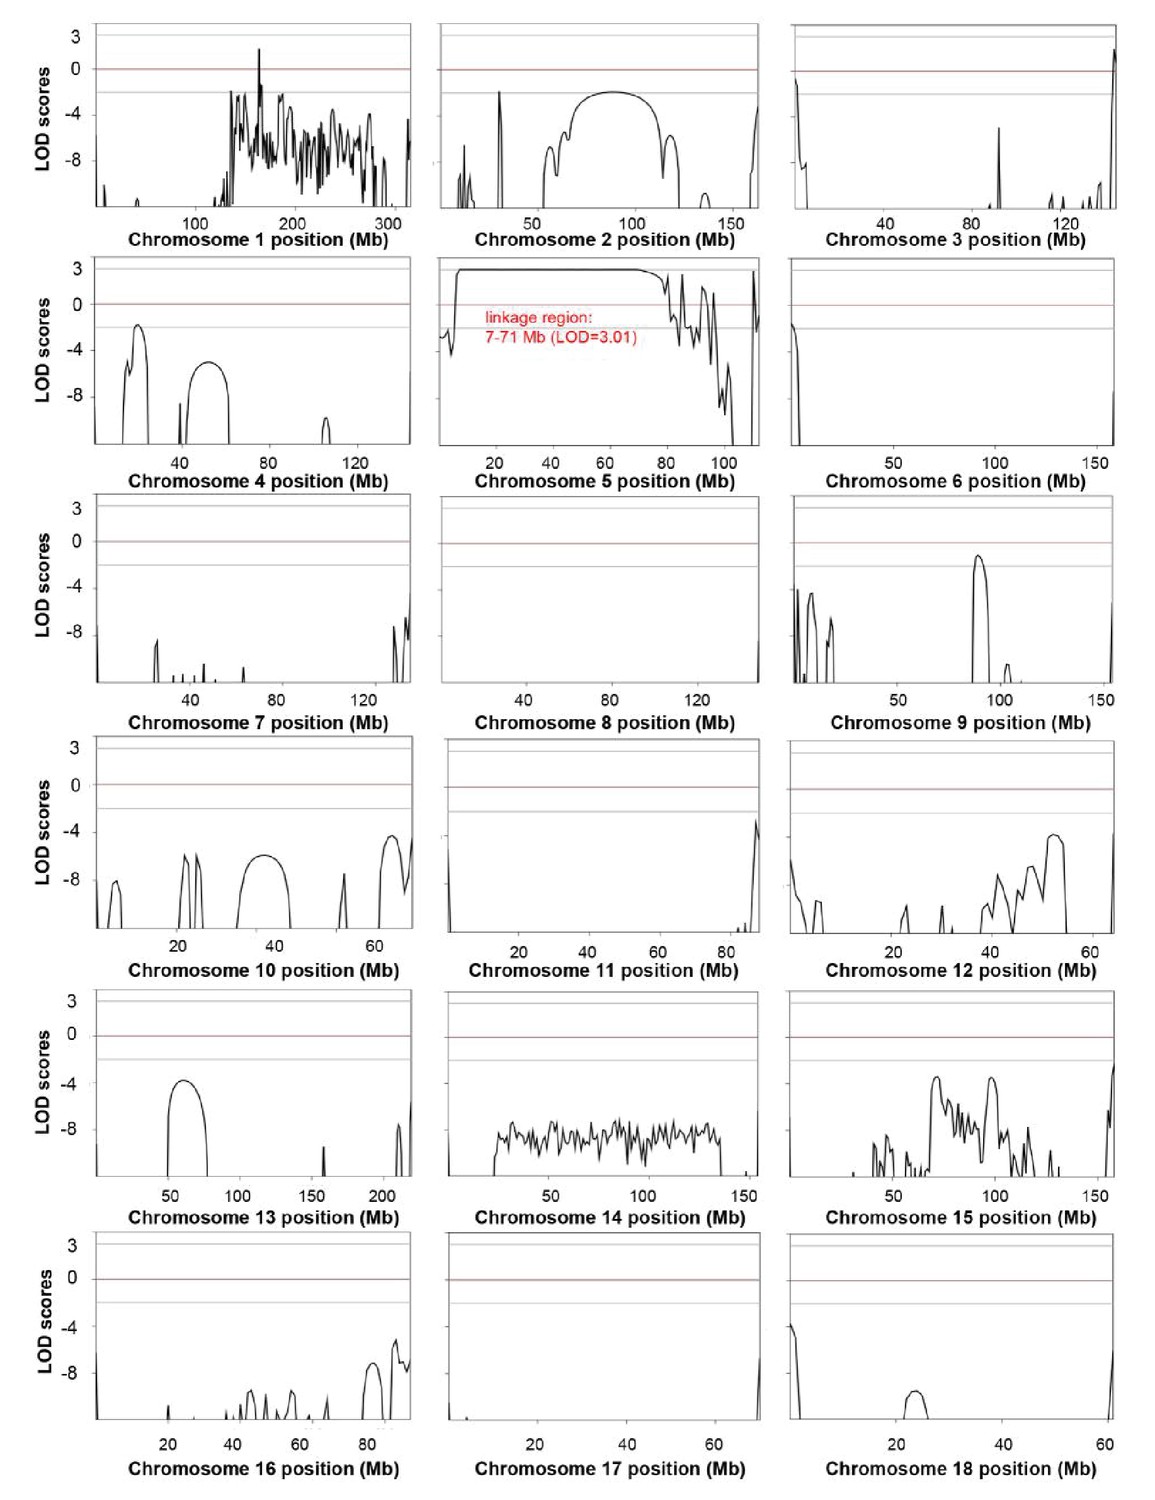
Genome-wide linkage analysis in the white coat color and hearing loss mutant pedigree.
The LOD scores were computed in the linkage analysis and are shown for each chromosome. Among the whole genome, only one linkage signal (chr5: 7–71 Mb, LOD >3) was detected. Genetic position (Mb) is plotted along the x-axis, and the LOD Score is plotted along the y-axis. A LOD score at or above a threshold of three is taken to be indicative of a linkage region.
Figure 4—figure supplement 2
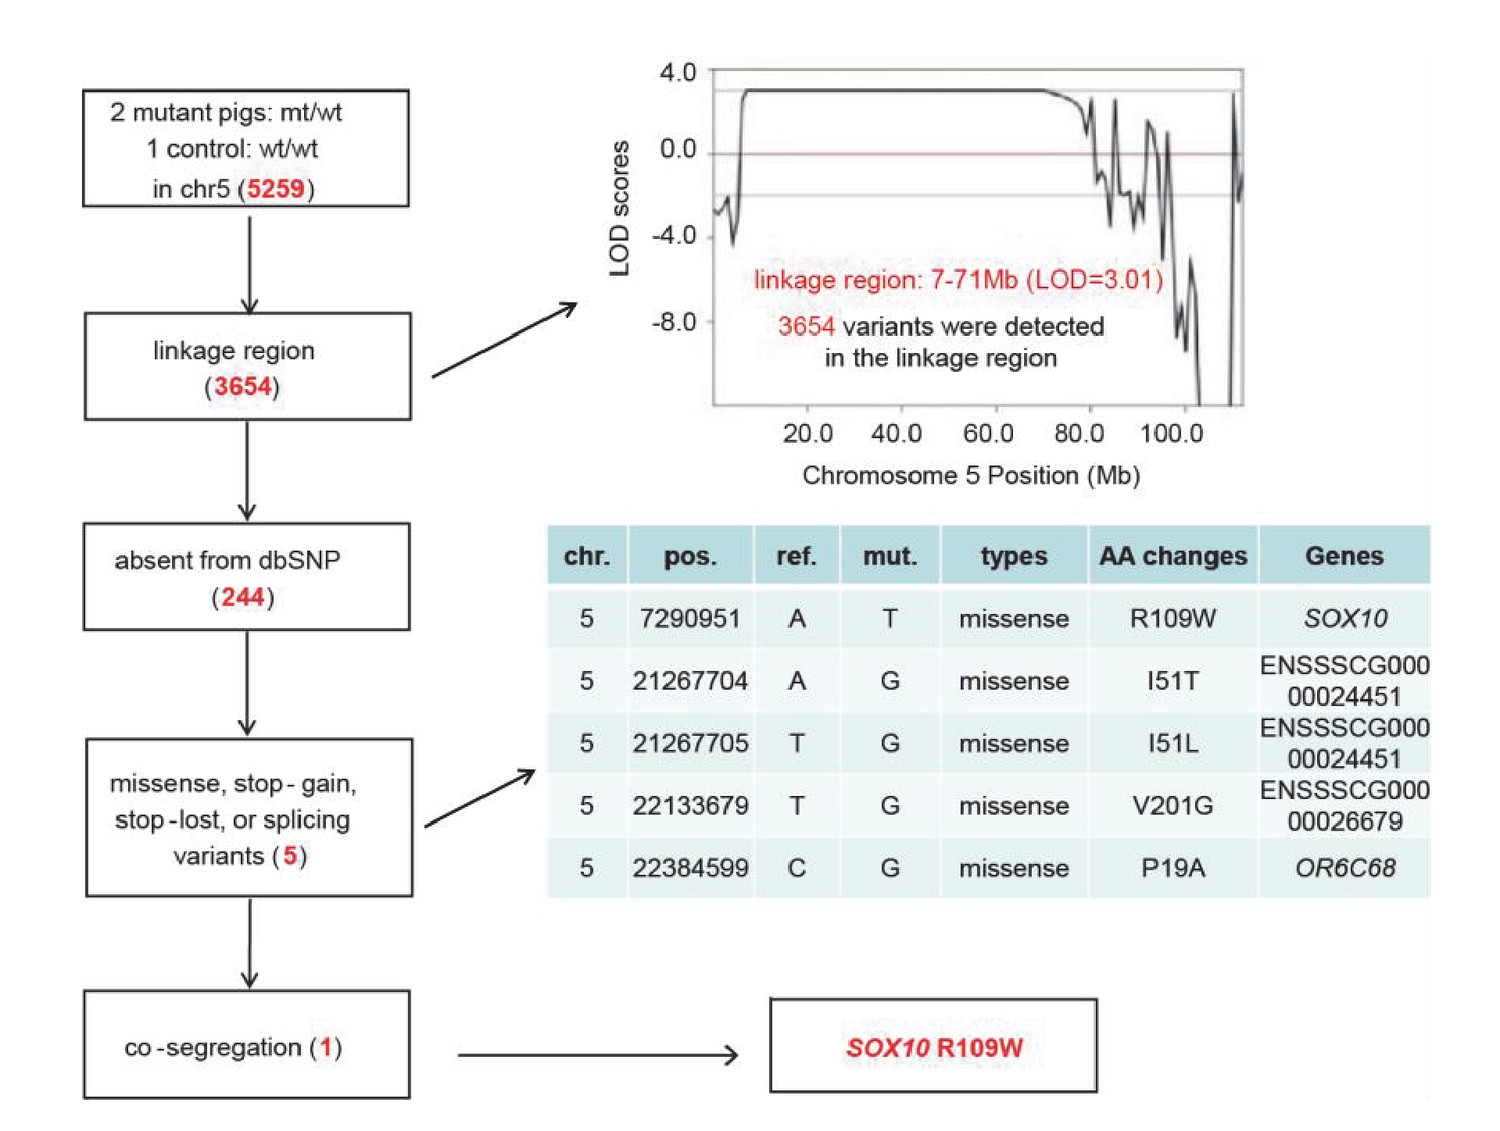
Identification of causative mutation by a filtering procedure.
Whole genome sequencing was performed in two mutants and one control to isolate the causative mutation. The sequence variants were subsequently filtered by five criteria: inheritance as a dominant pattern, location within the linkage interval, missing from the dbSNP database, disrupting the function of the protein product (e.g., non-synonymous mutation), and completely co-segregating with the phenotype of the pedigree. The filtering procedure is shown in the box on the left, with the results from each filter shown in red in the tables.
Figure 5 with 1 supplement
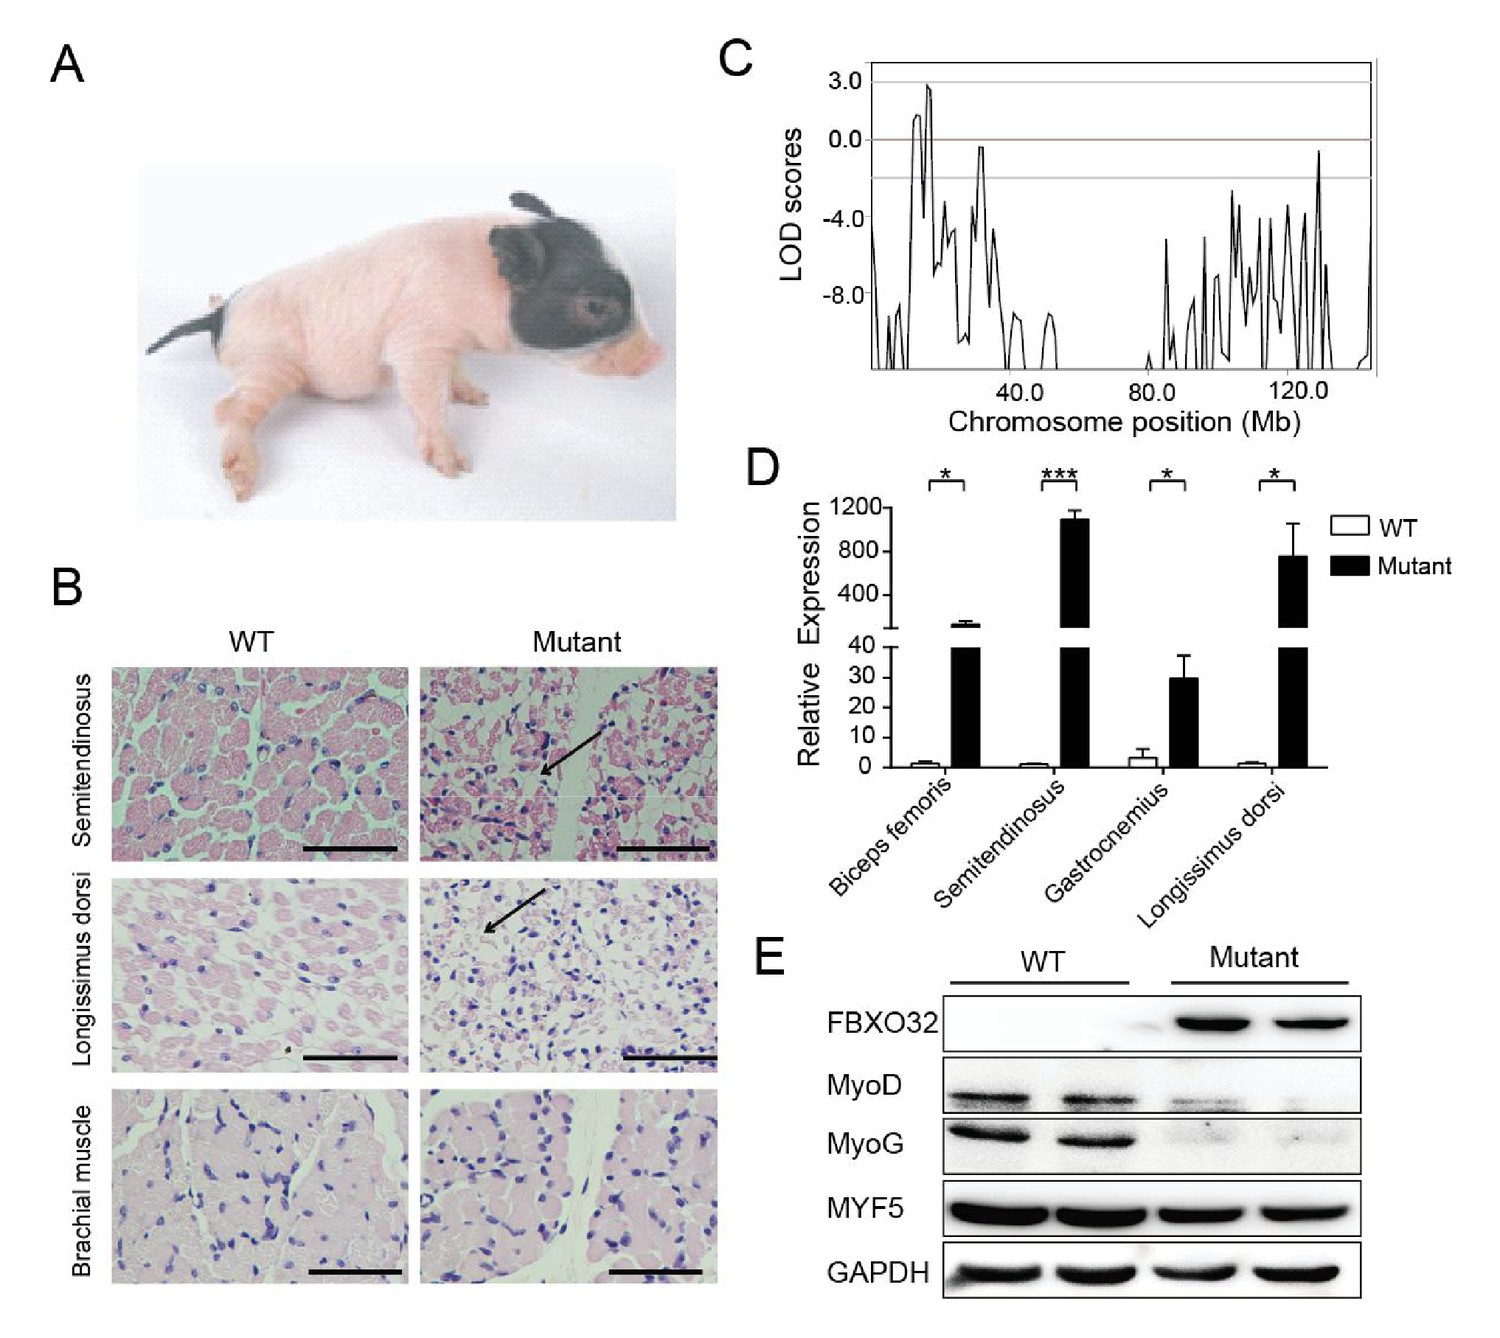
A mutant family with congenital splay leg syndrome (Z0075).
(A) An affected piglet with the splay hind leg. (B) H&E staining of the semitendinosus and longissimus dorsi showing the presence of interstitial fibrosis and the absence of forelimb muscle (brachial muscle) in the mutants (arrow). Scale bar: 50 μm. (C) GWLS analysis showing the disease locus mapped to a 16–17 Mb region of chromosome 4, where FBXO32 was included. (D) qPCR results showed that FBXO32 was highly upregulated in the skeletal muscle of the affected animals (n = 3) compared to normal controls (n = 3). *p<0.05, ***p<0.001 by unpaired Student’s t test. (E) Western blot results showed that FBXO32 was upregulated, and that MyoD and MyoG, but not MYF5 the master regulator of skeletal myogenesis, were downregulated in the affected piglets. GAPDH was used as a loading control.
-
Figure 5—source data 1
Genome-wide parametric LOD score analyses for the splay-leg mutant pedigree.
- https://doi.org/10.7554/eLife.26248.014
Figure 5—figure supplement 5

Genome-wide linkage analysis in the splay-leg mutant pedigree.
The LOD scores were computed in the linkage analysis and are shown for each chromosome. Among the whole genome, the strongest signal providingevidence of a suggested linkage (LOD = 2.81) was detected in the region of chr4: 16–17 Mb. Within this genomic interval, 20 genes were identified, among which nine genes, including FBXO32, had functional annotations (Supplementary file 4). Genetic position (Mb) is plotted along the x-axis, and the LOD Score is plotted along the y-axis.
Author response image 1
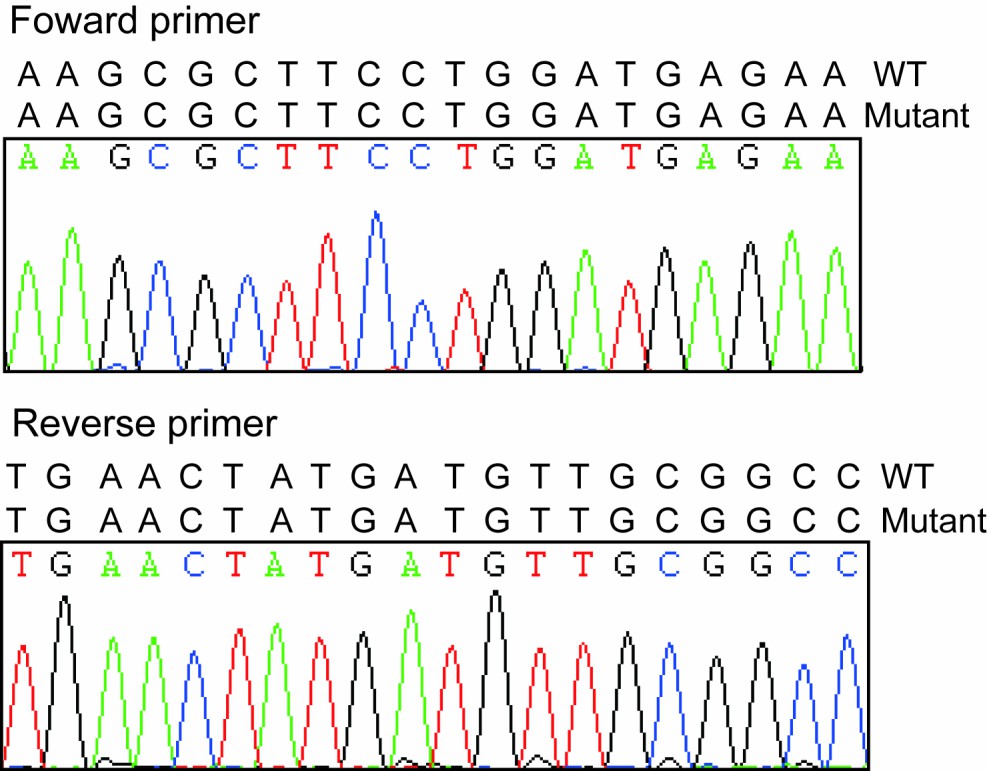
Sequencing results of forward and reverse primers.
https://doi.org/10.7554/eLife.26248.020Tables
Table 1
Screening results.
| Dominant screen | Total | Heritable mutant lines | |
|---|---|---|---|
| Pigs screened for dysmorphology phenotypes | 6,770 | - | |
| Tested for blood-based screens | 2,947 | – | |
| Genetic confirmation crosses | 36 | – | |
| Confirmation crosses still in progress | 7 | – | |
| Successfully confirmed crosses/mutants | 7 | – | |
| Recessive screen | |||
| G3 pigs screened | 6,825 | – | |
| Confirmation crosses | 91 | – | |
| Confirmation crosses still in progress | 67 | – | |
| Successfully confirmed crosses/mutants | 22 | – | |
| Growth or weight defects | |||
| Hind-limb paralysis | 1 | 1 | |
| Large body weight | 1 | 1 | |
| Small body weight | 15 | 2 | |
| Dysmorphology screen | |||
| Behavioral abnormalities | |||
| —Shaking | 1 | 1 | |
| —Skeletal defects | 4 | 2 | |
| —Developmental abnormalities | 4 | 3 | |
| —Testicular abnormalities | 2 | 1 | |
| —Abnormal genitals | 4 | 1 | |
| —Polydactyly | 1 | 1 | |
| —Curly coat | 1 | 1 | |
| —Coat color change | 24 | 8 | |
| Eye defects | |||
| —Cataract | 1 | - | |
| —Color change | 2 | - | |
| Skin abnormalities | |||
| —Chapped skin | 1 | 1 | |
| —Nude pig | 2 | 2 | |
| Ear defects | |||
| —Large ears | 1 | – | |
| —Small ears | 1 | – | |
| Blood-based screen | |||
| High cholesterol/low density lipoprotein | 8 | 2 | |
| Hyperglycemia | 4 | 1 | |
| Hernia | 6 | 1 | |
Table 2
Mapping of ENU-induced mutations.
| Line | Phenotype description | Confirmed in multiple litters | Inherited in 2nd-generation males | Chromosome regions | Affected frequencies/total offspring (%) |
|---|---|---|---|---|---|
| TBB007T095 | Hearing loss, white coat color | yes | yes | chr5: 7–71 Mb | 79/175 (45.1%) |
| Z0017, Z0022 and Z0040 | Single end black | yes | yes | chr13: 49–76 Mb (Z0040) | 6/34 (20.6%) 10/38 (26.3%) 33/99 (33.3%) |
| Z0015 | Diluted brown | yes | yes | chr15: 50–70 Mb | 14/65 (21.5%) |
| Z0009 | Chapped skin | yes | yes | chr15: 120–134 Mb | 10/50 (20.0%) |
| Z0013 | Nude skin | yes | yes | chr1: 120–144 Mb | 30/112 (26.8%) |
| Z0037 | Birth defect | yes | yes | chr2: 0–3 Mb | 19/69 (27.5%) |
| Z0078/79 | Birth defect | yes | yes | chr13: 210–216 Mb (Z0078 and Z0079) | 21/106 (19.8%) |
| Z0075 | Muscle atrophy | yes | yes | chr4: 16–17 Mb | 9/27 (33.3%) |
| Z0006 | Increased growth rate | yes | yes | chr6: 122–123 Mb | 14/60 (23.3%) |
| Z0071 | Short limbs | yes | yes | chr18: 40–50 Mb | 14/29 (48.3%) |
Additional files
-
Supplementary file 1
Summary of the 2b-RAD sequencing analysis.
- https://doi.org/10.7554/eLife.26248.016
-
Supplementary file 2
Summary of the sequenced ENU-induced mutations in two families.
- https://doi.org/10.7554/eLife.26248.017
-
Supplementary file 3
The frequency and distribution of SOX10 c. 325 A>T mutation among TBB007T095 lines and other breeds.
- https://doi.org/10.7554/eLife.26248.018
-
Supplementary file 4
Genes located in the linkage region of chr4: 16–17 Mb.
- https://doi.org/10.7554/eLife.26248.019
Download links
A two-part list of links to download the article, or parts of the article, in various formats.
Downloads (link to download the article as PDF)
Open citations (links to open the citations from this article in various online reference manager services)
Cite this article (links to download the citations from this article in formats compatible with various reference manager tools)
Pilot study of large-scale production of mutant pigs by ENU mutagenesis
eLife 6:e26248.
https://doi.org/10.7554/eLife.26248


