Eyeless uncouples mushroom body neuroblast proliferation from dietary amino acids in Drosophila
- University of Virginia, United States
Figures
Figure 1 with 1 supplement
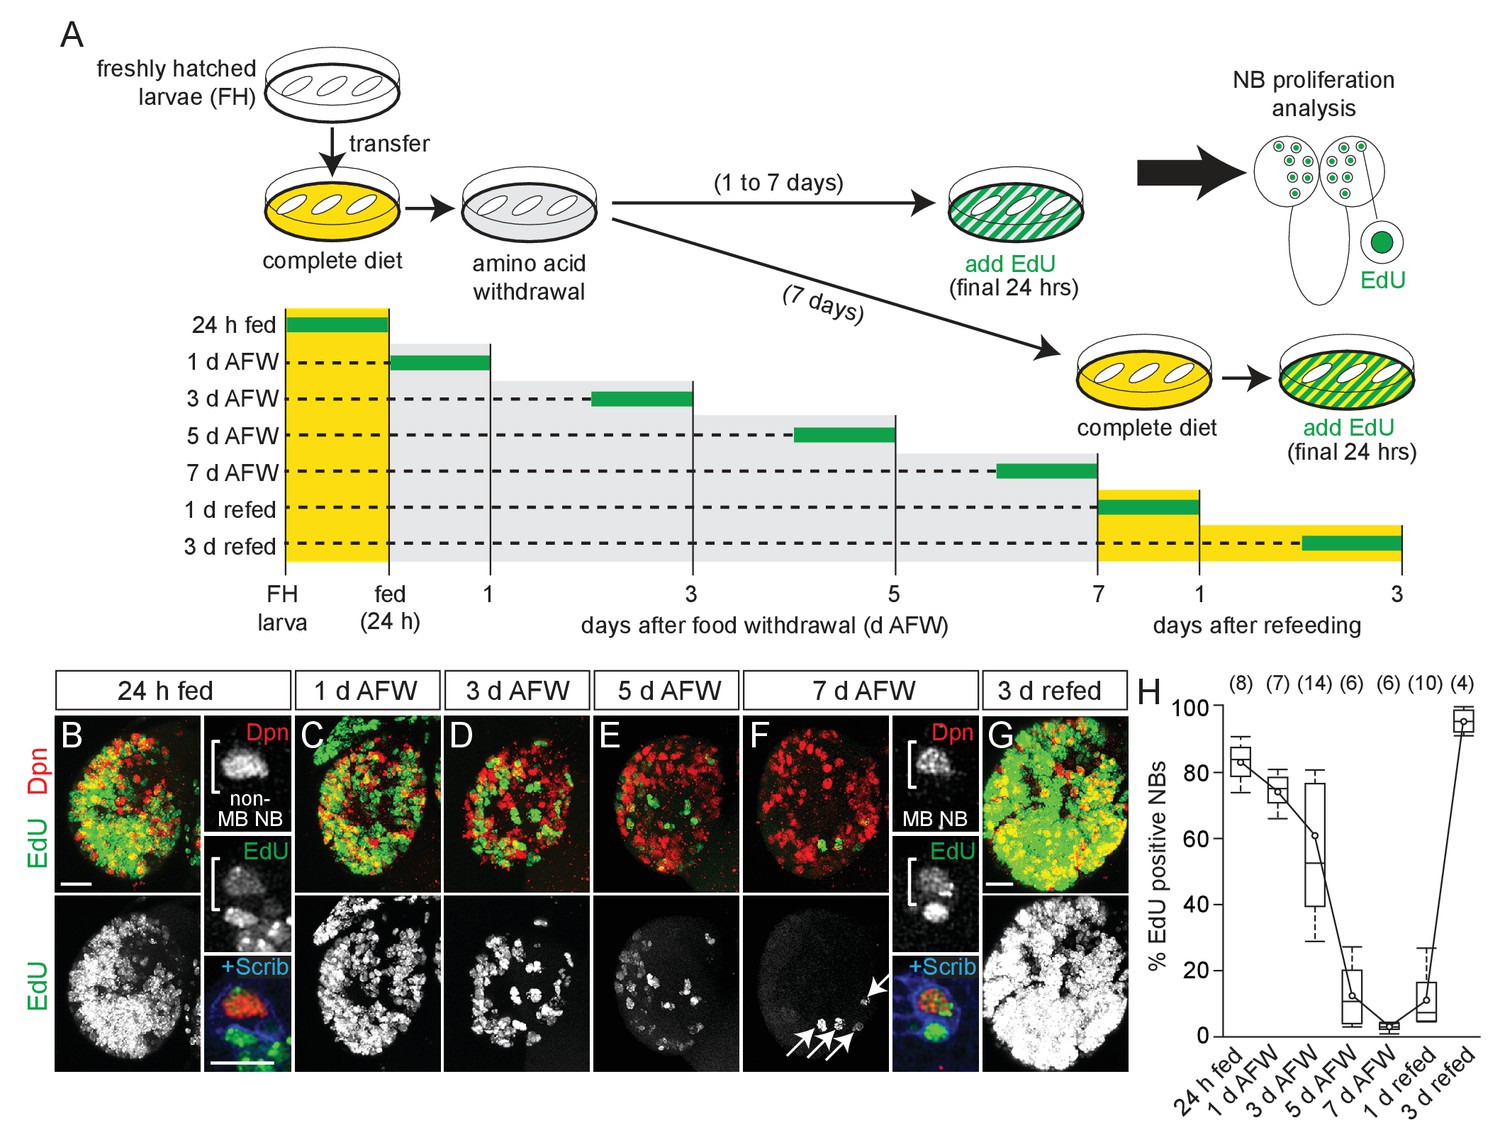
NB subtypes respond differently to dietary amino acid withdrawal.
(A) Experimental protocol to assay NB proliferation during dietary amino acid withdrawal. Freshly hatched (FH) larvae were transferred to a complete diet (yellow). Animals fed for 24 hr to reactivate NBs from quiescence and then transferred to a sucrose-only diet (grey) and maintained for 1–7 days. Twenty-four hours before analysis, EdU (green) was added to the diet to assay NB proliferation. For refeeding experiments, larvae were transferred back to a complete diet (yellow). (B–G) Maximum intensity projections of single brain hemispheres, top panel colored overlay with single-channel greyscale image below. Midline is right in this and in all subsequent figures. Scale bar, 20 µm. White arrows designate the four MB NBs. (B,F) On the right, single channel greyscale images of NBs at higher magnification with colored overlay below. Scale bar, 10 µm. NBs in white brackets. (H) Box plots of the percent EdU-positive NBs per brain hemisphere at the indicated time points. Numbers in parentheses indicate the number of brain hemispheres analyzed at each time point (refer to Materials and methods).
-
Figure 1—source data 1
Quantification of EdU-positive and Dpn-positive cells in control brains during dietary amino acid withdrawal.
- https://doi.org/10.7554/eLife.26343.005
Figure 1—figure supplement 1
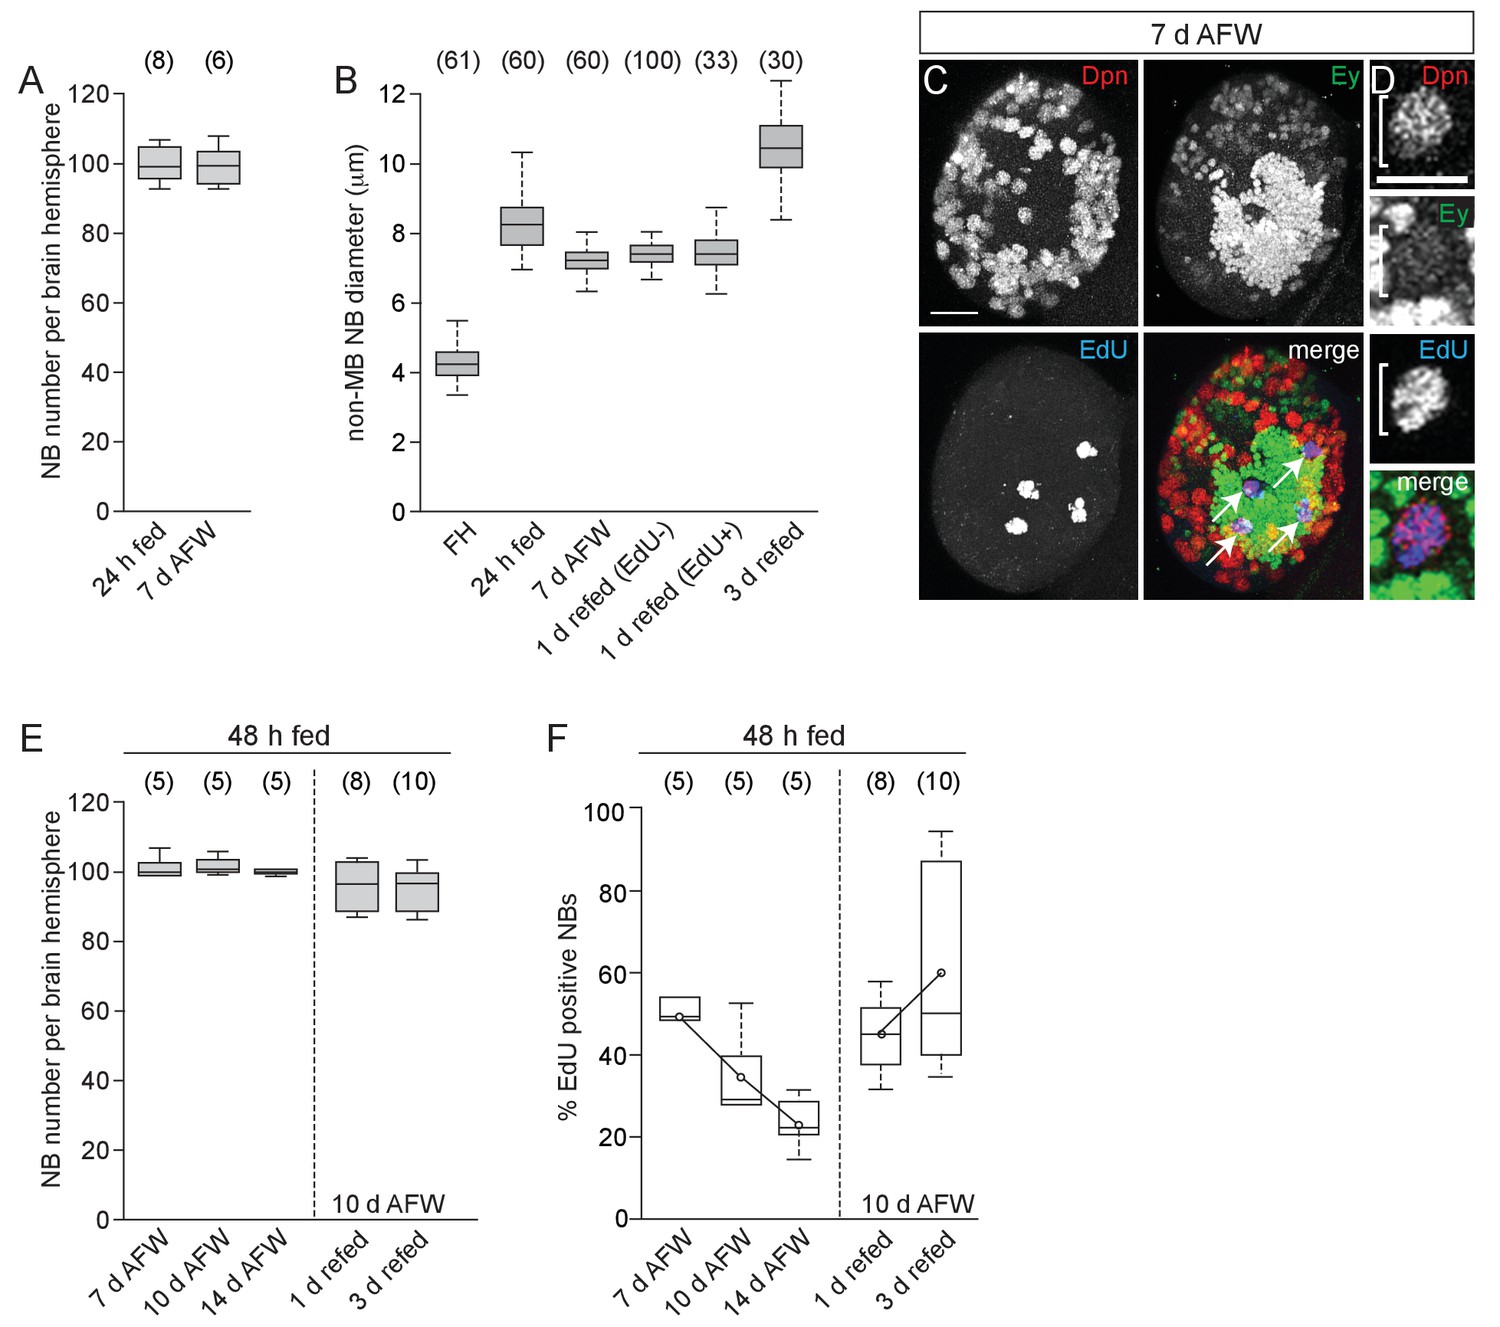
Dietary nutrients are required for NB proliferation but do not affect NB number.
(A) Box plot of the number of Dpn-positive NBs in individual brain hemispheres at the indicated time points. Numbers in parentheses indicate number of brain hemispheres analyzed. (B) Box plot of non-MB NB diameter at the indicated time points. One day refed NBs are broken into those incorporating EdU and those not. Numbers in parentheses indicate number of non-MB NBs scored. (C) Maximum intensity projection of a control brain hemisphere showing Ey expression in the four MB NBs (arrows) at 7 d AFW. (D) Single plane image of a control MB NB incorporating EdU at 7 d AFW. (E) Box plots of the number of Dpn-positive NBs in individual brain hemispheres from control larvae fed a complete diet for 48 hr, and then switched to sucrose-only for the indicated times. (F) Box plots of the percent EdU-positive NBs per brain hemisphere at the indicated time points after 48 hr of feeding. Scale bars: 20 µm, C; 10 µm, D.
-
Figure 1—figure supplement 1—source data 1
Quantification of NB number and cell size measurements in control brains fed 24 hr before dietary amino acid removal and refeeding.
Also quantification of EdU-positive and Dpn-positive cells in control brains fed 48 hr before dietary amino acid removal and refeeding.
- https://doi.org/10.7554/eLife.26343.004
Figure 2 with 1 supplement
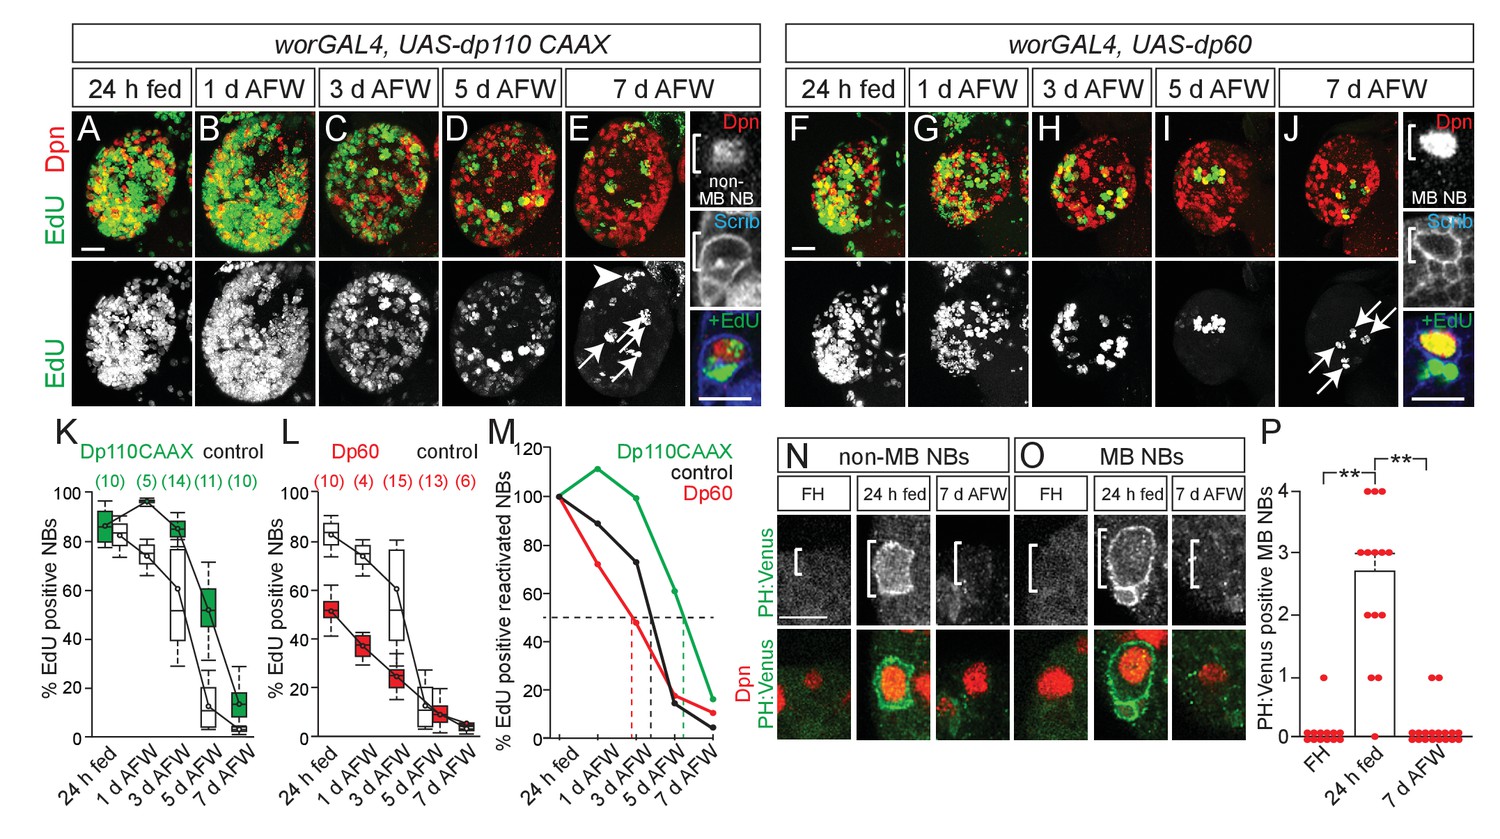
MB NBs proliferate in a PI3-kinase-independent manner during dietary amino acid withdrawal, but not non-MB NBs.
(A–J) Maximum intensity projections of single brain hemispheres, top panel colored overlay with single-channel greyscale image below. Genotypes listed above and molecular markers to the left. Scale bar, 20 µm. White arrows designate the four MB NBs. Arrowhead in E indicates non-MB NB shown to the right. (E,J) Single channel greyscale images of NBs at higher magnification on the right with colored overlay below. Scale bar, 10 µm. NBs in white brackets. (K,L) Box plots of the percent of EdU-positive NBs per brain hemisphere at the indicated time points. Numbers in parentheses indicate the number of brain hemispheres analyzed at each time point, color corresponds to genotype. (M) Percent of EdU-positive NBs normalized to the percent of reactivated NBs after 24 hr of feeding. Dotted lines indicate the time at which 50% of reactivated NBs are EdU-positive. Single channel greyscale images with color overlay below of non-MB NBs (N) and of MB NBs (O) at indicated time points listed above with reporter and molecular markers listed to the left. White brackets denote NBs. and scale bar (N) equals 10 µm. (P) Histogram of average number of MB NBs positive for membrane PH:Venus fluorescence. p-values are 2.7 × 10⁻⁷ and 6.9 × 10⁻⁹, respectively (Student's t-test). Small circles denote primary data.
-
Figure 2—source data 1
Quantification of EdU-positive and Dpn-positive cells in brains expressing UAS-dp110 CAAX and UAS-dp60 in NBs during dietary amino acid withdrawal and quantification of MB NBS in PH:Venus animals.
- https://doi.org/10.7554/eLife.26343.009
Figure 2—figure supplement 1
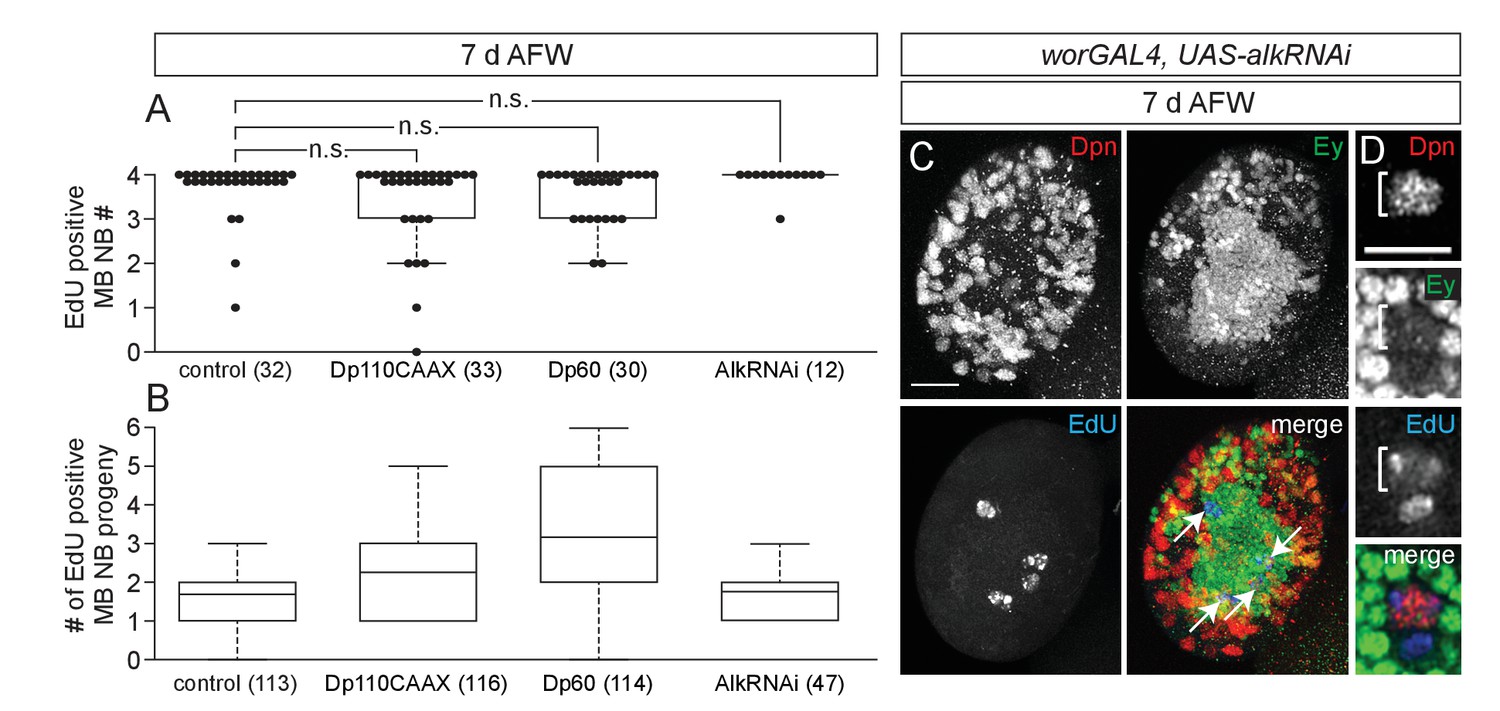
Altered PI3-kinase activity or reduced Alk levels do not affect EdU incorporation in MB NBs or their progeny.
(A) Box plot of the number of EdU-positive MB NBs at 7 d AFW for the indicated genotypes. p-values are 0.17, 0.37, and 0.50, respectively (Student's t-test). Numbers in parentheses indicate number of brain hemispheres analyzed. (B) Box plot of the number of EdU-positive progeny per MB NB at 7 d AFW for the indicated genotypes. Numbers in parentheses indicate number of MB NBs scored. (C) Maximum intensity projection of a single alkRNAi brain hemisphere at 7 d AFW. White arrows indicate the 4 MB NBs. (D) Single plane image of an alkRNAi MB NB incorporating EdU at 7 d AFW. Scale bars: 20 µm, C; 10 µm, D.
-
Figure 2—figure supplement 1—source data 1
Quantification of EdU-positive MB NBs and their EdU-positive progeny in brains of the indicated genotypes.
- https://doi.org/10.7554/eLife.26343.008
Figure 3

Eyeless is expressed in MB NBs.
(A,E,I,M) Maximum intensity projections of single brain hemispheres, single-channel greyscale image in top panel with colored overlay below. Genotypes and developmental stage listed above and molecular makers listed within panels. The field of Ey-positive MB neurons outlined in white in A,I,M. (A,E,I,M) Scale bar equals 20 µm. (B–D,F,J–L,N–Q) MB NBs or non-MB NBs at higher magnification from indicated genotypes and time points. Single plane NBs marked in white brackets. (B,F,J,N) Scale bars equals 10 µm. (G,H) Percentage of non-MB NBs or MB NBs expressing Ey per brain hemisphere. Column numbers indicate number of brain hemispheres scored. (R–T) Quantification of average relative Ey fluorescence in MB NBs and in non-MB NBs (see Materials and methods). Column numbers equal number of NBs scored. **p-value<0.001, *p-value<0.01, two-tailed t-test, error bars, SEM.
-
Figure 3—source data 1
Quantification of Ey expression in MB NBs and in non-MB NBs in brains of control animals and in brains of animals expressing either UAS-eyRNAi or UAS-eyWT.
- https://doi.org/10.7554/eLife.26343.011
Figure 4

Eyeless is required for nutrient-independent MB NB proliferation.
(A,C,E) Maximum intensity projections of the four MB NBs (indicated by arrows) from the indicated genotype and time points. Brackets indicate two of the four MB NBs shown at higher magnification in right panels. (B,D,F) Box plots of the number of EdU-positive MB NBs per brain hemisphere from the indicated genotypes and time points. Small circles denote primary data. Numbers in parentheses indicate the number of brain hemispheres analyzed. (G–J) Maximum intensity projections of single brain hemispheres, top panel colored overlay with single-channel greyscale image below. Genotype and time points listed above, and molecular markers to the left. Arrows in (J) indicate the four MB NBs, arrowhead marks a non-MB NB shown at higher magnification at right (white brackets). (L) Box plots of the percent EdU-positive NBs per brain hemisphere at the indicated time points. Numbers in parentheses indicate the number of brain hemispheres analyzed at each time point, color corresponds to genotype. (M) Percent of EdU-positive NBs normalized to the percent of reactivated NBs after 24 hr of feeding. Dotted lines indicate the time at which 50% of reactivated NBs are EdU-positive. (N) Box plot of the number of EdU-positive NBs in each brain hemisphere at 7 d AFW. Small circles denote primary data; those in the gray-shaded area are brain lobes in which only MB NBs are EdU-positive. Numbers in parentheses indicate number of brain hemispheres analyzed. Scale bars: A (large panel), G: 20 µm; A (small panel), K: 10 µm.
-
Figure 4—source data 1
Quantification of EdU-positive MB NBs in brains expressing UAS-eyRNAi and UAS-eyWT during dietary amino acid withdrawal.
- https://doi.org/10.7554/eLife.26343.013
Additional files
-
Supplementary file 1
Candidate Drosophila metabolic genes regulated by Ey.
To assemble the list of candidate genes, regions 1 kb upstream and 200 bp downstream of annotated Drosophila promoters were searched using a position weight matrix of the Ey-binding site (Punzo et al., 2002). This set was then compared against a pre-compiled background dataset comprised of distribution scores for promoter-binding sites across the genome, allowing a determination of the likelihood of a given site as a putative Ey regulatory element. Candidates were further refined to genes with a known function in metabolism using Gene Ontology terms.
- https://doi.org/10.7554/eLife.26343.014
-
Transparent reporting form
- https://doi.org/10.7554/eLife.26343.015
Download links
A two-part list of links to download the article, or parts of the article, in various formats.
Downloads (link to download the article as PDF)
Open citations (links to open the citations from this article in various online reference manager services)
Cite this article (links to download the citations from this article in formats compatible with various reference manager tools)
Eyeless uncouples mushroom body neuroblast proliferation from dietary amino acids in Drosophila
eLife 6:e26343.
https://doi.org/10.7554/eLife.26343


