Molecular mechanism of voltage-dependent potentiation of KCNH potassium channels
- University of Washington, United States
Figures
Figure 1 with 1 supplement
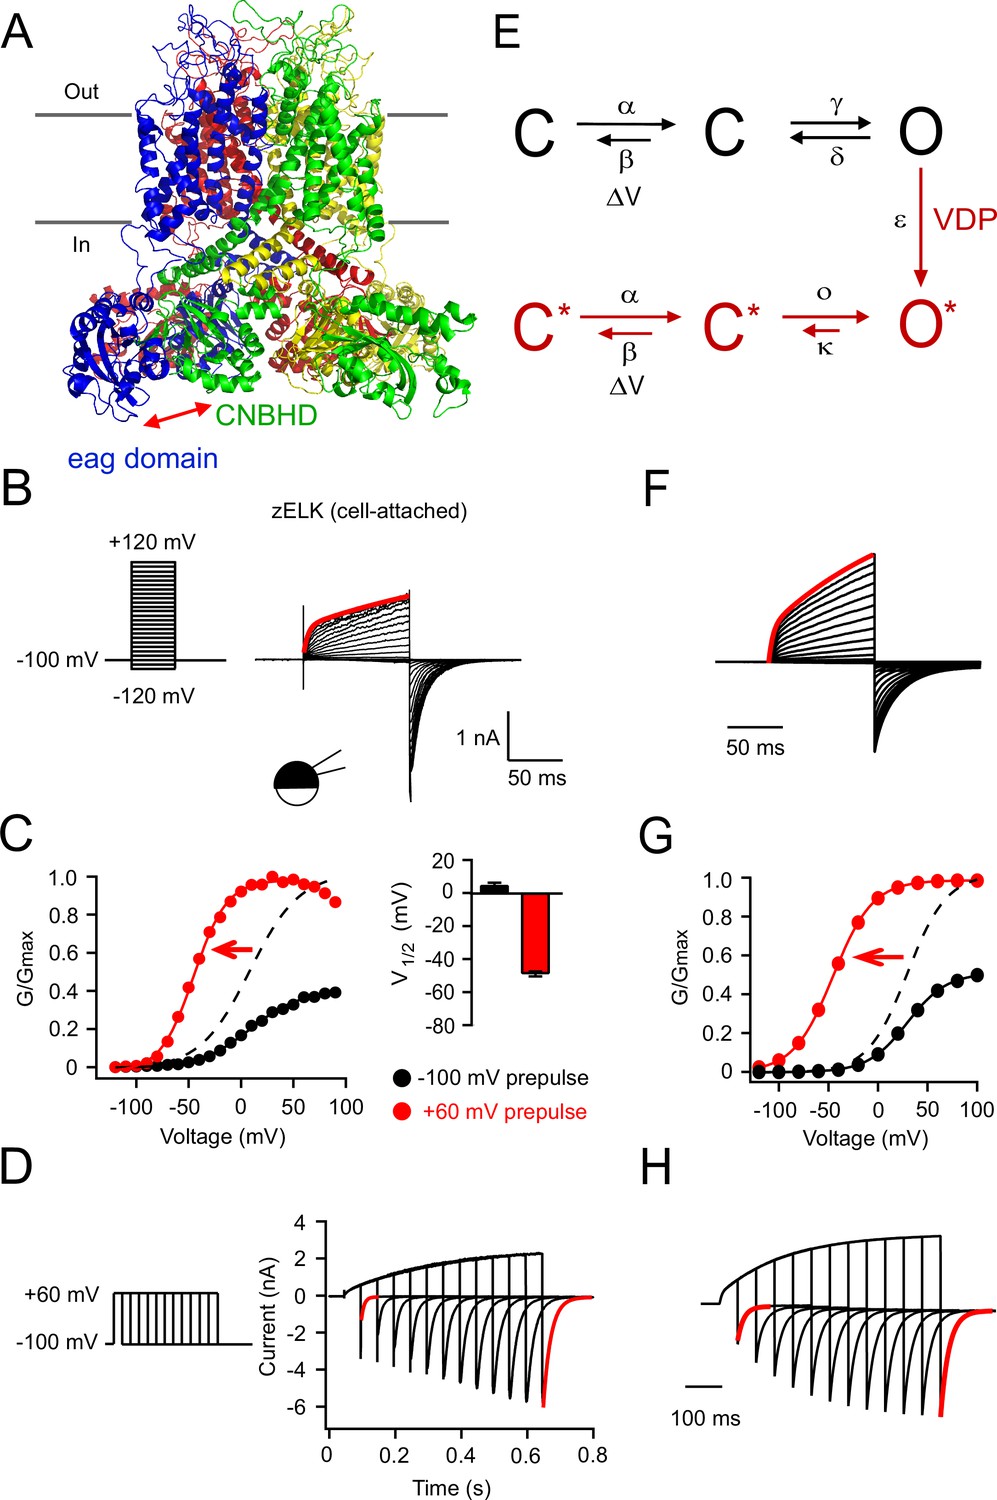
VDP of zELK channels.
(A) Homology model of the structure of the zELK channel illustrating the intersubunit eag domain-CNBHD interaction (side-view parallel to the plasma membrane), based on the cryo-EM structure of the rEAG1 channel (PDB code: 5K7L) (Whicher and MacKinnon, 2016). Red arrow highlights the direct eag domain-CNBHD interaction. (B) Representative current-voltage (I–V) recordings of zELK channels in the cell-attached configuration using the voltage protocol on the left. The red trace is the double-exponential fitting of the current elicited by a +120 mV voltage pulse (τ1 = 4 ms and τ2 = 206 ms). (C) Representative conductance-voltage (G–V) curves of zELK channels in the cell-attached configuration without and with a +60 mV prepulse. The dashed curve is the same data as the black solid curve but normalized to the amplitude of the red curve. (Right) Summary of the V1/2 of the G-V curves from multiple patches (n = 4–14). (D) zELK currents (right) elicited by a voltage protocol with increasing durations of +60 mV pulse (left). The deactivation time constants for the red traces are 8.5 and 22.9 ms respectively). (E) A 6-state kinetic model for the VDP of KCNH channels. (F–H) Simulated data based on the 6-state model for zELK channels using QuB software (State University of New York at Buffalo) using the same protocols as panels B–D respectively. Voltage-dependent rate constants are given by k(V) = k0 exp(k1V), where V is voltage, k0 is the rate at 0 mV, and k1 the voltage dependence of the rate. For the forward rate constant α of the voltage-dependent transition: k0 = 80 s−1 and k1 = 0.025 mV−1; for the reverse rate constant β of the voltage-dependent transition: k0 = 600 s−1 and k1 = −0.025 mV−1. For the rate constant of the VDP transition step: ε = 35 s−1. For the other transitions illustrated: γ = 60 s−1, d = 200 s−1, ο = 5000 s−1, κ = 70 s−1.
Figure 1—figure supplement 1
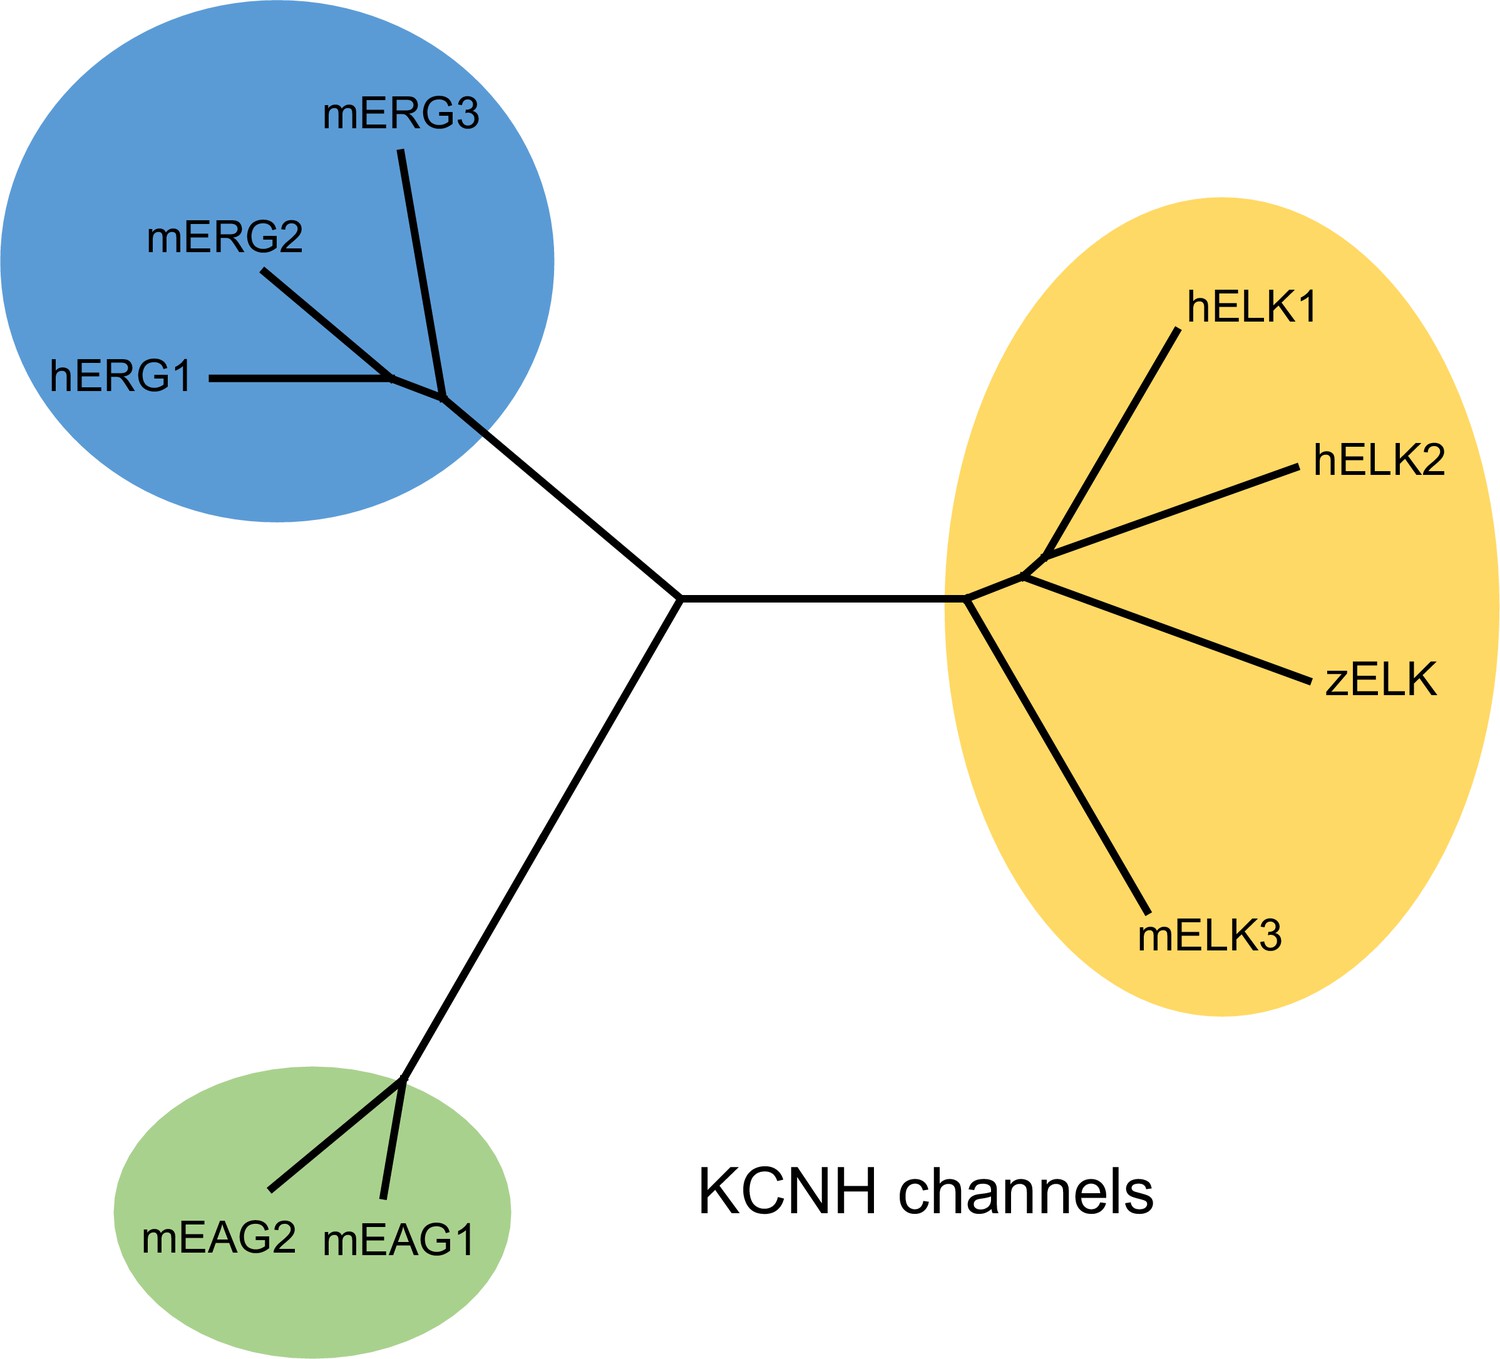
Dendrogram of KCNH channel family.
Phylogenetic tree illustrating the evolutionary relationships of EAG, ERG and ELK channels in the KCNH channel family.
Figure 2 with 1 supplement

Run-up of zELK channels and loss of VDP after patch excision.
(A) Representative I-V recordings of zELK channels immediately after excision (left) and 20 mins after excision (middle) in the inside-out configuration, as well as after patch cramming (right) using the same voltage protocol illustrated in Figure 1B. (B) Time course of the V1/2 change of the G-V curve of zELK channels after patch excision; patch-cramming restored the V1/2 to that before patch excision (n = 3–6). (C) Representative G-V curves of zELK channels in the cell-attached configuration (black), in the inside-out configuration with a −100 mV prepulse (blue), and with a +60 mV prepulse (red) (see the legend in panel G). (D) zELK currents elicited by a voltage protocol with increasing durations of +60 mV pulse in the inside-out configuration (same protocol illustrated in Figure 1D). The deactivation time constants for the red traces are 10.3 and 13.7 ms respectively). (E) Plot of the time constants of deactivation versus the duration of the +60 mV pulse for zELK channels in inside-out patches with and without ATP/Mg2+ (n = 4). The corresponding data for the cell-attached configuration is shown for comparison. (F) I-V recordings of zELK channels in inside-out patches with ATP/Mg2+ in the bath solution showing no run-up after patch excision. (G) G-V curves of zELK channels in the same conditions as panel C with the addition of 2 mM ATP/Mg2+ to the bath solution. (H) zELK current elicited using the same voltage protocol in Figure 1D, with 2 mM ATP/Mg2+ in the bath solution. The deactivation time constants for the red traces are 7.2 and 14.3 ms, respectively.
Figure 2—figure supplement 1
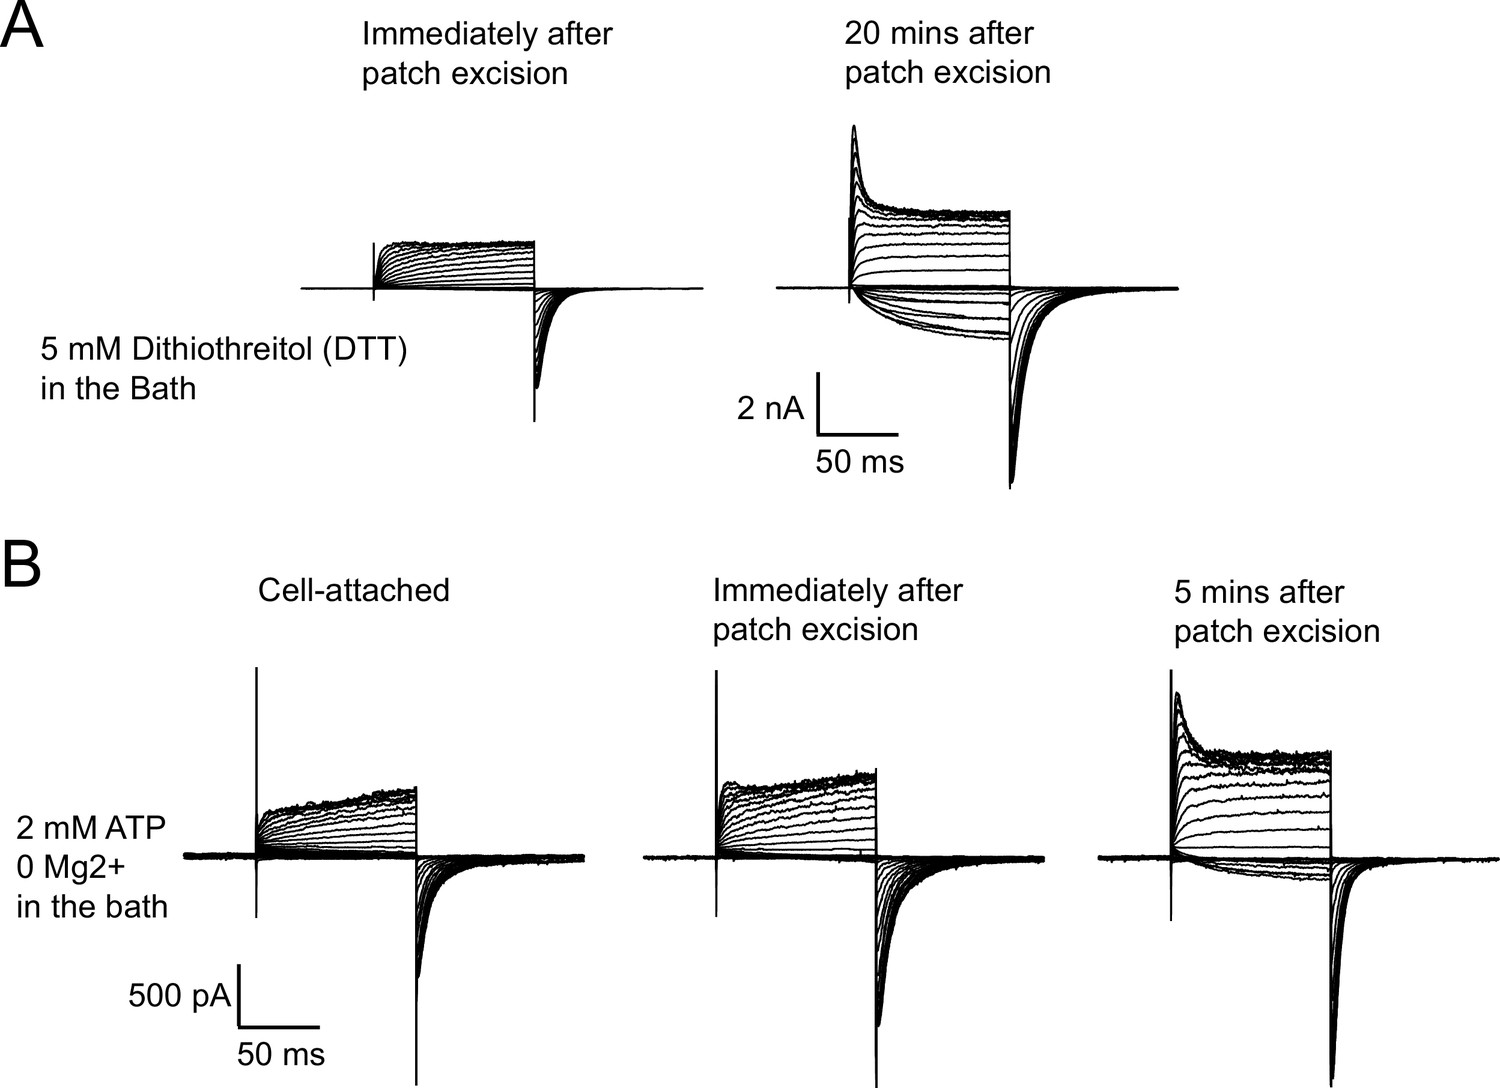
Run-up of zELK channels is not prevented by reducing agents or ATP without Mg2+.
(A) Representative I-V recordings showing 5 mM DTT was not able to prevent the run-up of zELK channels after patch excision. (B) Representative I-V recordings showing 1 mM ATP alone without Mg2+ failed to prevent the run-up of zELK channels after patch excision.
Figure 3
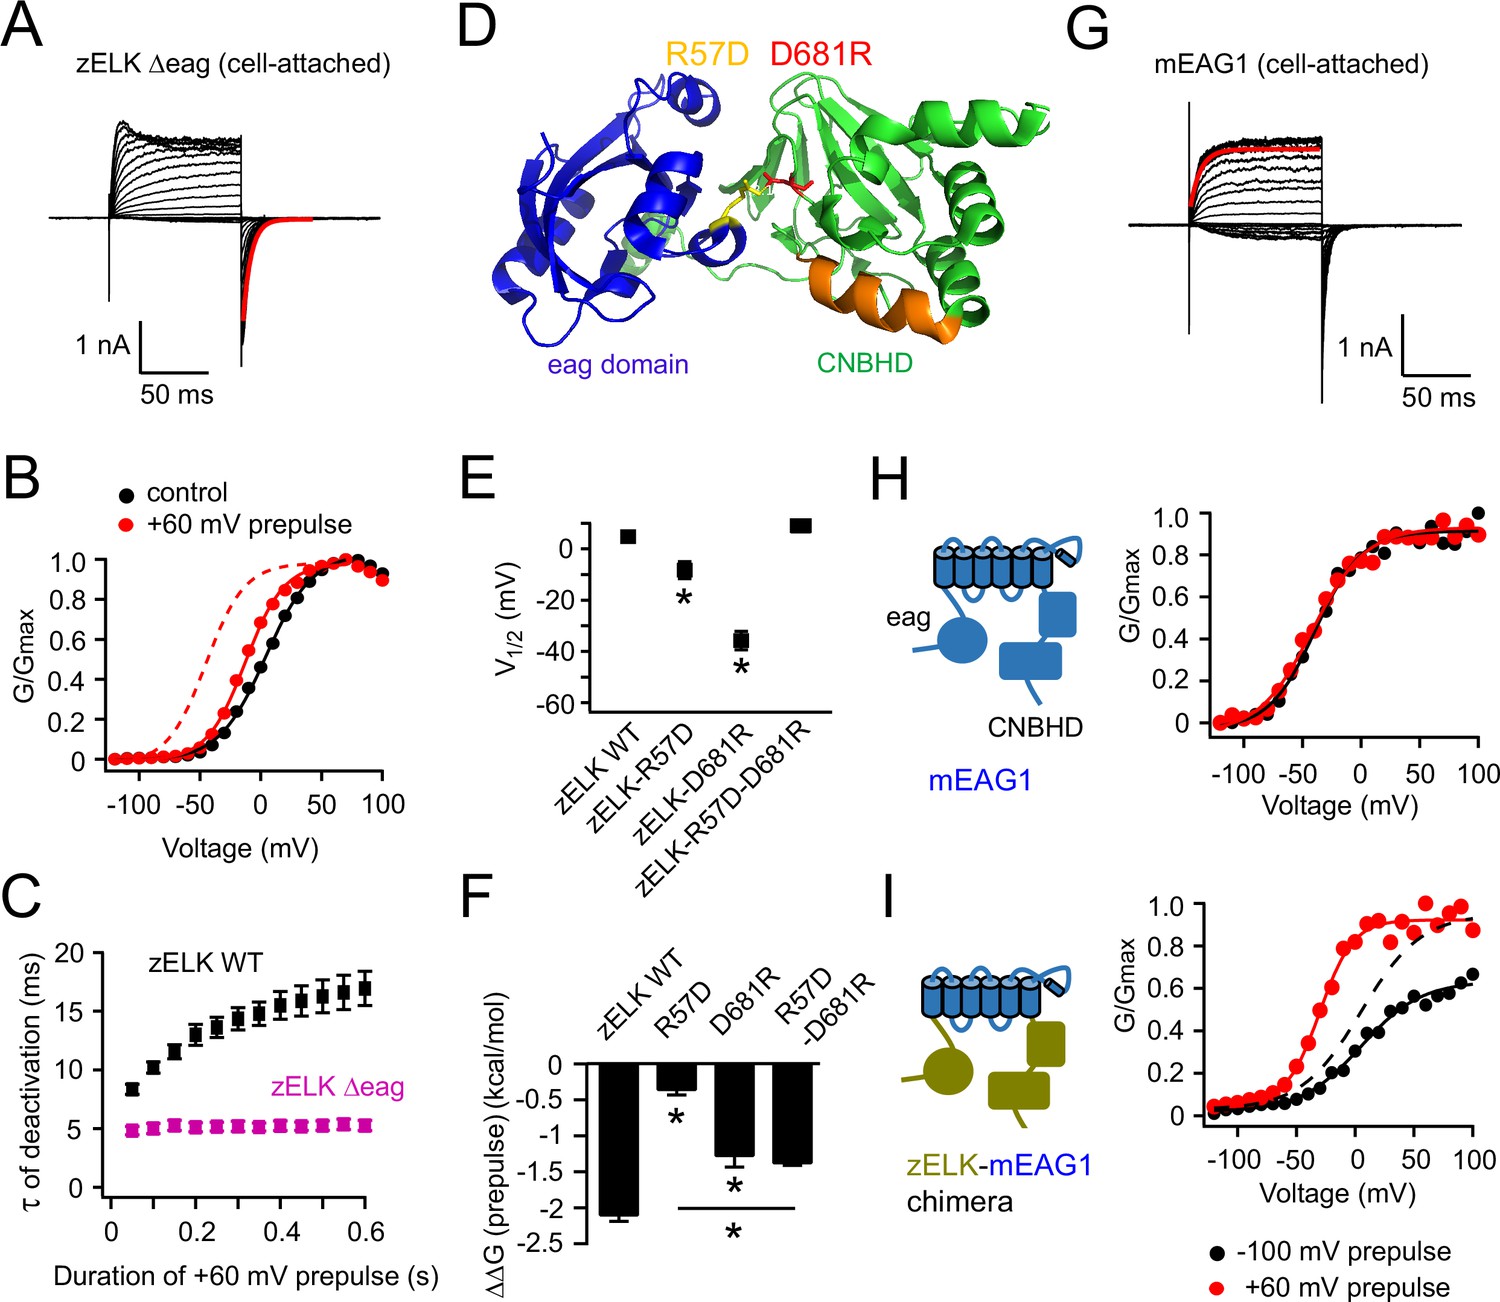
Structural perturbations of the eag domain and CNBHD impair VDP.
(A) I-V recordings of zELK Δeag channels in the cell-attached configuration (τ = 5.9 ms for the faster deactivation highlighted in red). (B) Representative G-V curves for zELK Δeag channels without or with a +60 mV prepulse. The dashed trace illustrates the G-V curve of the wild-type channel after a +60 mV prepulse. (C) Plot of the time constant for deactivation vs. the duration of the +60 mV pulse for zELK Δeag channels. (D) Ribbon structure of the eag domain/CNBHD complex of mEAG1 channels (PDB code: 4LLO) (Haitin et al., 2013), highlighting a salt bridge between the eag domain and CNBHD formed by R57 and D681 in the analogous positions of zELK. (E) and (F) Summary of effects of salt-bridge mutations on V1/2 (E) and VDP measured by ΔΔG (prepulse) (F), (n = 4–5). *p<0.05. (G) Representative I-V recordings of mEAG1 channels showing that the kinetics of activation has only one component (τ = 7.7 ms for the red trace). The fit is applied to the exponential activation following small sigmoidal delay. (H) G-V curves of mEAG1 channels in the same conditions as panel B. (I) G-V curves of a zELK-mEAG1 chimera containing the N- and C-terminal intracellular domains from zELK and transmembrane (S1–S6) domain from mEAG1. The dashed curve is the same data as the black solid curve but normalized to the amplitude of the red curve.
Figure 4
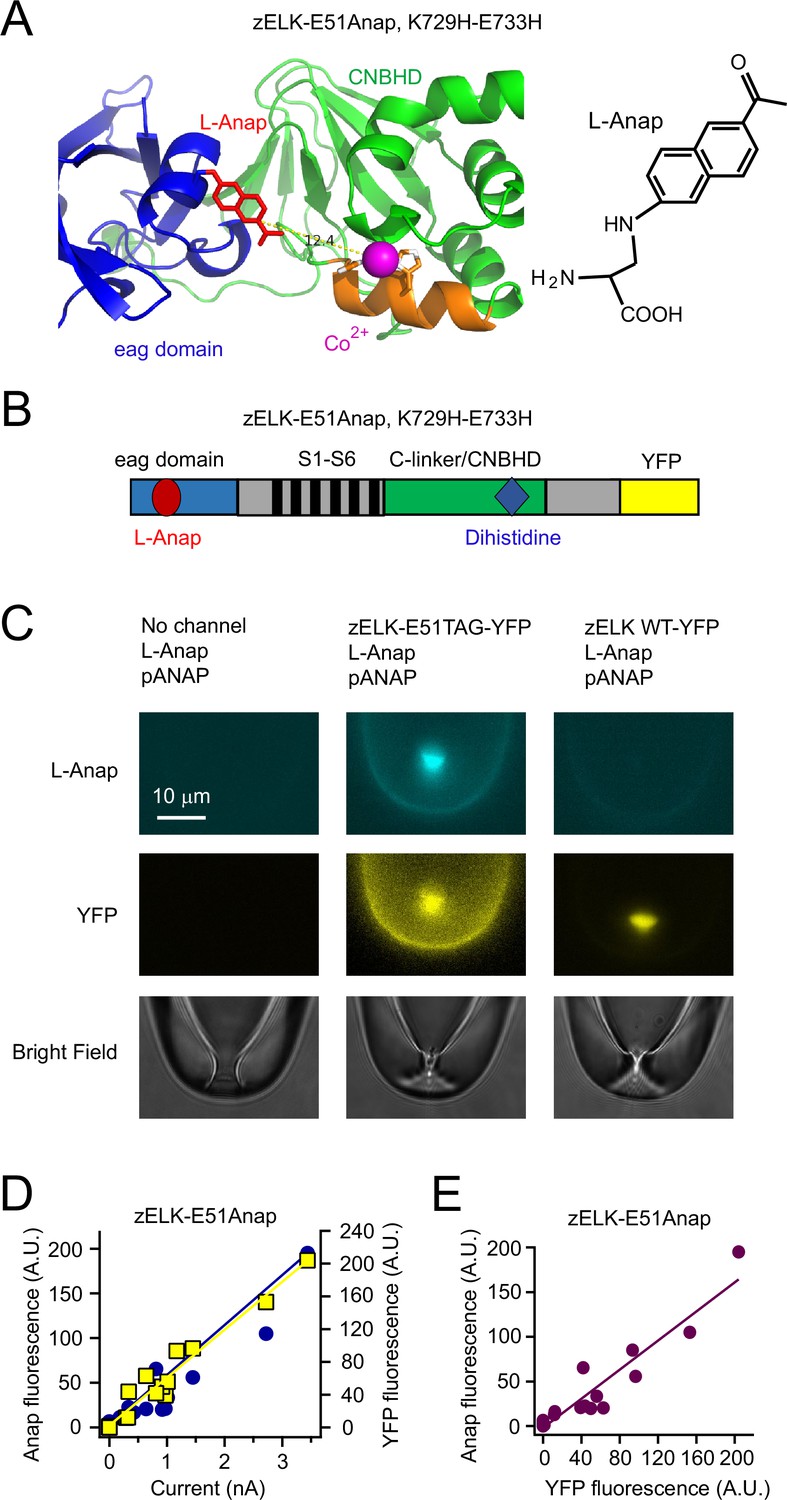
Strategy of combining tmFRET, patch-clamp fluorometry and a fluorescent noncanonical amino acid L-Anap to study conformational changes of zELK channels.
(A) Ribbon diagram of eag domain-CNBHD complex illustrating the strategy of using tmFRET between an noncanonical amino acid L-Anap (structure shown on the right) and Co2+ chelated by dihistidines to measure interdomain (intramolecular) distances. (B) Cartoon illustrating the zELK channel construct with L-Anap site, dihistidine site, and C-terminal YFP. (C) Representative patch-clamp fluorometry images showing the specific incorporation of L-Anap into zELK channels using the amber stop-codon suppression strategy. (D) and (E) L-Anap fluorescence in patches correlated with zELK channel current (D) or YFP fluorescence (E).
Figure 5 with 2 supplements
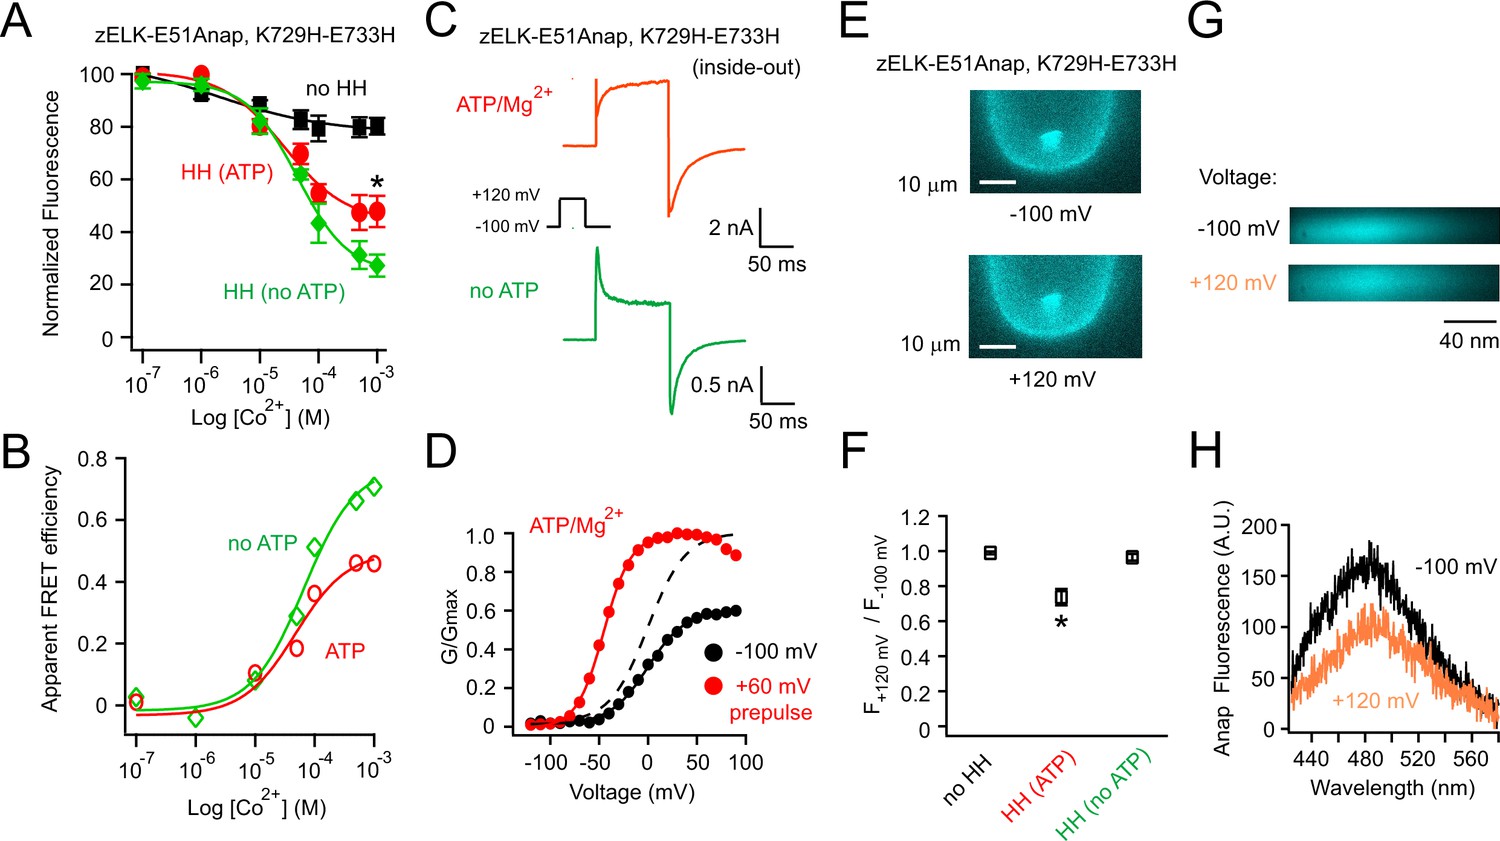
Measuring the ATP/Mg2+-dependent and voltage-dependent change in the distance between the eag domain and CNBHD of zELK channels using tmFRET.
(A) Quenching of Anap fluorescence measured using PCF by different concentrations of Co2+ with or without dihistidines and in the absence and presence of 2 mM ATP/Mg2+ at the resting holding voltage of −100 mV. (B) tmFRET efficiency as a function of Co2+ concentration in the absence and presence of ATP/Mg2+ as described. The smooth curves are fits of the Langmuir isotherm, Apparent FRETeff. = FRETeff [Co2+] / (K1/2 + [Co2+]), with the following parameters: FRETeff = 0.46, K1/2 = 48.0 µM with ATP (red) and FRETeff = 0.71, K1/2 = 66.1 µM without ATP (green). For the control construct zELK-E51Anap without the dihistidine, the quenching data with and without ATP/Mg2+ were merged since ATP/Mg2+ did not produce any significant difference. (C) Inside-out patch-clamp recordings of zELK E51Anap, K729H-E733H channels exhibiting a ATP/Mg2+-dependent slow component of activation typical of VDP in wild-type zELK channels. (D) Representative G-V curves of zELK-E51Anap, K729H-E733H channels exhibiting prepulse-dependent shift in the voltage-dependence of activation typical of VDP in wild-type zELK channels (different patch from panel C). (E) Representative PCF images showing Anap fluorescence decreased when the membrane voltage was stepped from −100 mV to +120 mV for zELK-E51Anap, K729H-E733H channels in the presence of 1 mM Co2+ and ATP/Mg2+ in the bath. (F) Summary data showing the Anap fluorescence decrease by depolarization was abolished without the dihistidines or when the VDP disappeared in the absence of ATP/Mg2+ (n = 5), *p<0.05. The fluorescence was measured using a bandpass filter for Anap emission. (G) Spectral images of L-Anap emission at −100 mV and +120 mV. (H) Emission spectra from the spectral images shown in panel G.
Figure 5—figure supplement 1
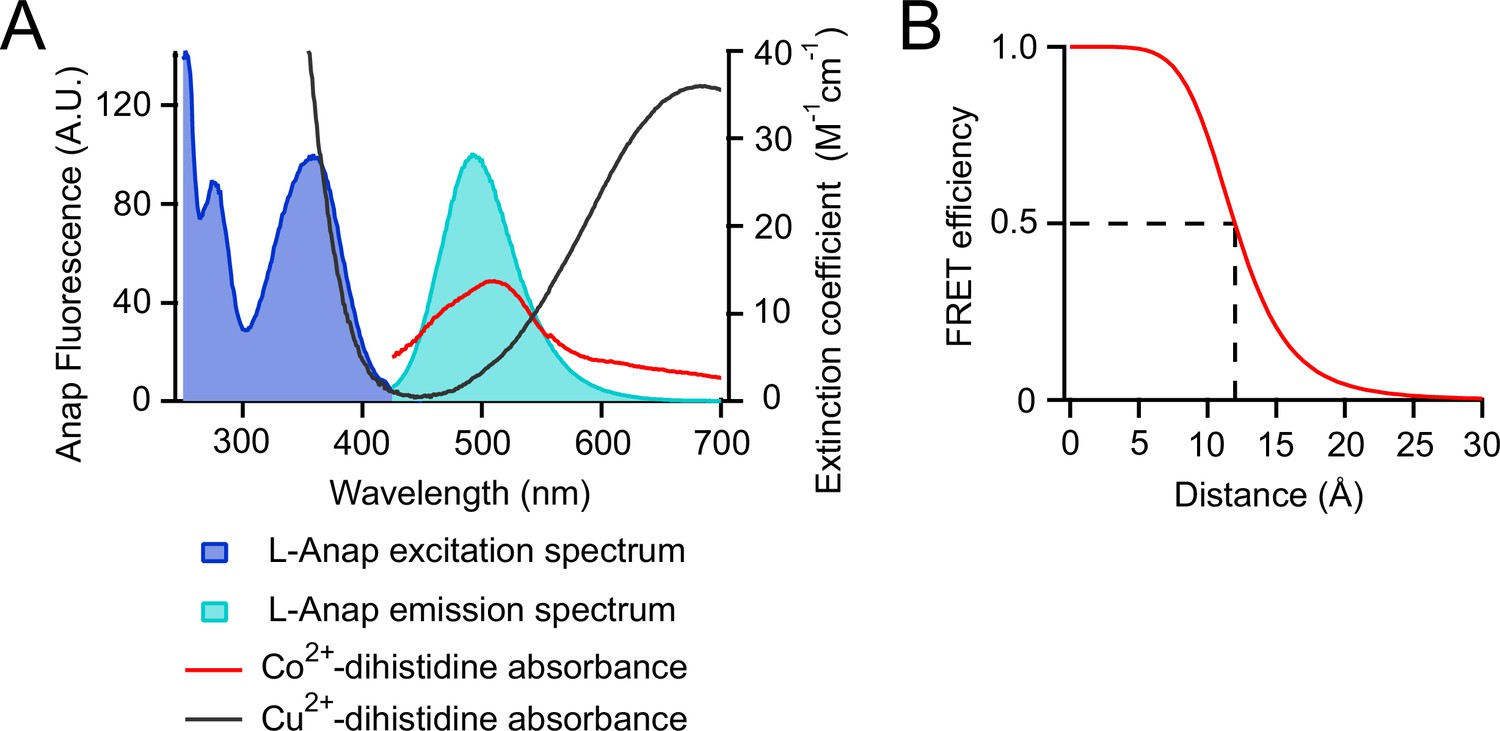
tmFRET between L-Anap and transition metal ions.
(A) Spectra of L-Anap excitation and emission and absorbance (measured as extinction coefficient) of cobalt and copper coordinated by a dihistidine pair. (B) Förster distance of the L-Anap/Co2+-dihistidine FRET pair (labeled with the dashed line).
Figure 5—figure supplement 2
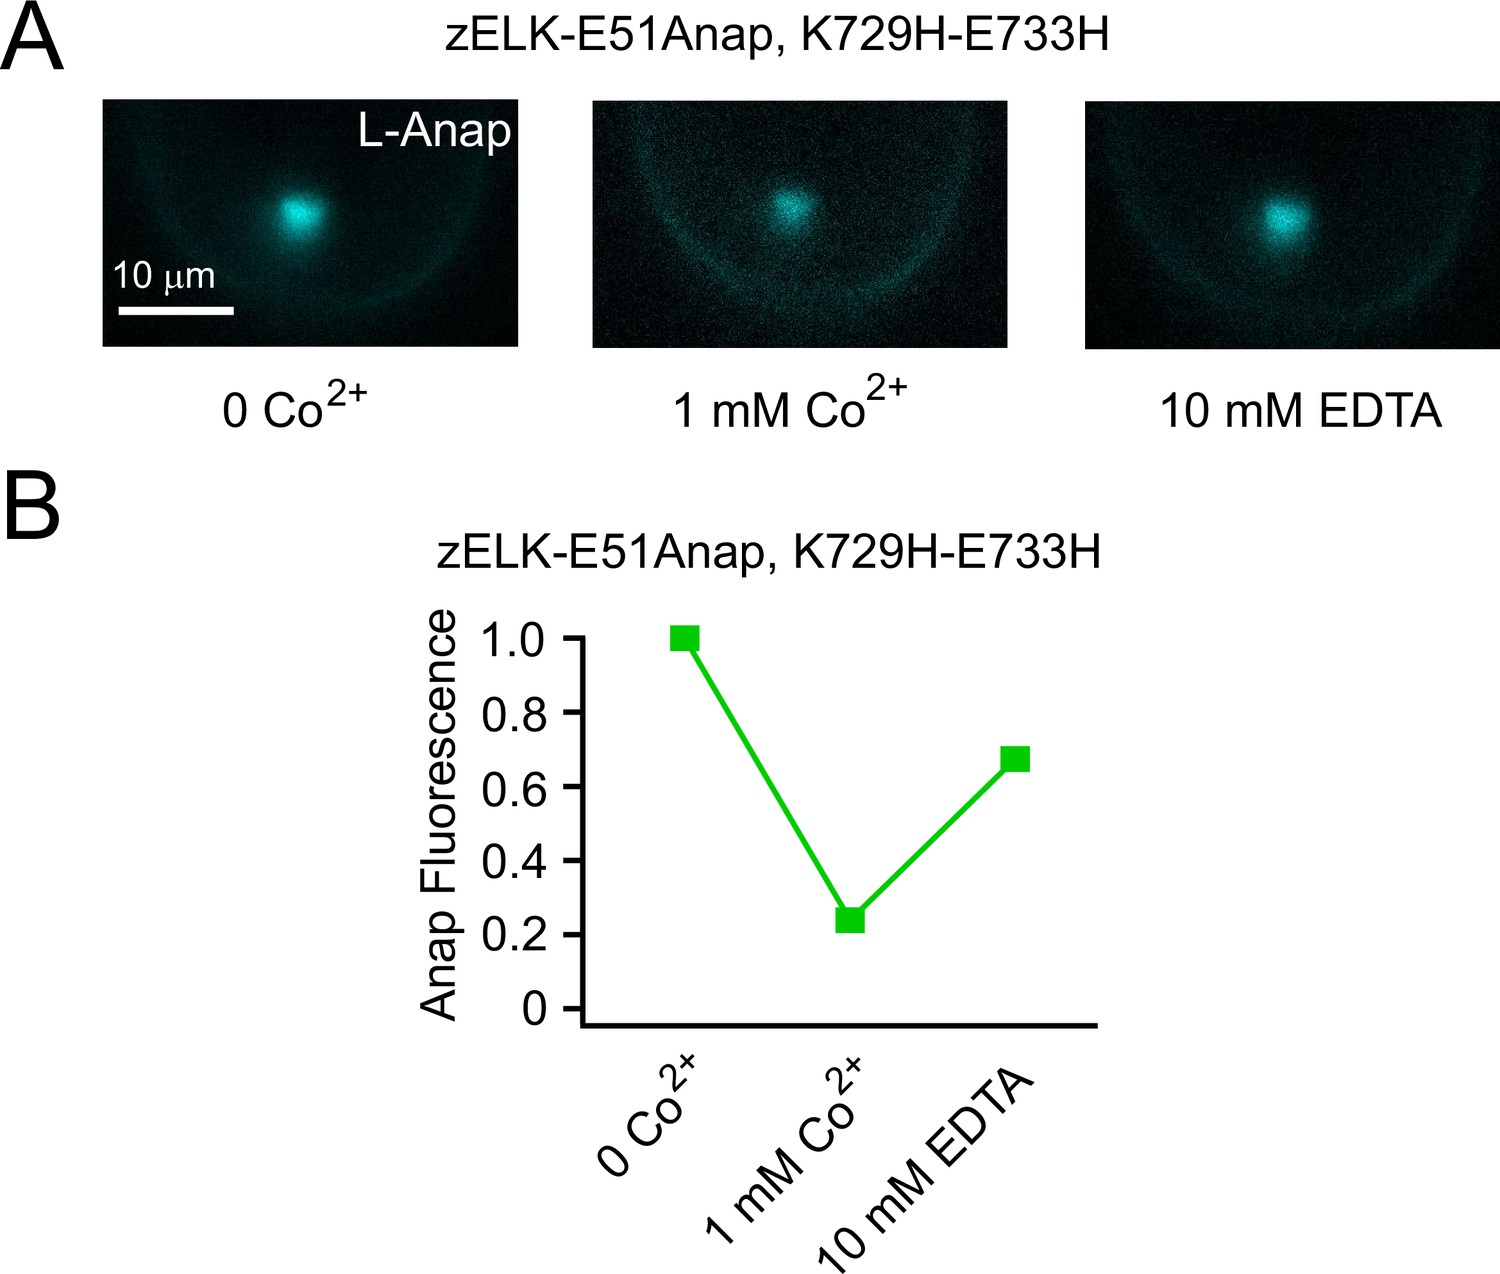
Reverse of Co2+ quenching by EDTA.
(A) Representative PCF images of Anap fluorescence from zELK-E51Anap, K729H-E733H channels, for the control, 1 mM Co2+ and the subsequent application of 10 mM EDTA. (B) Quantification of the Anap fluorescence of the conditions in panel A for zELK-E51Anap, K729H-E733H channels. Background fluorescence was subtracted.
Figure 6 with 1 supplement
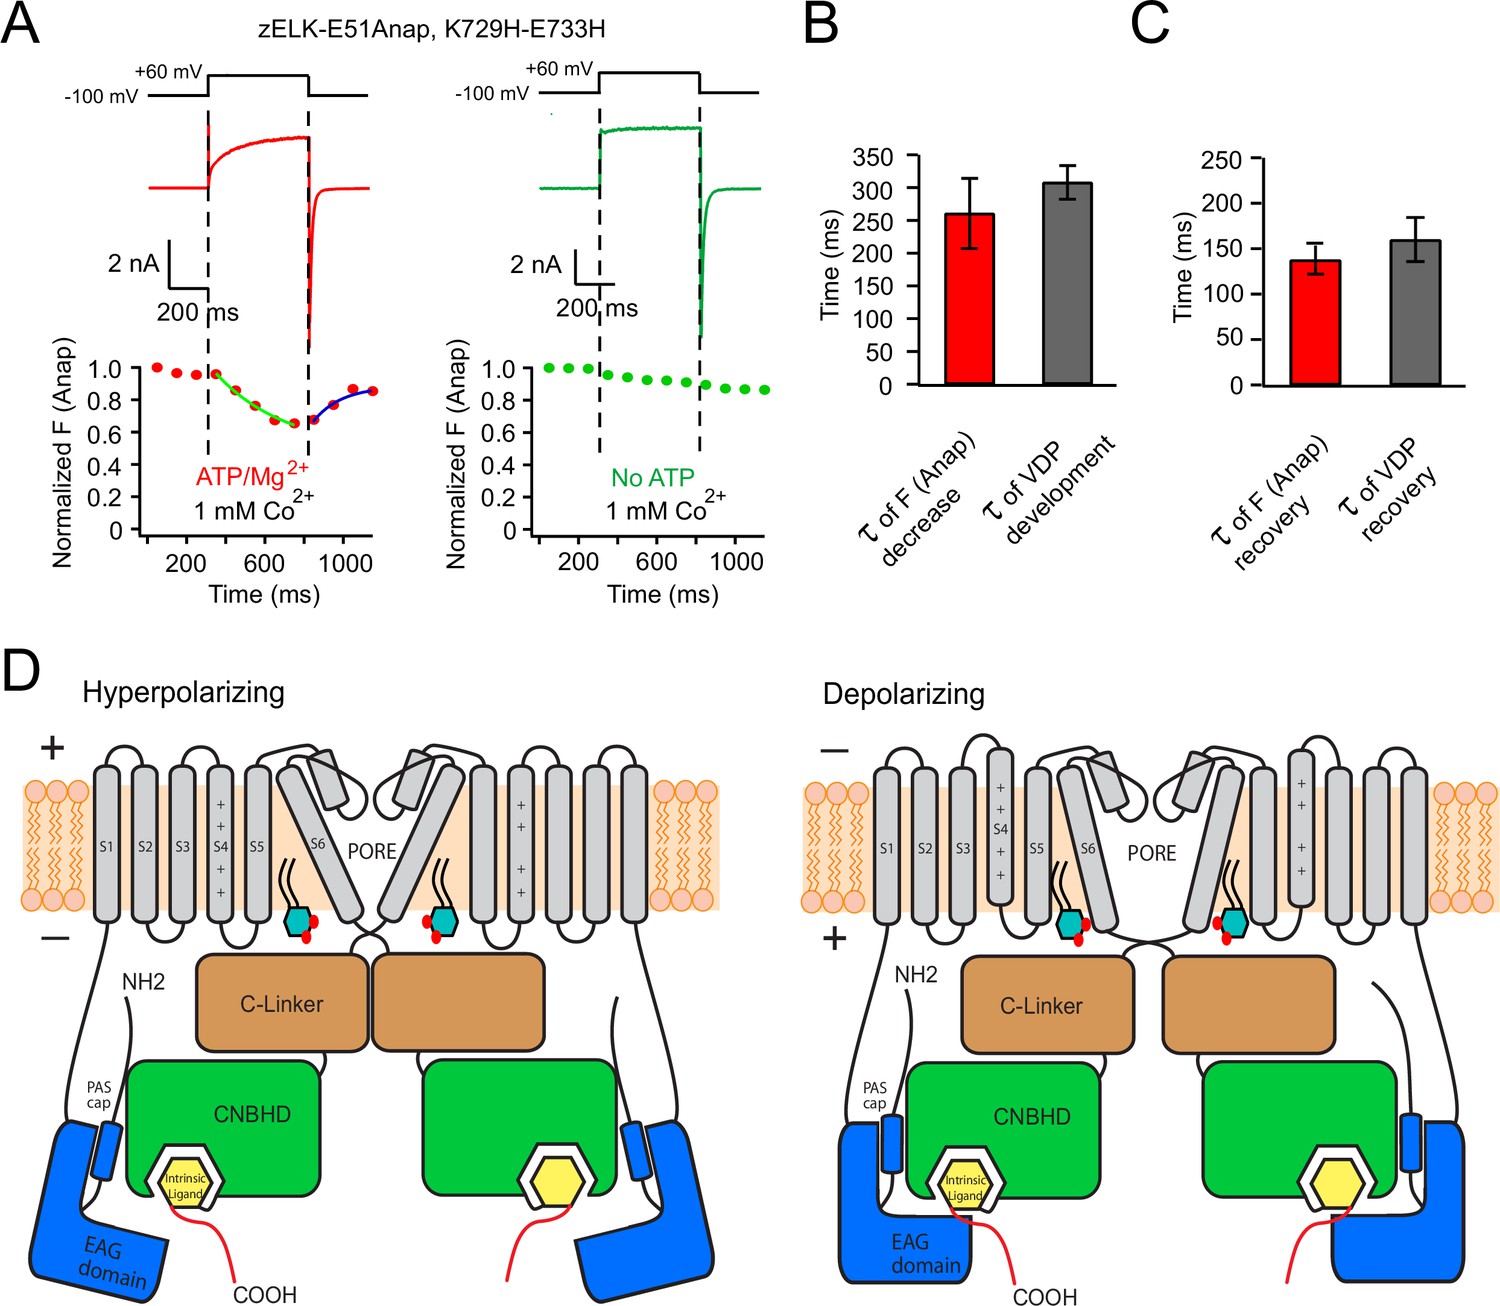
Voltage-dependent rearrangement of the eag domain-CNBHD interaction for zELK channels.
(A) Kinetic measurement of Anap fluorescence during a +60 mV depolarization pulse with simultaneous current recordings, in the presence or absence of ATP/Mg2+. (B) and (C) Comparison of the kinetics of the development (B) and the recovery (C) of tmFRET and VDP (n = 4–6). (D) Cartoon illustrating that the VDP of zELK channels involves a rearrangement of the direct interaction between the eag domain and CNBHD. The intersubunit interaction of the eag domain and CNBHD of diagonal subunits is illustrated at hyperpolarizing and depolarizing voltages showing a rearrangement of this interaction accompanies the VDP. Other changes such as pore opening and movement of the S4 are also important for channel activation. The yellow box indicates the intrinsic ligand. PI(4,5)P2 in the inner leaflet of the plasma membrane is shown to highlight its potential role in regulating VDP.
Figure 6—figure supplement 1
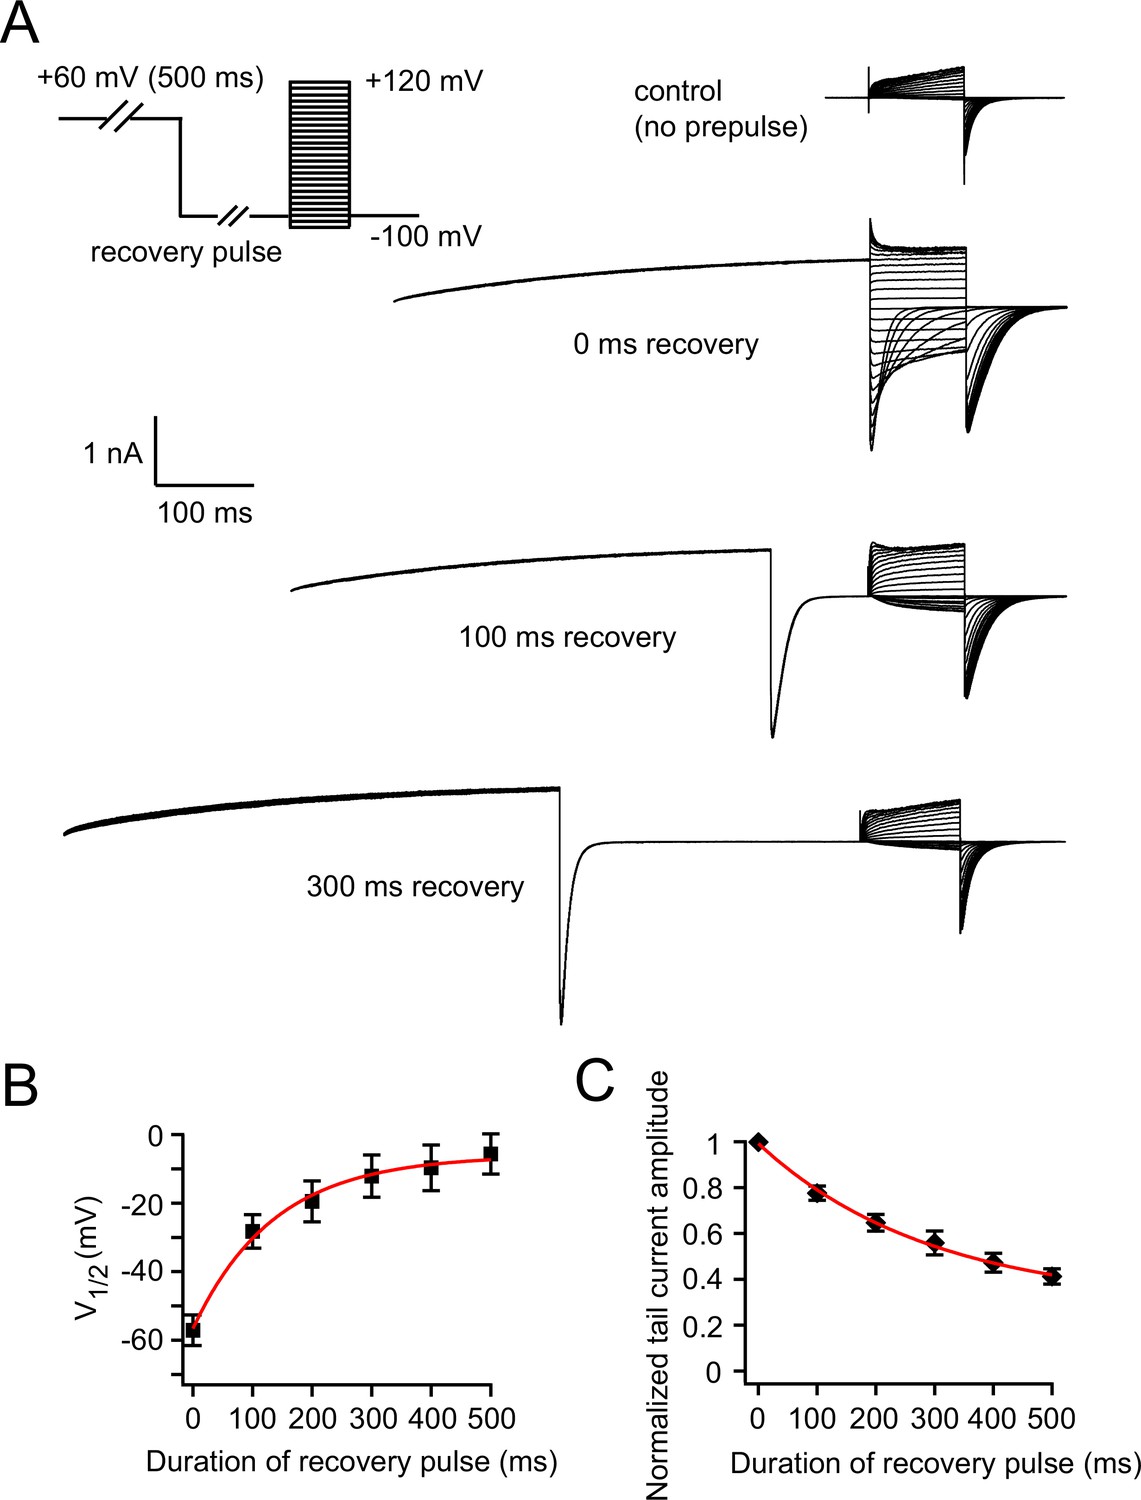
Measuring the recovery of VDP.
(A) Recovery of VDP measured by a voltage protocol with hyperpolarizing recovery pulses of various durations. Representative control current traces without the +60 mV prepulse are shown, and representative current traces with +60 mV prepulse and subsequent 0, 100 and 300 ms recovery pulses are shown. (B) Relationship between the duration of the recovery pulse and V1/2 of zELK channel activation after a +60 mV prepulse (n = 6). Theτ of the exponential fit in red is 136 ms. (C) Relationship between the duration of the recovery pulse and the peak tail-current amplitudes of zELK channels after a +60 mV prepulse (n = 6). Theτ of the exponential fit in red is 293 ms.
Download links
A two-part list of links to download the article, or parts of the article, in various formats.
Downloads (link to download the article as PDF)
Open citations (links to open the citations from this article in various online reference manager services)
Cite this article (links to download the citations from this article in formats compatible with various reference manager tools)
Molecular mechanism of voltage-dependent potentiation of KCNH potassium channels
eLife 6:e26355.
https://doi.org/10.7554/eLife.26355


