The Sec14-like phosphatidylinositol transfer proteins Sec14l3/SEC14L2 act as GTPase proteins to mediate Wnt/Ca2+ signaling
- Tsinghua University, China
Figures
Figure 1 with 3 supplements
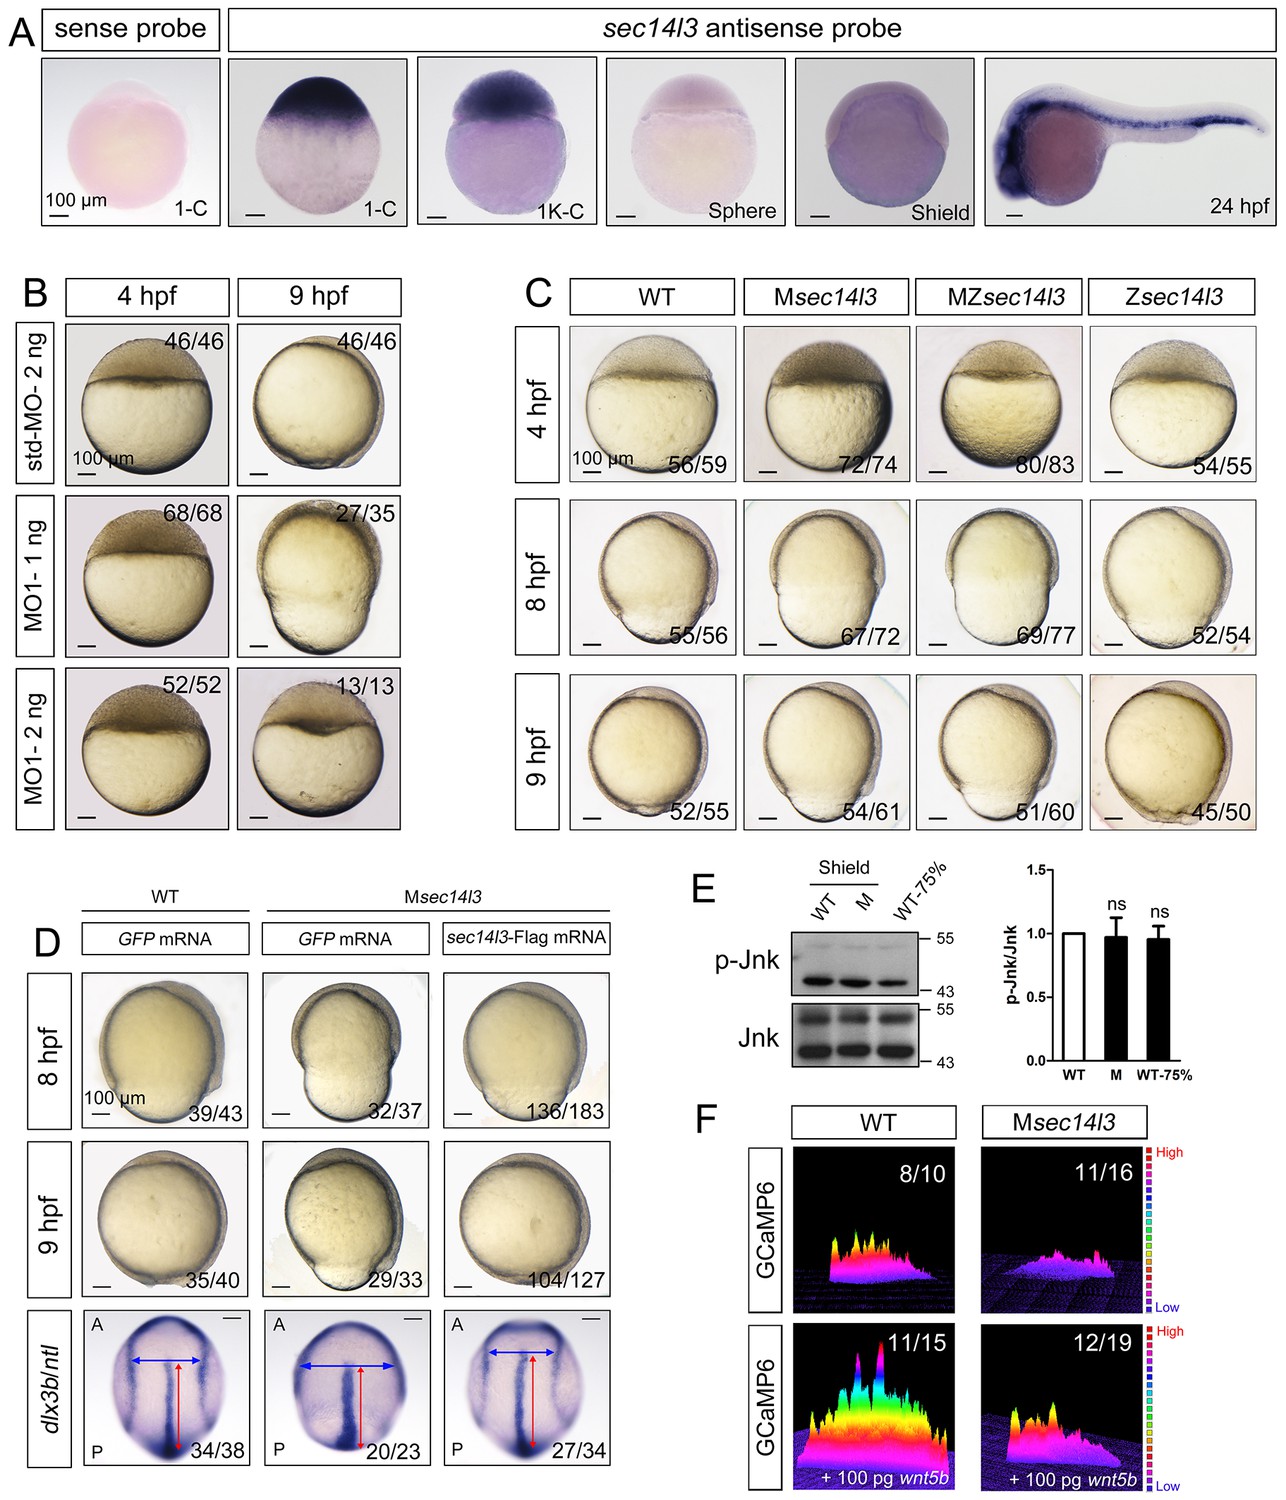
Sec14l3 depletion impairs CE movements and Wnt/Ca2+ signaling in zebrafish.
(A) Spatiotemporal expression pattern of sec14l3. Embryos were laterally viewed with animal pole to the top or with anterior to the left. Scale bars, 100 μm. (B) Morphological defects in sec14l3 morphants during gastrulation. Scale bars, 100 μm. (C) Morphological defects in Msec14l3, MZsec14l3 and Zsec14l3 mutants. Scale bars, 100 μm. (D) sec14l3 mRNA rescue assay. 150 pg sec14l3 mRNA was injected into Msec14l3 mutants for rescue, and then the morphology and dlx3b/ntl marker gene expression were examined. First two panels: lateral views; last panel: dorsal views. Blue and red two-way arrows indicate the width of neural plate and the length of notochord respectively. Scale bars, 100 μm. (E) Phosphorylation level of Jnk in Msec14l3 mutant embryos. p-Jnk (Thr183/Tyr185) and total Jnk were examined at the shield (Morphology comparable) and 75% epiboly stage (Time point comparable) by western blot. Quantification of relative protein levels is shown on the right, represented by mean ± SEM in three separate experiments (see also Figure 1—source data 1, ns, non-significant). (F) Differential induction of calcium transient activity in zebrafish embryos. Representative calcium release profiles of embryos at the sphere stage in wild-type and Msec14l3 mutant background with or without wnt5b mRNA overexpression. The color bar represents the number of transients: red represents high numbers, blue represents lower numbers, and the peaks represent more active regions. In all panels, the ratio in the right corner indicated the number of embryos with altered phenotypes/the total number of observed embryos.
-
Figure 1—source data 1
Numerical data for Figure 1E, Figure 1—figure supplement 1D and Figure 1—figure supplement 2B.
- https://doi.org/10.7554/eLife.26362.003
Figure 1—figure supplement 1
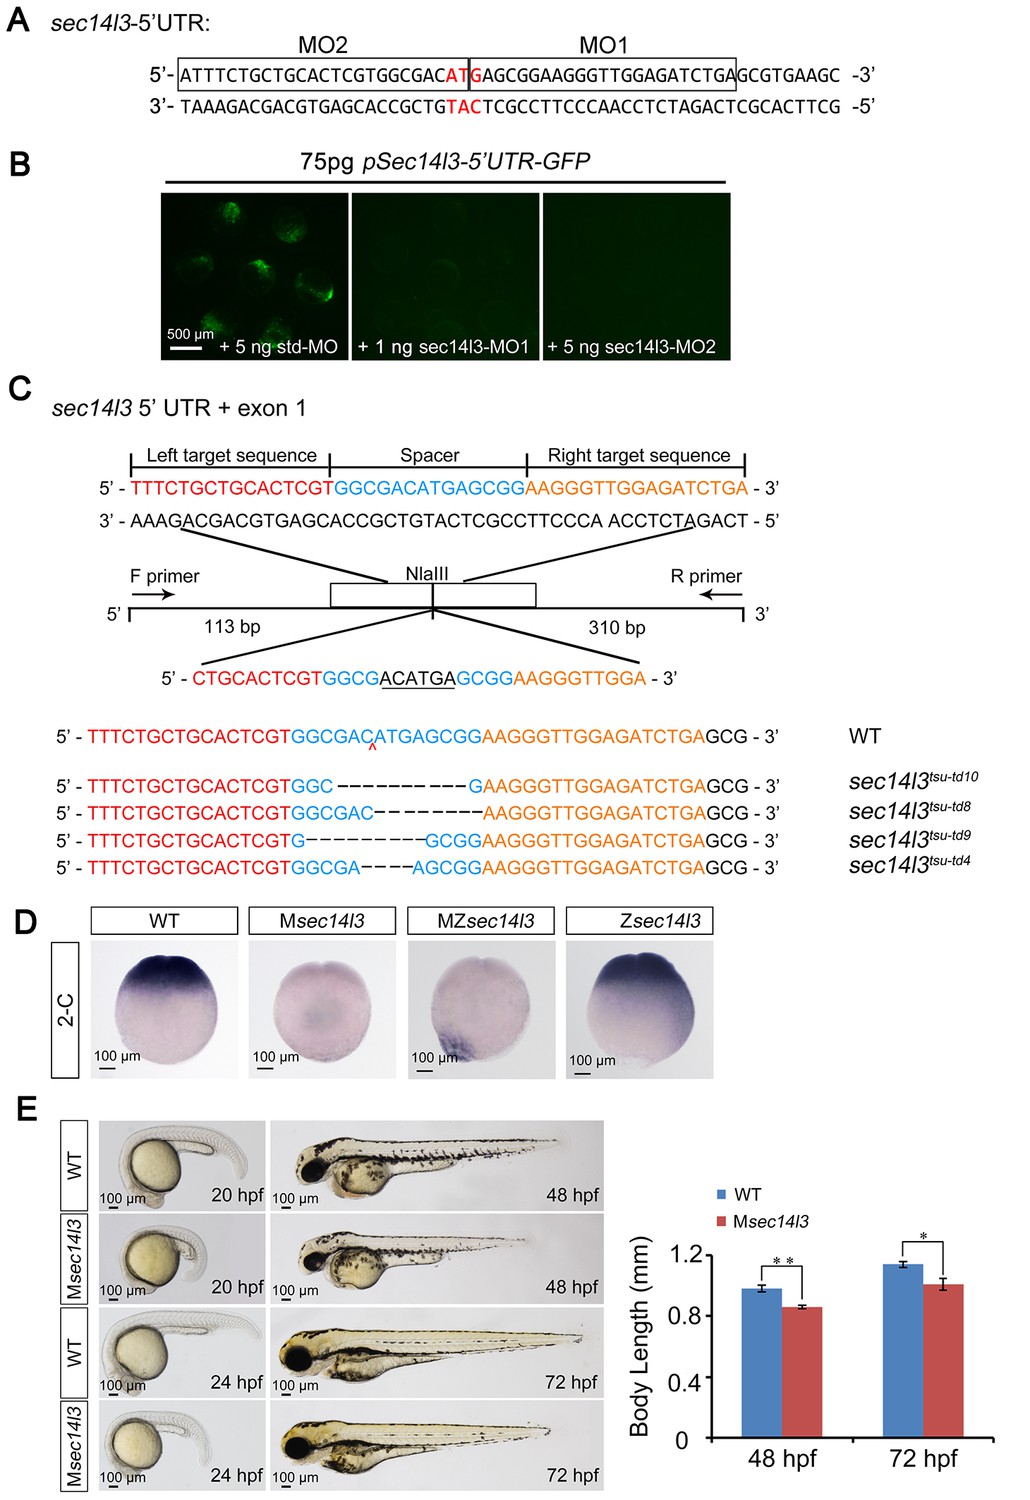
Effectiveness of sec14l3 MOs and generation of sec14l3 mutants.
(A) Target sites of sec14l3 MOs. 5’ UTR of sec14l3 is shown and the target sites of MOs are outlined with start codon indicated in red.(B) Effectiveness of the sec14l3 MOs. Embryos were injected with 75 pg pSec14l3-5’UTR-GFP reporter plasmid DNA in combination with indicated MOs and fluorescence was checked at late gastrulation stages. Scale bars, 500 μm.(C) Generation of sec14l3 mutants with TALENs. Four different lines were identified and their genotypes are labeled at the right. The ‘N’ in tdN indicates the total number of edited nucleotides. (D) sec14l3 transcript expression in Msec14l3, Zsec14l3 and MZsec14l3 mutant embryos at 2 cell stage. Embryos are shown at lateral views. Scale bars, 100 μm. (E) Morphology of Msec14l3 embryos at 20 hpf, 24 hpf, 48 hpf and 72 hpf. The embryonic body lengths at indicated stages were measured and the statistical analysis is shown at the right. Data are presented as mean ± SEM. n = 10 embryos (see also Figure 1—source data 1, **p<0.01; *p<0.05). Scale bars, 100 μm.
Figure 1—figure supplement 2
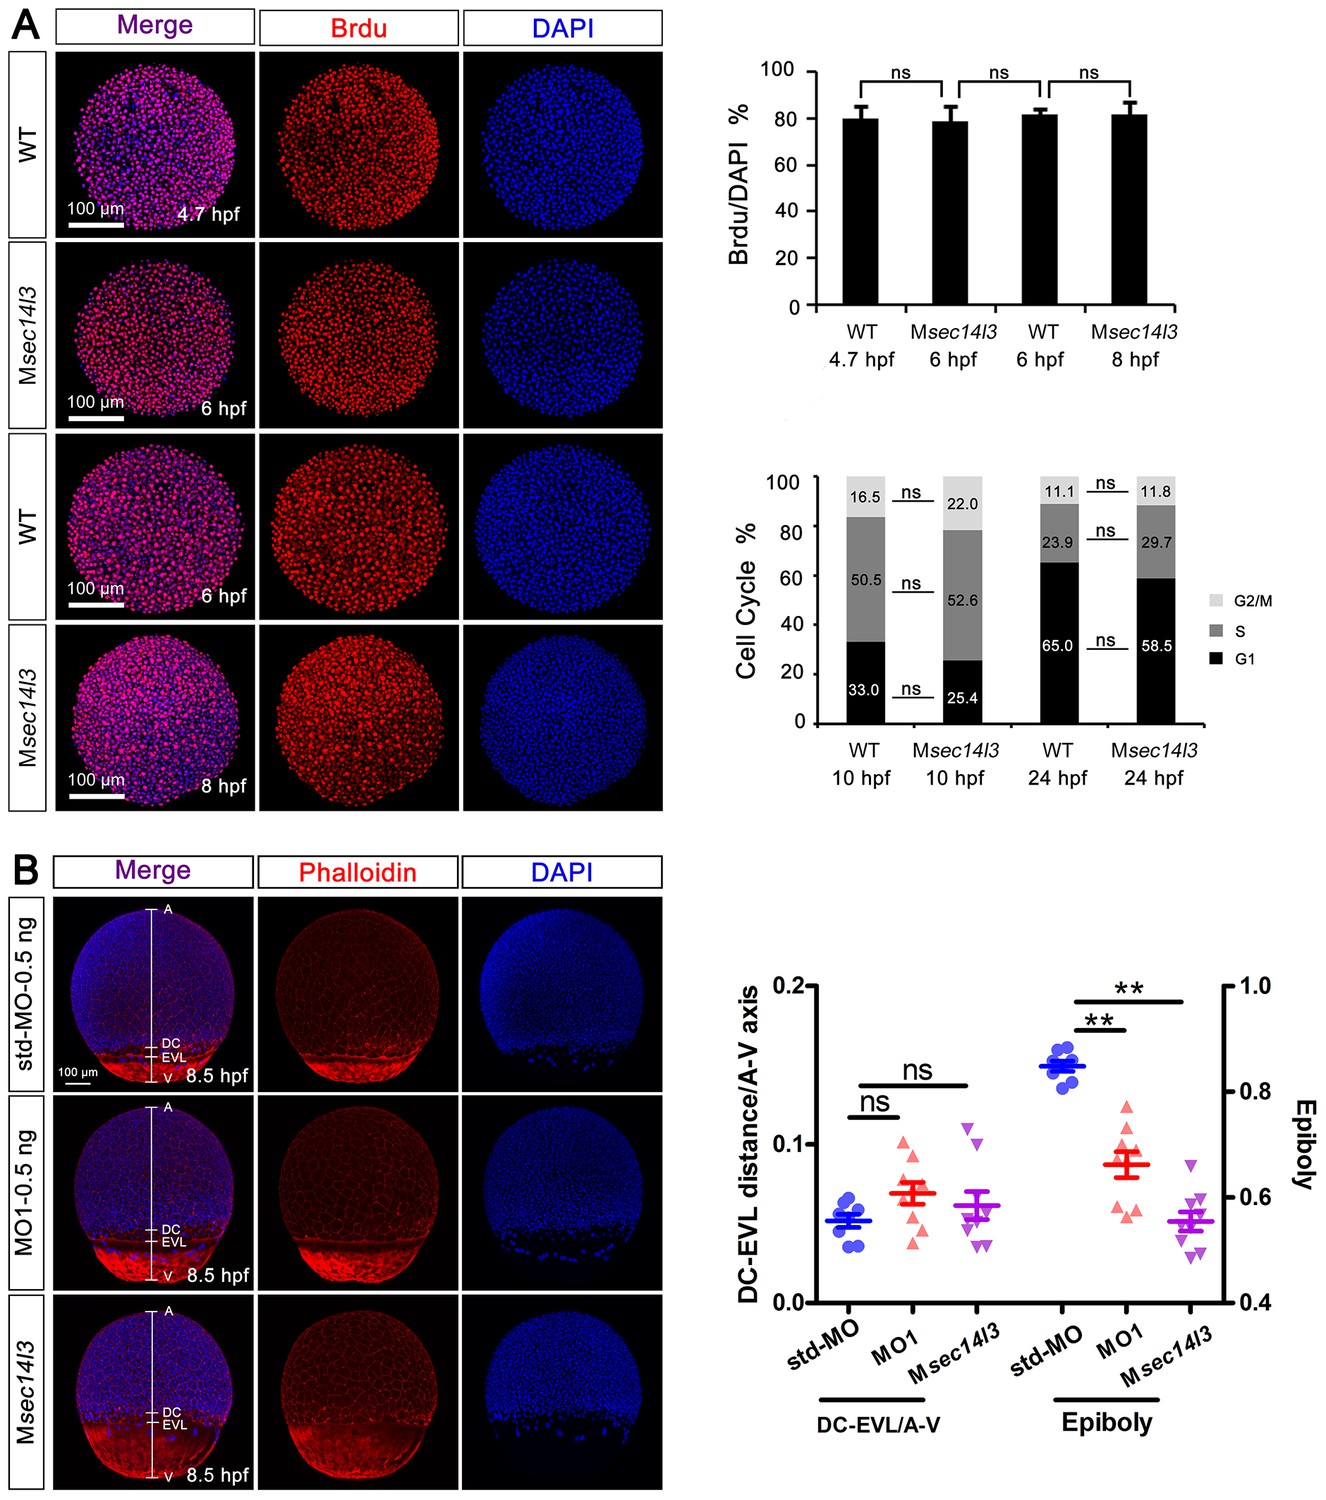
Sec14l3 depletion has no effect on cell proliferation or cell cycle progression, as well as cell adhesion between envelop layer (EVL) and deep cells (DC).
(A) Cell proliferation analysis based on Brdu incorporation and cell cycle progression analyzed by flow cytometry were performed. The ratios of Brdu/DAPI indicating percentages of proliferating cells are shown at the right top; Right bottom panel shows the result of cell cycle analysis, and the percentages of individual phases are labeled. Light grey indicates G2/M phase, grey indicates S phase and black indicates G1 phase. No evident difference is observed between control and mutant embryos. Data are presented as mean ± SEM. Significance was analyzed using Student’s t-test (ns, non-significant). scale bars, 100 μm. (B) Distance measurement between envelop layer (EVL) and deep cells (DC) based on phalloidin (red) and DAPI (blue) staining, see also in Figure 1—source data 1. The left panel shows immunostaining results in sec14l3 morphants and Msec14l3 mutants at 8.5 hpf. Embryos were laterally viewed with animal pole (A) to the top, vegetal pole (V) to the bottom and the marginal borders of DC and EVL are marked. Statistical results of 10 embryos from each group are shown at the right panel. Ratios of DC-EVL distance to A-V axis and epiboly are calculated.
Figure 1—figure supplement 3
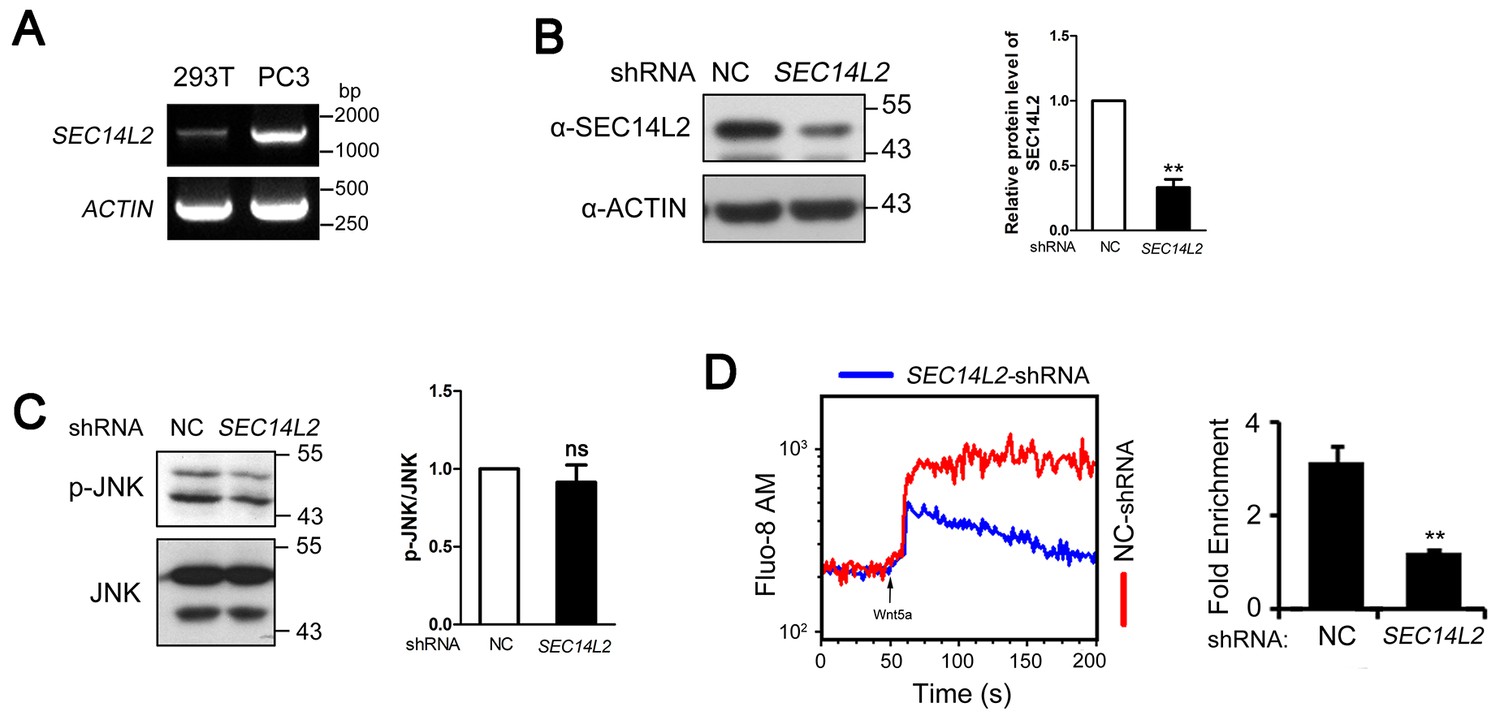
SEC14L2 depletion inhibits Wnt/Ca2+ transduction in PC3 cells.
(A) RT-PCR of SEC14L2 in HEK293T and PC3 cells. (B) SEC14L2 shRNA effectiveness test in PC3 cells. Quantification of SEC14L2 protein levels based on three independent experiments is shown on the right, represented by mean ± SEM (**p<0.01). (C) Phosphorylation level of JNK in control-shRNA and SEC14L2-shRNA stably transfected PC3 cells. Quantification data from three independent experiments are shown as mean ± SEM on the right (ns, non-significant). (D) Flow cytometry analysis of Wnt5a-induced calcium signals in PC3 cells. The kinetic calcium influx was plotted over time. Red indicates the NC shRNA transfected group while blue indicates the SEC14L2 shRNA knockdown group. 400 ng/μl Wnt5a protein was used for stimulation. Data was quantified using multiple rectangular region analysis. Fold enrichment of calcium influx in NC shRNA or SEC14L2 shRNA transfected PC3 cells upon Wnt5a stimulation is shown on the right. Data are presented as mean ± SEM based on three independent experiments (**p<0.01).
Figure 2 with 2 supplements
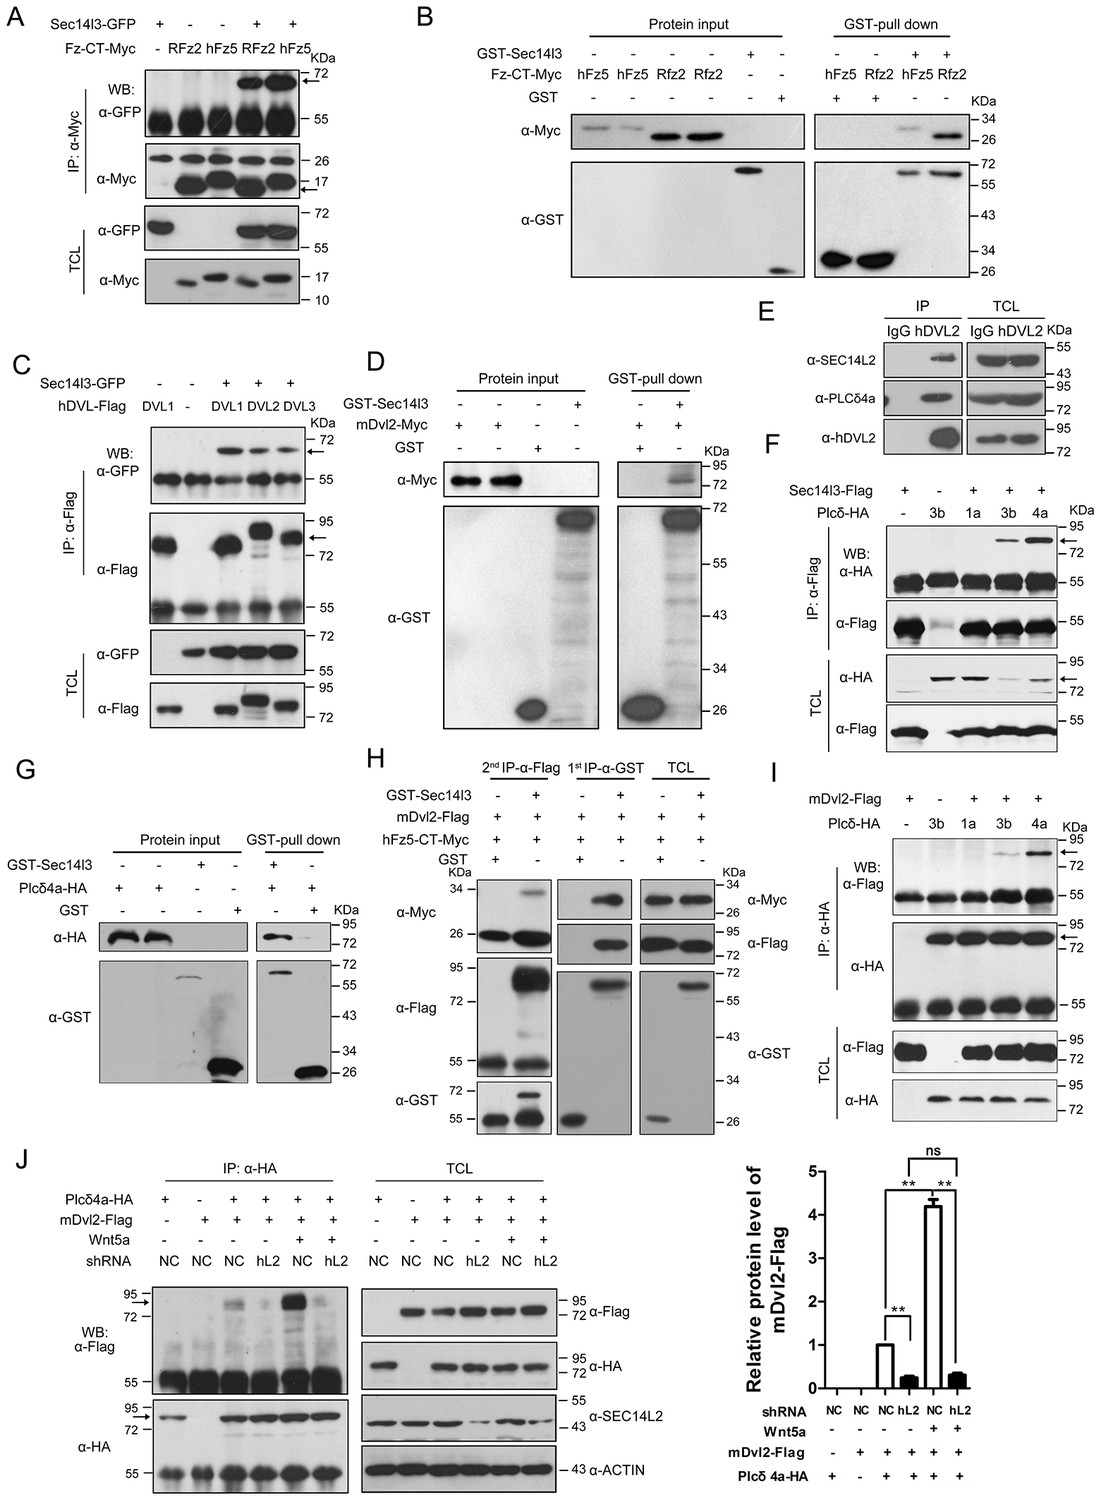
Sec14l3 orchestrates complex formation among Fz, Dvl and PLC.
(A) Sec14l3 interacts with hFz5-CT and Rfz2-CT in HEK293T cells. IP, immunoprecipitation; WB, western blot; TCL, total cell lysates. The target protein in the precipitate was indicated by an arrow (same for other figures below). (B) Direct binding of Sec14l3 to hFz5-CT/Rfz2-CT in vitro. GST-Sec14l3 and hFz5-CT/Rfz2-CT-Myc were expressed in E. coli and purified. (C) Sec14l3 was detected in the protein complexes immunoprecipitated with Flag-tagged human DVL1/2/3 from HEK293T cells. (D) Direct binding of Sec14l3 to mDvl2 in vitro. GST-Sec14l3 and mDvl2-Myc were expressed in E. coli and purified. (E) Endogenous SEC14L2 and PLCδ4a interacts with DVL2 in MCF7 cells respectively. (F) Sec14l3 interacts with Plcδ3b and Plcδ4a in HEK293T cells. (G) Direct binding of Sec14l3 to PLCδ4a in vitro. GST-Sec14l3 and PLCδ4a-HA were expressed in E. coli and purified. (H) hFz5-CT, mDvl2 and Sec14l3 form a ternary complex in vitro. hFz5-CT-Myc and GST-Sec14l3 proteins purified from E. coli were incubated with mDvl2-Flag transfected cell lysates. The protein complexes were sequentially pulled down using GST (1 st IP-α-GST) and Flag antibody (2nd IP-α-Flag). Finally the second round immunoprecipitated proteins were detected using the corresponding antibodies. (I) mDvl2 interacts with Plcδ3b and Plcδ4a in HEK293T cells. (J) The interaction between mDvl2 and Plcδ4a is restrained in the stable SEC14L2 knockdown PC3 cells with or without 400 ng/μl Wnt5a stimulation. Quantification of relative mDvl2 levels from three independent experiments is shown as mean ± SEM on the right (see also Figure 2—source data 1, **p<0.01; ns, non-significant).
-
Figure 2—source data 1
Numerical data for relative protein level of mDvl2-Flag in Figure 2I.
- https://doi.org/10.7554/eLife.26362.008
Figure 2—figure supplement 1
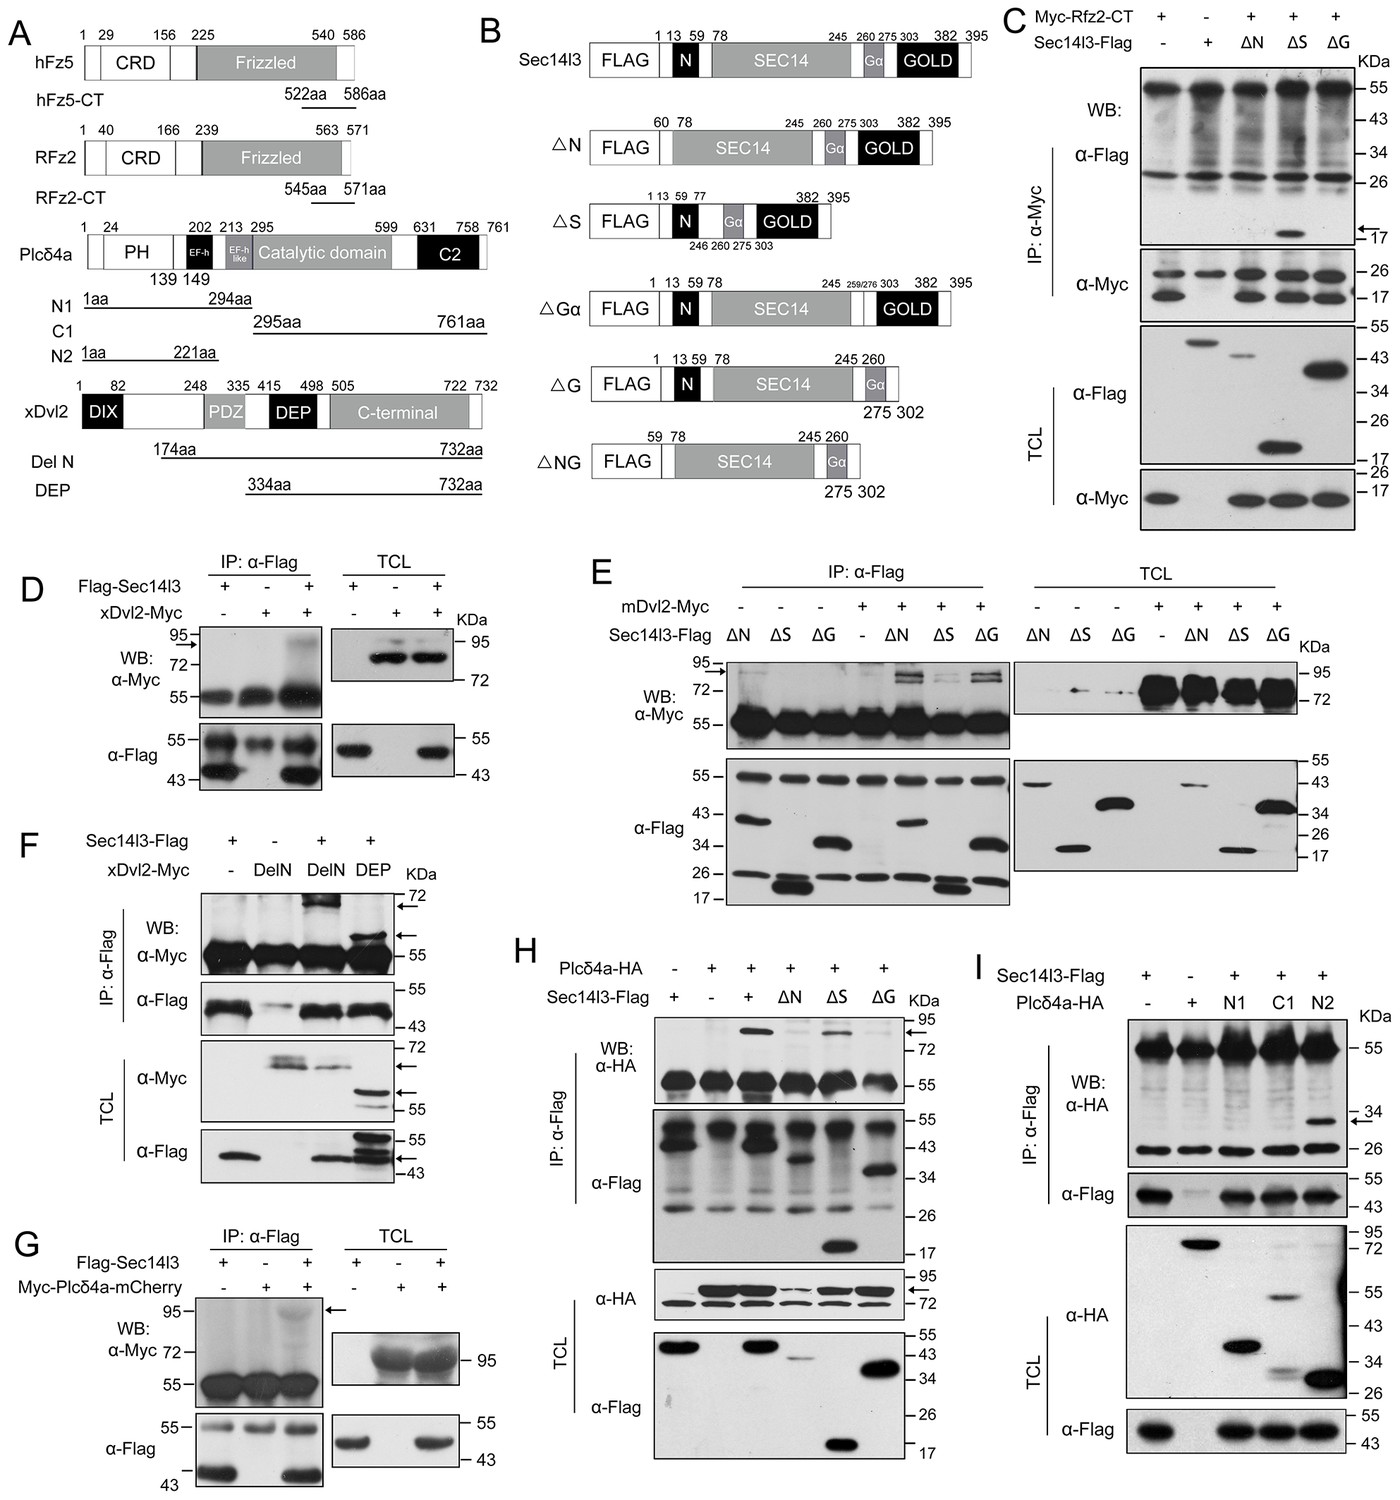
Sec14l3 utilizes distinct domains to interact with Dvl2 and Plcδ4a.
(A) Schematic diagrams of truncated forms of hFz5, RFz2, Plcδ4a and xDvl2. Numbers above the diagram indicate the corresponding amino acid positions. hFz5/RFz2 has N terminal CRD (Cysteine-rich Wnt-binding domain) and Frizzled domain (membrane spanning region of frizzled and smoothened factors). Plcδ4a is comprised of Pleckstrin homology (PH) domain, EF-hand (EF-h) domain, EF-hand (EF-h) like domain, Catalytic TIM barrel domain (incorporating regions of high sequence similarity X and Y) and C2 domain. xDvl2 (GeneID: 108703580) possesses DIX domain (named after Dishevelled and Axin), PDZ domain and DEP domain (named after Dishevelled, Egl-10 and Plekstrin). The truncated forms are indicated by respective amino acid positions. (B) Schematic diagrams of Sec14l3 full length form (FL) and truncated mutants. Numbers above the diagram indicate the corresponding amino acid positions. Sec14l3 includes N terminal CARL-TRIO domain (named after cellular retinaldehyde-binding protein (CRALBP) and TRIO guanine exchange factor), medial Sec14 domain (domain in homologues of a S. cerevisiae phosphatidylinositol transfer protein (Sec14p)) and C terminal GOLD domain (short for Golgi Dynamics domain). ΔN, N terminal CARL-TRIO domain deletion;ΔS, Sec14 domain deletion; ΔGα, Gα domain deletion; ΔG, GOLD domain deletion; ΔNG, N-terminal CARL-TRIO domain and C-terminal GOLD domain deletion. (C) Sec14l3 interacts with Rfz2-CT via its CARL-TRIO and GOLD domains. Domains of Sec14l3 required for interaction with Rfz2-CT in HEK293T cells were tested by co-immunoprecipitation using deletion constructs. TCL, total cell lysate; IP: Immuno-precipitation; WB: western blot. (D) Flag-Sec14l3 interacts with xDvl2-Myc in zebrafish embryos. Embryos were injected with a mixture of 300 pg Flag-Sec14l3 and 200 pg xDvl2-Myc mRNA at 1 cell stage and lysed at 75% epiboly stage for Co-IP assays. (E) Sec14l3 interacts with mDvl2 via its Sec14 domain. (F) xDvl2 interacts with Sec14l3 via its C-terminal region. (G) Flag-Sec14l3 interacts with Myc-Plcδ4a-mCherry in zebrafish embryos. A mixture of 300 pg Flag-Sec14l3 and 200 pg Myc-Plcδ4a-mCherry mRNA was injected into embryos for Co-IP assays. (H) The Sec14l3 CARL-TRIO and GOLD domains interact with Plcδ4a. (I) The Plcδ4a interacts with Sec14l3 via its N-terminal domain.
Figure 2—figure supplement 2
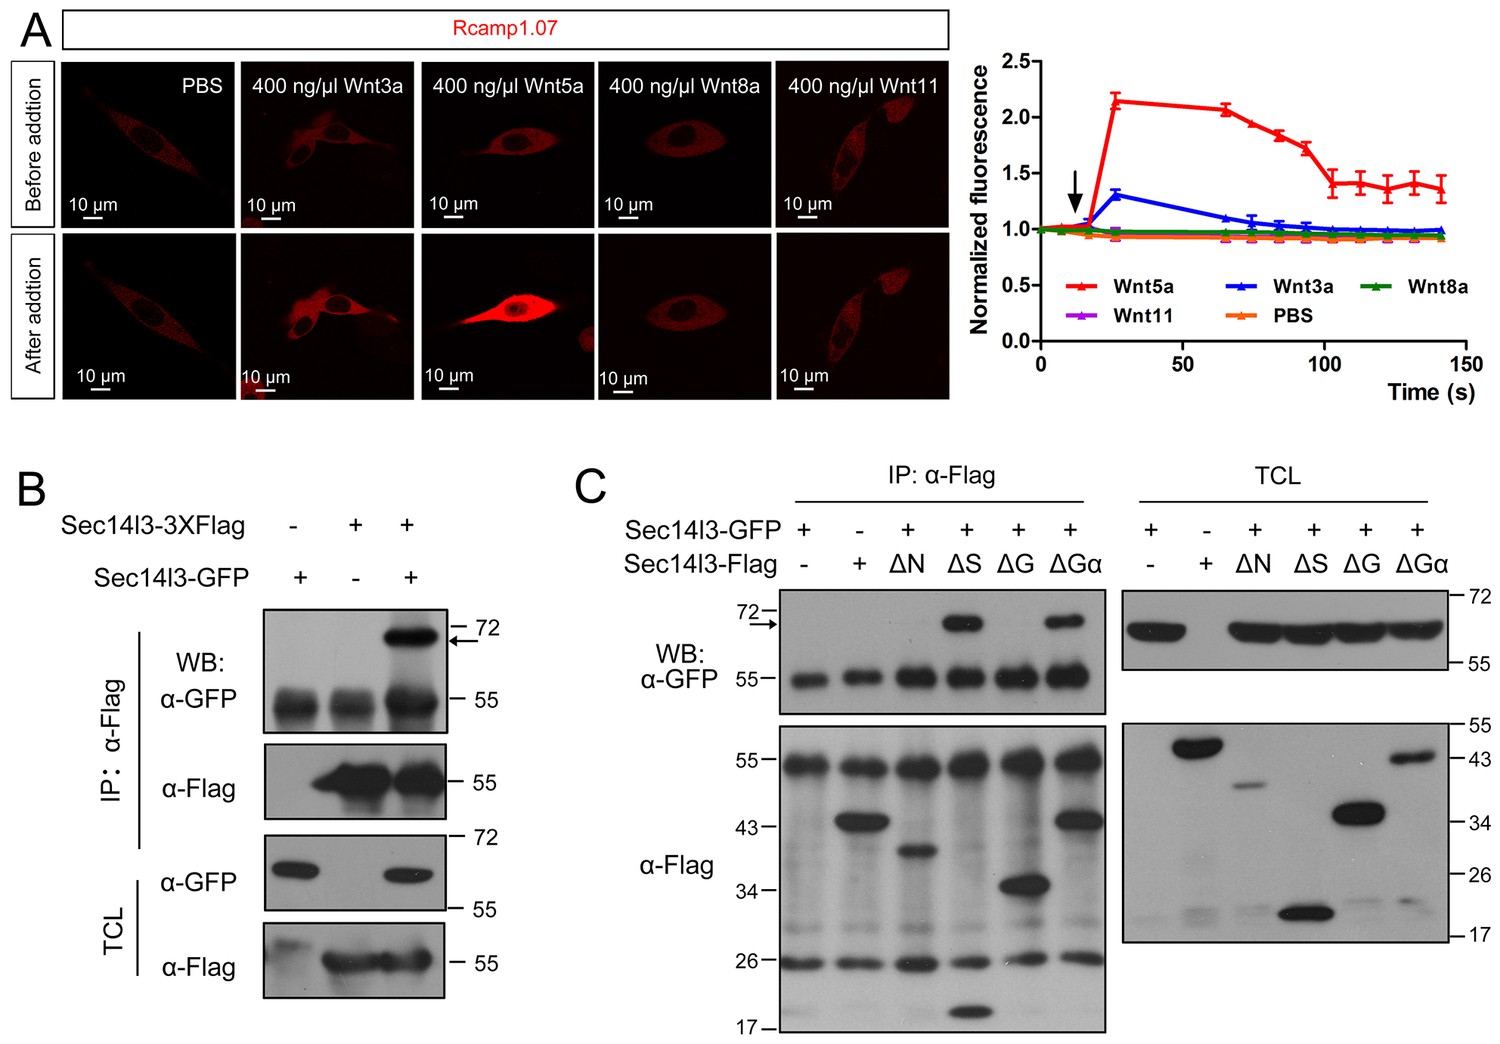
Sec14l3 can self-assemble into oligomers.
(A) Living imaging of calcium release upon Wnt stimulation in PC3 cells. PC3 cells were transfected with calcium indicator plasmid Rcamp1.07 and then starved for 400 ng/μl Wnt3a, Wnt5a, Wnt8a and Wnt11 stimulation individually. PBS serves as negative control. The arrow indicates the time point when Wnt is added. Scale bar, 10 μm. (B) Sec14l3 can be assembled into an oligomer in HEK293T cells. (C) Sec14l3 oligomer formation is mediated by its CARL-TRIO and GOLD domains.
Figure 3 with 2 supplements
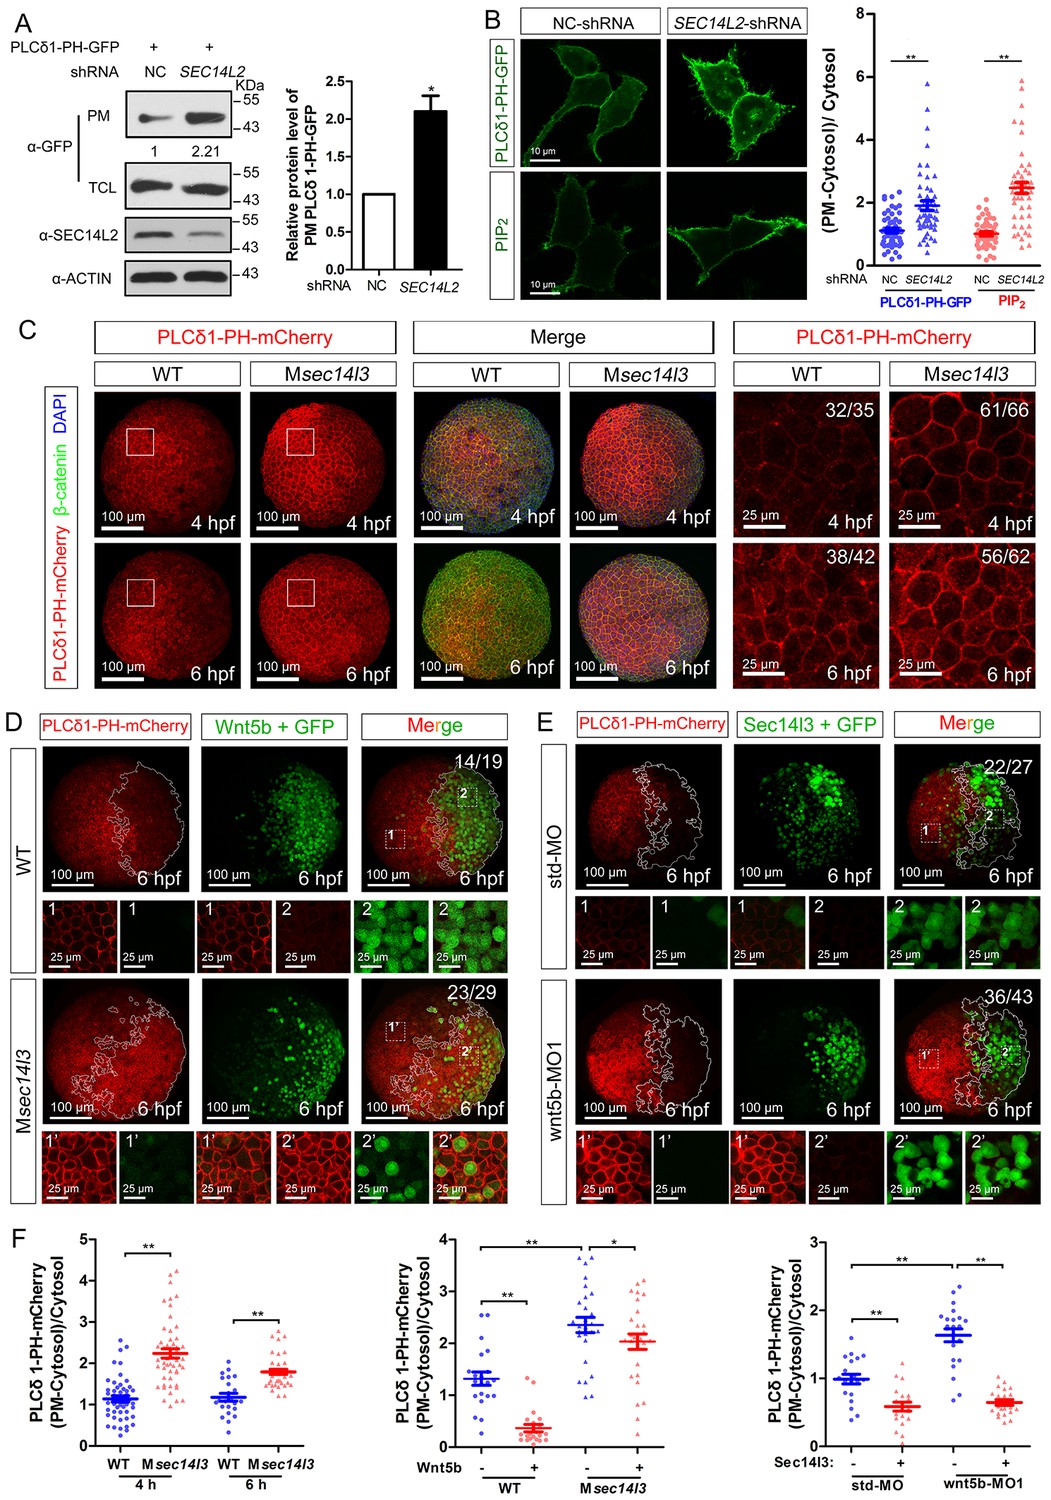
Sec14l3 facilitates PLC-catalyzed PIP2 hydrolysis induced by Wnt5b.
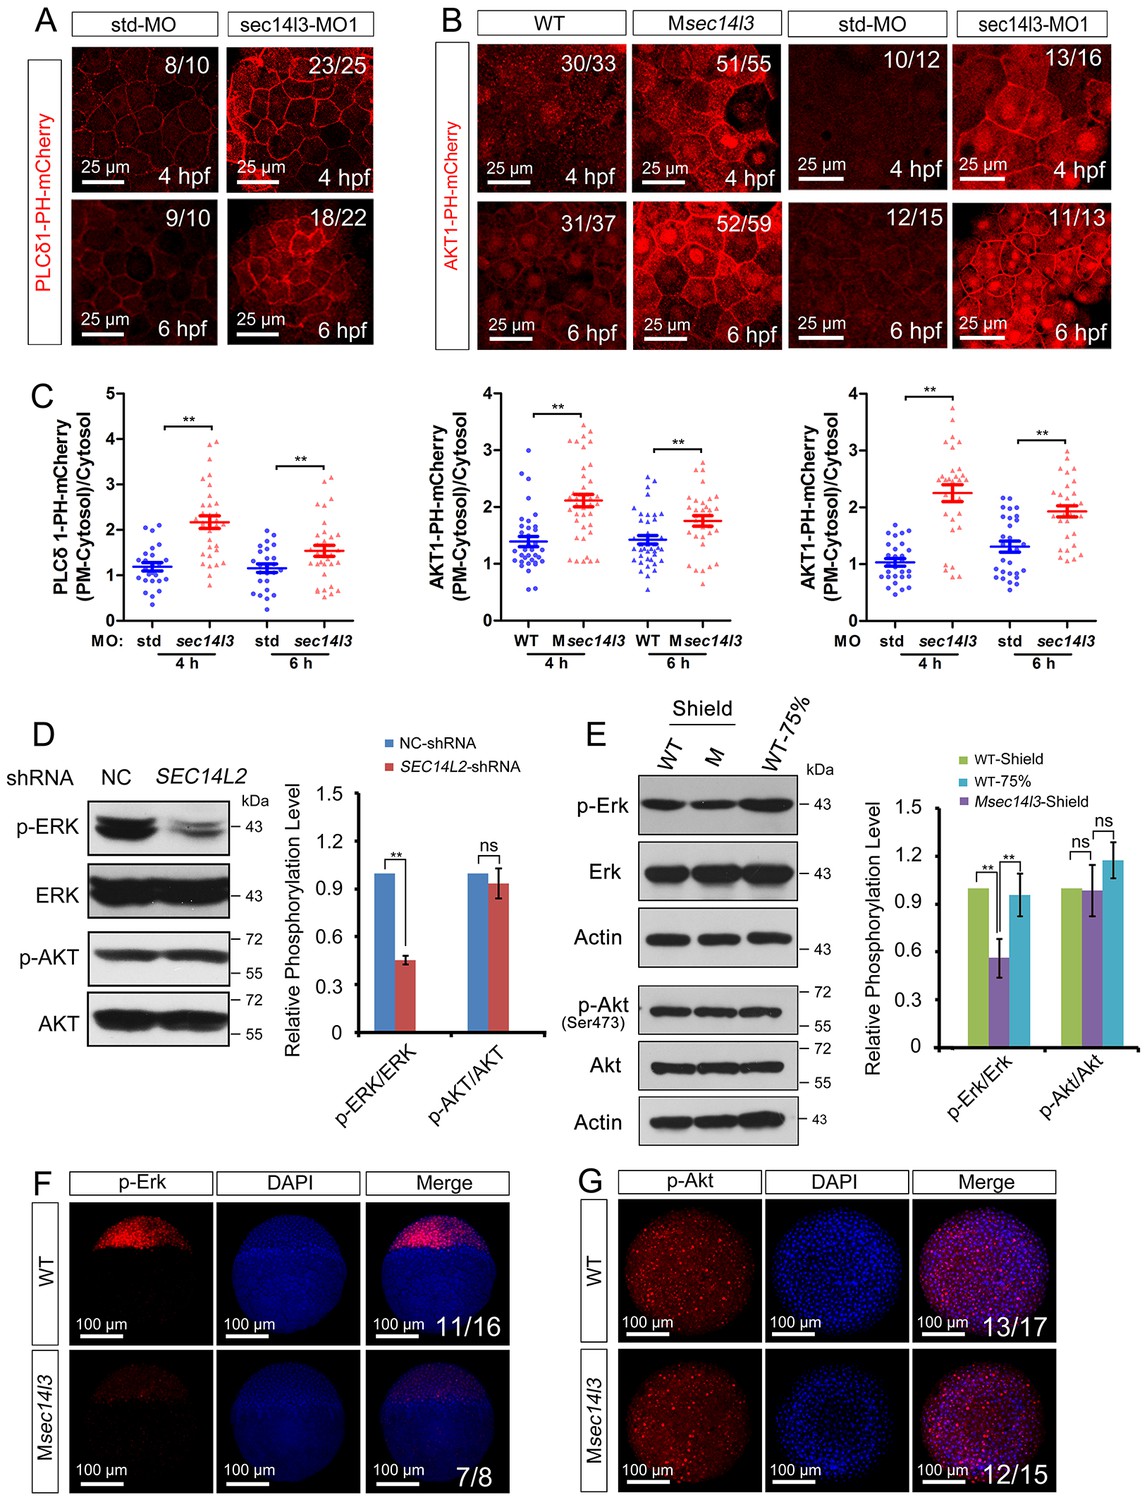
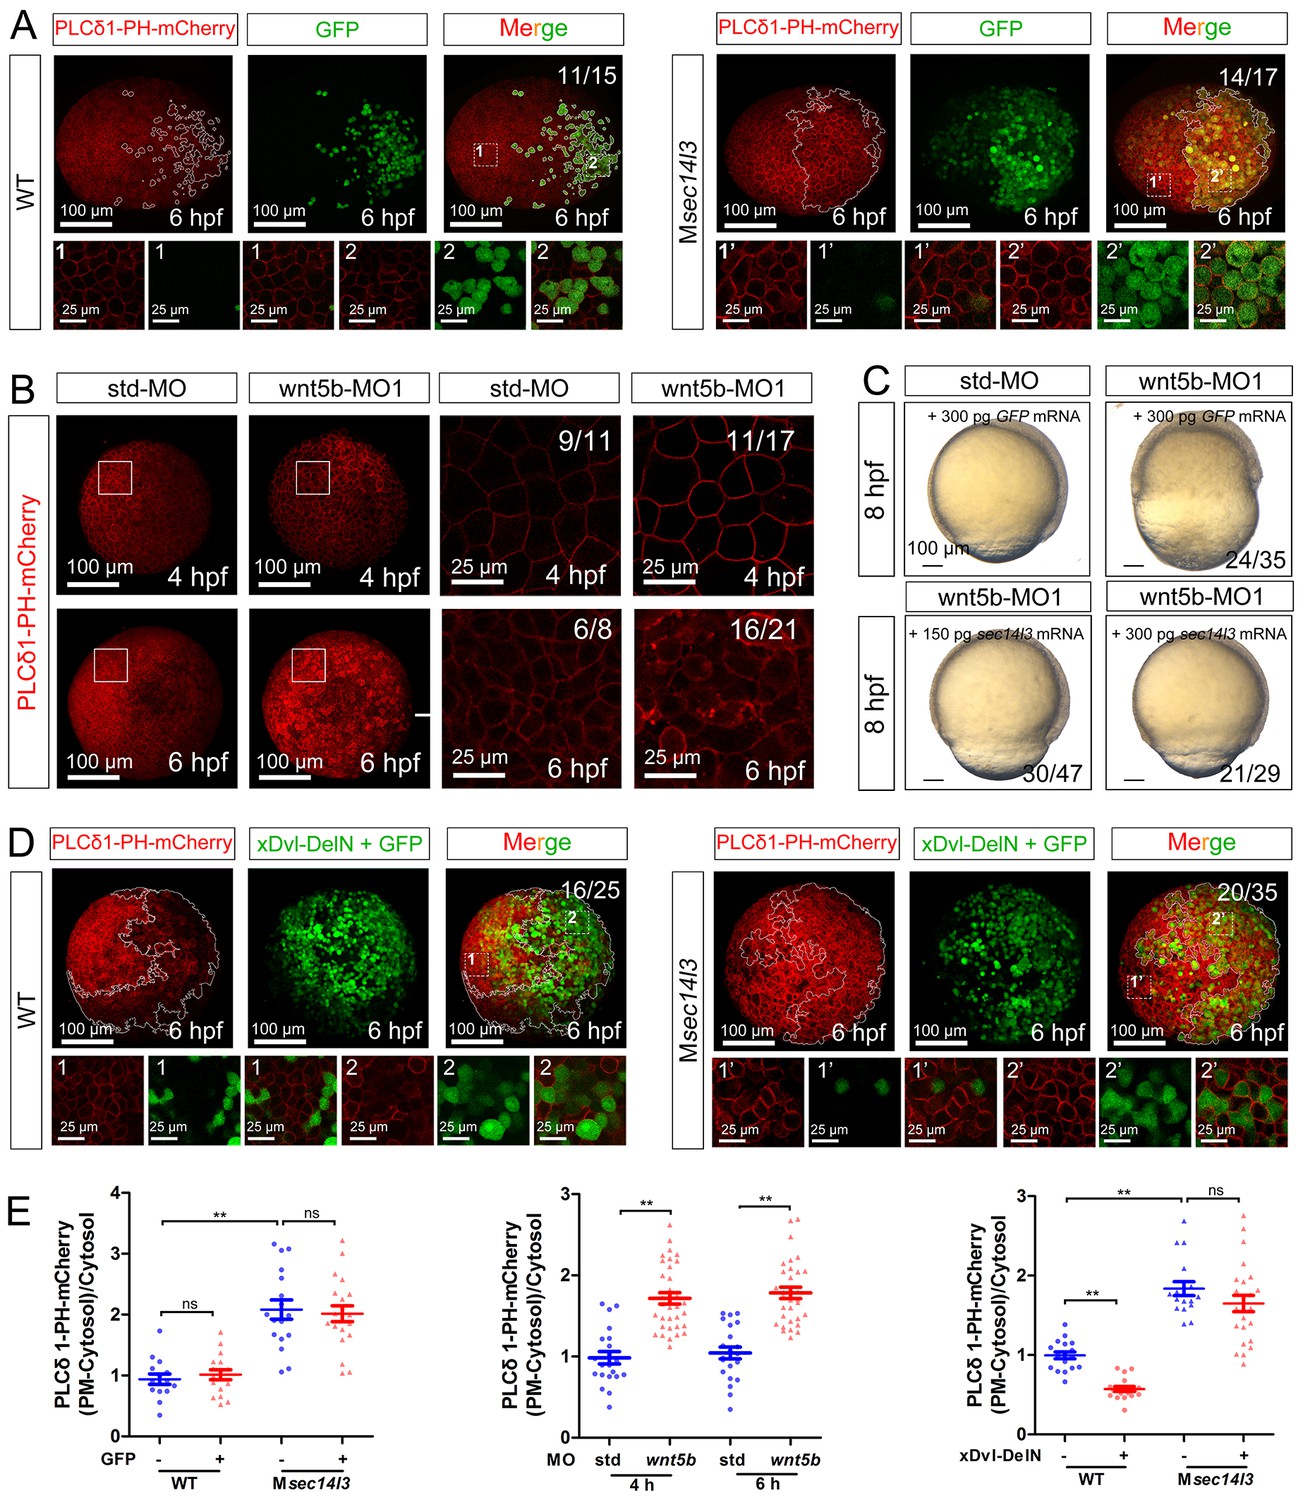
(A) PM isolation analysis of PM PIP2 levels using PLCδ1-PH-GFP as probe in HEK293T cells. Quantification data from three independent experiments are shown as mean ± SEM (see also Figure 3—source data 1, *p<0.05). (B) Immunofluorescence of PLCδ1-PH-GFP in first panel (transfected with PLCδ1-PH-GFP) and endogenous PIP2 in second panel shows PIP2 accumulation in the PM of stable SEC14L2-knockdown HEK293T cells. Data are presented as mean ± SEM (see also Figure 3—source data 1, **p<0.01; n ≥ 50 cells from three separate experiments). Scale bar, 10 μm. (C) Immunofluorescence of PLCδ1-PH-mCherry (red, PIP2 probe), β-catenin (green, PM marker) and DAPI (blue, nucleus marker) shows PIP2 accumulation in the PM of Msec14l3 mutant cells. The first two whole embryo panels are 3D views of z-stacks (n = 30 for 4 hpf, n = 34 for 6 hpf), while the last panel is enlarged views of single z-stack pictures (z = 8 for 4 hpf, z = 7 for 6 hpf) from regions encompassed by white boxes. Scale bars, 100 μm for whole embryos; 25 μm for the enlarged columns. (D) Sec14l3 depletion compromises Wnt5b-induced degradation of PM PIP2. Immunofluorescence of PLCδ1-PH-mCherry (red) and GFP (green, indicating Wnt5b-expressed cells) is shown. Mosaic expression of 100 pg wnt5b mRNA was created in embryos with even distribution of PLCδ1-PH-mCherry mRNA. White polygons outline GFP expressed cells and single z-stack pictures (z = 10) from numbered regions in the whole embryo panels (3D view of z-stacks) are enlarged. Scale bars, 100 μm for whole embryos; 25 μm for the enlarged panels. (E) sec14l3 overexpression inhibits accumulation of PIP2 in wnt5b morphant embryos. Mosaic expression of sec14l3 by injecting 150 pg mRNA was created in embryos with even distribution of PLCδ1-PH-mCherry mRNA in std-MO or wnt5b-MO injected embryos. Single z-stack pictures (z = 11) from numbered regions in the whole embryo panels (3D view of z-stacks) are enlarged. (F) PM PIP2 quantification of (C–E) by calculating intensity of (PM-Cytosol)/Cytosol PLCδ1-PH-mCherry. Data are shown as mean ± SEM. (see also Figure 3—source data 1, **p<0.01; *p<0.05; ns, non-significant; n ≥ 50 cells from 10 embryos in three independent experiments).
-
Figure 3—source data 1
Numerical data for Figure 3A,B,F and Figure 3—figure supplements 1C–E and 2E.
- https://doi.org/10.7554/eLife.26362.012
Figure 3—figure supplement 1
sec14l3 depletion results in PIP2 and PIP3 accumulation in the PM.
(A) Accumulation of PIP2 bound by PLCδ1-PH-mCherry in the PM of sec14l3 morphants at 4 and 6 hpf. The shown pictures are immunofluorescent images of embryos viewed from the animal-pole. Scale bars, 25 μm. (B) Accumulation of PIP3 bound by AKT1-PH-mCherry in the PM of Msec14l3 mutants (the left two columns) and sec14l3 morphants (the right two columns) at 4 and 6 hpf. Scale bars, 25 μm. (C) Quantification of PM PIP2/PIP3 accumulation in embryonic cells of (A–B). The PM PIP2/PIP3 accumulation was respectively reflected by the PLCδ1/AKT1-PH-mCherry intensity ratio of (PM-Cytosol)/Cytosol. Embryos from three independent experiments were calculated (see also Figure 3—source data 1, **p<0.01). (D) Western blot analysis of phosphorylated ERK and AKT in SEC14L2 knockdown stable HEK293T cells. A notable reduction of p-ERK(Thr202/Tyr204) occurred, but no change of p-AKT(Ser473) was observed in SEC14L2 depleted cells. Statistical analysis is shown on the right. Data are presented as mean ± SEM based on three independent experiments (see also Figure 3—source data 1, **p<0.01; ns, non-significant, p>0.05). (E) Phosphorylation levels of the Erk and Akt in Msec14l3 mutant embryos. p-Erk, total Erk, p-Akt, total Akt and Actin were examined at the shield stage by western blot using corresponding antibodies. Statistical analysis is shown on the right. Data are presented as mean ± SEM based on three independent experiments (see also Figure 3—source data 1, **p<0.01; ns, non-significant, p>0.05). (F–G) Immunostaining images of p-Erk (C) and p-Akt (D) in Msec14l3 mutant embryos at the sphere stage. Nuclei were stained with DAPI. Lateral views (C) and animal-pole views (D) are shown respectively. Scale bars, 100 μm.
Figure 3—figure supplement 2
wnt 5b-MO induced phenotypes can be restored by sec14l3 mRNA.
(A) GFP mRNA injection has no effect on the PM located PIP2 bound by PLCδ1-PH-mCherry in wild-type or Msec14l3 mutant embryos. White polygons outline GFP expressed cells at 6 hpf and single z-stack pictures (z = 6) from numbered regions in the animal pole view whole embryo panels (3D view of z-stacks) are enlarged. Scale bars, 100 μm for the whole embryos and 25 μm for the enlarged panels. (B) Accumulation of PIP2 bound by PLCδ1-PH-mCherry in the PM of wnt5b morphants at 4 and 6 hpf. The shown pictures are immunofluorescent images of embryos viewed from animal pole. Single z-stack pictures (z = 6 for 4 hpf, z = 8 for 6 hpf) from the boxed areas in the left columns (3D view of z-stacks) are enlarged in the right columns. Scale bars, 100 μm for the whole embryos; 25 μm for the enlarged panels. (C) Sec14l3 overcomes the CE defects of wnt5b morphants. 150 pg and 300 pg sec14l3 mRNA were used for rescue assays. Embryos injected with 300 pg GFP mRNA were used as negative controls. Embryos are lateral views. Scale bars, 100 μm. (D) Sec14l3 depletion compromises xDsh-DelN-induced degradation of PIP2 in the PM. Mosaic expression of 100 pg xDsh-DelN mRNA were created in embryos with even distribution of PLCδ1-PH-mCherry mRNA to probe PIP2 change. Single z-stack pictures (z = 8) from numbered regions in the animal pole view whole embryo panels (3D view of z-stacks) are enlarged. Scale bars, 100 μm for the whole embryos; 25 μm for the enlarged panels. (E) Quantification of PM PIP2 accumulation in embryonic cells of (A, B and D). The PM PIP2 accumulation was respectively reflected by the PLCδ1-PH-mCherry intensity ratio of (PM-Cytosol)/Cytosol. Embryos from three independent experiments were calculated (see also Figure 3—source data 1, **p<0.01).
Figure 4 with 1 supplement

Sec14l3 activates PLC dependent on its GOLD and Gα domains.
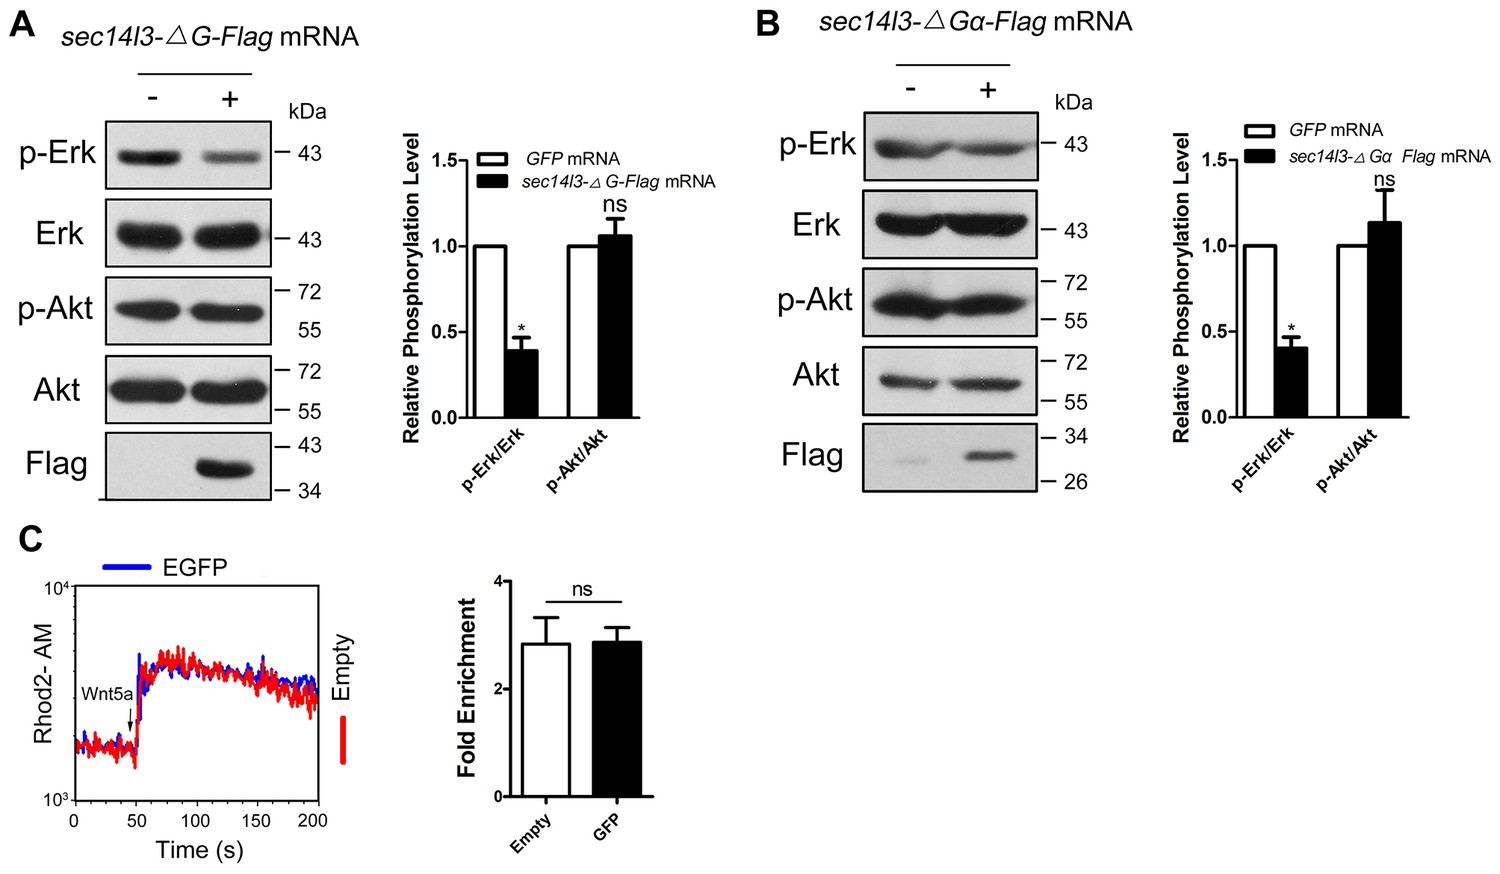
(A) Analysis of PIP2 levels in the membrane. Different forms of Sec14l3 (right corner) were co-transfected with PLCδ1-PH-GFP into HEK293T cells, and PIP2-bound PLCδ1-PH-GFP in the PM was detected by Western blot. The relative levels of PLCδ1-PH-GFP in the PM were quantified and presented as mean ± SEM from three independent experiments on the right (*p<0.05). (B) Immunofluorescence of PLCδ1-PH-GFP (green, PIP2 probe) in HEK293T transfected with Sec14l3-ΔG, Sec14l3-ΔGα or Sec14l3-ΔS (red) respectively. Regions in white box are enlarged. Scale bar, 10 μm for the first panel and 5 μm for the enlarged panels. (C) PIP2 accumulation in stable SEC14L2-knockdown cells was not abolished by overexpression of Sec14l3-ΔG or Sec14l3-ΔGα. Statistical data from three independent experiments are presented as mean ± SEM on the right (*p<0.05). (D) CE defects in embryos with ΔG and ΔGα Sec14l3 overexpression. dlx3b/ntl marker gene expression were examined at 10 hpf after sec14l3-ΔG and sec14l3-ΔGα mRNA injection respectively. Scale bar, 100 μm. (E–F) Flow cytometry of Wnt5a-induced calcium signals in PC3 cells transfected with Sec14l3-ΔGα or Sec14l3-ΔG (blue curves). Left panel shows the kinetic calcium influx over a time course. Right panel shows fold enrichment of calcium influx after Wnt5a stimulation. Data from three independent experiments are presented as mean ± SEM (*p<0.05, **p<0.01). Blue and red curves indicate the transfected and control group respectively. All numerical data represented as a graph in the figure are shown in Figure 4—source data 1.
-
Figure 4—source data 1
Numerical data for relative protein level of PLCδ1-PH-GFP or phosphorylation level ratio in Figure 4 and Figure 4—figure supplement 1.
- https://doi.org/10.7554/eLife.26362.016
Figure 4—figure supplement 1
ΔG or ΔGα form overexpression caused a significant reduction of p-Erk in zebrafish embryos.
(A–B) Phosphorylation levels of Erk and Akt are detected in zebrafish embryos after injecting ΔG (a) or ΔGα (b) sec14l3 mRNA. p-Erk, total Erk, p-Akt, total Akt and Flag-tagged Sec14l3 truncated proteins were examined by western blot at the shield stage using corresponding antibodies. Statistical data are shown as mean ± SEM based on three independent experiments (*p<0.05; ns, non-significant, p>0.05). (C) GFP transfection has no effect on Wnt5a motivated calcium influx. Left panel shows the kinetic calcium influx over a time course. Right panel shows statistical data from three independent experiments (ns, non-significant, p>0.05). Blue and red curves indicate the transfected and control group respectively. All numerical data represented as a graph in the figure are shown in Figure 4—source data 1.
Figure 5 with 1 supplement

PM zone enriched-Sec14l3 recruits PLC for activation upon Wnt5/Fz stimulation.
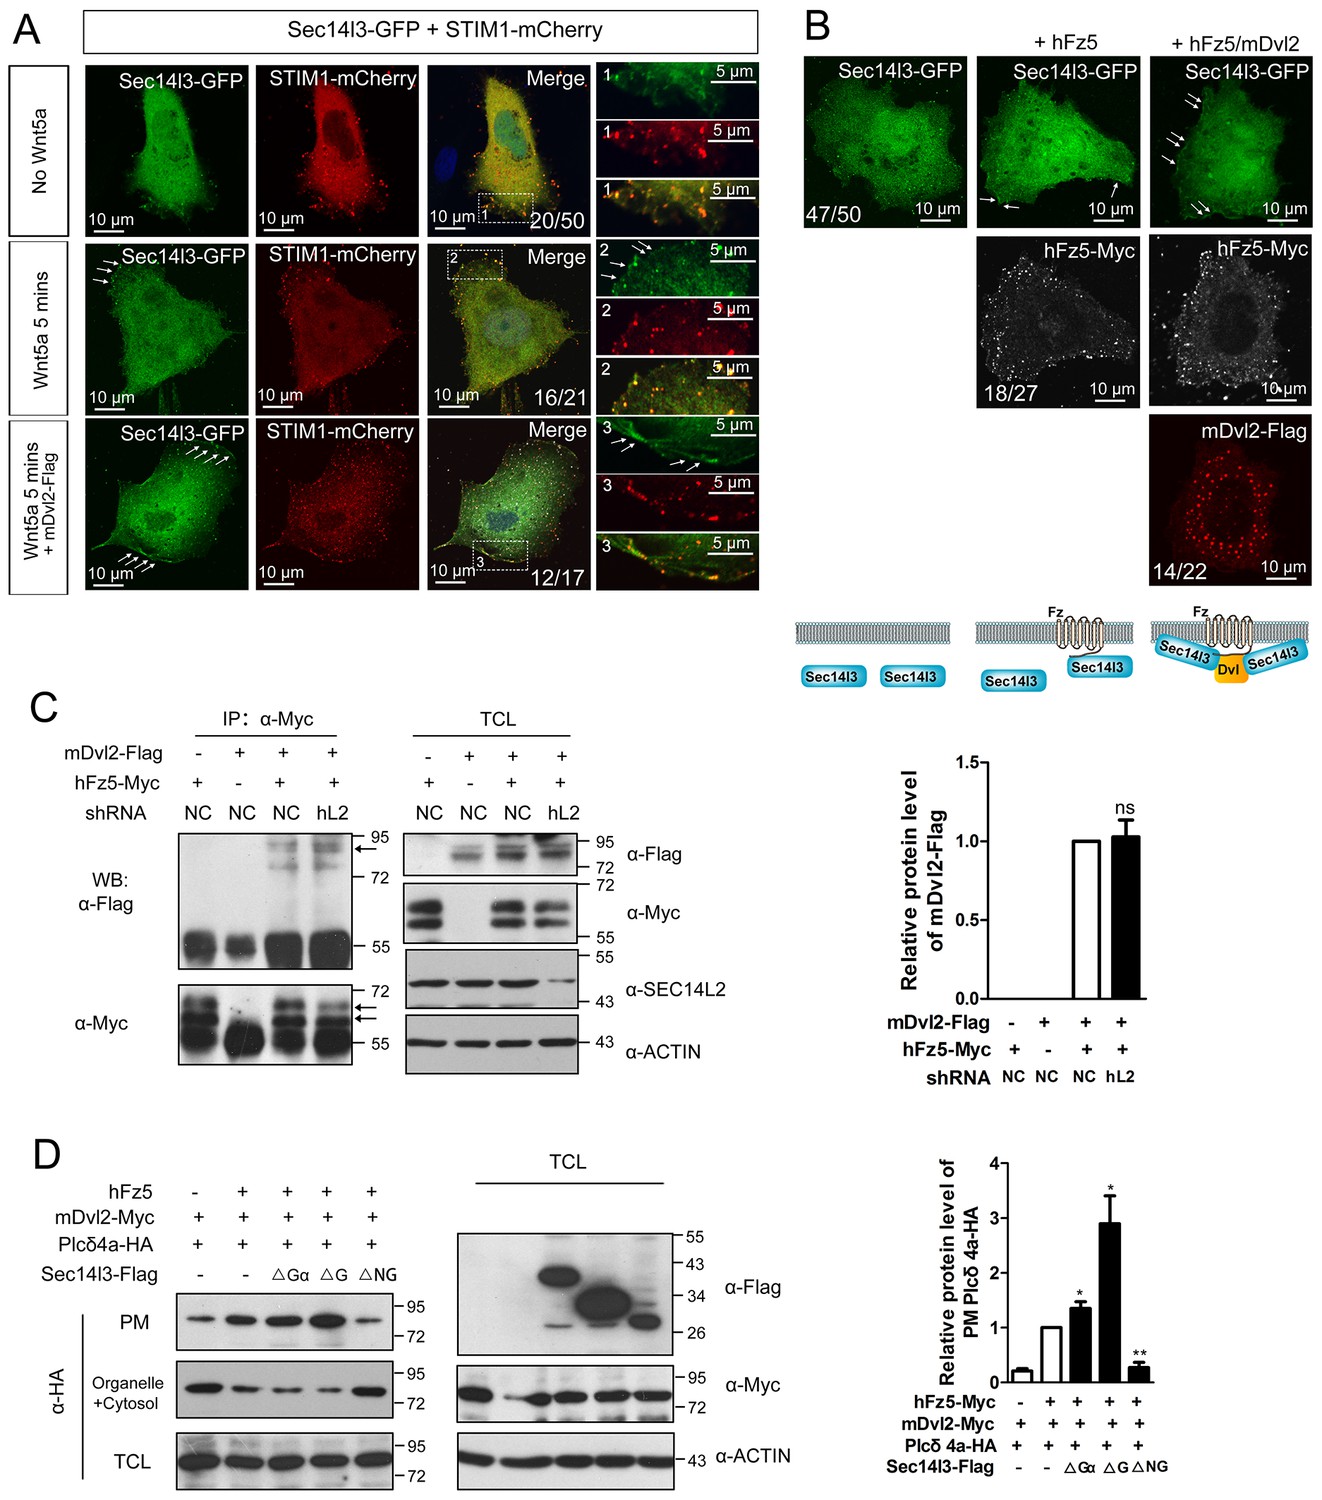
(A) Co-localization of Sec14l3 (green) with STIM1 proteins (red) in PC3 cells with or without Wnt5a stimulation. Arrows indicates PM-localized protein after Wnt5a stimulation. Scale bar, 10 μm. (B) Immunofluorescence of endogenous SEC14L2 in HEK293T cells with or without hFz5/mDvl2 transfection. Arrows indicates PM-localized SEC14L2 (green). Scale bar, 10 μm. (C) Immunofluorescence of Plcδ4a-mCherry (red), mDvl2-Flag (gray) and Sec14l3-GFP (green) in MCF7 cells. PM-localized Plcδ4a (red) are indicated by arrows. The bottom panel show the schematic representation of transfected constructs in corresponding rows and an interpretation of the results. Scale bar, 10 μm. (D) The Sec14l3 CARL-TRIO and GOLD domains are important for Rfz2 mediated Plcδ4a recruitment to the PM in the HEK293T cells. Statistical data from three independent experiments are presented as mean ± SEM on the right (*p<0.05; ns, non-significant; same for other statistical data below). (E) Rfz2-mediated Plcδ4a PM recruitment is abolished in stable SEC14L2-knockdown HEK293T cells and failed to be restored by Sec14l3-ΔNG overexpression. Statistical data are presented. (F) The Sec14l3 GOLD domain is important for Wnt5a mediated Plcδ4a recruitment to the PM in PC3 cells. Statistical data are presented. (G) SEC14L2 depletion perturbs Plcδ4a access to PIP2. Equal amounts of purified Plcδ4a protein and liposomes with or without PIP2 were incubated with control or SEC14L2 depleted cell lysates. Statistical data are presented. All numerical data represented as a graph in the figure are shown in Figure 5—source data 1.
-
Figure 5—source data 1
Numerical data for graphs in Figure 5 and Figure 5—figure supplement 1.
- https://doi.org/10.7554/eLife.26362.019
Figure 5—figure supplement 1
The subcellular localization of Sec14l3 and its function in the Plcδ4a PM recruitment.
(A) Co-localization of highly expressed Sec14l3 with STIM1 proteins in PC3 cells with or without Wnt5a stimulation. The three panels show the localization of Sec14l3 and STIM1 without Wnt5a stimulation, with 400 ng/μl Wnt5a stimulation for 5mins, and Wnt5a stimulation with mDvl2 co-transfection respectively. Arrowheads indicate PM-localized Sec14l3-GFP and STIM1-mCherry. Scale bars, 10 μm. (B) Sec14l3 was recruited to the PM in the presence of hFz5 and mDvl2. Arrowheads indicate PM-localized Sec14l3-GFP. Scale bars, 10 μm. (C) The interaction between hFz5 and mDvl2 is not affected after SEC14L2 knockdown in HEK293T cells. Quantification of mDvl2 protein levels is shown on the right (see also Figure 5—source data 1, ns, non-significant, p>0.05). (D) Plcδ4a recruitment to the PM induced by hFz5 overexpression is inhibited byΔNG form of Sec14l3 in the PC3 cells. Quantification of PM Plcδ4a protein levels is shown on the right (see also Figure 5—source data 1, **p<0.01; *p<0.05).
Figure 6 with 1 supplement
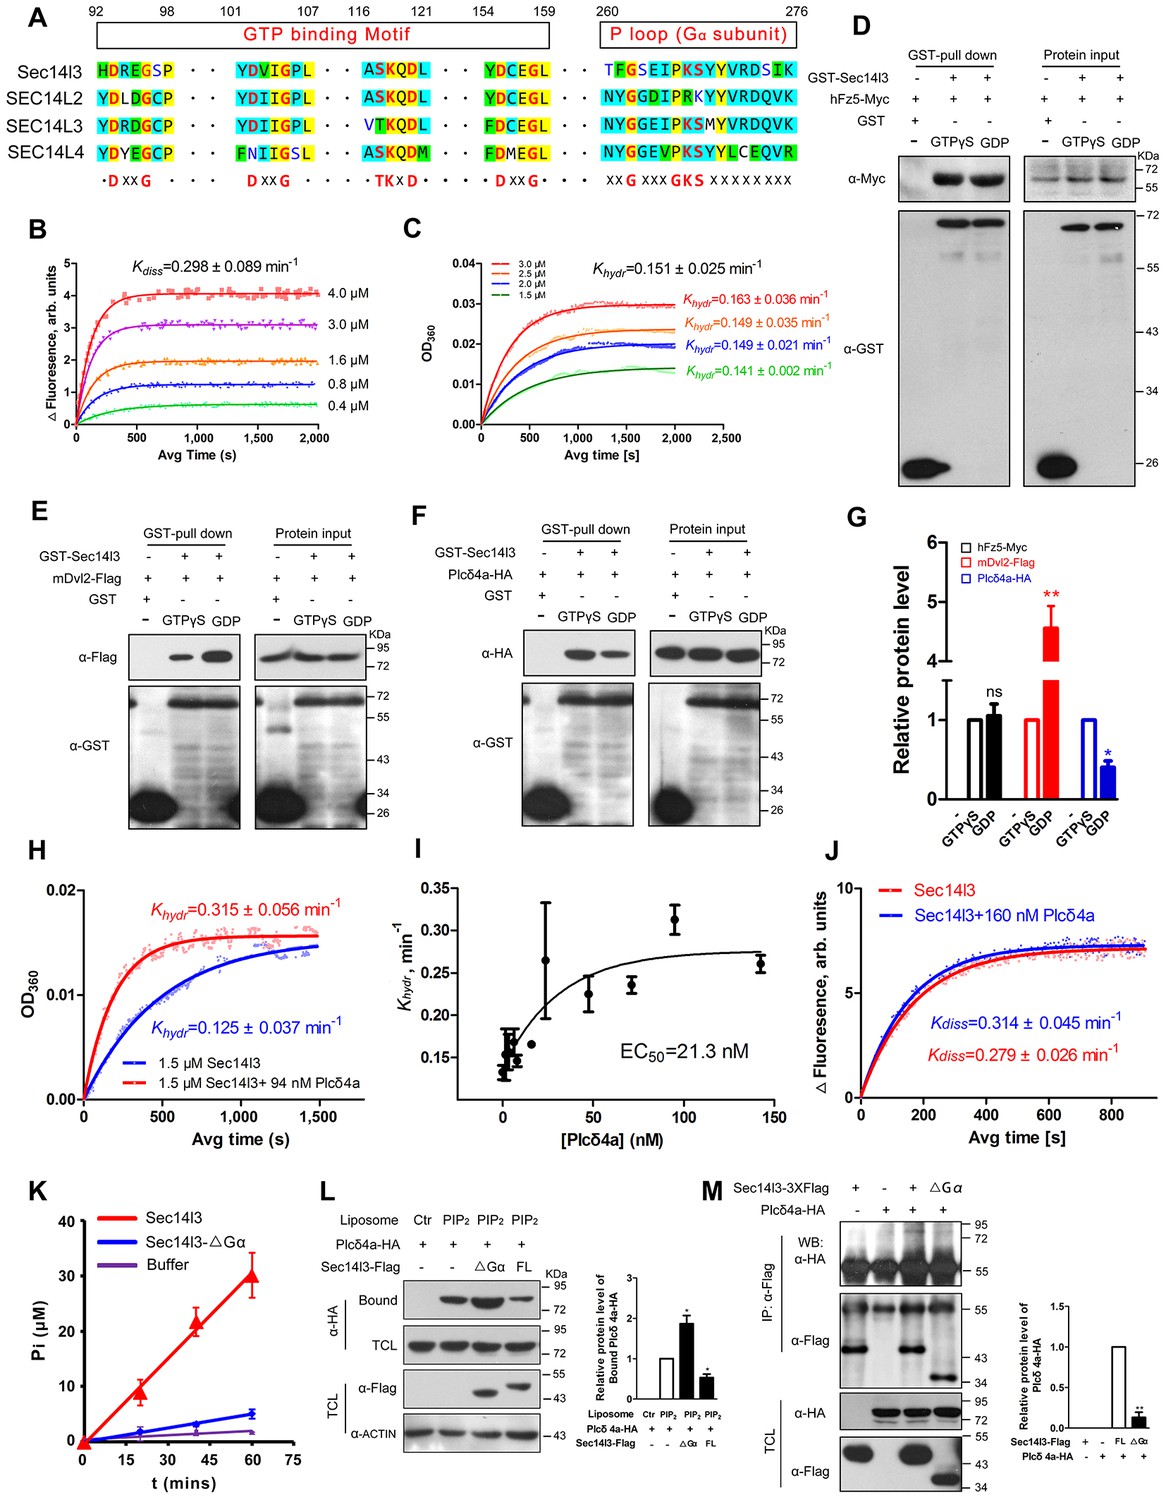
Sec14l3 exerts its GTPase activity to prime PLC.
(A) Protein sequence alignment of zebrafish Sec14l3, and human SEC14L2, SEC14L3, and SEC14L4 in GTP binding motif and P loop region (Gα subunit). Critical amino acids are highlighted in red as consensus at the last panel. (B) GTP binding activity of Sec14l3. The fluorescence of BODIPY-FL-GTPγS at indicated concentrations was measured at room temperature (λex = 490 nm and λem = 510 nm), following the addition of 10 μM Sec14l3. Data are representative uptake curves. The Kdiss constant of Sec14l3 from three independent experiments is 0.298 ± 0.089 min−1. (C) GTP hydrolysis activity of Sec14l3. Time-course of Pi release from Sec14l3-GTP at indicated concentrations measured by absorbance at 360 nm in the single-turnover assay based on MESG system. Data are representative GTP hydrolysis curves and the Khydr constant of Sec14l3 from three independent experiments is 0.151 ± 0.025 min−1. (D) Full-length hFz5 equally binds to GDP- and GTPγS-bound Sec14l3 in vitro. (E) Full-length mDvl2 binds preferentially to inactive GDP-bound Sec14l3 in vitro. (F) Purified Plcδ4a binds preferentially to active GTPγS-bound Sec14l3 in vitro. (G) Quantification of relative protein level of hFz5-Myc (D), mDvl2-Flag (E) or Plcδ4a-HA (F) bound by GST-Sec14l3 in the GTPγS/GDP form. Data are shown as mean ± SEM from three separate experiments (**p<0.01; p<0.05; ns, non-significant). (H) Plcδ4a functions as the GAP of Sec14l3. Data are representative GTP hydrolysis curves from three independent experiments. The Khydr constant is statistically significant between two treatments with p<0.05. (I) Quantification of the Khydr constants over different concentrations of Plcδ4a. Each concentration is plotted as mean ± SEM from three independent experiments. (J) GTP binding activity of 10 μM Sec14l3 in the absence or presence of 160 nM Plcδ4a. Data shows an example of BODIPY-GTPγS uptake curve of three experiments. These two Kdiss constants have no significant difference by the Student’s t test. (K) Gα subunit deletion led to a decreased GTPase activity of Sec14l3. Data shown are representative curves out of three replicates and are plotted as mean ± SEM. (L) Sec14l3-ΔGα protein overexpression disturbs Plcδ4a-mediated PIP2 degradation in vitro. Equal amounts of purified Plcδ4a protein and liposomes containing PIP2 or not were incubated with Sec14l3-transfected cell lysates. Liposome-bound Plcδ4a was eluted and analyzed with quantification data as mean ± SEM on the right (*p<0.05). (M) Gα subunit mediates Plcδ4a interaction with Sec14l3 in HEK293T cells. Quantification data from three independent experiments are shown as mean ± SEM on the right (**p<0.01). All numerical data represented as a graph in the figure are shown in Figure 6—source data 1.
-
Figure 6—source data 1
Numerical data for graphs in Figure 6 and Figure 6—figure supplement 1.
- https://doi.org/10.7554/eLife.26362.022
Figure 6—figure supplement 1
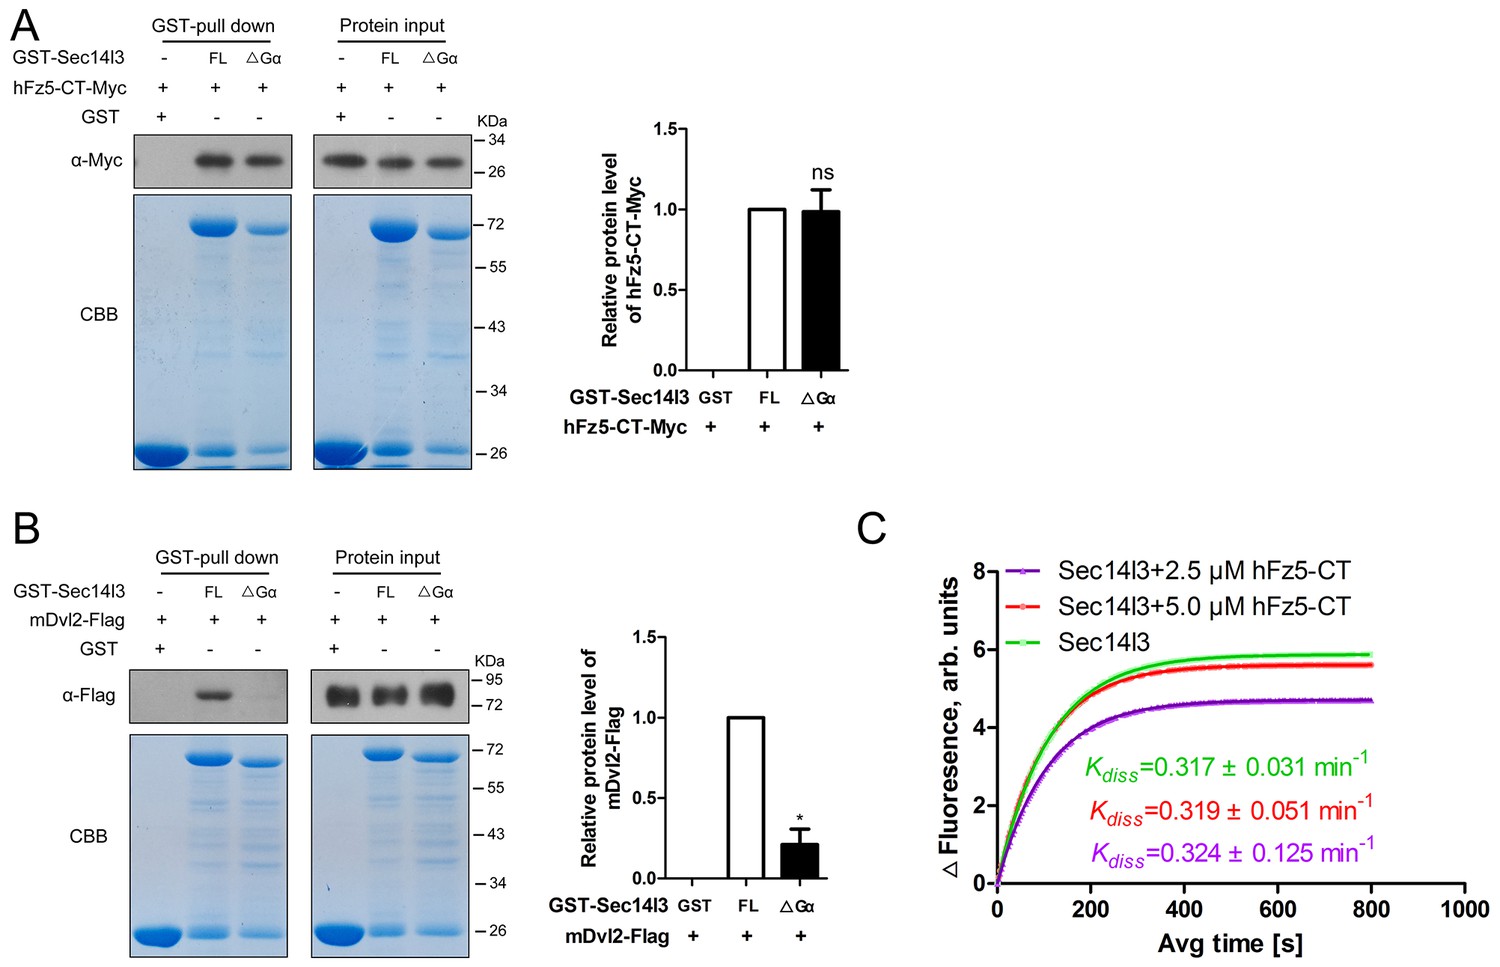
Gα subunit deletion had no effect on interaction with hFz5-CT, but impaired its binding to mDvl2.
(A) Gα subunit has no effect on hFz5-CT interaction with Sec14l3. Myc tagged C-terminal of hFz5 and GST-Sec14l3 or GST-Sec14l3-ΔGα fusion proteins were expressed in E.coli and purified using glutathione-Sepharose beads for pull down assay. CBB: Coomassie blue staining. Quantification data are shown at the right, represented by mean ± SEM from three separate experiments (see also Figure 6—source data 1, ns, non-significant). (B) Gα subunit mediates mDvl2 interaction with Sec14l3. GST-Sec14l3 or GST-Sec14l3-ΔGα fusion proteins were incubated with mDvl2-Flag transfected cell lysates and pulled down using glutathione-Sepharose beads. CBB: Coomassie blue staining. Quantification data is shown at the right, represented by mean ± SEM from three separate experiments (see also Figure 6—source data 1, *p<0.05). (C) hFz5-CT cannot promote the GTP binding activity of Sec14l3. The fluorescence of 5 μM BODIPY-FL-GTPγS was measured at room temperature, following the addition of 10 μM Sec14l3 or 10 μM Sec14l3 with 1.25 μM/2.5 μM hFz5-CT protein. Data shows an example of BODIPY-GTPγS uptake curve of three experiments. The respective Kdiss constant is calculated and Kdiss difference between Sec14l3 alone and 10 μM Sec14l3 with 1.25 μM/2.5 μM hFz5-CT protein group is not statistically significant.
Figure 7

Sustained PLC activity partially rescues Msec14l3 defects.
(A) Morphological defects in zebrafish embryos treated with 1.5 μM or 3 μM U73122 from the 1 cell stage. DMSO treated group serves as a control. Scale bars, 100 μm. (B) Confocal imaging of PLCδ1-PH-mCherry (red, PIP2 probe) shows the PM accumulation of PIP2 in zebrafish embryos treated with 1.5 μM DMSO or 1.5 μM U73122 at 4 and 6 hpf. The first two whole embryo panels are 3D views of z-stacks, while the last panel is enlarged views of single z-stack pictures (z = 5 for both 4 hpf and 6 hpf) from regions encompassed by white boxes. Scale bars, 100 μm for the whole embryos; 25 μm for the enlarged columns. (C) Active Plcδ4a overcomes the CE defects in Msec14l3 mutants. 100 pg plcδ4a-Δ28 mRNA was used for injection. Lateral views for embryos in the first panel, dorsal views for those in the last panel. Blue and red two-way arrows indicate the width of neural plate and the length of notochord respectively. Scale bars, 100 μm. (D) Hypothetic working model of Sec14l3 participation in Wnt/Ca2+ signaling. In the absence of Wnt (left panel), Sec14l3 is mainly maintained in the ER and cytoplasm, forming a heterodimer with Dvl in its inactive state, Sec14l3-GDP. Upon Wnt5 stimulation (right panel), Fz/Dvl-mediated Sec14l3 is recruited to the PM and switched to the active state, Sec14l3-GTP, and subsequently promotes Plcδ4a localization from cytoplasm to the PM and then the consequent activity at least in two aspects: its PIP2 hydrolytic activity to generate second messenger InsP3 and DAG for signaling propagation (Ca2+ release and p-Erk activation); and its GAP activity to terminate Sec14l3-GTP.
Additional files
-
Supplementary file 1
Primers used in the present study.
- https://doi.org/10.7554/eLife.26362.025
Download links
A two-part list of links to download the article, or parts of the article, in various formats.
Downloads (link to download the article as PDF)
Open citations (links to open the citations from this article in various online reference manager services)
Cite this article (links to download the citations from this article in formats compatible with various reference manager tools)
The Sec14-like phosphatidylinositol transfer proteins Sec14l3/SEC14L2 act as GTPase proteins to mediate Wnt/Ca2+ signaling
eLife 6:e26362.
https://doi.org/10.7554/eLife.26362


