Microtubule-dependent ribosome localization in C. elegans neurons
- University of California, San Diego, United States
- Howard Hughes Medical Institute, University of California, San Diego, United States
Figures
Figure 1 with 3 supplements
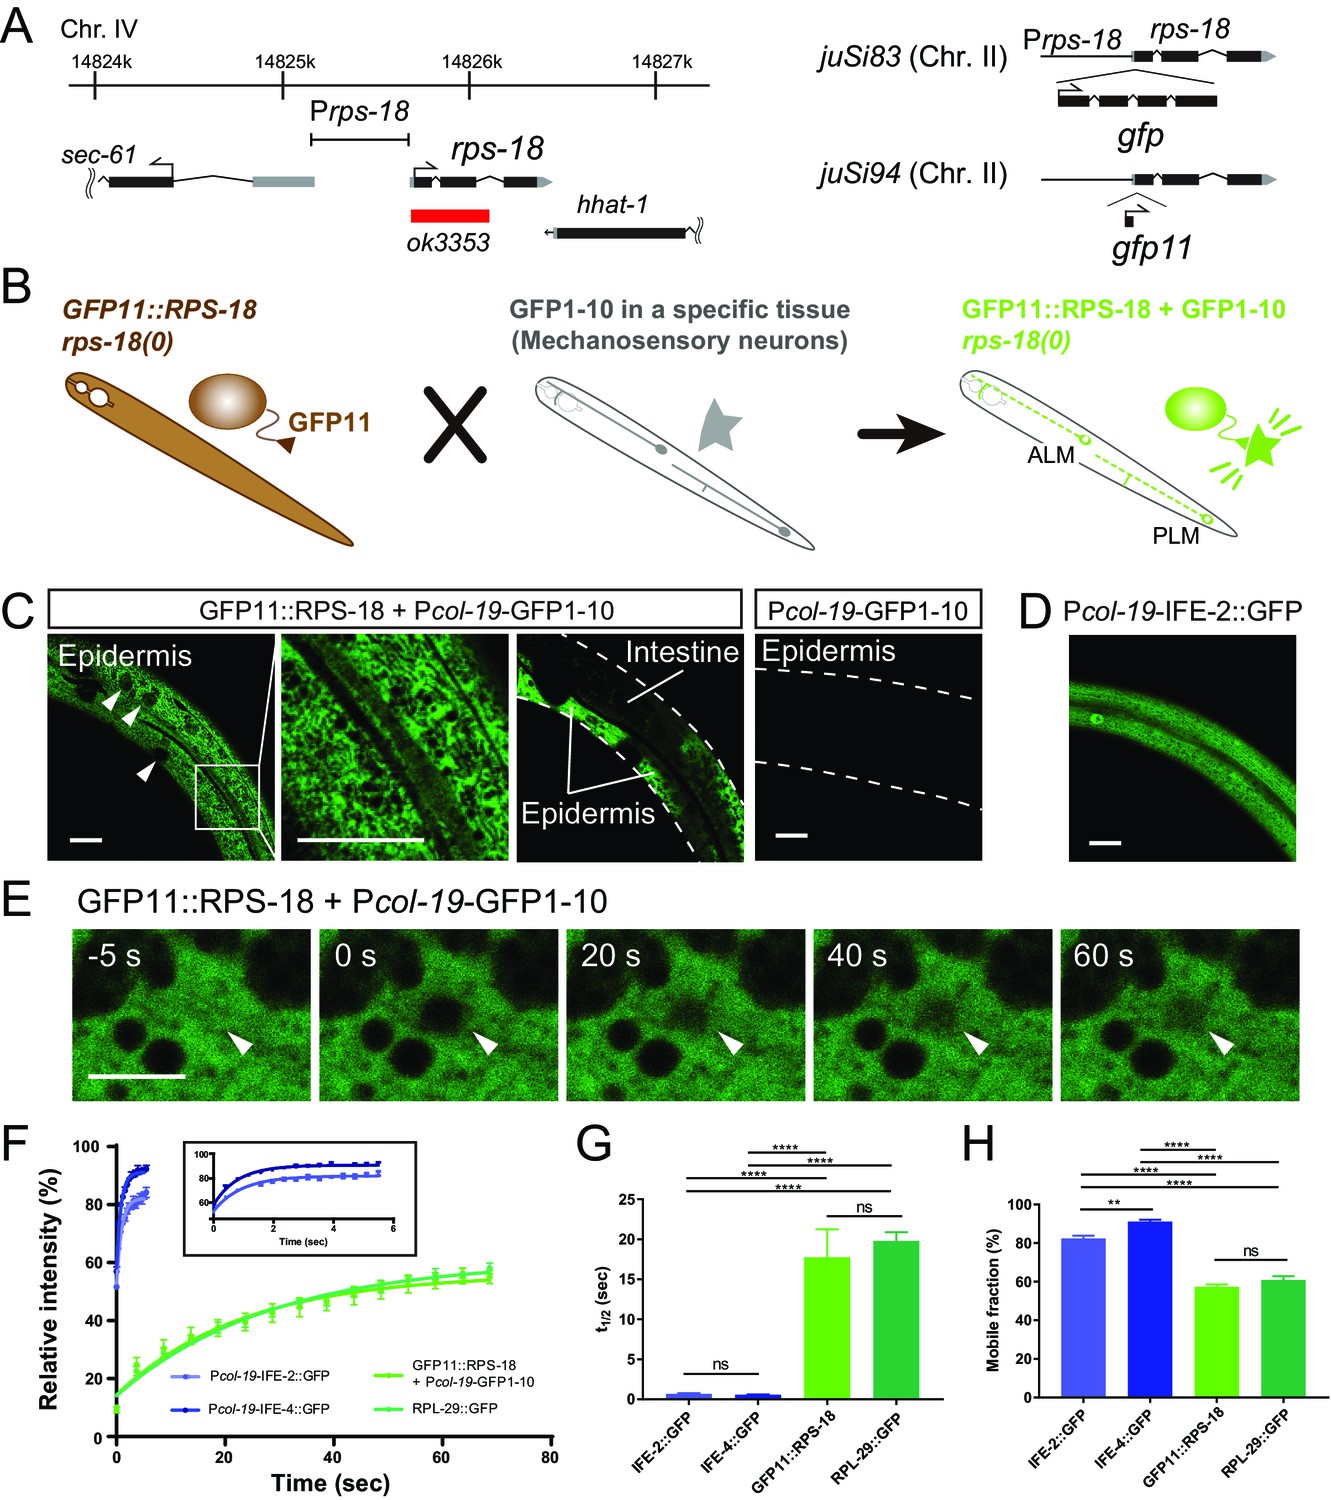
Ribosome Imaging Based On split GFP (RIBOS).
(A) Schematics of endogenous rps-18 locus on chromosome IV and single-copy transgenes on chromosome II. Black box: exon, Grey box: untranslated region, Red box: deletion. (B) Schematic of RIBOS for mechanosensory neurons. The rps-18 fused to the smaller part of split GFP (GFP11) is replaced to the endogenous rps-18 (juSi94[GFP11::rps-18]; rps-18(0), left). The larger part of split GFP (GFP1-10) is overexpressed using a high-copy transgene in a targeted tissue (middle). After crossing these strains, GFP1-10 binds to the GFP11::RPS-18 in the targeted tissue and visualize RPS-18 (right). (C) Epidermis-specific Pcol-19-RIBOS (juSi94[GFP11::rps-18]; rps-18(0); juEx5375[Pcol-19-GFP1-10]). The RIBOS signals were excluded from the nuclei (Left panel, arrowheads) and reticular structures (magnified image). Although GFP11::RPS-18 is expressed in the intestine, it had no signals. The negative control only expressed GFP1-10 (juEx5375) in the epidermis. Scale bars: 20 µm. (D) Diffuse IFE-2 expression visualized by juEx5809[Pcol-19-IFE-2::GFP]. (E) Representative images of the FRAP experiment using Pcol-19-RIBOS. The fluorophore was bleached in the area (arrowheads) at 0 s. Scale bars: 2 µm. (F) Fluorescent recovery after photobleaching was plotted for juEx5809[Pcol-19-IFE-2::GFP], juEx5811[Pcol-19-IFE-4::GFP], Pcol-19-RIBOS, and juSi123[RPL-29::GFP]; rpl-29(0). The line represents the one-phase fit to an exponential function for each plot. The inset shows the magnified graph for IFE-2::GFP and IFE-4::GFP. Error bars indicate S.E.M. (G and H) t1/2 and mobile fraction calculated from (F). n= 5 or 6. Error bar indicates S.E.M., Statistics: One-way ANOVA, ns: p>0.05, p**<0.01, p****<0.0001.
Figure 1—figure supplement 1
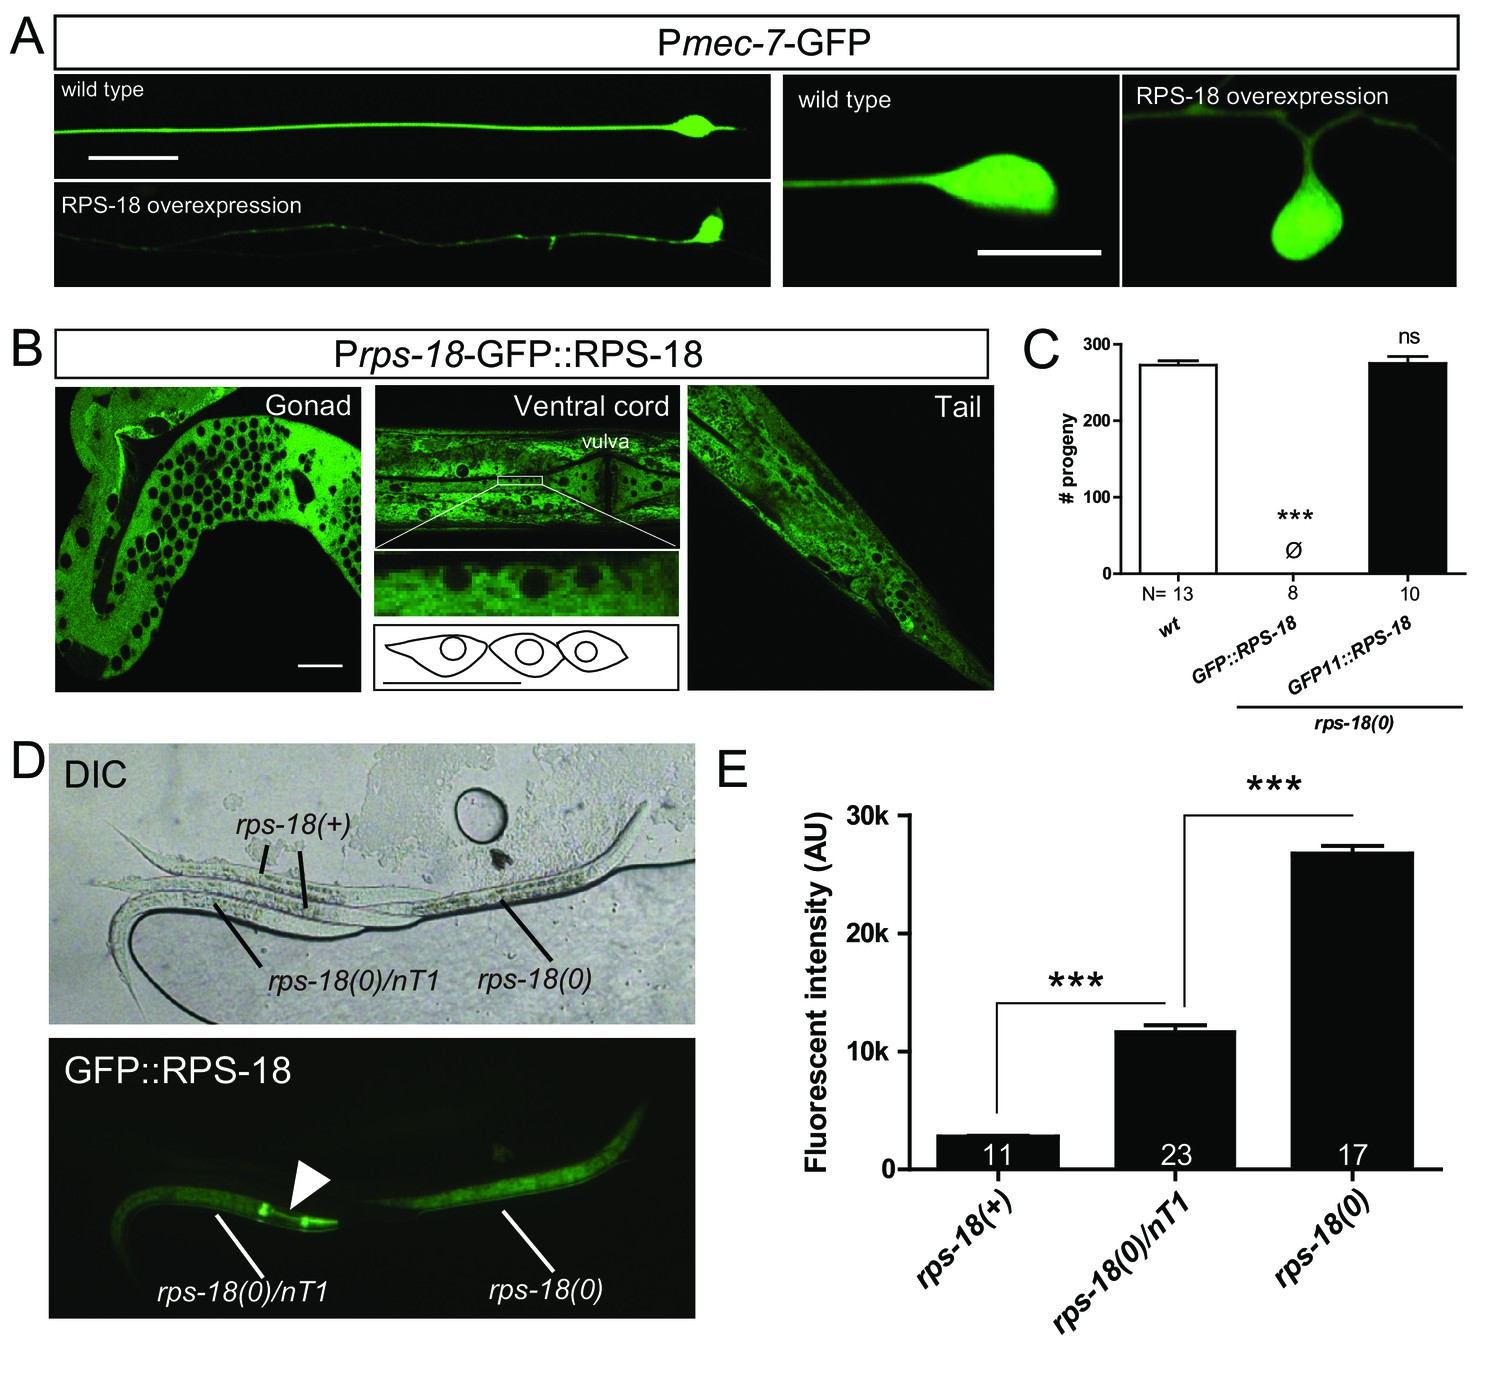
GFP::RPS-18 visualizes ribosomes in the whole body.
(A) RPS-18 overexpression in mechanosensory neurons with juEx5815[Pmec-4-RPS-18] caused abnormal axon (left panels) and soma (middle panels) morphologies. ALM neurons were visualized by muIs32[Pmec-7-GFP]. Scale bars: 20 and 10 µm in left and right panels, respectively. (B) Representative images of the indicated regions of juSi83[GFP::rps-18]-expressing worms in rps-18(0)/nT1 background at the young adult stage. All images were taken from the live animals except for the gonad, which was dissected out from the body. The magnified image in the middle shows the cell bodies of motor neurons. Scale bars: 20 µm, 10 µm in the magnified image. (C) Brood size of worms for genotypes indicated. Single-copy transgenes, juSi83[GFP::rps-18] or juSi94[GFP11::rps-18], were used to rescue the sterility of rps-18(0). N: numbers of parental worms. Error bars: S.E.M. Statistics: 1-way ANOVA, compared to the wild type. ns: not significant (p>0.05), p***<0.001. (D) Differential interference contrast (DIC) and fluorescent images of juSi83-expressing worms at the L3 stage in the wild-type, heterozygous (rps-18(0)/nT1), or homozygous (rps-18(0)) background. Arrowhead: pharyngeal GFP in the nT1 balancer. (E) Quantification of fluorescence intensity of juSi83-carrying worms in the indicated backgrounds. Numbers of worms are shown in the bars. Error bars indicate S.E.M. Statistics: One way ANOVA, ***p<0.001.
Figure 1—figure supplement 2
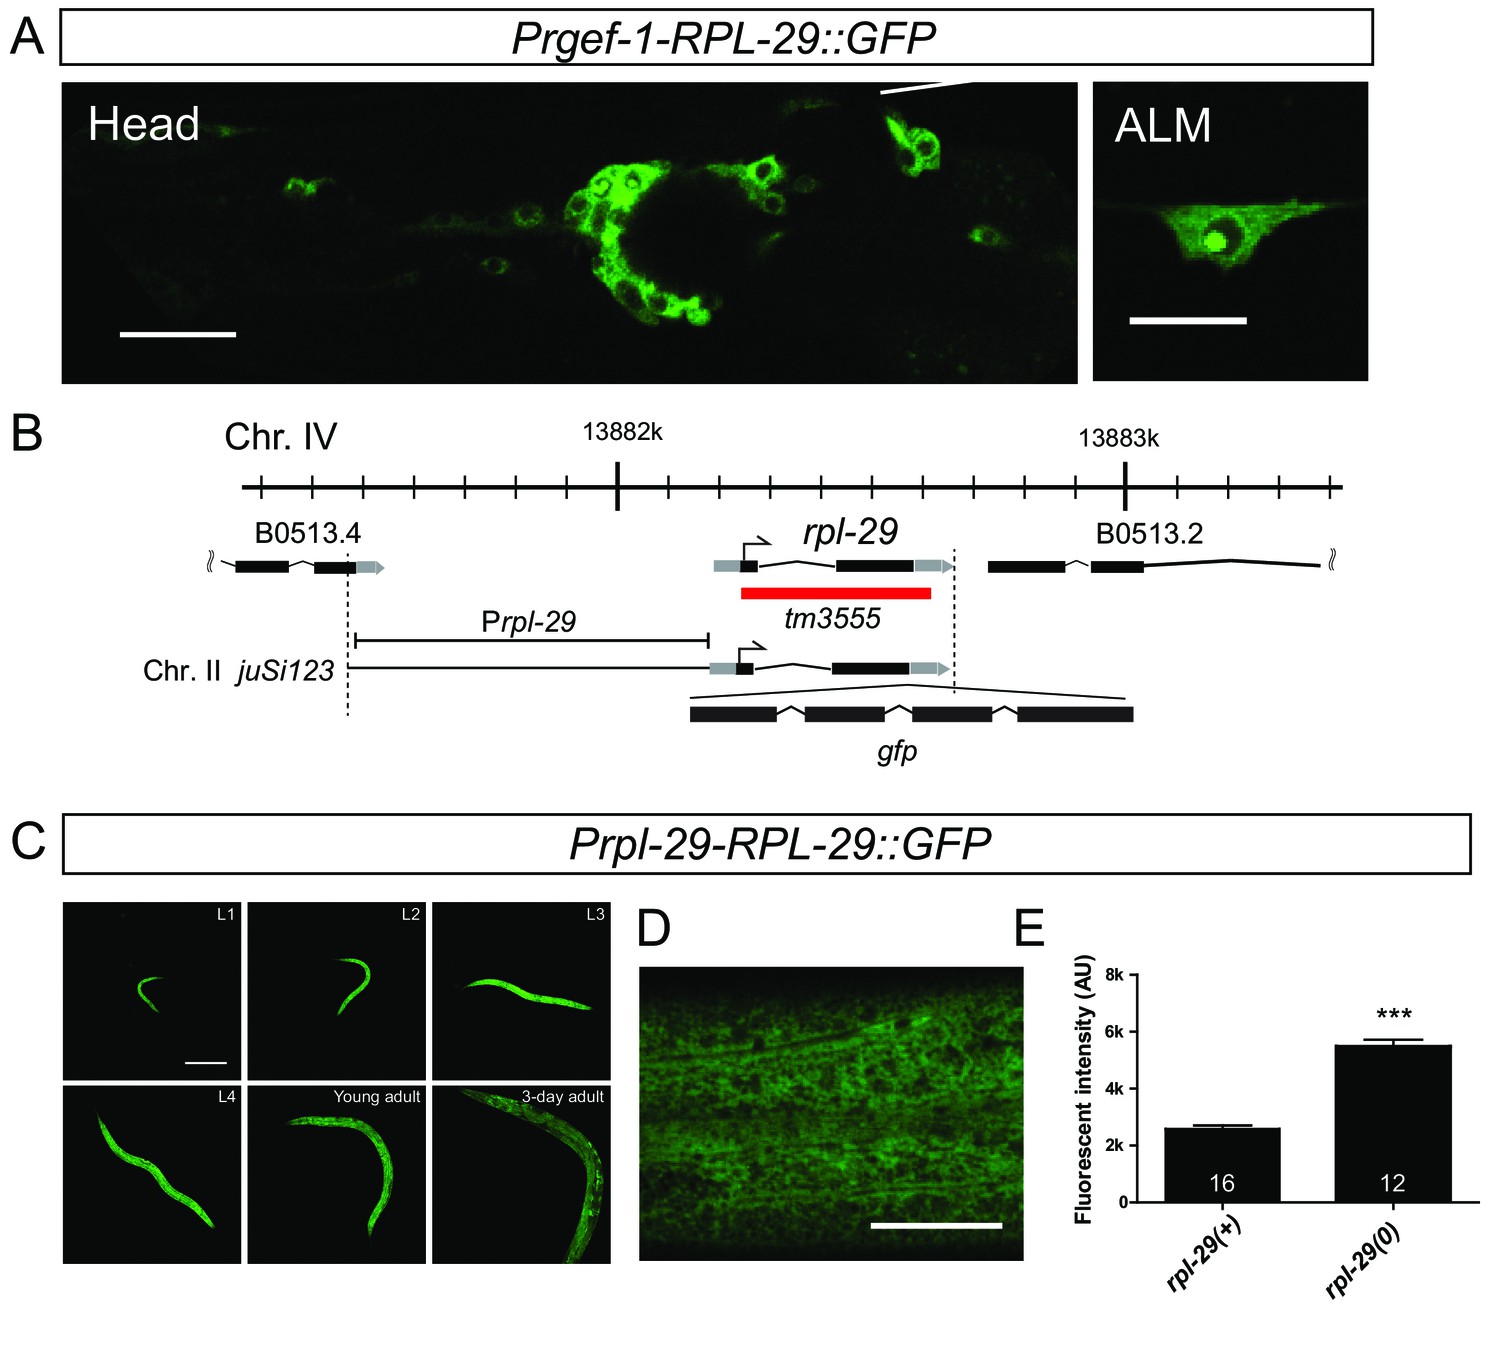
Ribosome visualization with RPL-29::GFP.
(A) Pan-neuronal RPL-29 overexpression with juEx5243[Prgef-1-RPL-29::GFP] caused abnormal aggregates of RPL-29 in the nucleus. Head ganglia and mechanosensory ALM neurons are shown. Scale bars: 20 µm (left); 10 µm (right). (B) Schematics of the rpl-29 locus and a transgene. Black box: exon, Grey box: untranslated region, Red box: deletion. (C and D) The juSi123[rpl-29::GFP]; rpl-29(tm3555) strain showed the expression of RPL-29 in the cytosol (D, scale bar = 20 µm) throughout development (C, scale bar = 200 µm). (E) Quantification of the fluorescence intensity in the indicated genetic background. Error bars indicate S.E.M. Statistics: Student’s t-test, ***p<0.001.
Figure 1—figure supplement 3
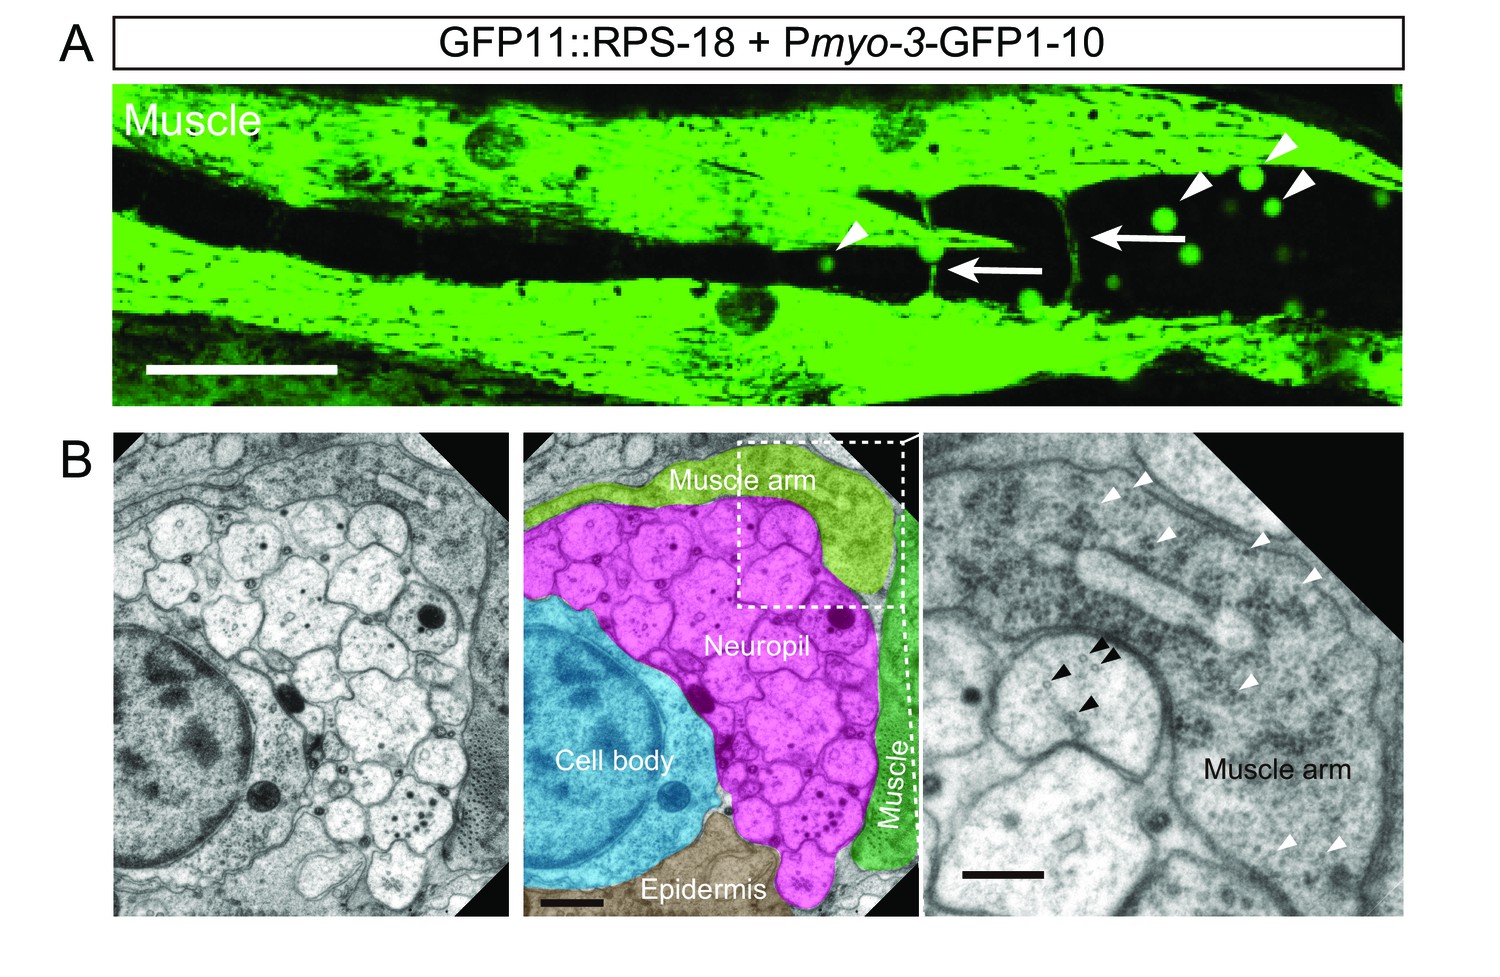
RIBOS visualizes ribosomes in muscle arms.
(A) Ribosome distribution in muscles visualized by Pmyo-3-RIBOS (juSi94[GFP11::rps-18]; rps-18(0); juEx5377[Pmyo-3-GFP1-10]). Ventral nerve cord runs horizontally in the middle of the image. Ribosomes in muscle arms are shown by arrows. Arrowheads indicate autofluorescence in the intestine. Scale bar: 20 µm. (B) Electron micrographs of the ventral nerve cord and muscle arm. Right panel is the enlarged muscle arm (dotted square in the middle panel), filled with ribosomes detected as 20 nm electron-dense structures (white arrowheads). Black arrowheads indicate microtubules in neurons, which have a similar diameter to ribosomes. Scale bar: 400 nm; 200 nm in the magnified image.
Figure 2
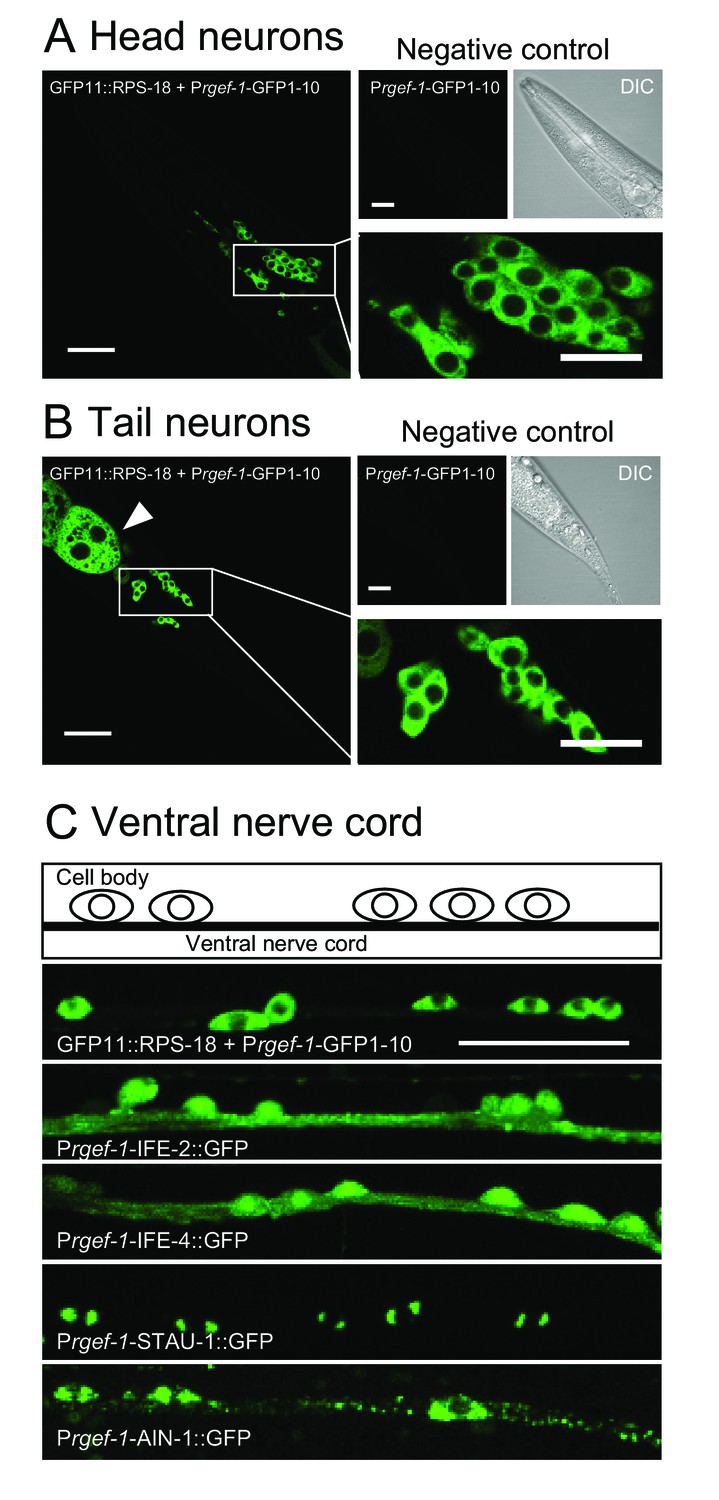
Ribosomes are mostly restricted in the neuronal soma.
(A and B) Pan-neuronal Prgef-1-RIBOS visualizing ribosomes (juSi94[GFP11::rps-18]; rps-18(0) juIs409[Prgef-1-GFP1-10]) in head neurons (A) and tail neurons (B). Negative controls only expressed GFP1-10 (juIs409[Prgef-1-GFP1-10]). An arrowhead in (B) indicates ribosomes in the intestine due to the leak expression of GFP1-10. Scale bars: 20 µm; 10 µm in the magnified images. (C) Fluorescent images and a schematic of motor neurons in the ventral nerve cord. Prgef-1-RIBOS is shown in the upper left panel. Initiation factors (IFE-2::GFP and IFE-4::GFP) and putative components of RNA granules (AIN-1::GFP and STAU-1::GFP) were expressed under the control of the rgef-1 promoter using extrachromosomal arrays (see Supplementary file 2 for the transgenes). Scale bar: 20 µm.
Figure 3
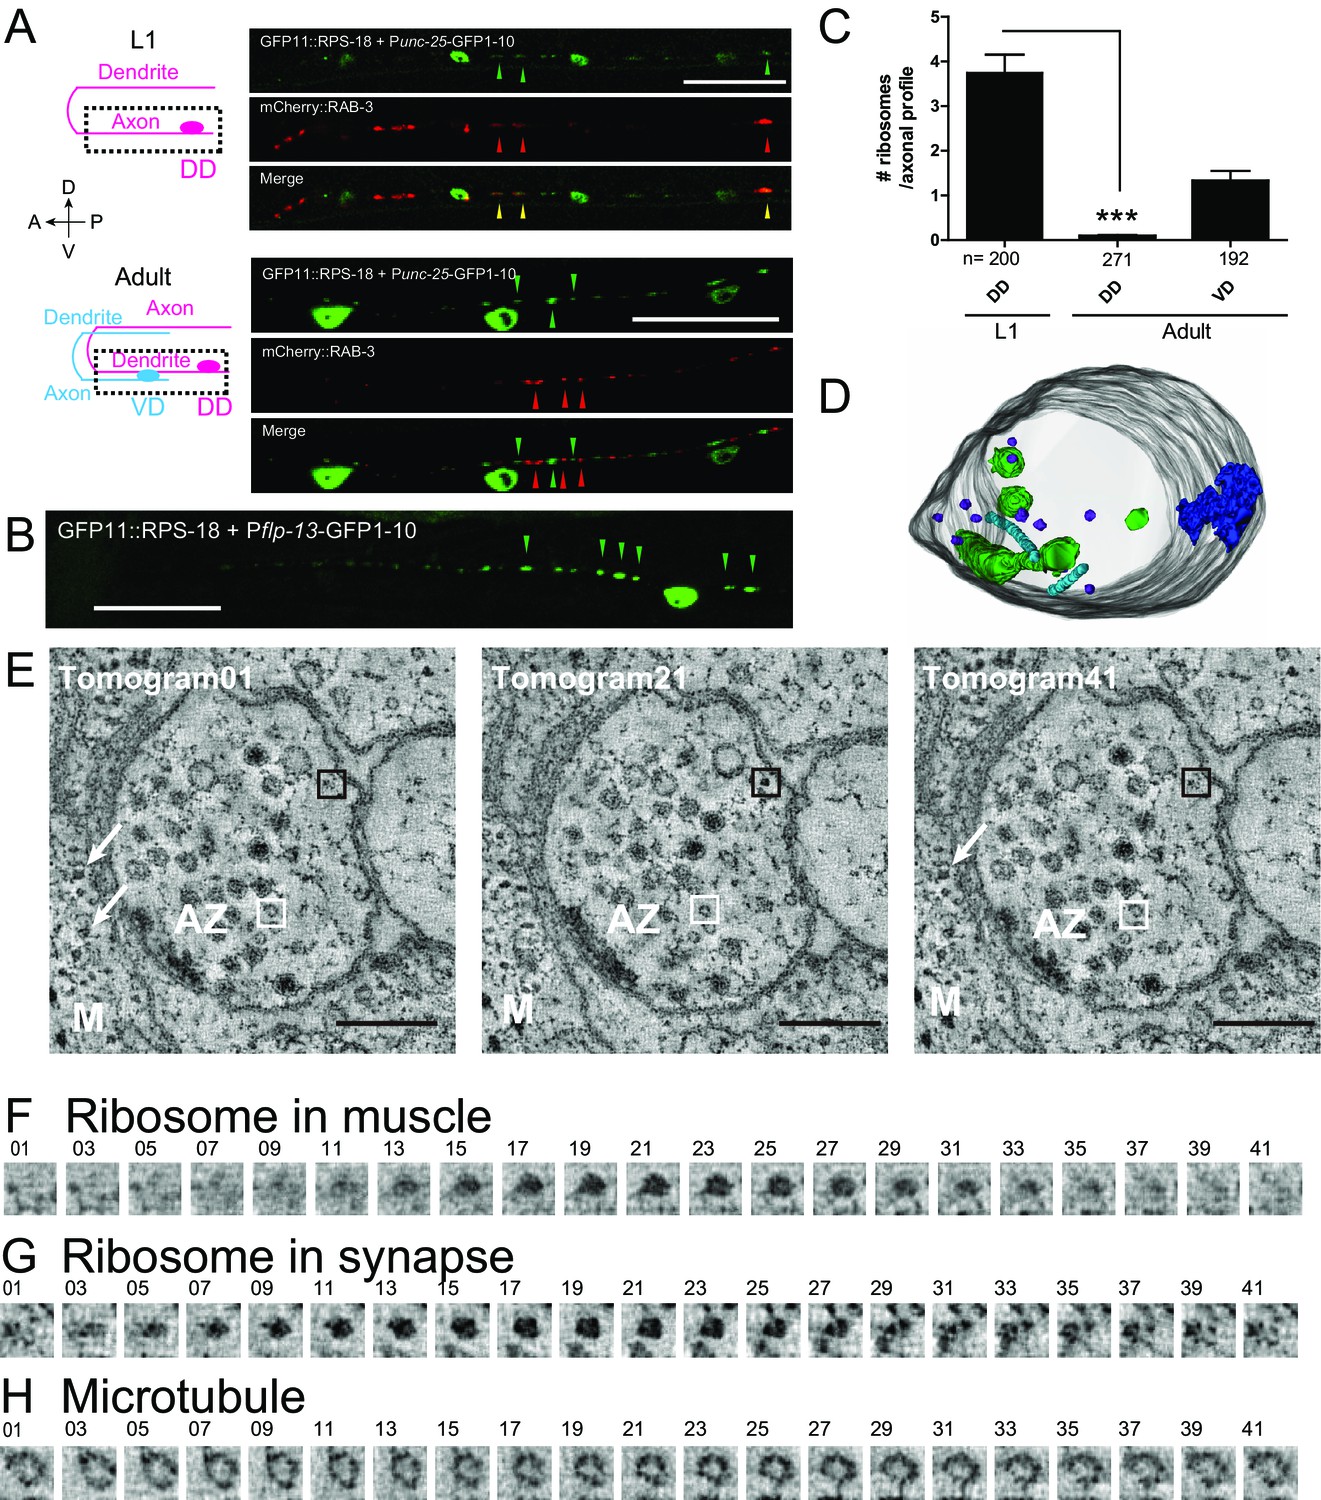
Ribosomes localize to the synaptic compartment in motor neurons.
(A) Schematic illustrates GABAergic motor neurons at the L1 or adult stage, in which dotted squares indicate imaged regions. As VD neurons are born, DD neurons change the innervation. GABAergic motor neuron-specific Punc-25-RIBOS (green arrowheads) and a presynaptic marker Punc-25-mCherry-RAB-3 (red arrowheads) were colocalized at the L1 stage (yellow arrowheads) but not at the adult stage. Scale bars: 20 µm. (B) DD-neuron specific Pflp-13-RIBOS showed punctate signals in the ventral cord (green arrowheads). Scale bar: 20 µm. (C) The number of ribosomes were counted in the axonal profiles of serially reconstructed electron micrographs for GABAergic motor neurons. Numbers of axonal profiles are indicated. Statistics: Student’s t-test, ***p<0.001. (D) A representative presynaptic volume reconstructed from EM tomograms of the adult motor neurons in the ventral cord, showing that presynaptic terminals contain ribosomes. Purple objects: ribosomes, blue: active zones, light blue: microtubules, green: endosomes. (E) Representative electron tomograms of presynaptic terminal of a motor neuron in the ventral nerve cord of an adult animal with 12 nm intervals. The active zone is surrounded by synaptic vesicles and dense core vesicles. White arrowheads indicate ribosomes in muscles (M). White boxes mark microtubules, which have a similar diameter as a ribosome; black boxes ribosomes. (F–H) Electron tomograms with 1.2 nm intervals for a ribosome in muscle (F), and a ribosome (G) and a microtubule (H) in the presynaptic terminal, showing that a microtubule and a ribosome have a similar diameter, but microtubule is continuous in z-direction unlike ribosome.
Figure 4

Ribosomes form puncta along the sensory neuron axons.
Mechanosensory neuron-specific Pmec-4-RIBOS (juSi94[GFP11::rps-18] juIs438[Pmec-4-GFP1−10+Pmec-4-tagRFP]; rps-18(0)). (A) ALM neurons at the adult stage. Negative control strain expressing only GFP1-10 had weak signals in the nucleus. Ribosomes form puncta along the ALM axon (arrowheads). Scale bars: 20 µm. (B) Comparison of RIBOS signals between L1 and adult stages around the synaptic branch of PLM neurons. Arrows and arrowheads indicate synaptic branches and RIBOS signals, respectively. Scale bar: 20 µm. (C) Number of puncta per 100 µm axon around the PLM branch. Statistics: Student’s t-test, ***p<0.001. N: number of worms. (D) Fraction of worms with ribosomes associated with PLM branch point at indicated developmental stages. Statistics: Fisher’s exact test, compared to the L1 stage. **p<0.01, ***p<0.001. N: number of worms.
Figure 5 with 1 supplement
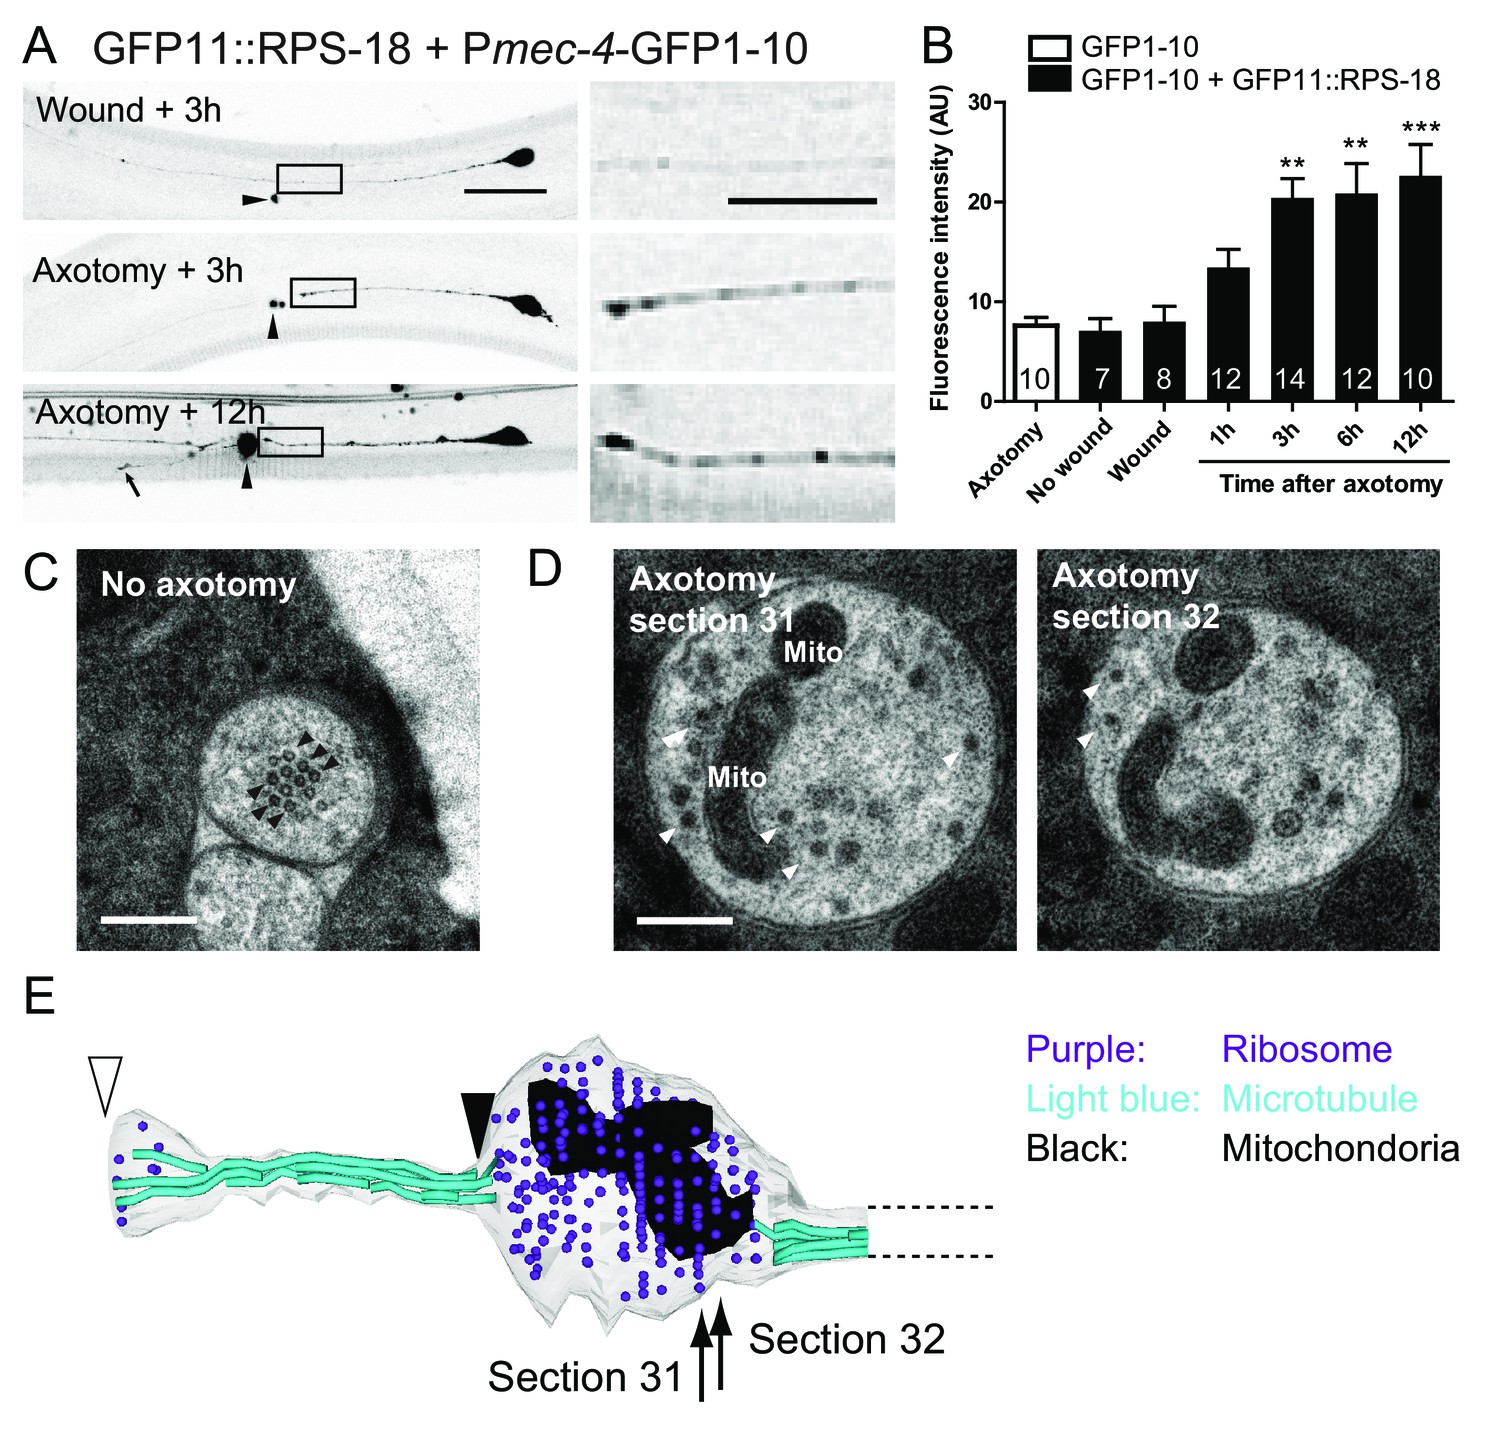
Ribosomes accumulate at the tip of proximal axons after axon injury in mechanosensory neurons.
(A) Pmec-4-RIBOS three or twelve hours after axon injury or wounding. For negative control, worms were wounded by laser without damaging the axon. Right panels are magnified images of the black square regions. Arrowheads indicate laser illumination site. An arrow indicates the tip of the regrowing axon. Scale bar: 20 µm; 10 µm in the magnified image. (B) Quantification of fluorescent intensity at the proximal axons indicated by boxes in (A). Numbers of worms were shown in the bars. Statistics: One-way ANOVA, **p<0.01, ***p<0.001, compared to the wounded condition. (C) Electron micrograph of PLM axon without axon injury. The uninjured PLM on the right side was used as a control from the same worm as in (D). Black arrowheads: microtubules. Scale bar: 200 nm. (D and E) The tip of the PLM axon on the left side six hours after axon injury. (D) Two serial electron micrographs corresponding to two sections in (E). White arrowheads: monosome-like electron dense particles; Mito: mitochondria. Scale bar: 200 nm. (E) Serial reconstruction EM, corresponding to forty-two sections with 50 nm thickness (2.1 µm in length). Black arrowhead indicates the presumable cutting site and white arrowhead the regrowing tip. Ribosome (purple dots) and mitochondria (black) accumulated around the cutting site, which lacks microtubules (light-blue lines).
Figure 5—figure supplement 1

Translation inhibitor prevents axon regrowth.
(A) Representative images showing the axon regrowth 24 hr after axotomy with a translation inhibitor, cycloheximide (CHX), or with DMSO as a negative control. Arrowheads indicate the cutting sites. Scale bar: 20 µm. (B and C) Quantification of total axon regrowth 24 hr after axotomy using two different GFP markers, zdIs5 and muIs32. Numbers of worms are indicated. Statistics: Student’s t-test, **p<0.01, ***p<0.001.
Figure 6

Ribosome distribution is altered in unc-16 mutants.
Mechanosensory neuron-specific Pmec-4-RIBOS with free tagRFP. (A) Representative images of ALM neurons in the indicated genetic backgrounds. unc-16 mutants showed reduced ribosomes in the proximal axon (arrows). Scale bar: 20 µm. (B) RIBOS fluorescence intensity in the proximal axon (20 µm from the soma). Numbers of worms are shown in the bars. Statistics: One-way ANOVA, ns: p>0.05, *p<0.05, **p<0.01, ***p<0.001. (C) PLM presynaptic terminals in the ventral cord, highlighted in the schematic. unc-16 mutants showed more ribosomes. (D) Ratio of RIBOS to tagRFP in the presynaptic terminals. Numbers of worms were shown in the bars. Statistics: One-way ANOVA, ns: p>0.05, ***p<0.001.
Figure 7 with 2 supplements
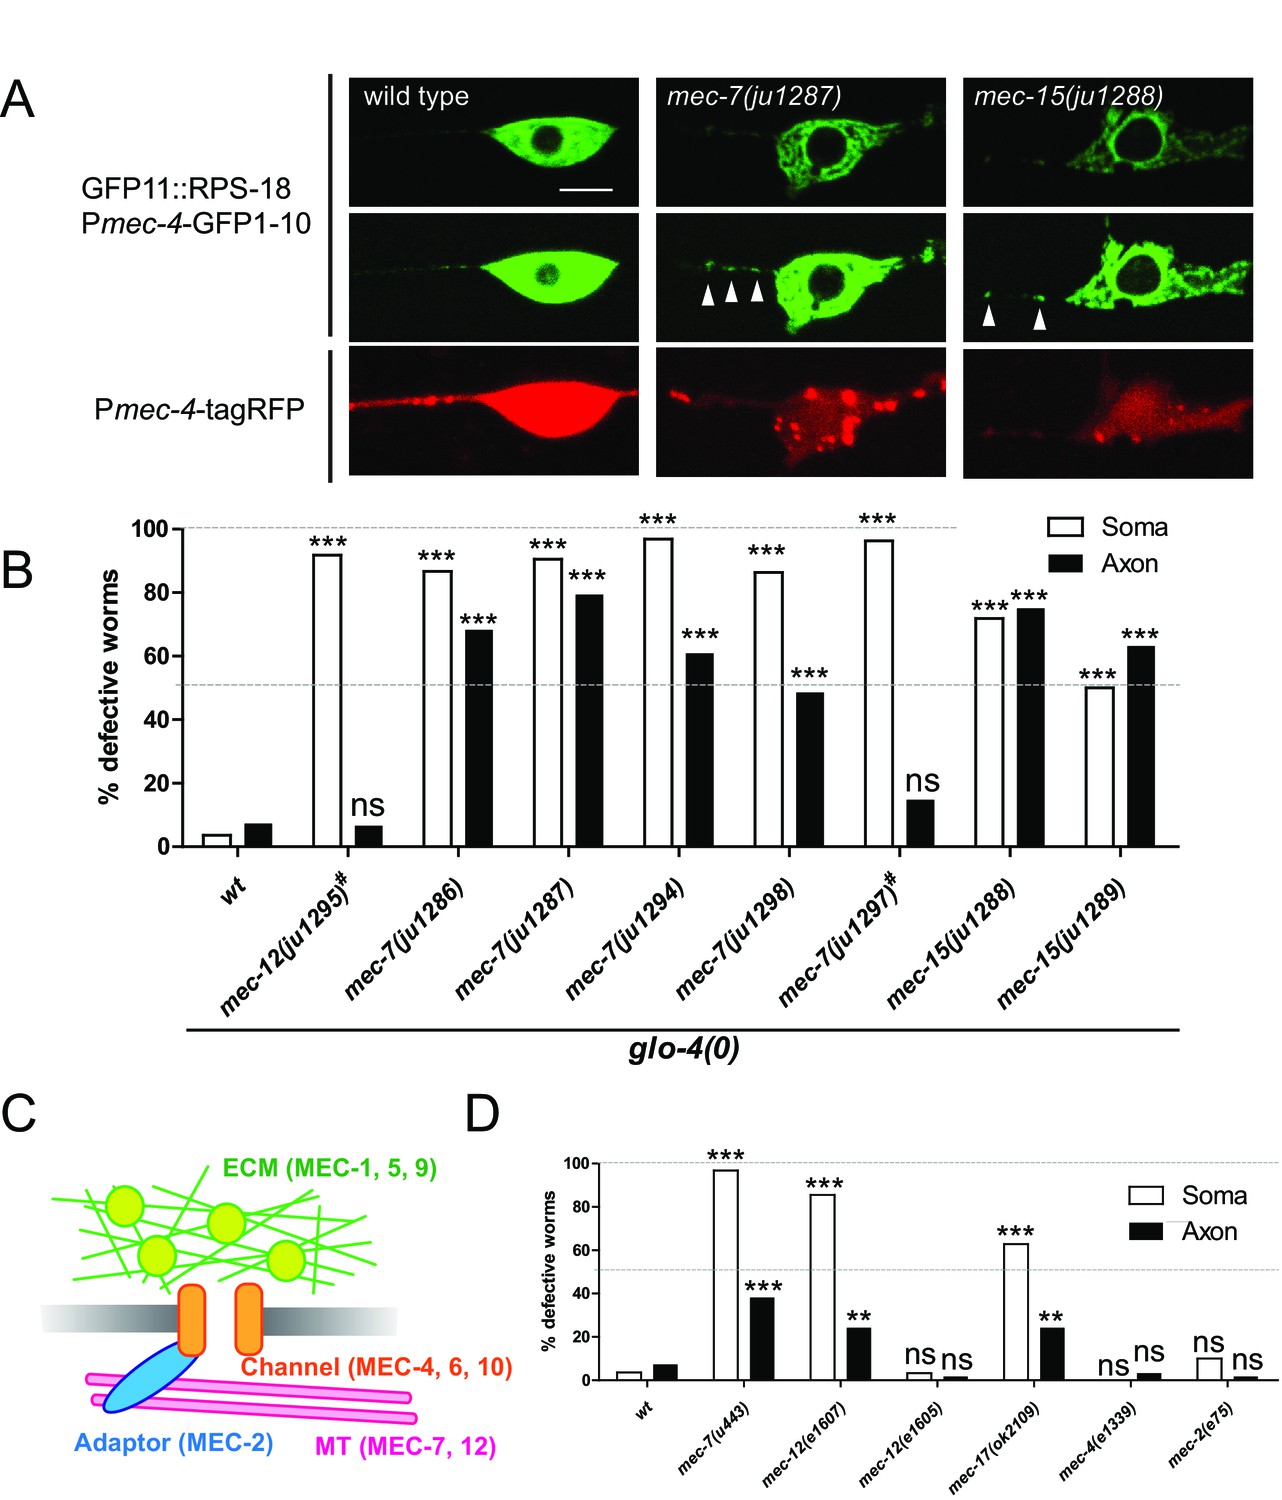
Ribosome distribution defects in tubulin mutants.
(A) Ribosome distribution in the ALM soma and proximal axon using Pmec-4-RIBOS in the indicated backgrounds. Brightness was adjusted in the middle panels to show the puncta in the proximal axons in the mec-7 and mec-15 mutants (white arrowheads). TagRFP intensity was decreased in the mec-7 and mec-15 mutants (bottom panels), consistent with a previous report (Bounoutas et al., 2011). Scale bar: 5 µm. (B and D) The fraction of worms showing the ribosome distribution defects in the soma or in the axon of ALM neurons in the indicated genetic backgrounds. # indicates dominant mutants. 50–70 worms were analyzed. Statistics: Fisher’s exact test, compared to the wild type control, ns: p>0.05, **p<0.01, ***p<0.001. (C) Schematic of mechanotransduction components in C. elegans. Representative proteins of each component are shown in brackets. ECM: extracellular matrix; MT: microtubules.
Figure 7—figure supplement 1

Gene and protein structures of ribosome defective mutants.
(A–C) Gene structures of mec-7, mec-12, and mec-15 with alleles and corresponding amino acid changes. Black boxes indicate exons; Grey bars untranslated regions. (D) Three-dimensional structure models of α- and β-tubulins generated by Swiss-Model (Biasini et al., 2014) and a schematic of a tubulin dimer. Non-exchangeable GTP is shown in yellow. MEC-7 model generated with pig β-tubulin (PDB: 1IA0) as a template. Magenta indicates recessive mutants (ju1286, ju1287, ju1294, and ju1297) close to the exchangeable GTP/GDP-binding site; cyan dominant mutant (ju1297). MEC-12 model generated with bovine α-tubulin (PDB: 4I50) as a template. Cyan indicates dominant mutant (ju1295); light green recessive mutant (e1607).
Figure 7—figure supplement 2
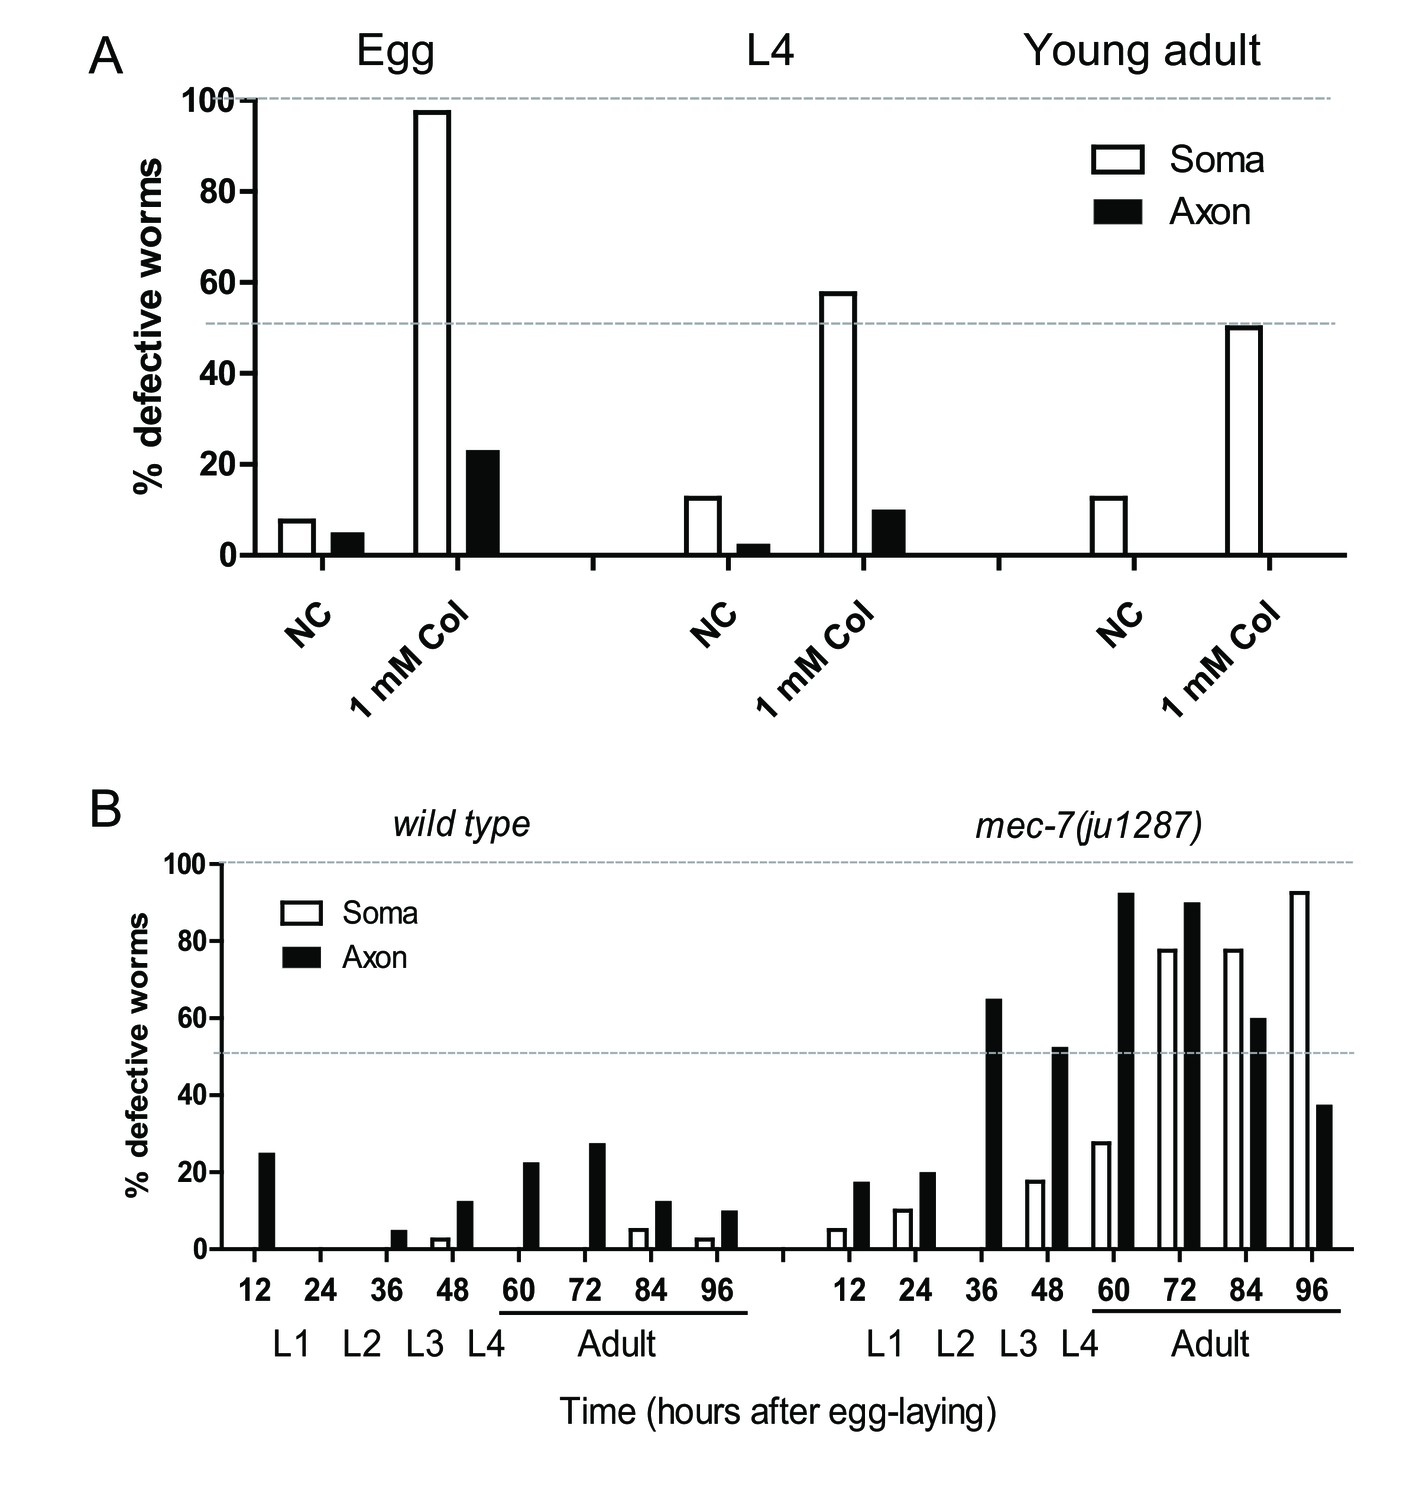
Microtubules are important for maintenance of ribosome distribution.
The fraction of worms showing the ribosome distribution defects in the soma or in the axon of ALM neurons. (A) Microtubule destabilizing drug (1 mM colchicine) treatment at different stages with a negative control (NC). (B) Time course of ribosome distribution defects in the wild type or mec-7 mutants during development. The corresponding developmental stages are indicated.
Tables
Table 1
Mutants with abnormal ribosome distributions
https://doi.org/10.7554/eLife.26376.015| Gene | Protein | Allele | NT change | AA change | Inheritance | Primers | Note |
|---|---|---|---|---|---|---|---|
| mec-7 | β-tubulin | ju1286 | G722A | G144R | Recessive | YJ11867/YJ12057 | Exchangeable GTP/GDP-binding site |
| mec-7 | β-tubulin | ju1287 | C705T | S138L | Recessive | YJ11867/YJ12057 | Exchangeable GTP/GDP-binding site |
| mec-7 | β-tubulin | ju1294 | G717A | G142D | Recessive | YJ11867/YJ12057 | Exchangeable GTP/GDP-binding site |
| mec-7 | β-tubulin | ju1298 | G603A | G104E | Recessive | YJ11867/YJ12057 | Exchangeable GTP/GDP-binding site |
| mec-7 | β-tubulin | ju1297 | G121A | R2H | Dominant | YJ12136/YJ12137 | Non-exchangeable GTP-binding site |
| mec-12 | α-tubulin | ju1295 | G7197A | G354E | Dominant | YJ12134/YJ12135 | Non-exchangeable GTP-binding site |
| mec-15 | E3 ligase | ju1288 | G327A | W91X | Recessive | YJ11668/YJ11669 | |
| mec-15 | E3 ligase | ju1289 | G217A G1661A | (Splice acceptor) R342Q | Recessive | YJ11668/YJ11669 YJ12138/YJ12139 |
Additional files
-
Supplementary file 1
Strain list.
- https://doi.org/10.7554/eLife.26376.016
-
Supplementary file 2
Plasmid list.
- https://doi.org/10.7554/eLife.26376.017
-
Supplementary file 3
Primer list.
- https://doi.org/10.7554/eLife.26376.018
-
Transparent reporting form
- https://doi.org/10.7554/eLife.26376.019
Download links
A two-part list of links to download the article, or parts of the article, in various formats.
Downloads (link to download the article as PDF)
Open citations (links to open the citations from this article in various online reference manager services)
Cite this article (links to download the citations from this article in formats compatible with various reference manager tools)
Microtubule-dependent ribosome localization in C. elegans neurons
eLife 6:e26376.
https://doi.org/10.7554/eLife.26376


