A cell cycle-independent, conditional gene inactivation strategy for differentially tagging wild-type and mutant cells
- Howard Hughes Medical Institute, Baylor College of Medicine, United States
- Baylor College of Medicine, United States
- Texas Children’s Hospital, United States
Figures
Figure 1 with 5 supplements
Mosaic generation using the Flip-Flop cassette.
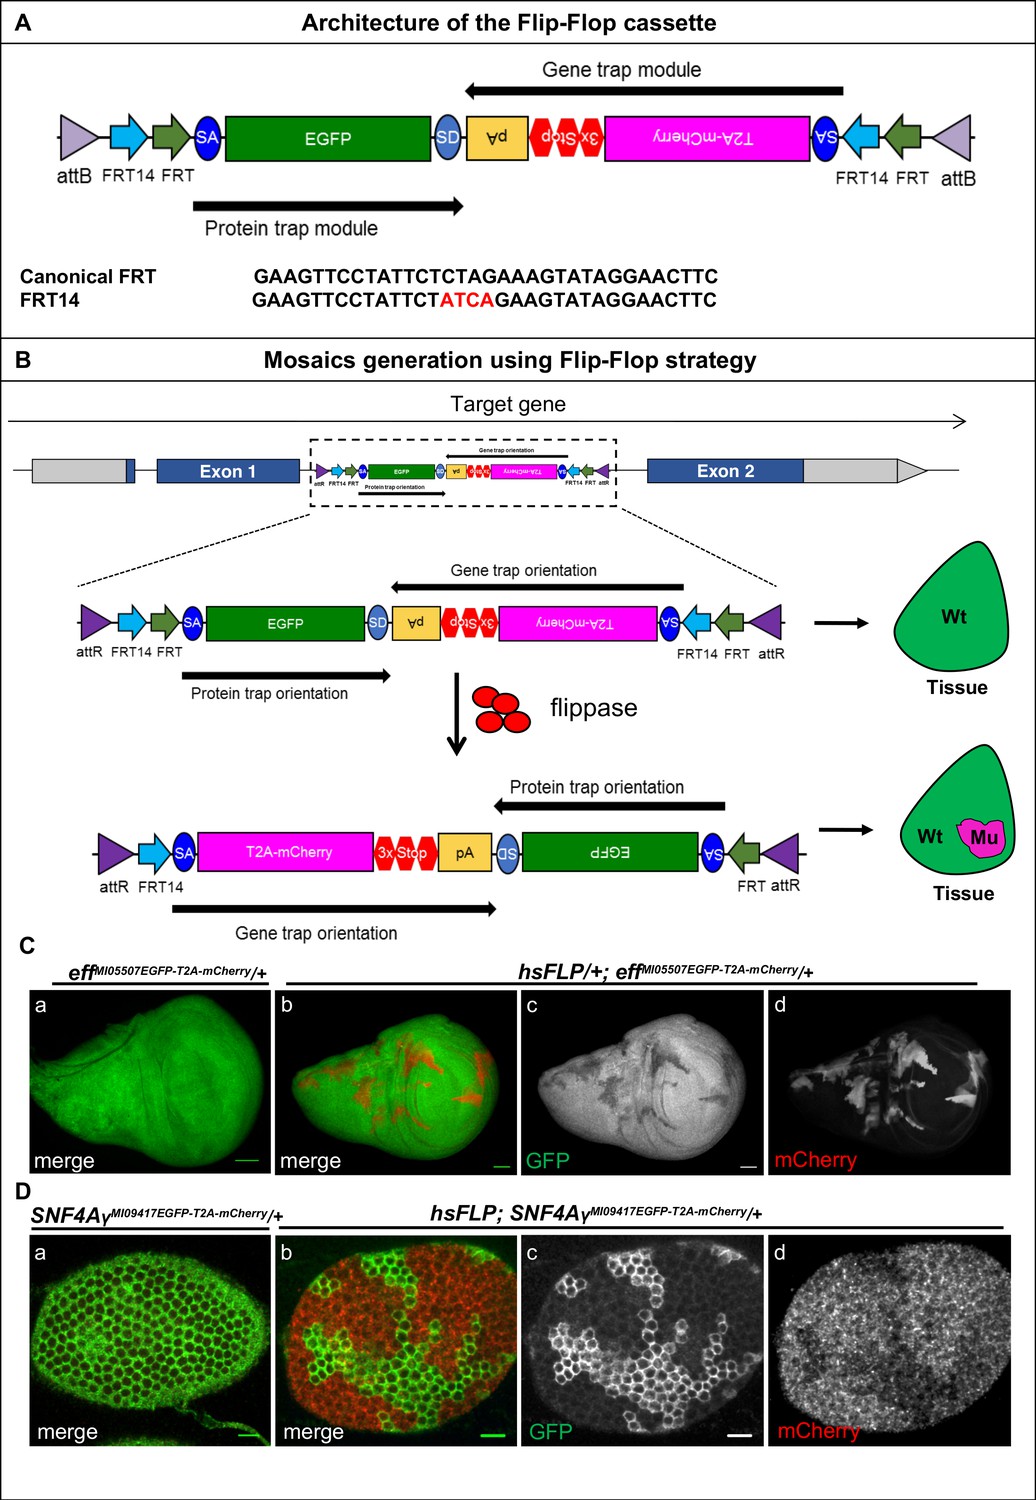
(A) The architecture of the Flip-Flop cassette. The cassette consists of two independent modules (PT and GT), that are oriented in opposite orientations. The PT module contains a splice acceptor (SA), followed by an EGFP tag and a splice donor (SD). The GT module contains a SA sequence, followed by the T2A peptide coding sequence (which will induce a translational skip), the mCherry coding region, stop codons in all three coding frames, and an SV40 polyA transcriptional termination signal. Given the opposite orientation of both modules, only one of the SA sequence will be active with respect to the recipient gene. The two modules are nested within a pair of FRT and FRT14 inverted repeats, forming a flippase-responsive FLEx switch. Finally, the entire cassette is flanked by two inverted attB sequences that permit phiC31-mediated RMCE between the Flip-Flop cassette and pre-existing MiMIC elements. A comparison of the FRT and FRT14 sequence is shown below. The FRT14 sequence varies from the canonical FRT sequence at the residues highlighted in red. (B) Schematic showing the inversion of a PT-oriented Flip-Flop cassette, inserted into the coding intron of a hypothetical gene. Upon FLP-expression, the FLEx switch undergoes two recombination events: (1) recombination between the two FRT sites or between the two FRT14 sites leads to cassette inversion that is followed by (2) excision of either the pair of FRT sites or the pair of FRT14 sites, both of which have obtained the same orientation due to the flip. Since the remaining unpaired FRT and FRT14 sites are not able to recombine, the cassette will be locked in the GT orientation. Thus, the initial PT orientation allows the gene to be tracked by EGFP-tagged protein expression in tissues. FLP activity inverts the Flip-Flop cassette in random cells, generating a mosaic tissue consisting of cells that did not undergo the flip and are still expressing the EGFP-tagged protein and cells that inverted the Flip-Flop cassette into the GT orientation, which are marked by mCherry expression. (C) (a) Wing imaginal disc from a effMI05507EGFP-T2A-mCherry/+ third instar larva, expressing Eff-EGFP-Eff (b) Wing imaginal disc from a hsFLP; effMI05507EGFP-T2A-mCherry/+ third instar larva showing hsFLP-induced clones that loose the GFP signal (c) and express mCherry (d) Scale bar = 50 µm. (D) (a) Stage 6 egg chamber obtained from SNF4AyMI09417EGFP-T2A-mCherry/+ females reveals EGFP-SNF4Aγ-EGFP expression in all follicle cells. (b) Stage 6 egg chamber obtained from hsFLP; SNF4AyMI09417EGFP-T2A-mCherry/+ females shows a mosaic tissue with groups of cells that have retained EGFP expression, and others that have inverted the Flip-Flop cassette and can be recognized by loss of EGFP expression (c) and gain of mCherry expression (d), inversion of Flip-Flop cassette is marked with loss of EGFP and expression of mCherry. Scale bar = 10 µm.
-
Figure 1—source data 1
List of constructs generated in this study.
- https://doi.org/10.7554/eLife.26420.004
-
Figure 1—source data 2
List of fly strains used in the study.
- https://doi.org/10.7554/eLife.26420.005
Figure 1—figure supplement 1
Flip-Flop PT insertions in eff and SNF4Aγ generate functional EGFP-tagged proteins.
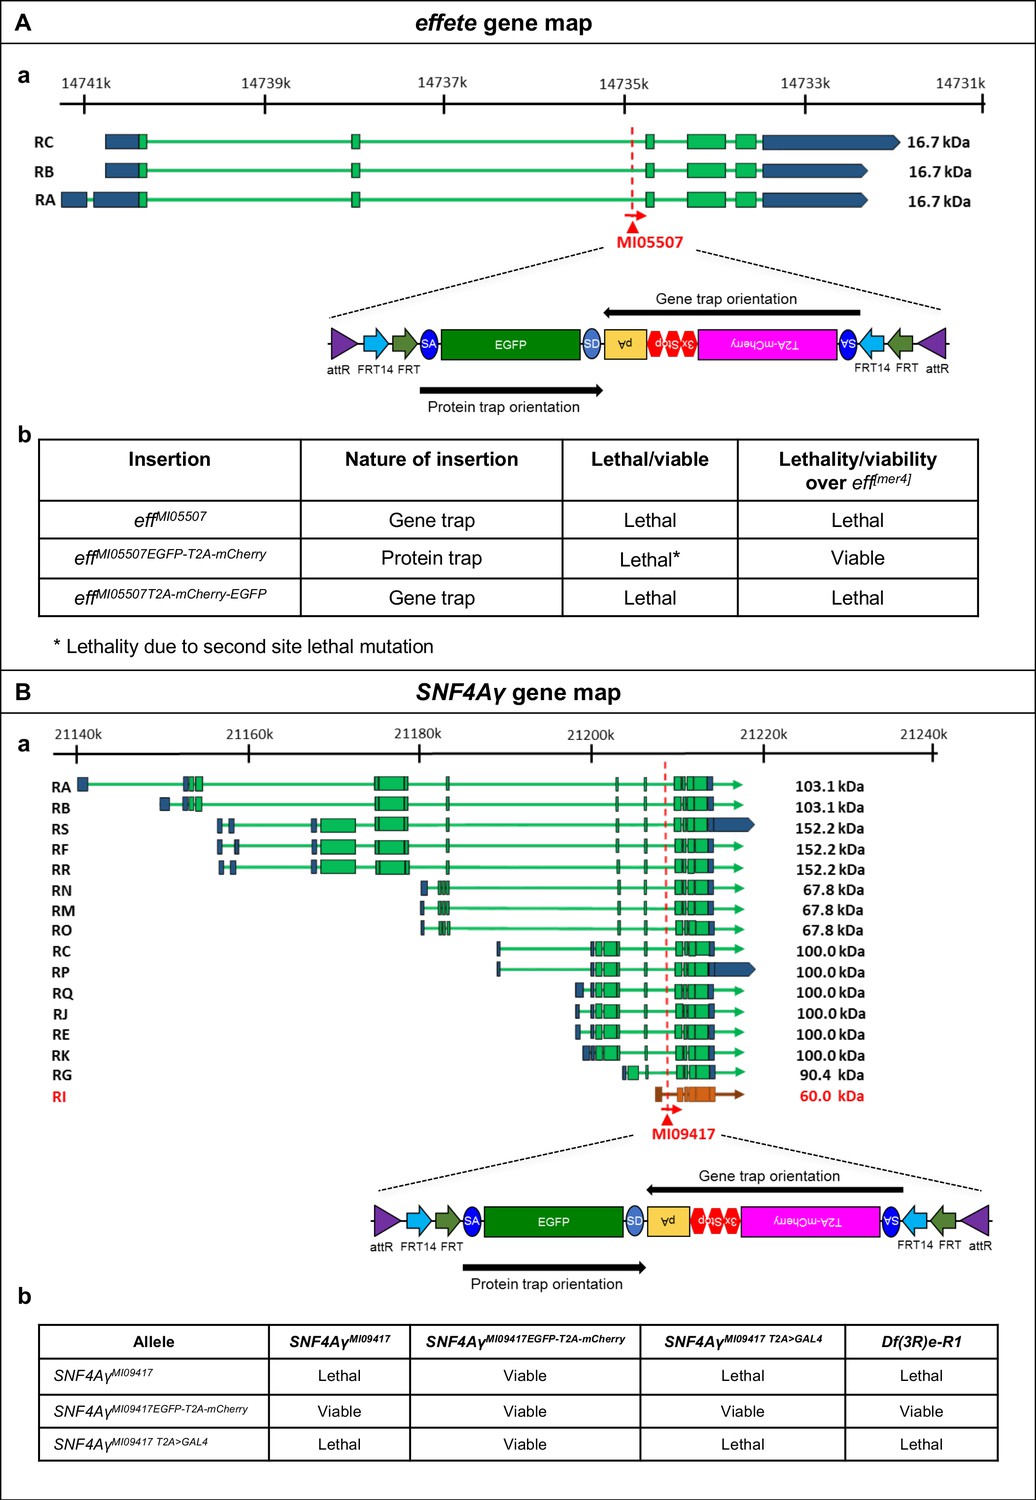
(A) (a) Gene structure of eff, showing the precise location of MiMIC insertion MI05507 (red triangle) as well as the orientation of the MiMIC cassette (red arrow) (based on FlyBase annotation release FB2017_01). The coding exons of isoforms that are tagged are shown in green, the 5’ and 3’ UTRs are shown in blue (b) Table describing the various alleles of eff used in this study, the nature of these alleles and their ability to complement a null allele eff[mer4]. (B) (a) Gene structure of SNF4Aγ showing the precise location of MiMIC insertion MI09417 (red triangle) and its orientation (red arrow) (based on FlyBase annotation release FB2017_01). The coding regions of isoforms that are tagged are shown in green, isoforms that is not tagged is shown in orange and the 5’ and 3’ UTRs are shown in blue. (b) Table displaying results of complementation tests performed between the various SNF4Aγ alleles used in this study. MiMIC gene trap insertion SNF4AγMI09417 and the T2A-GAL4 derivative –SNF4AγMI09417 T2A>GAL4 represent loss-of-function alleles of SNF4Aγ, as they fail to complement a deficiency (Df(3R)e-R1) spanning SNF4Aγ, as well as each other. The PT Flip-Flop insertion (SNF4AγMI09417-EGFP-T2A--mCherry) complements all tested loss-of-function alleles and hence produces a functional, EGFP-tagged protein.
Figure 1—figure supplement 2
Crossing schemes for FLP-mediated conditional gene inactivation.
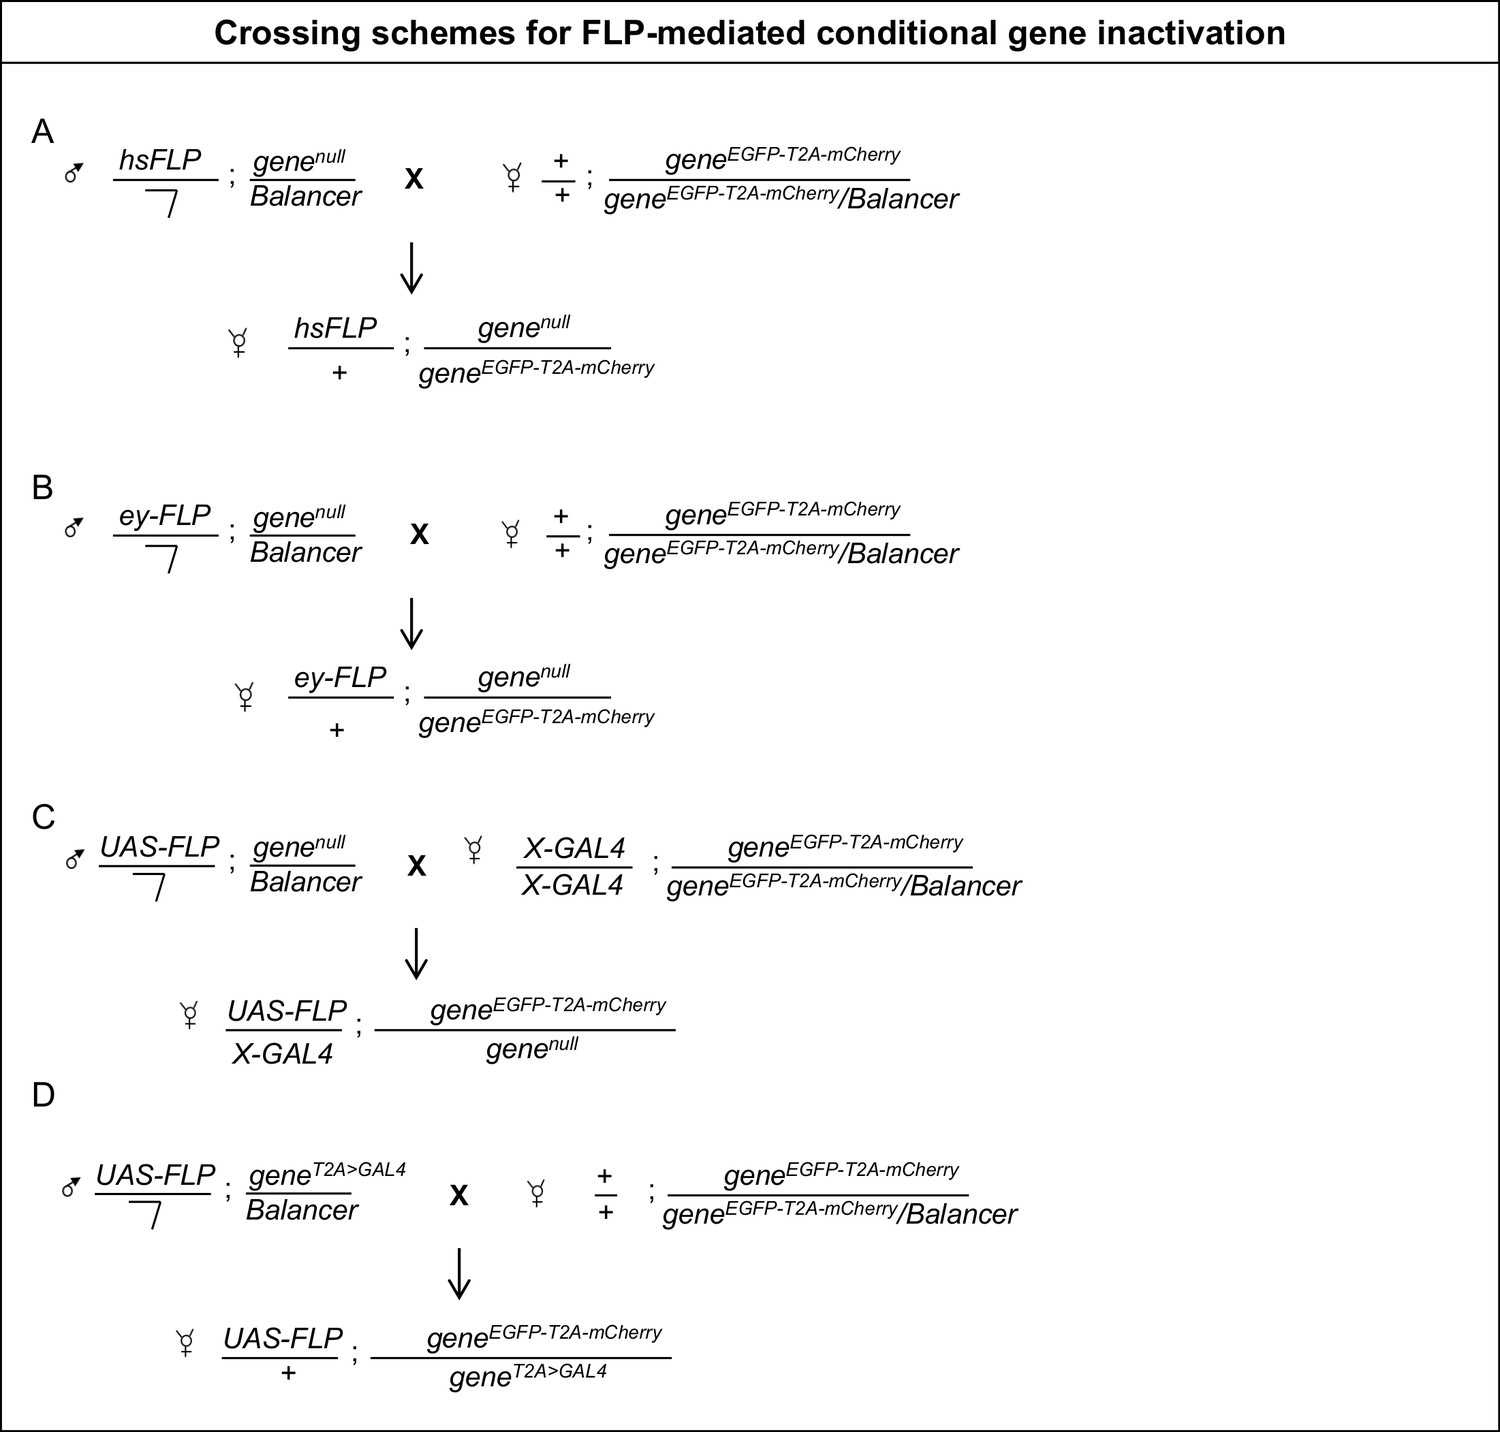
(A) Males carrying a hsFLP transgene and a null allele of the gene of interest are crossed to females carrying a Flip-Flop PT insertion in the same gene. The progeny is heat shocked to induce FLP expression and initiate Flip-Flop cassette inversion, generating mosaics (as described in Materials and methods) and the desired genotypes are analysed. (B) A similar scheme for inducing conditional gene inactivation in developing eyes, using ey-FLP. (C) Crossing scheme for conditional gene inactivation combining the Flip-Flop cassette with FLP expressed using the GAL4/UAS binary system. (D) Crossing scheme for Flip-Flop-mediated conditional gene inactivation using a T2A-GAL4 driver, inserted in the gene of interest. The T2A-GAL4 insertion creates a loss-of-function allele and simultaneously induces GAL4 expression according to the spatial and temporal pattern of the gene of interest. Hence, the T2A-GAL4-induced FLP expression will promote cassette inversion in all the cells that express the gene under study.
Figure 1—figure supplement 3
Inversion of the Flip-Flop PT insertion in Cdep using ey-FLP.
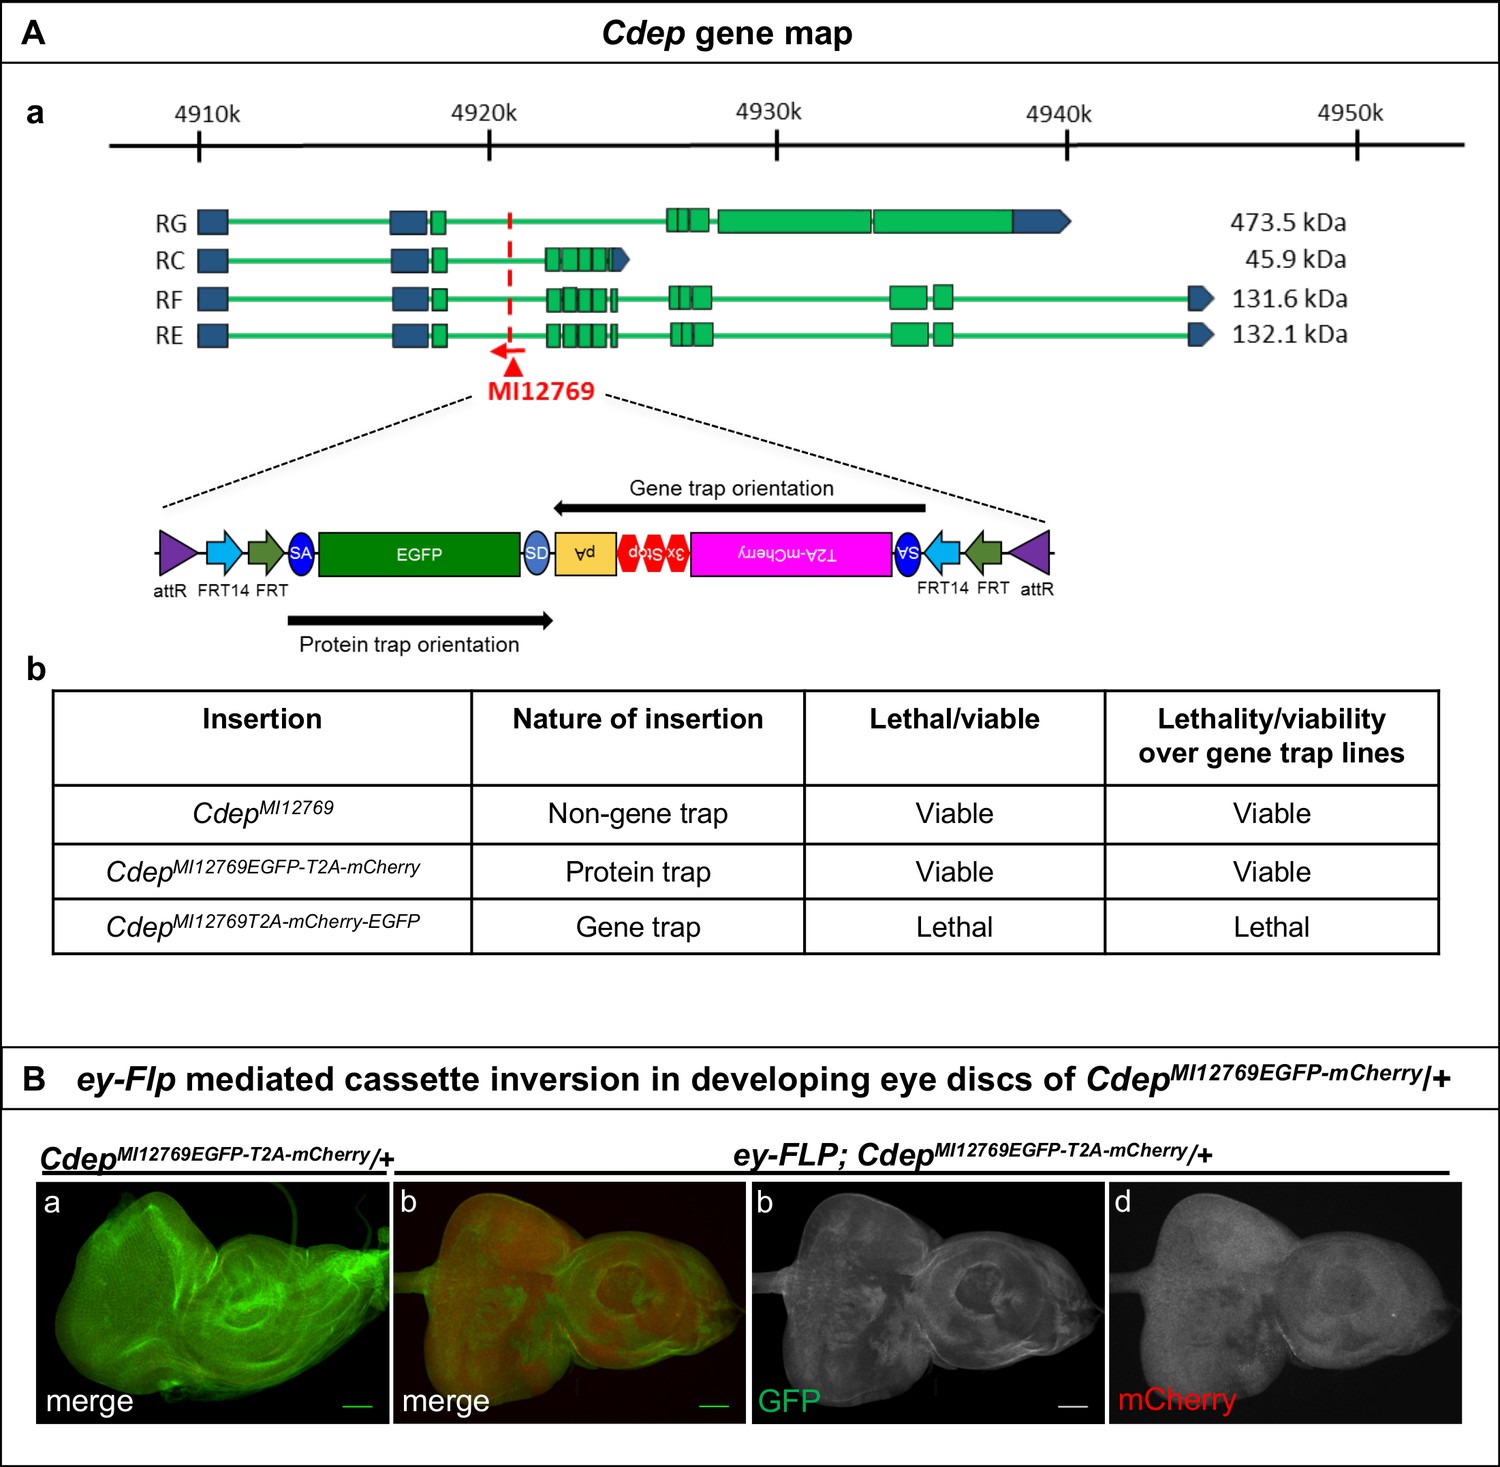
(A) Gene structure of Cdep, showing the precise location of MiMIC insertion MI12769 (red triangle) as well as the orientation of the MiMIC cassette (red arrow) (based on FlyBase annotation release FB2017_01). The coding regions of isoforms that are tagged by the MiMIC are shown in green and the 5’ and 3’ UTRs are shown in blue. (b) A table describing the various Cdep alleles used in this study, nature of the insertions and the ability of alleles to complement a gene trap alleles of Cdep. (B) (a) Eye-antennal discs from CdepMI12769EGFP-T2A-mCherry/+ larvae expressing Cdep-EGFP-Cdep (b) Eye-antennal discs from ey-FLP; CdepMI12769EGFP-T2A-mCherry/+ show patches of mCherry expressing cells, in which cassette inversion occurred. (c and d) Images displaying the individual GFP (c) and mCherry (d) channels of the eye-antennal disc shown in (b). Scale bar = 50 µm.
Figure 1—figure supplement 4
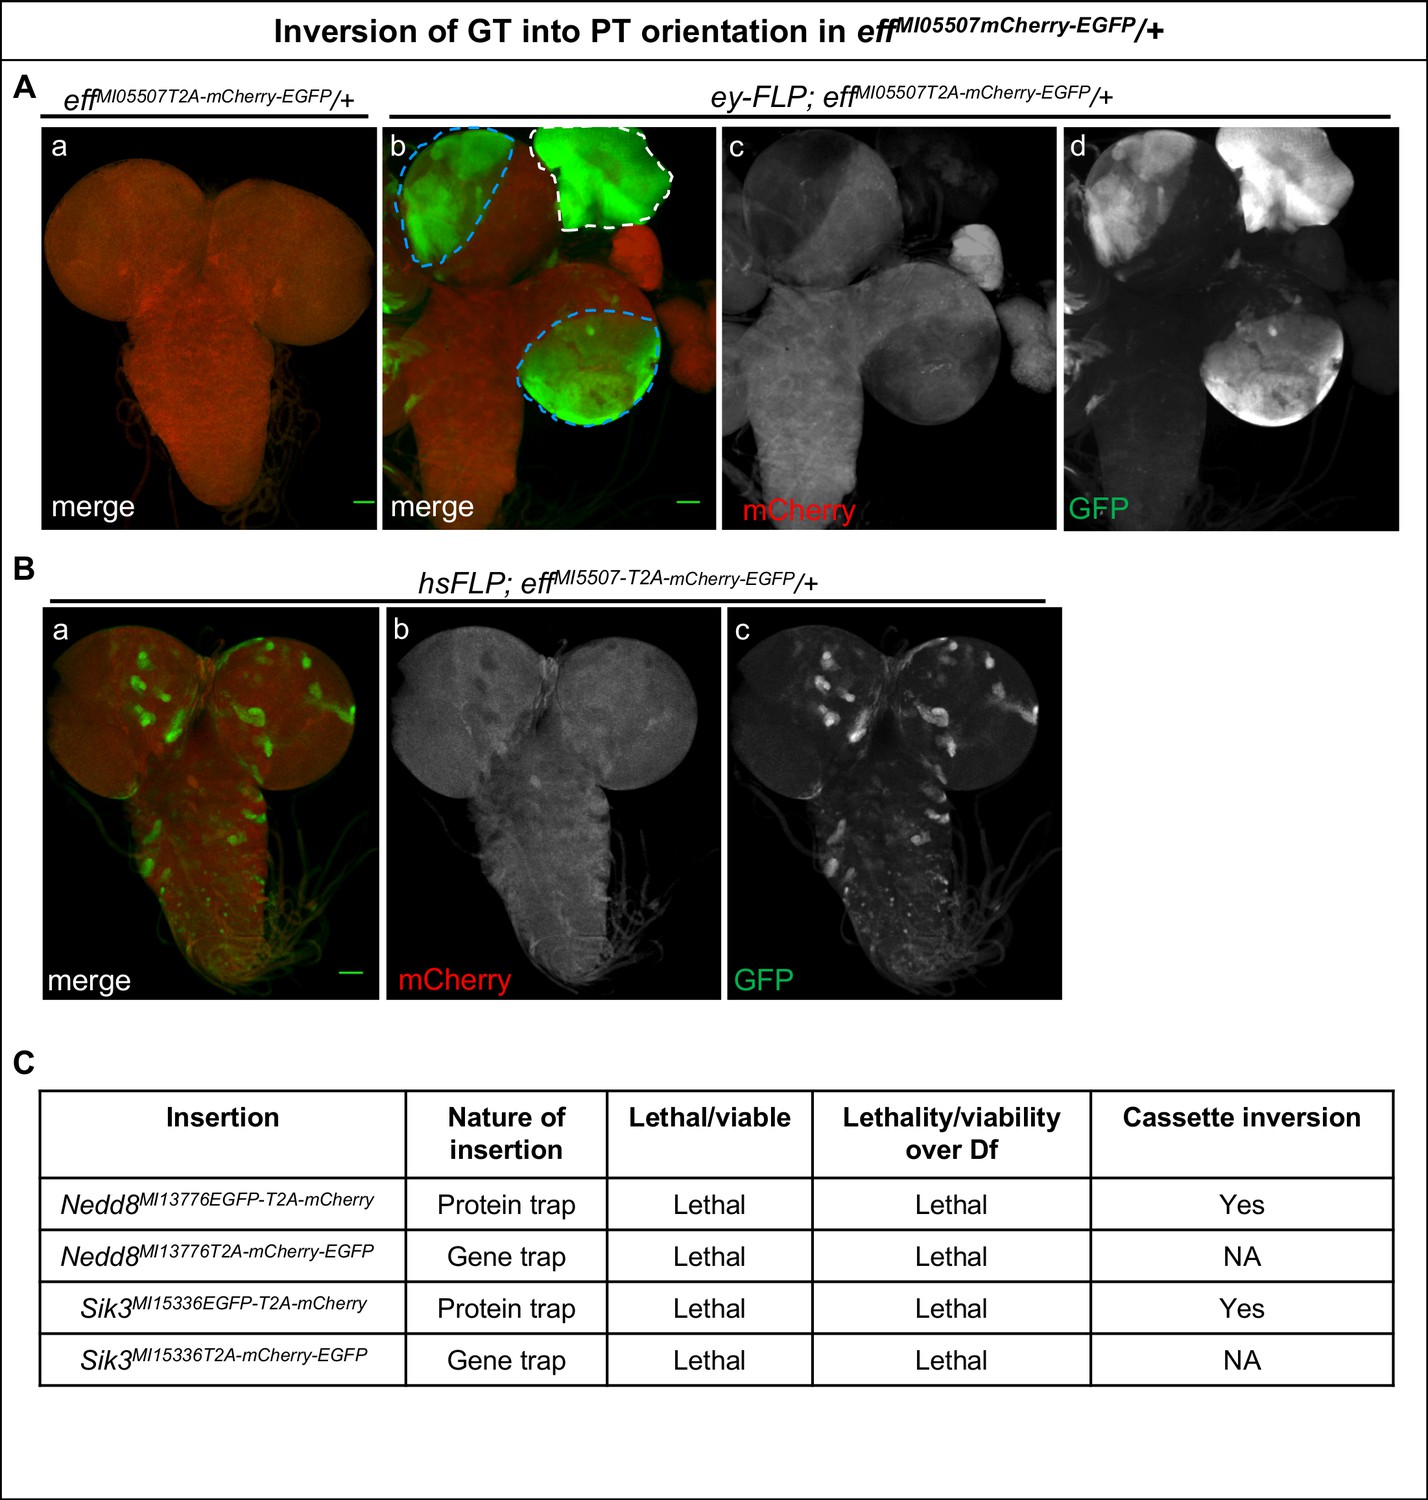
Inversion of GT-oriented Flip-Flop insertions.
(A–B) Third instar larval brains from heterozygous animals carrying the effMI05507-T2A-mCherry-EGFP GT-oriented insertion stained for mCherry (red) and GFP (green). (A) (a) Image of a third instar larval effMI05507-T2A-mCherry-EGFP /+ brain (b) ey-FLP-mediated cassette inversion leads to EGFP expression in nearly all eyeless–expressing cells in the eye disc (white dotted line) and the third instar larval brain (blue dotted line). (c and d) Images displaying the individual GFP (c) and mCherry (d) channels of the larval brain shown in (b), scale bar = 50 µm. (B) Heat-shock-mediated FLP-expression induces cassette inversion and Eff-EGFP-Eff expression (green, a and c) in random subsets of cells in the third instar larval brain of effMI05507-T2A-mCherry-EGFP /+ animals, scale bar = 50 µm. (C) Table showing non-functional PT, and GT insertions in Nedd8 and Sik3 generated in this study. These alleles fail to complement the tested deficiencies. This indicates that the EGFP tag in these genes disrupts the proper functioning or the expression of these genes. Nevertheless, these PT insertions could be flipped efficiently using ey-FLP and hsFLP (data not shown).
Figure 1—figure supplement 5
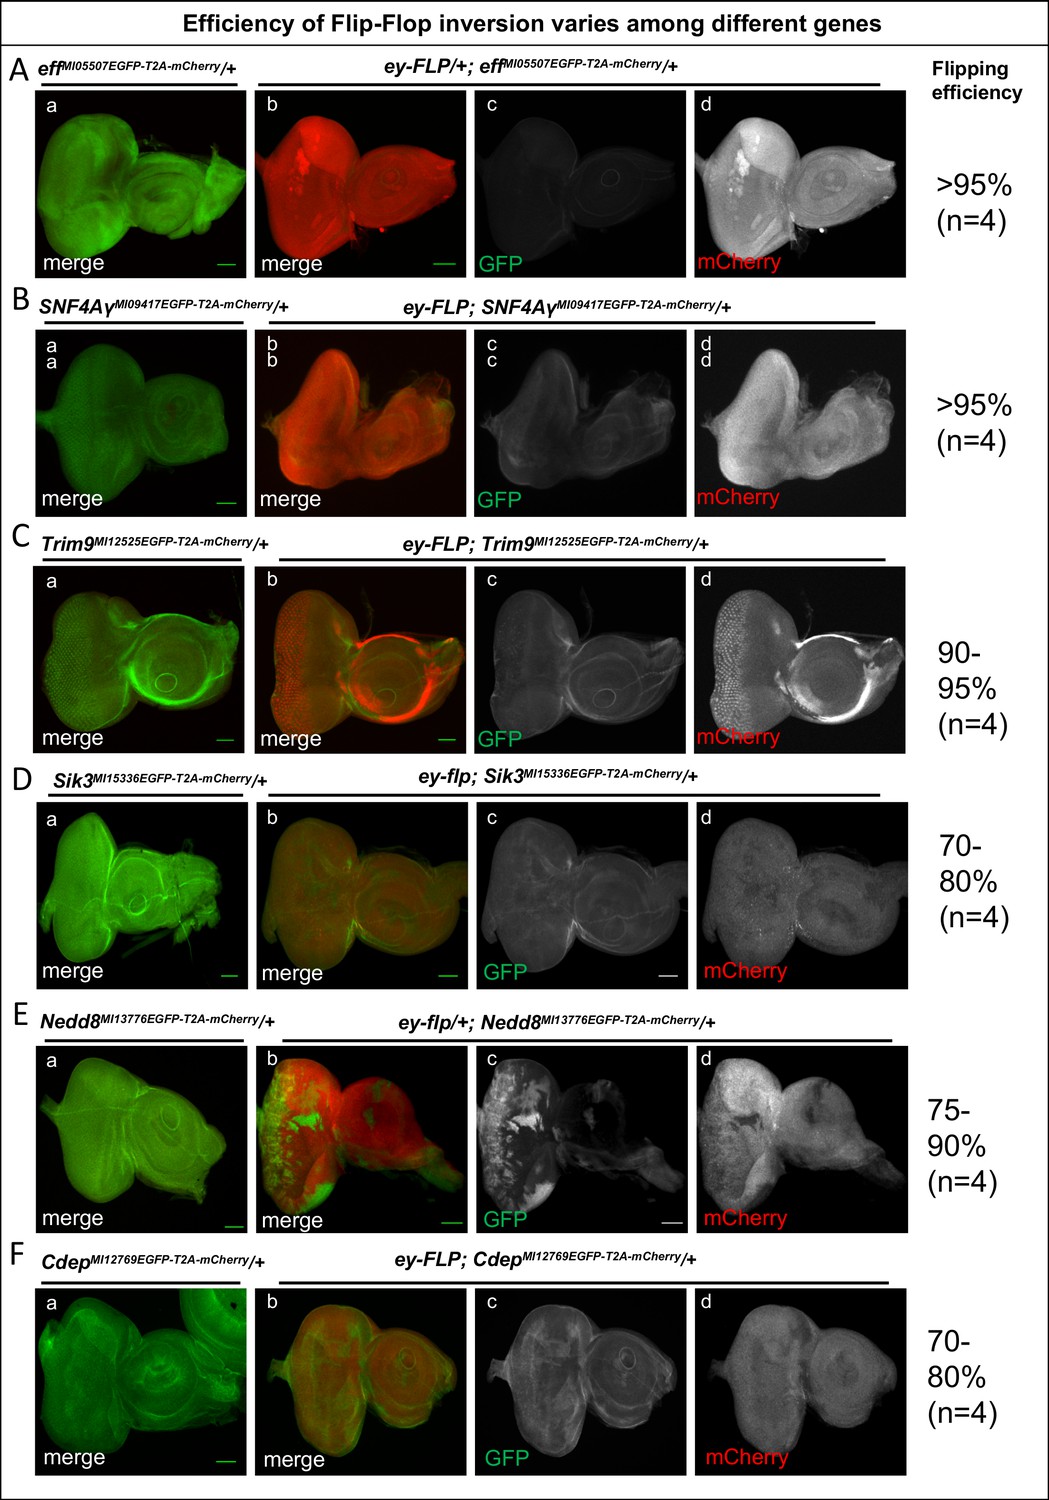
The efficiency of Flip-Flop insertions.
Eye-antennal discs from effMI5507EGFP-T2A-mCherry/+ (A), SNF4AγMI09417EGFP-T2A-mCherry/+ (B), Trim9MI12525EGFP-T2A-mCherry/+ (C), Sik3MI15336EGFP-T2A-mCherry/+ (D), Nedd8MI13778EGFP-T2A-mCherry/+ (E), and CdepMI12769EGFP-T2A-mCherry/+ (F) stained for EGFP (green), marking the tagged protein and for mCherry (red), marking mutant cells. (a) Eye-antennal discs from animals containing PT-oriented Flip-Flop insertions in the respective genes, revealing the expression pattern of the gene of interest. (b) ey-FLP-mediated cassette inversion for the respective genes, showing mosaic expression of mCherry upon inversion of the Flip-Flop cassette. (c and d) Images displaying the individual GFP (c) and mCherry (d) channels of the eye-antennal discs shown in (b) for each gene. The efficiency of cassette inversion for each gene is shown on right side. Scale bar = 50 µm.
Figure 2 with 1 supplement

Inactivation of Trim9 in post-mitotic cells using nSyb-GAL4/UAS-FLP.
(A) A third instar larval brain of nSyb-GAL4/+; Trim9MI12525EGFP-T2A-mCherry/Trim9Df, raised at 29°C stained for EGFP (green, a, d and f), mCherry (red, b, d and g) and Elav (blue, c, d and h). In the absence of UAS-FLP, only GFP signal is detected, reflecting the Trim9-EGFP-Trim9 expression pattern. In contrast, mCherry is not expressed. (b, d and g). Magnification of the region indicated by a white square in panel d (e–h). Third instar larval brains of UAS-FLP/nSyb-GAL4; Trim9MI12525EGFP-T2A-mCherry/Trim9Df, expressing FLP under the control of nSyb-GAL4 show cassette inversion that leads to the loss of EGFP and gain of mCherry expression in neurons (a’–h’). Magnification of the region indicated by a white square in panel (d’) shows the existence of three populations of neurons (e’–h’): neurons that express mCherry and have completely lost GFP expression (1), neurons that have not undergone cassette inversion and thus still express GFP but lack mCherry expression (2) and neurons that express both tags, suggesting they have recently undergone cassette flip (as indicated by mCherry expression), and still contain some remaining Trim9-EGFP-Trim9 protein that perdures following the cassette flip, scale bar = 50 µm (a, b, c, d, a’, b’, c’ and d’), scale bar = 5 µm (e, f, g, h, e’, f’, g’ and h’). (B) Adult brain of tubP-GAL80ts; Trim9MI12525EGFP-T2A-mCherry/Trim9Df; UAS-FLP/nSyb-GAL4 animals stained for EGFP (green), mCherry (red) and Elav (blue). The temperature-sensitive GAL80 (GAL80ts), expressed under a tubulin promoter (tubP) was used to prevent nSyb-GAL4 from driving expression of UAS-FLP during development. (a–d) Adult brain of tubP-GAL80ts; Trim9MI12525EGFP-T2A-mCherry/Trim9Df; UAS-FLP/nSyb-GAL4 control animals, raised at 18°C display Trim9-EGFP-Trim9 (green, a and d) and do not show any mCherry expression (red, b and d). (a’–d’) Adult brains of tubP-GAL80ts; Trim9MI12525EGFP-T2A-mCherry/Trim9Df; UAS-FLP/nSyb-GAL4 animals, raised at 18°C until 4 days after eclosion, and then shifted to 29°C to induce FLP-expression, show mCherry-expressing neuronal cells in which the cassette inversion has taken place (red, b’ and d’), scale bar = 50 µm.
Figure 2—figure supplement 1
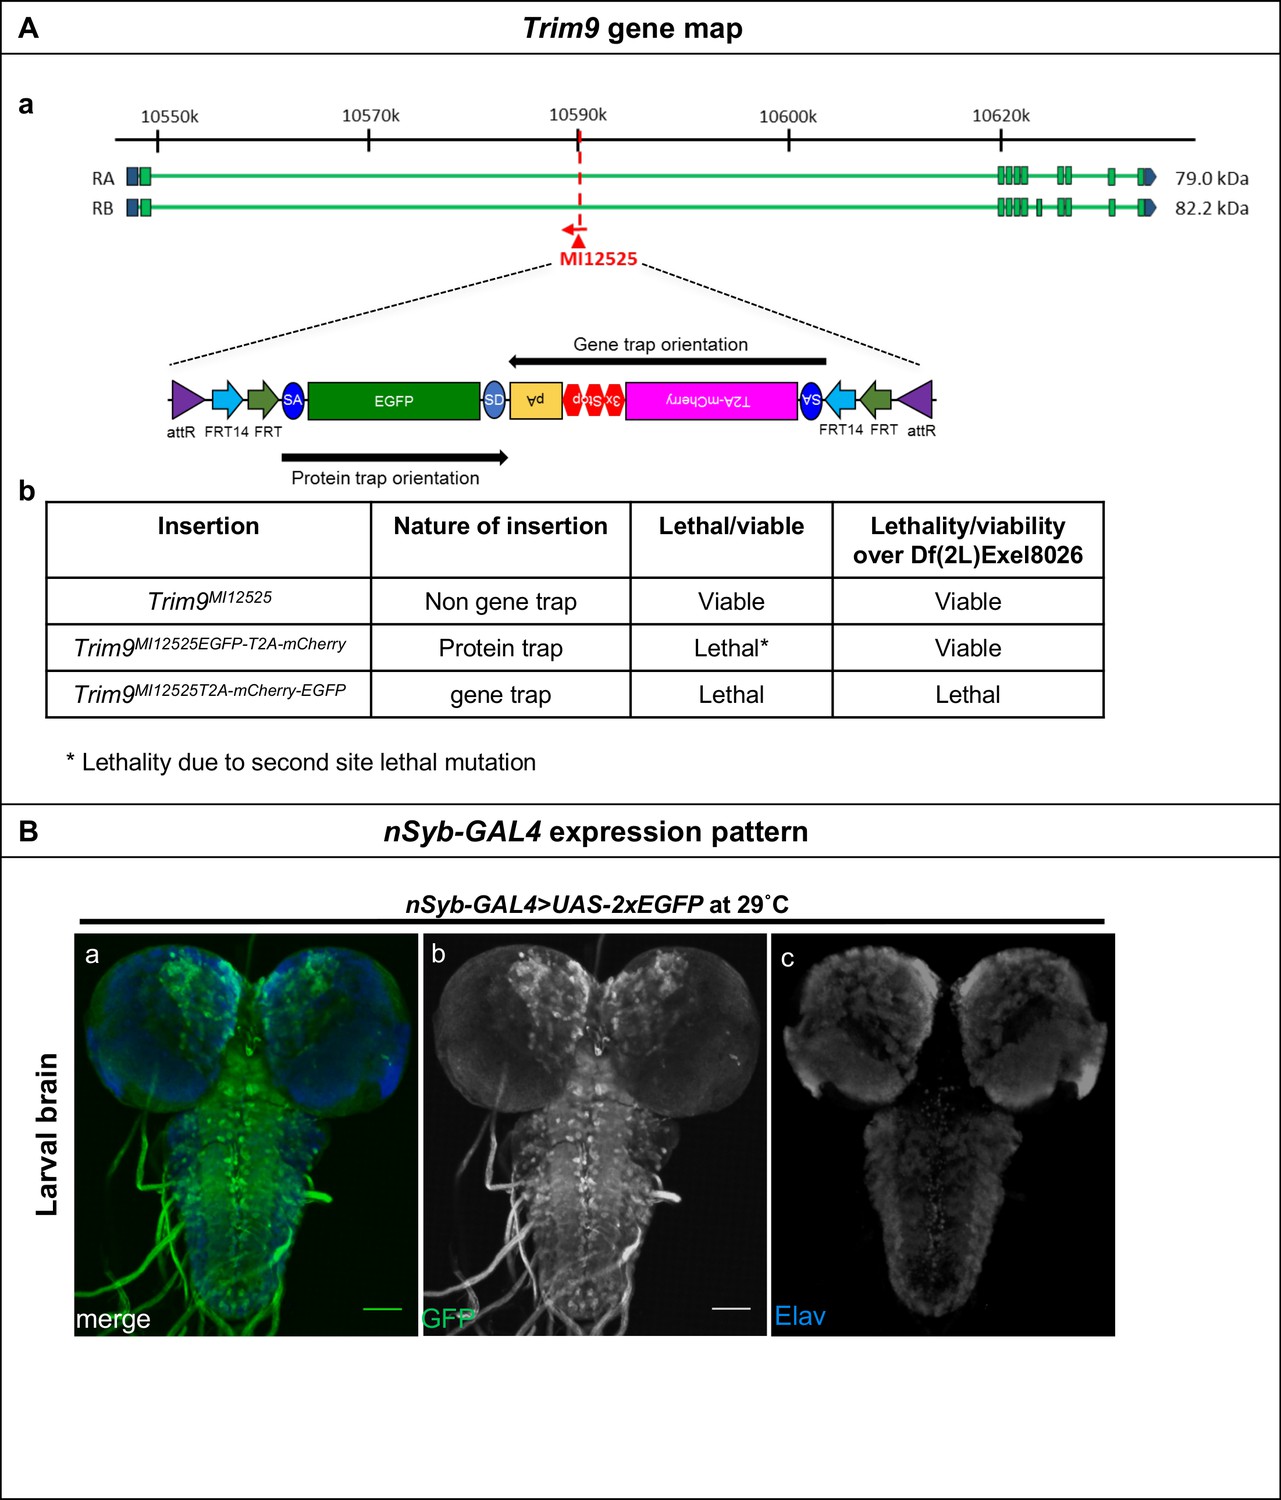
Inactivation of Trim9 in post-mitotic cells through induction of FLP using nSyb-GAL4/UAS-FLP.
(A) (a) Gene structure of Trim9, showing the precise location of MiMIC insertion MI12525 (red triangle) as well as the orientation of the MiMIC cassette (red arrow) (based on FlyBase annotation release FB2017_01). The coding regions of isoforms that are tagged are shown in green and the 5’ and 3’ UTRs are shown in blue. (b) A table describing the various Trim9 alleles used in this study, nature of the insertions, and the ability of these alleles to complement a deficiency spanning Trim9. Though the PT-oriented Flip-Flop insertion in Trim9MI12525EGFP-T2A-mCherry is homozygous lethal, Trim9MI12525EGFP-T2A-mCherry/Trim9Df animals are viable, indicating the presence of a second-site, lethal mutation elsewhere on the Trim9MI12525EGFP-T2A--mCherry chromosome. (B) A third instar larval brain of nSyb-GAL4 > UAS-2X-EGFP animals, stained for GFP (green, a and b), and neurons marked by the expression of Elav (blue, c) revealing the nSyb-GAL4 expression pattern in a developing larval brain. Scale bar = 50 µm.
Figure 3
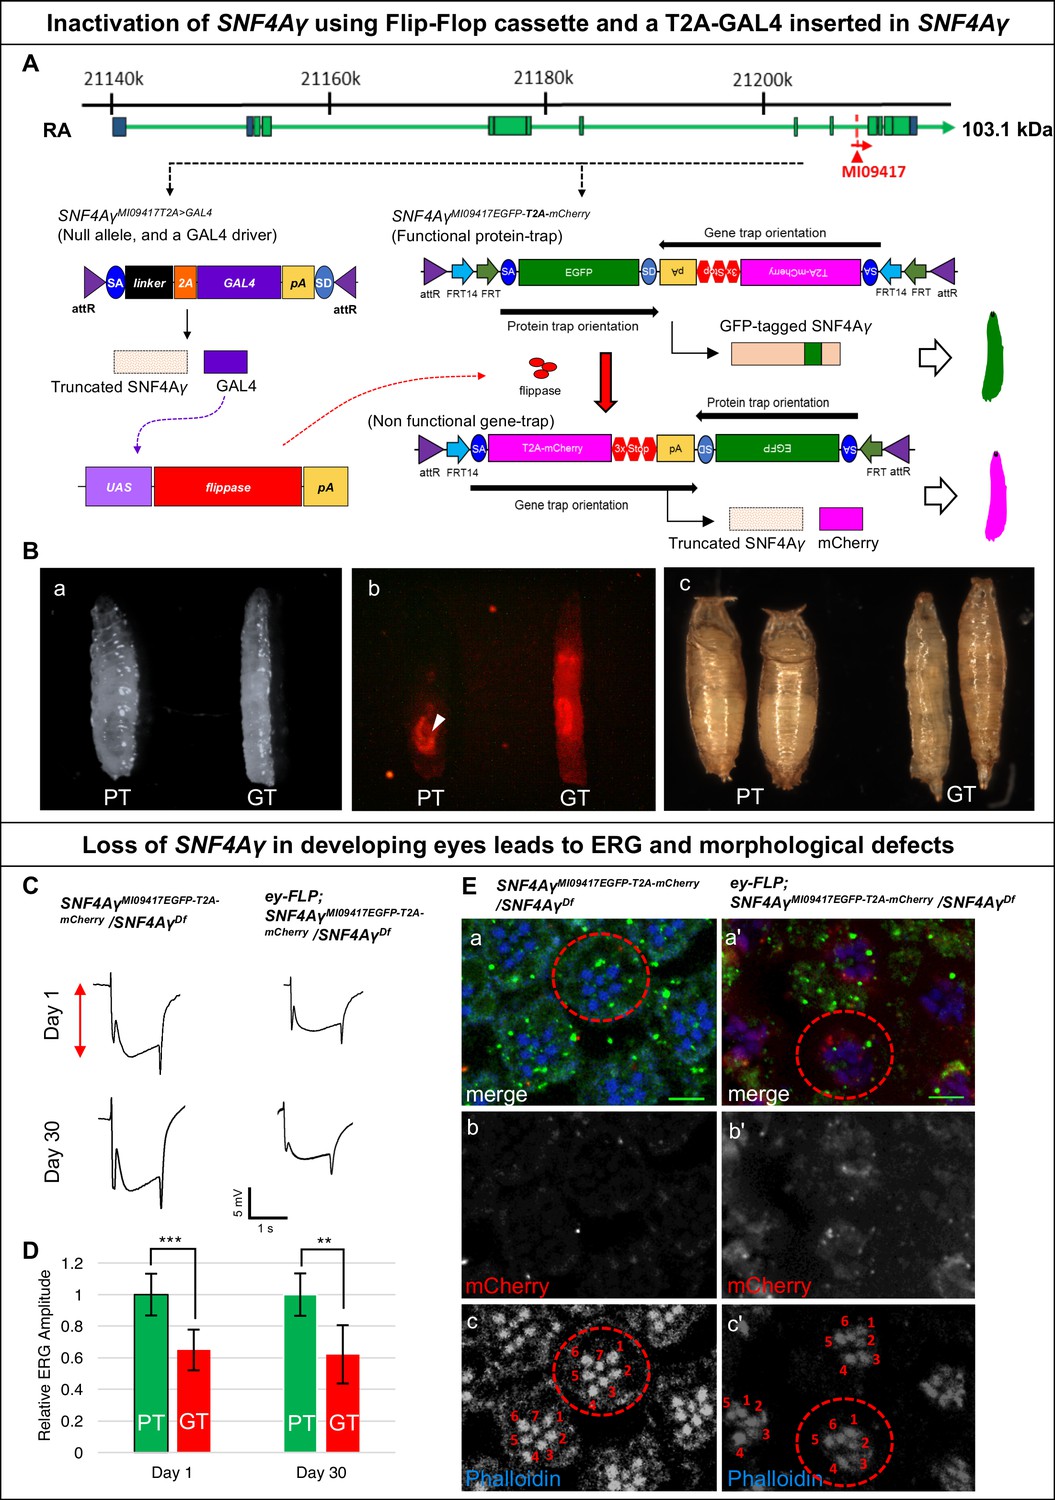
Developmental and neuronal functions of SNF4Aγ revealed through broad or tissue-specific inactivation.
(A) Gene structure of SNF4Aγ, displaying one of the transcriptional isoforms and the precise location of MiMIC insertion MI09417 (red triangle) as well as the orientation of the MiMIC cassette (red arrow). The structure of the T2A-GAL4 insertion (SNF4AγMI094177T2>GALl4) and the PT oriented Flip-Flop insertion (SNF4AγMI09417EGFP-T2A-mCherry) are shown below. (B) (a) Control third instar larva (SNF4AγMI09417EGFP-T2A-mCherry/SNF4AγMI09417 T2A>-GALl4; PT) and third instar larva in which SNF4Aγ is inactivated through cassette flip, driven by the T2A-GAL4 insertion in SNF4Aγ on the other chromosome (UAS-FLP;; SNF4AγMI094177EGFP-T2A-mCherry/SNF4AγMI09417T2A>GAL4; GT) (b) Expression of mCherry in larvae shown in (a). Arrowhead indicates auto-fluorescence of gut tissue in control animals (SNF4AγMI04147EGFP-T2A-mCherry/SNF4AγMI09417T2A-GAL4; PT), which differs from the mCherry signal in animals that underwent cassette flip (UAS-FLP;;SNF4AγMI09147EGFP-T2A-mCherry/SNF4AγMI09147 T2A>GAL4, GT). (c) Pupae of control (PT) and experiment genotypes (GT). Loss of SNF4Aγ leads to premature pupariation and death. (C) ey-FLP-mediated cassette inversion in developing eyes leads to electroretinogram (ERG) defects. (Left) ERG trace obtained from control animals (SNF4AγMI09417EGFP-T2A-mCherry/SNF4AγDf) on day 1 and day 30. (Right) ERG trace obtained from experimental animals (ey-FLP; SNF4AγMI09417EGFP-T2A-mCherry/SNF4AγDf) in which ey-FLP-mediated cassette inversion induced loss of SNF4Aγ in >95% of the developing eye (see also Figure 1—figure supplement 5B). (D) Histogram showing relative ERG amplitude (indicated by the red double-headed arrow in (C)), measured on days 1 and 30 of control animals (PT/green) and experimental animals with ey-FLP-mediated SNF4Aγ inactivation (GT/red). (At least eight animals of each genotype were analysed. *** indicates a p-value<0.001 and ** indicates a p-value<0.01 obtained by performing a student T-test). (E) Image displaying adult eyes of control (SNF4AγMI09417EGFP-T2A-mCherry/SNF4AγDf, a–c) and experimental (ey-FLP; SNF4AγMI09417EGFP-T2A-mCherry/SNF4AγDf, a’–c’) animals stained with phalloidin (blue) marking the seven visible photoreceptors arranged within each ommatidium (red dotted circle), SNF4Aγ-EGFP-SNF4Aγ expression (green) and mCherry expression (red). (b, b’, c and c’) mCherry channel (b, b’) and phalloidin staining (c, c’) of the image shown in (a and a’). (a’) eyFLP-driven loss of SNF4Aγ induces mCherry expression (b’) and leads to defects in photoreceptor arrangement and loss of individual rhabdomeres in ommatidia (red dotted circle) (c’ indicated by numbers), whereas control ommatidia consistently contain seven visible rhabdomeres (c), scale bar = 5 µm.
Figure 4 with 1 supplement
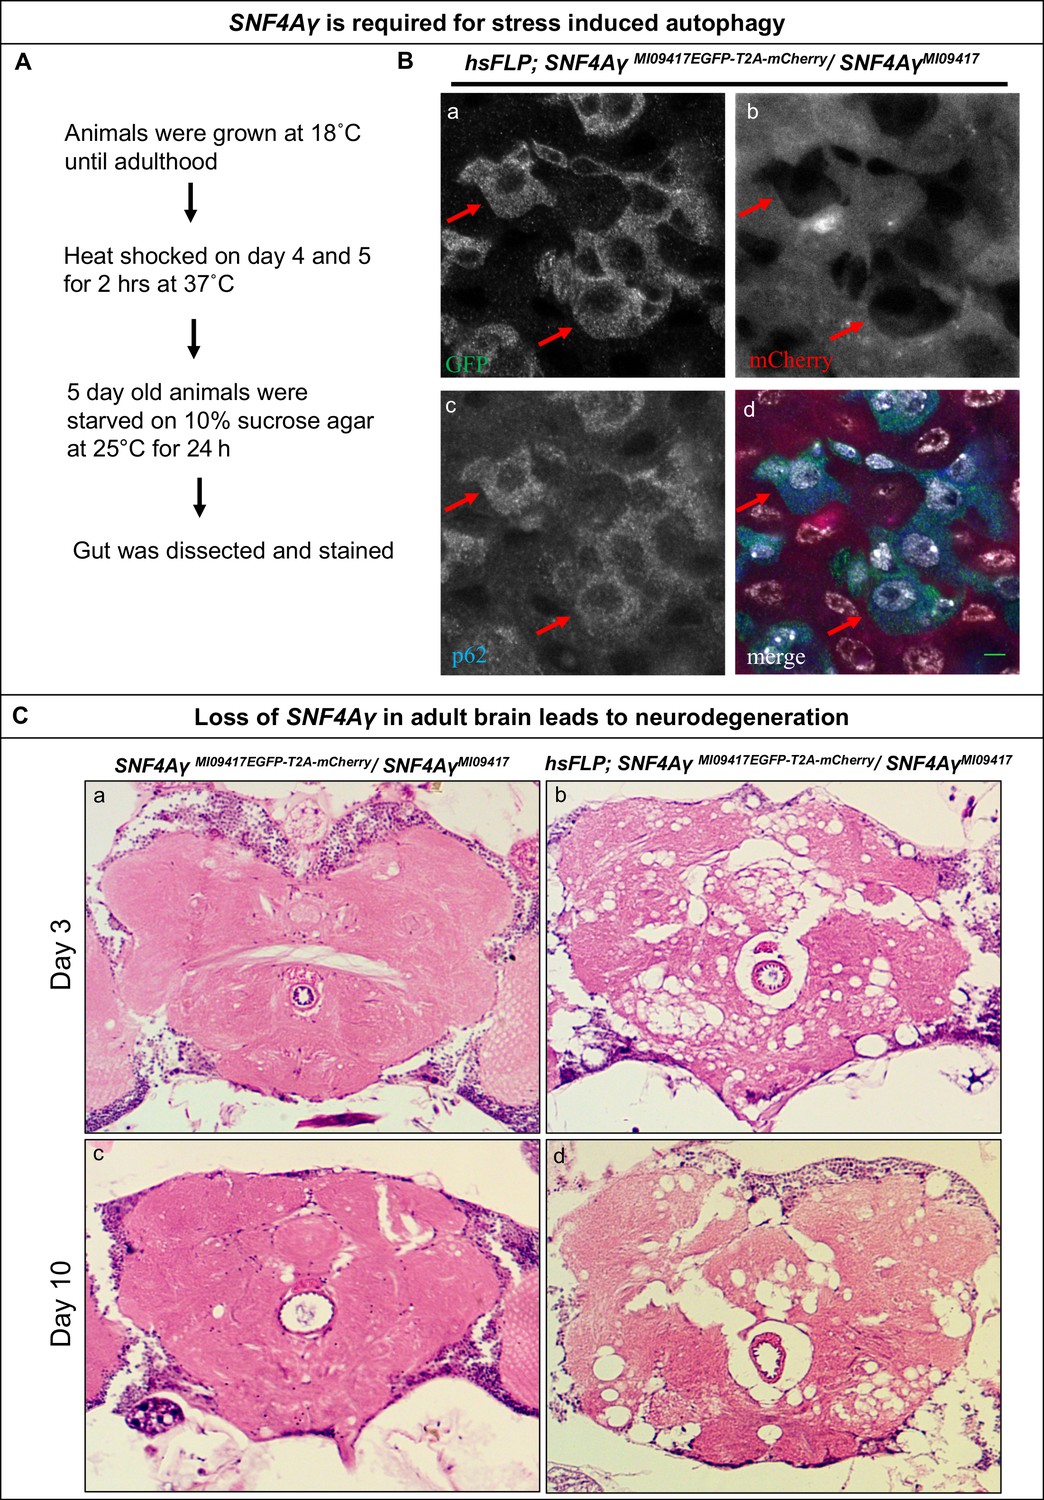
Loss of SNF4Aγ in adults flies leads to autophagic and neurodegenerative phenotypes.
(A) Flow chart describing the experimental outline to induce autophagy in the adult gut (B) Image displaying the adult midgut from amino acid-starved hsFLP; SNF4AγMI09417EGFP-T2A-mCherry/ SNF4AγMI09417 animals, stained for GFP (a, d), mCherry (b, d), p62 (c, d) and DAPI (white) (d). Red arrows indicate control cells expressing SNF4Aγ-EGFP-SNF4Aγ, revealing higher levels of p62. In contrast, mutant cells are mCherry positive and have reduced p62 levels, indicating a defect in autophagy induction, scale bar = 5 µm (C) Haemotoxylin and Eosin staining on brain sections of SNF4AγMI09417EGFP-T2A-mCherry/SNF4Aγ9417 (control) and hsFLP; SNF4AγMI09417EGFP-T2A-mCherry/ SNF4AγMI09417 experimental flies. hsFLP-induced cassette inversion in adult flies causes massive neurodegeneration, evident by the severe structural changes observed in brains of 3- and 10-day-old experimental animals (b and d), whereas age-matched control brains show no sign of neurodegeneration (a and c).
Figure 4—figure supplement 1
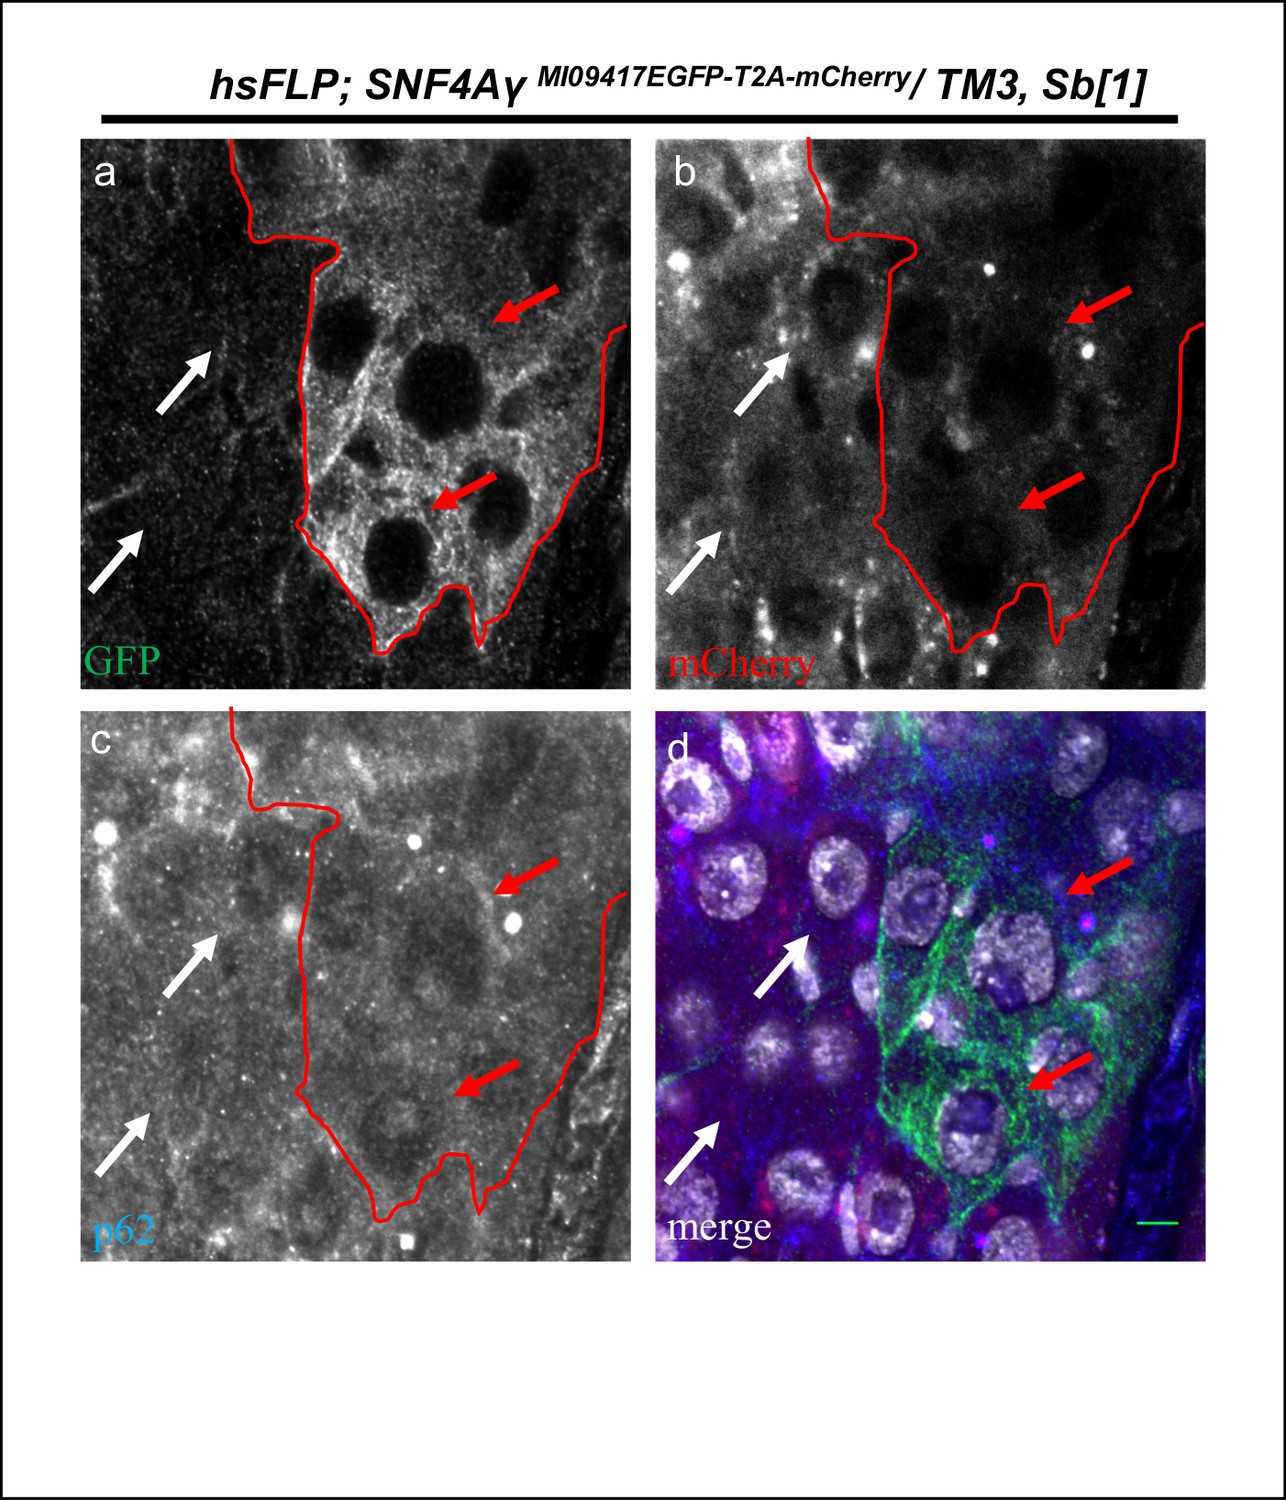
P62 expression in hsFLP; SNF4AγMI09417EGFP-T2A-mCherry/ TM3,Sb[1] animals.
Image displaying the adult mid gut from amino acid starved hsFLP; SNF4AγMI09417EGFP-T2A-mCherry/ TM3,Sb[1] animals, stained for GFP (a, d), mCherry (b, d), p62 (c, d) and DAPI (white) (d). Red arrows indicate cells expressing SNF4Aγ-EGFP-SNF4Aγ (hsFLP; SNF4AγMI09417EGFP-T2A-mCherry/ TM3,Sb[1]), and white arrows indicate mCherry-expressing cells (hsFLP; SNF4AγMI09417T2A-mCherry-EGFP/ TM3,Sb[1]). Both the populations show similar levels of p62. Scale bar = 5 µm.
Author response image 1
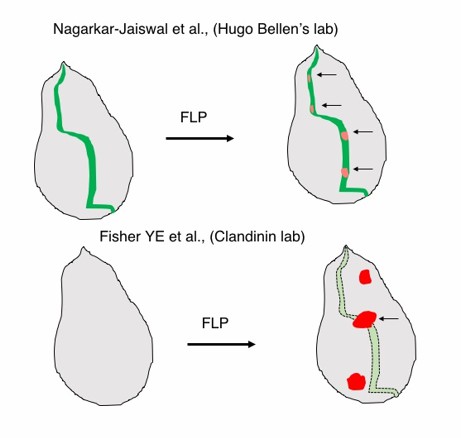
Contrast between the FLPstop and Flip-Flop technologies.
(Top) A hypothetical gene expression in a wing imaginal disc recapitulated by internally tagged EGFP expression from the Flip-Flop cassette (green). Upon flippase expression mCherry expressing mutant cells are generated within the domain of the gene’s expression. (Botton) FlpStop construct does not provide any information on the expression of the gene. Mosaics generated could lie outside the domain of the gene’s expression and therefore may not be relevant.
Download links
A two-part list of links to download the article, or parts of the article, in various formats.
Downloads (link to download the article as PDF)
Open citations (links to open the citations from this article in various online reference manager services)
Cite this article (links to download the citations from this article in formats compatible with various reference manager tools)
A cell cycle-independent, conditional gene inactivation strategy for differentially tagging wild-type and mutant cells
eLife 6:e26420.
https://doi.org/10.7554/eLife.26420


