High mTOR activity is a hallmark of reactive natural killer cells and amplifies early signaling through activating receptors
- CIRI, Centre International de Recherche en Infectiologie - International Center for Infectiology Research, France
- Inserm, U1111, France
- Ecole Normale Supérieure de Lyon, France
- Université Lyon 1, France
- UMR5308, France
- Karolinska Institutet, Karolinska University Hospital Huddinge, Sweden
- Hospices Civils de Lyon, Centre Hospitalier Lyon Sud, France
- Innate-Pharma, France
- Aix-Marseille Université, CNRS, INSERM, CIML, France
- APHM, Hôpital de la Timone, Service d’Immunologie, France
- University of Bergen, Norway
Figures
Figure 1 with 3 supplements
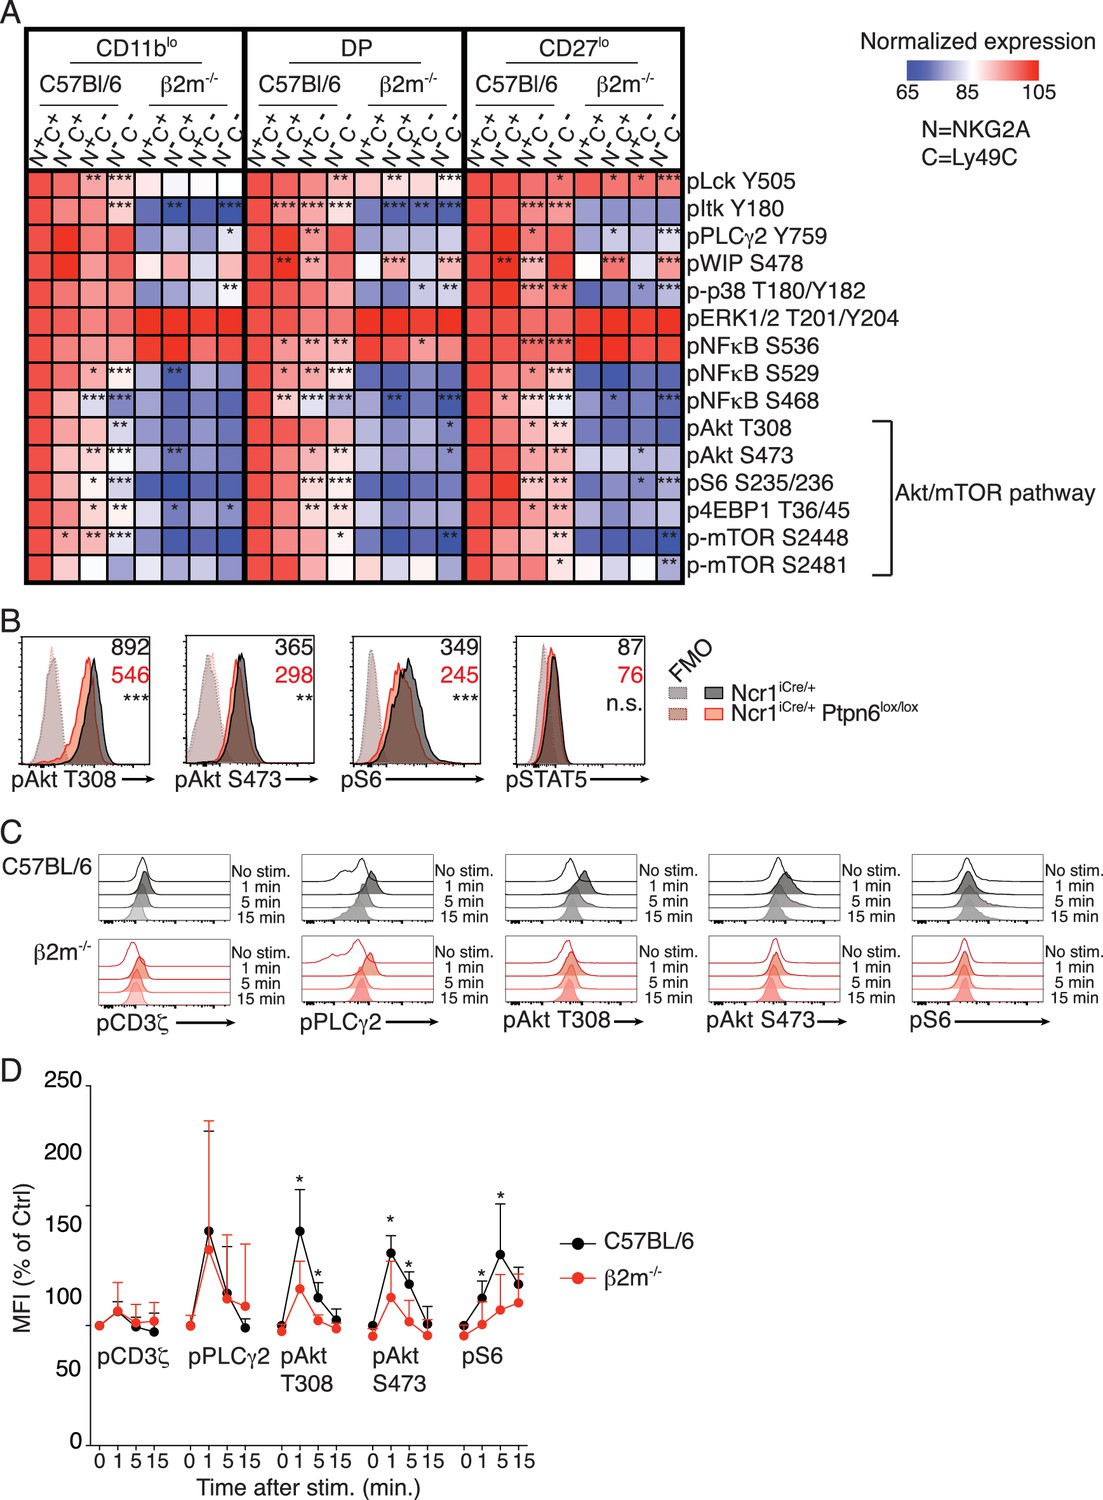
Basal activity of the mTOR pathway is proportional to the level of NK cell reactivity, and dependent on SHP1.
(A) Heatmap representing the phosphorylation level of the phosphoepitopes indicated on the right in the different subsets of splenic resting NK cells indicated on top and gated as defined in Figure 1—figure supplement 2. Mean Fluorescence Intensity was recorded for each phosphoepitope in each subset. Normalized expression was calculated using the N+C+ subset of C57BL/6 mice as reference, as described in the Materials and Methods. The mean values are shown (n = 6 mice of each genotype in three independent experiments, adjusted p-values were calculated as described in the Materials and methods and compare the N+C+ subset to the indicated subset, *p<0.05, **p<0.01, ***p<0.001). (B) Histograms representing the phosphorylation level of the indicated proteins in splenic resting NK cells from Ncr1iCre/+ or Ncr1iCre/+ Ptpn6lox/lox mice (representative of 5 mice of each genotype in three independent experiments, t-test, **p<0.01; ***p<0.001, n.s. non significant). The MFI are indicated, in black for the Ncr1iCre/+ NK cells and in red for the Ncr1iCre/+Ptpn6lox/lox NK cells. (C–D) Phosphorylation level of the indicated phospho-epitope in splenic NK cells from C57BL/6 or B2m−/− mice following NK1.1 stimulation for the indicated time. (C) Histogram overlays from one representative experiment. (D) MFI of the indicated phospho-epitope (mean +SD) of 5 mice of each genotype in five independent experiments (t-test, *p<0.05).
Figure 1—figure supplement 1
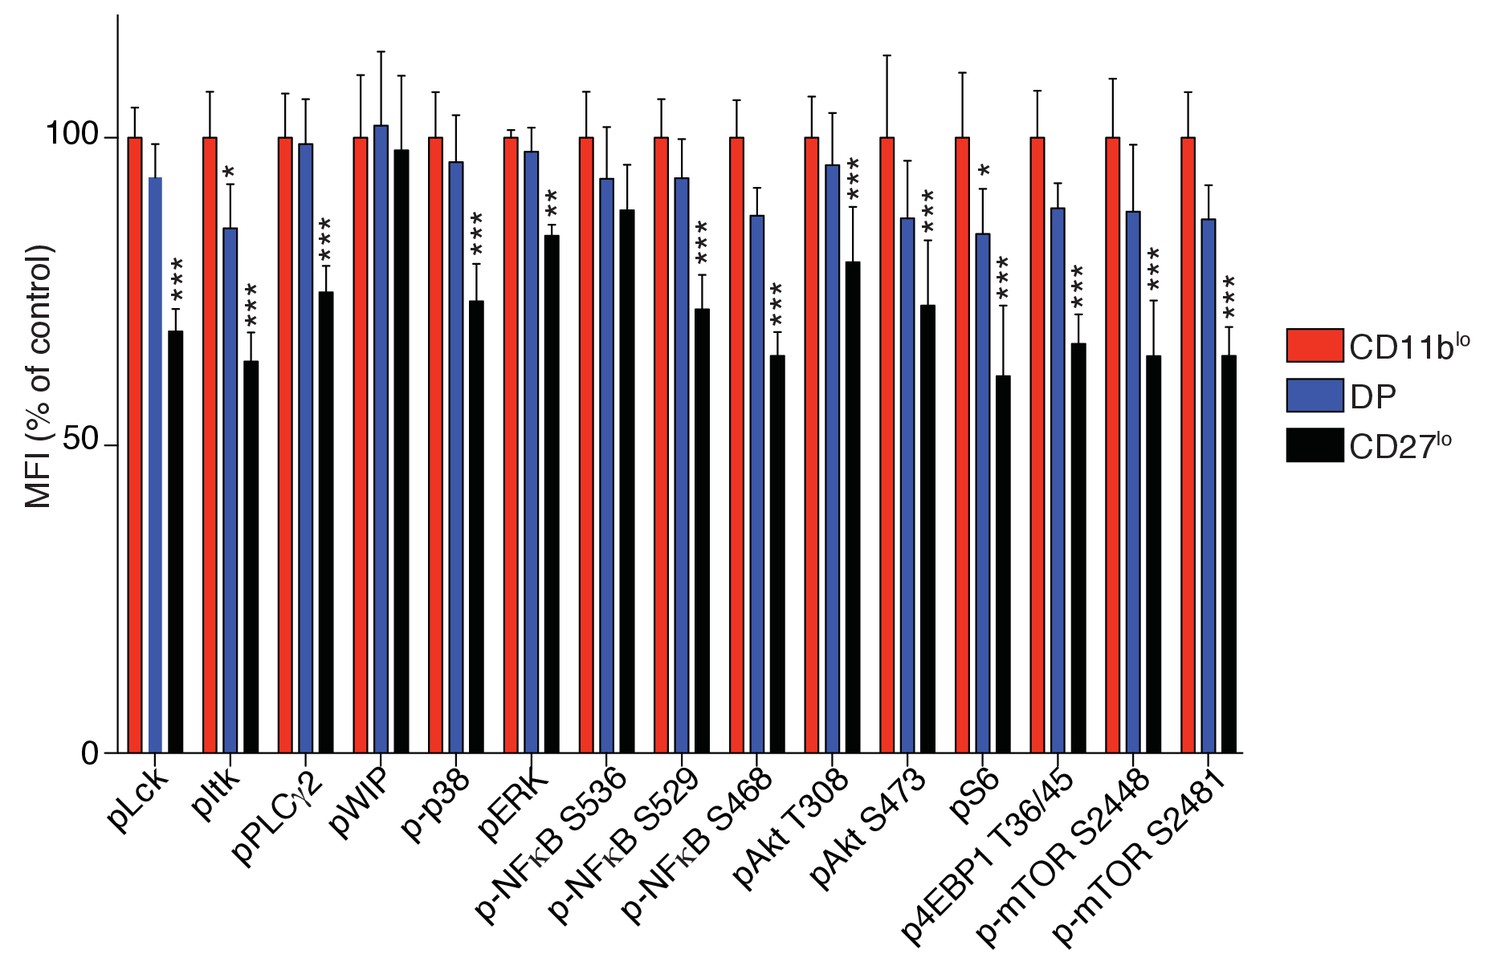
Bar graph showing the phosphorylation level of the indicated phosphoepitopes in the different subsets of splenic resting C57BL/6 NK cells defined by their expression of CD27 and CD11b.
Mean Fluorescence Intensity was recorded for each phosphoepitope in each subset. Normalized expression was calculated using the CD27+CD11blo subset of C57BL/6 mice as reference (n = 6 mice in three independent experiments, two-way ANOVA comparing the indicated subset with the CD11blo subset, *p<0.05, **p<0.01, ***p<0.001).
Figure 1—figure supplement 2

Flow cytometry density plots presenting the analysis strategy to compare educated versus uneducated NK cells in C57BL/6 mice and the phenotypically equivalent subsets in B2m−/− mice.
Expression of the surface markers CD11b and CD27 by CD3-CD19-NK1.1+ splenocytes defines three maturation subsets (CD11blo, DP and CD27lo), each of these subsets is further divided into four subsets according to the expression of the inhibitory receptors NKG2A and Ly49C.
Figure 1—figure supplement 3
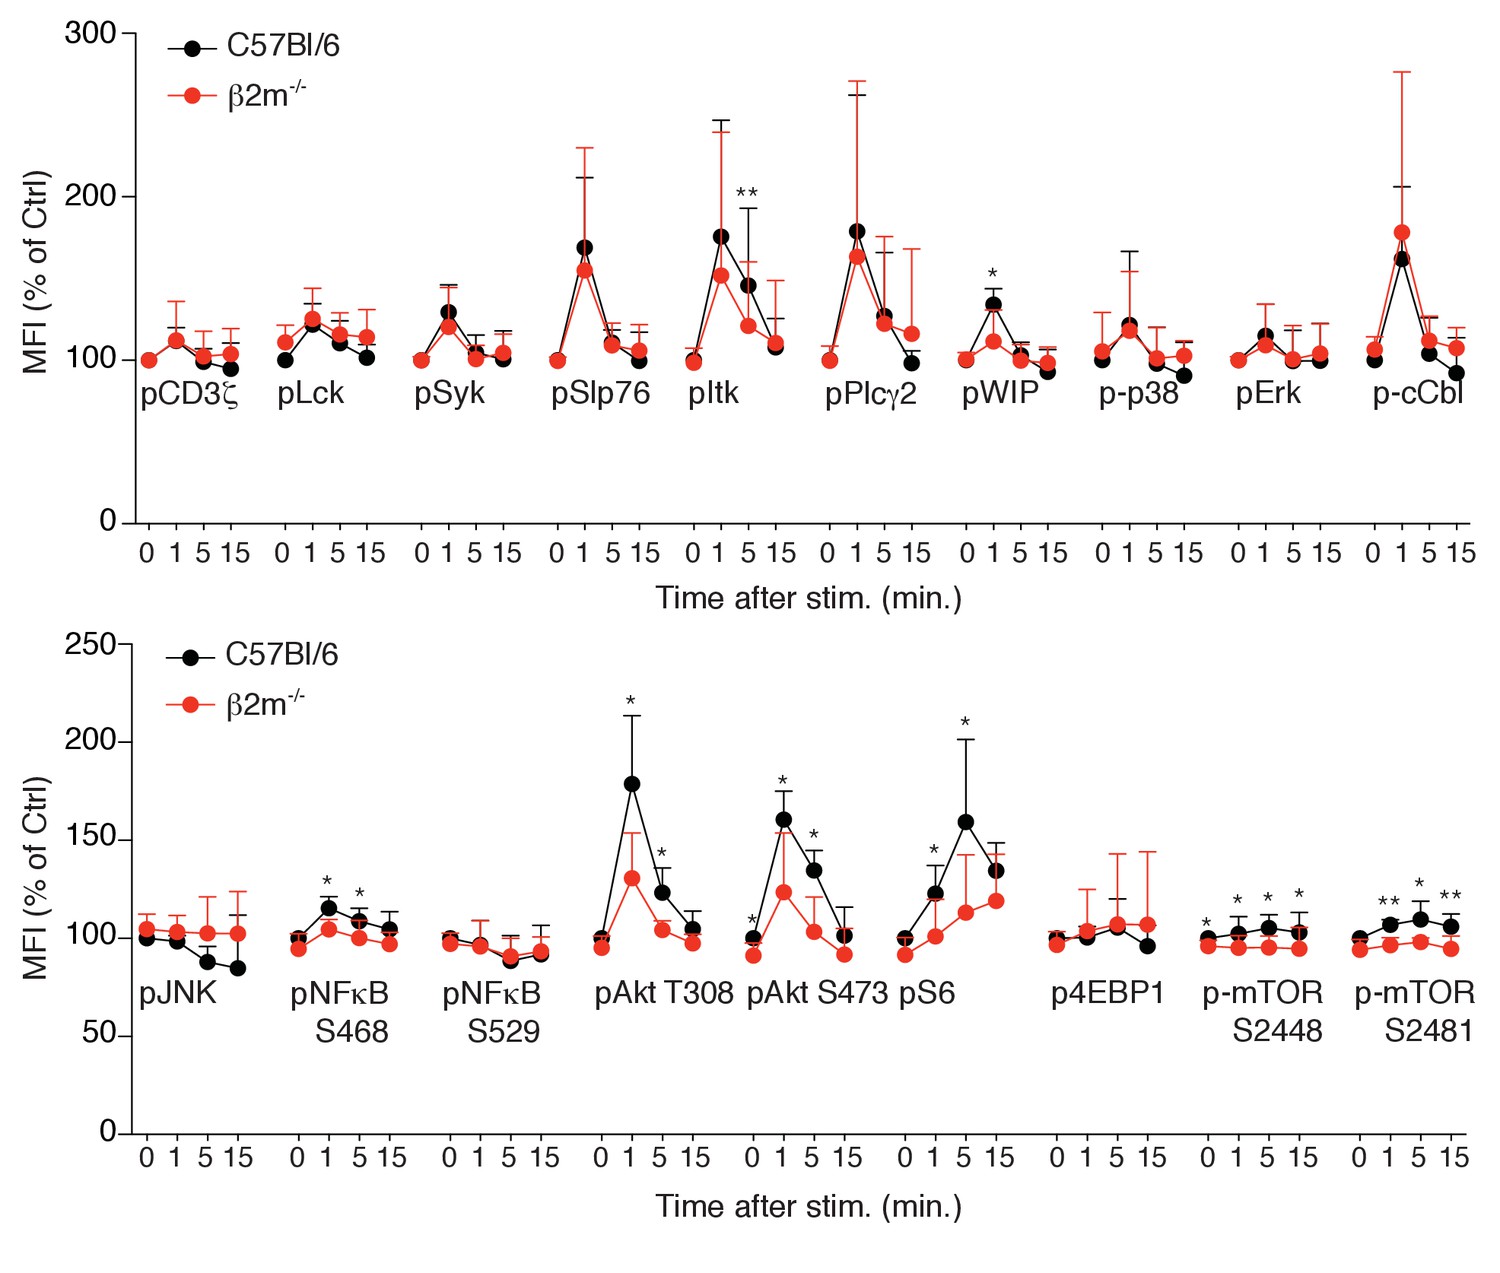
Phosphorylation level of phospho-epitopes defined in Table 1 was measured by flow-cytometry in splenic NK cells from C57BL/6 or B2m−/− mice following NK1.1 stimulation for the indicated time.
MFI of the indicated phospho-epitope (mean + SD) of 5 mice of each genotype in five independent experiments (t-test, *p<0.05, **p<0.01).
Figure 2 with 2 supplements
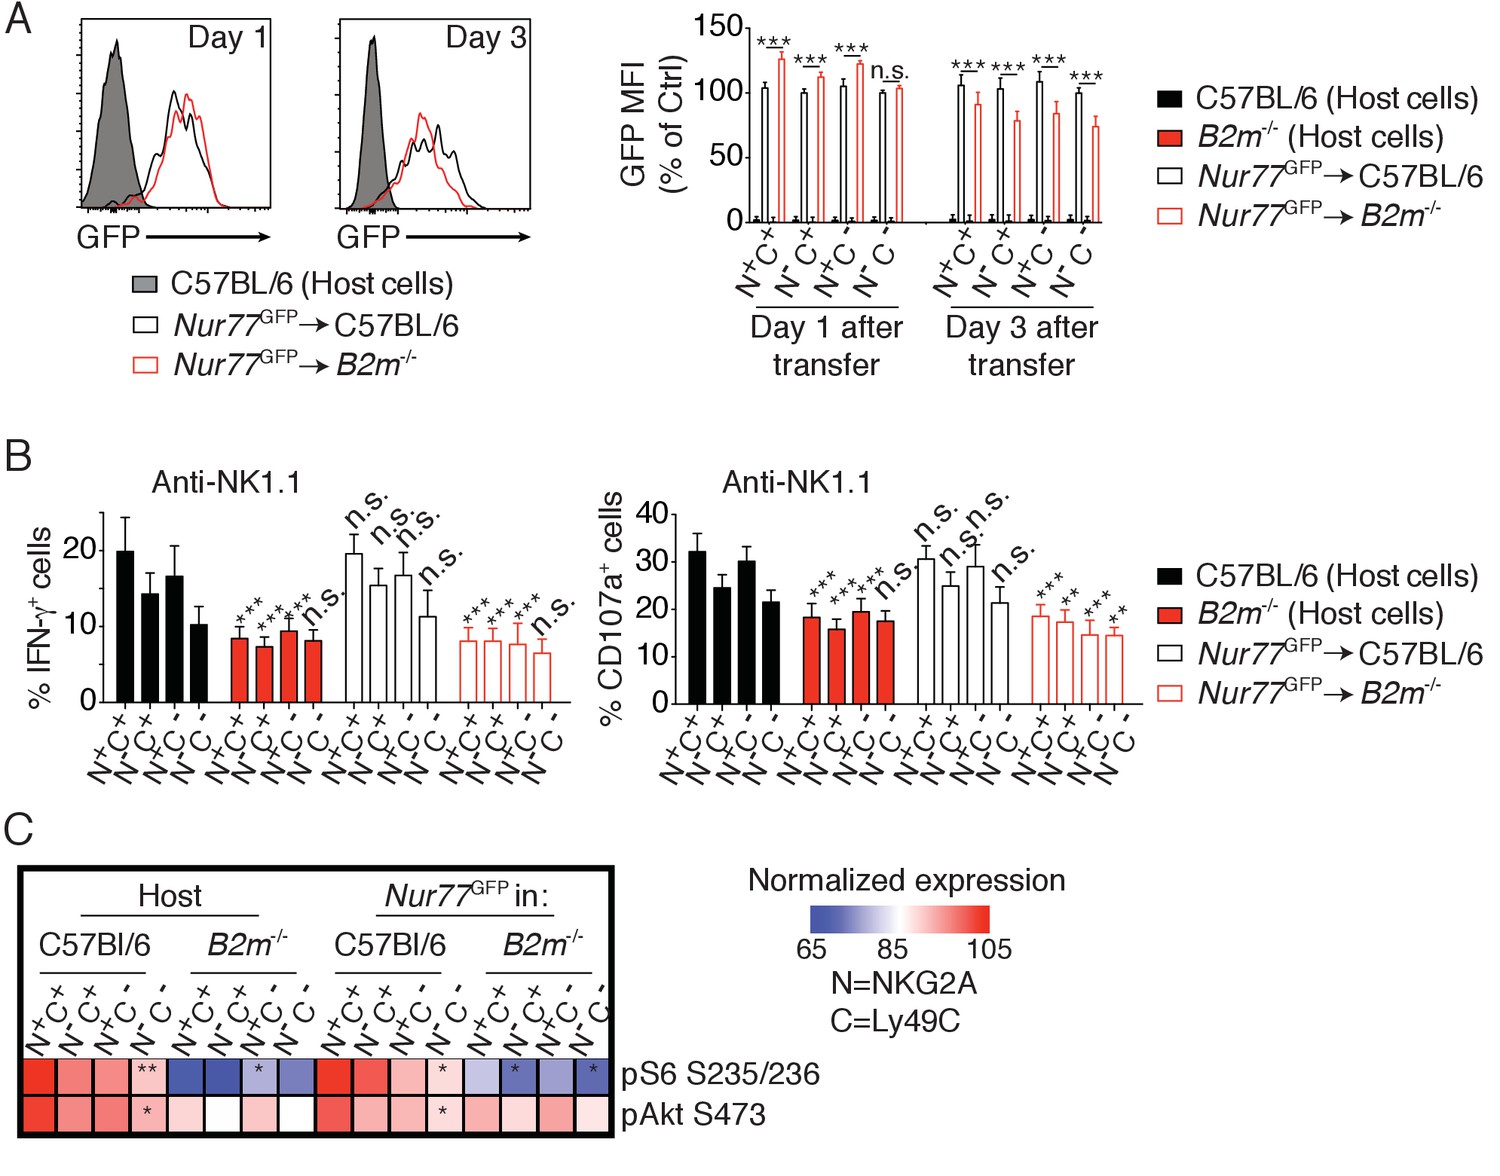
Reversion of education is accompanied by loss of the basal activity of the mTOR pathway.
(A) Left: Representative histograms showing the GFP fluorescence levels of Nur77GFP NK cells transferred into C57BL/6 or B2m−/− mice and harvested 1 or 3 days after transfer. Non-transgenic host cells are shown. Right: Bar graph showing the GFP levels of the indicated splenic NK cell subsets normalized to the N-C- population of Nur77GFP NK cells transferred into C57BL/6 control mice (mean +SD, n = 6 mice of each genotype per time point in two independent experiments, two-way ANOVA; ***p<0.001, n.s. non significant). (B) Percentage (mean + SD) of IFN-γ+ or CD107a+ cells among splenic host or transferred NK cells of the indicated subset following a 4 hr stimulation with coated anti-NK1.1. The experiment was done 3 days after transfer (n = 6 mice of each genotype in two independent experiments, two-way ANOVA comparing each subset to its counterpart in C57BL/6 mice, **p<0.01, ***p<0.001, n.s. non significant). (C) Heatmap representing the phosphorylation level of the phosphoepitopes indicated on the right in the different subsets of splenic resting NK cells indicated on top. Mean Fluorescence Intensity was recorded for each phosphoepitope in each subset. Normalized expression was calculated using the N+C+ subset of C57BL/6 host NK cells as reference. The mean values are shown (n = 6 mice of each genotype in two independent experiments, t-tests comparing the N+C+ subset to the indicated subset, *p<0.05, **p<0.01).
Figure 2—figure supplement 1
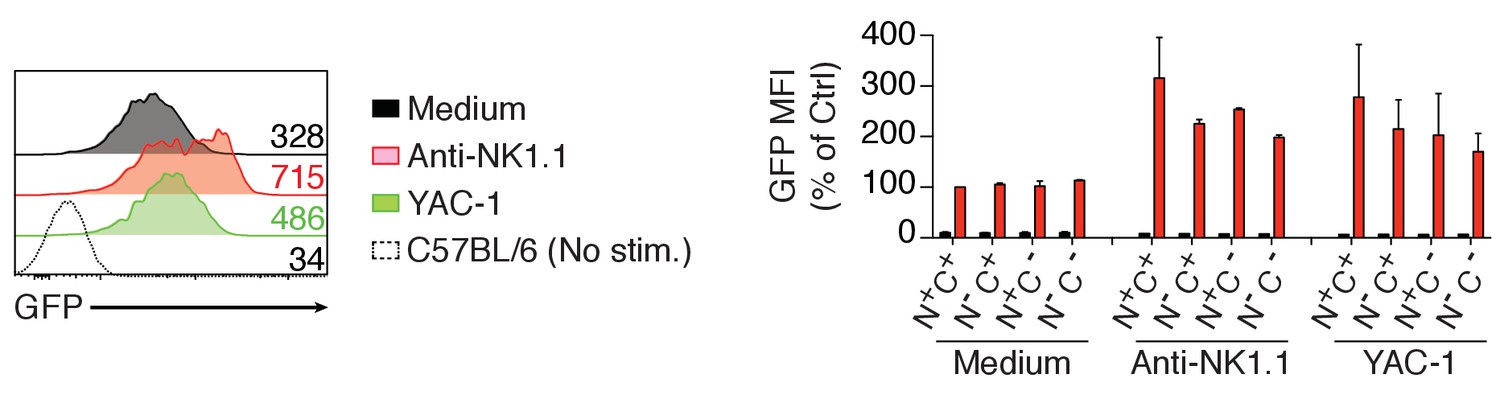
Left: Representative histograms showing the GFP fluorescence levels of Nur77GFP NK cells before or after a 4 hr stimulation with anti-NK1.1 or YAC-1 cells.
Non-transgenic C57BL/6 control NK cells are shown. Right: Bar graph showing the GFP levels of the indicated splenic NK cell subsets before or after a 4 hr stimulation with anti-NK1.1 or YAC-1 cells. GFP fluorescence was normalized to the unstimulated N+C+ population of Nur77GFP NK cells (mean +SD, n = 2 mice in two independent experiments).
Figure 2—figure supplement 2

Percentage (mean +SD) of IFN-γ+ or CD107a+ cells among splenic host or transferred NK cells of the indicated subset following 4 hr stimulation with (A) coated anti-NKp46 or (B) YAC-1 cells.
The experiment was done 3 days after the transfer (n = 6 mice of each genotype in two independent experiments, two-way ANOVA comparing each subset to its counterpart in C57BL/6 mice, *p<0.05, ***p<0.001, n.s. non significant).
Figure 3 with 1 supplement
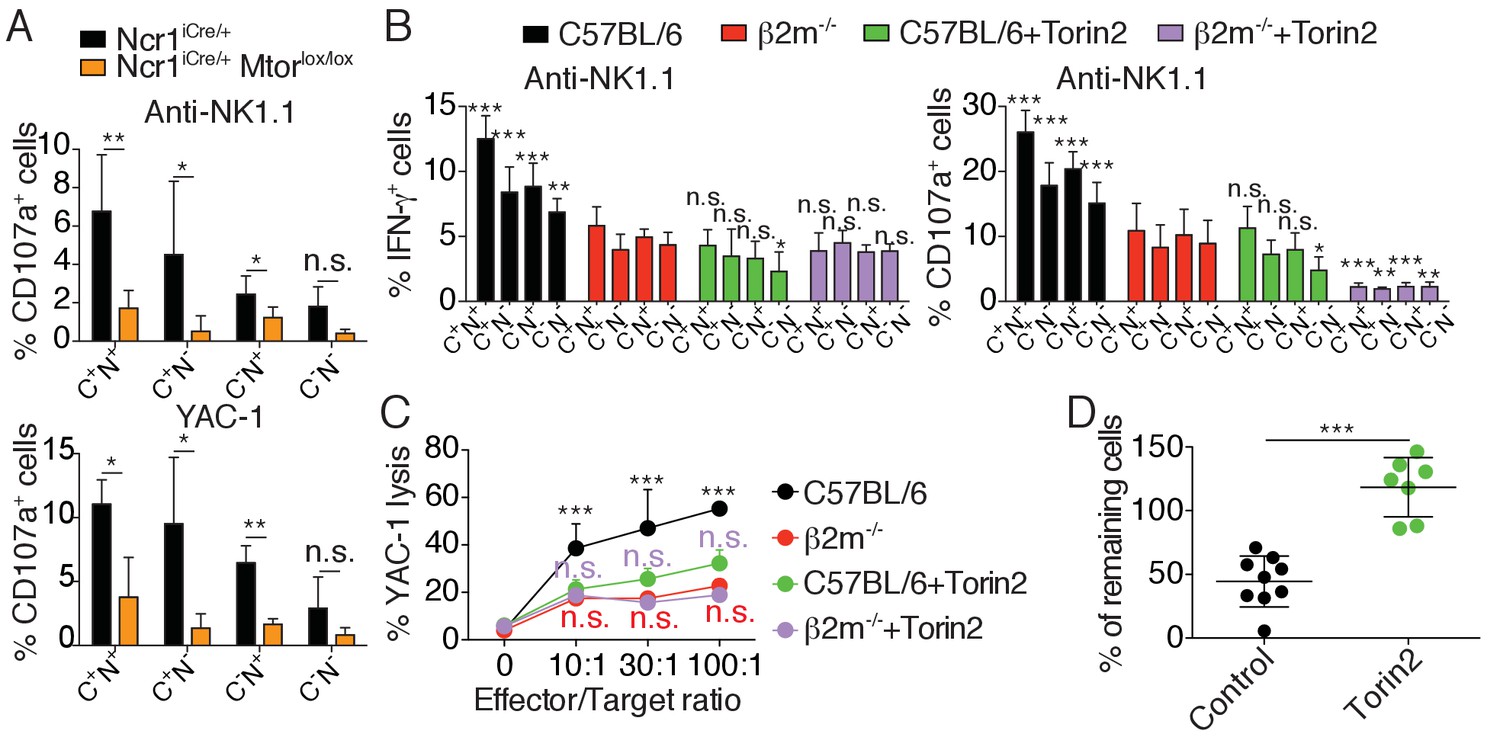
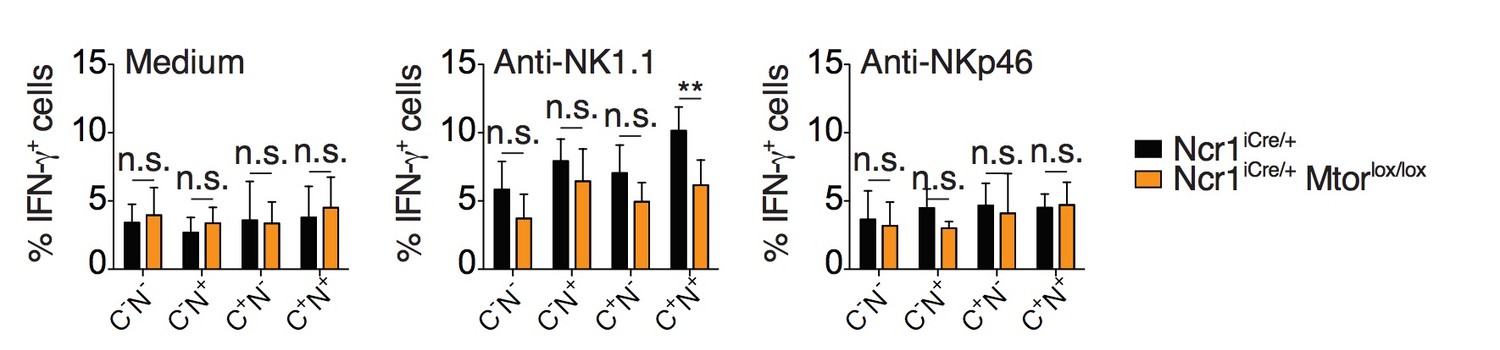
mTOR is essential for NK cell reactivity.
(A) Percentage (mean +SD) of CD107a+ cells among splenic CD11blo NK cells of the indicated subset from Ncr1iCre/+ or Ncr1iCre/+ Mtorlox/lox mice following 4 hr stimulation with coated anti-NK1.1 or YAC-1 cells (n = 5 mice of each genotype in three independent experiments, t-tests comparing each subset in both genotype, *p<0.05, **p<0.01, n.s. non significant). (B) Percentage (mean +SD) of IFN-γ+ or CD107a+ cells among splenic NK cells of the indicated subset from C57BL/6 or B2m−/− mice following 4 hr stimulation with coated anti-NK1.1 in the presence or absence of 250 nM Torin2 (n = 9–10 mice of each genotype in five independent experiments, two-way ANOVA comparing each subset to its counterpart in B2m−/− mice, *p<0.05, **p<0.01, ***p<0.001, n.s. non significant). (C) Percentage (mean +SD) of dead YAC-1 cells after a 4 hr co-culture with purified NK cells of the indicated genotype at the indicated Effector/Target ratio in the presence or absence of 250 nM Torin2 (n = 9 C57BL/6 and 7 B2m−/− mice in four independent experiments, two-way ANOVA comparing each E/T ratio of C57BL/6 + Torin2 to C57BL/6, B2m−/− or B2m−/− +Torin2 as indicated by the color, ***p<0.001, n.s. non significant). (D) Percentage of remaining B2m−/− target cells following in vivo cytotoxicity experiment as described in the Materials and methods. Each dot represents a single mouse, bars indicate mean and SD (n = 9 control treated mice and 7 Torin2 treated mice in two independent experiments, t-test, ***p<0.001).
Figure 3—figure supplement 1
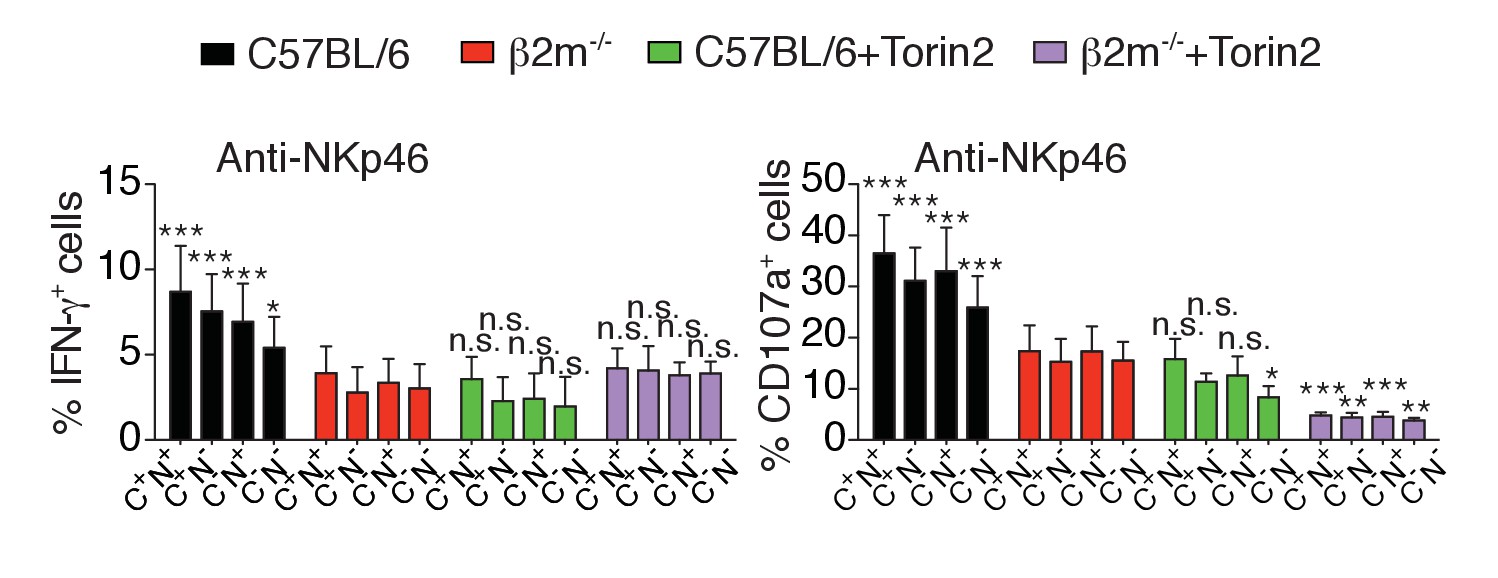
Percentage (mean +SD) of IFN-γ+ or CD107a+ cells among splenic NK cells of the indicated subset from C57BL/6 or B2m−/− mice following 4 hr stimulation with coated anti-NKp46 in the presence or absence of 250 nM Torin2 (n = 9–10 mice of each genotype in five independent experiments, 2-way ANOVA comparing each subset to its counterpart in B2m−/− mice, *p<0.05, **p<0.01, ***p<0.001, n.s. non significant).
https://doi.org/10.7554/eLife.26423.012
Figure 4 with 1 supplement

mTOR is a rheostat of NK cell reactivity through NKar.
(A) Bar graph showing the phosphorylation level of S6 (left) and Akt S473 (right) in splenic NK cells following 1 hr treatment with 100 ng/ml IL-15 in the presence or absence of the indicated mTOR inhibitors at the indicated concentration (mean of the MFI normalized to the No inhibitor condition +SD, n = 9 mice in three independent experiments, one-way ANOVA comparing the No inhibitor condition with the indicated condition, **p<0.01; ***p<0.001, n.s. non significant). (B–C) Linear regression plots showing the correlation between (B) pS6 or (C) pAkt S473 as indicated and the percentage of IFN-γ+ or CD107a+ NK cells following 4 hr stimulation with coated anti-NK1.1 in the presence of 100 ng/ml IL-15 and mTOR inhibitors (mean ±SD, n = 9 mice in three independent experiments, the r2 and p-value calculated by linear regression are indicated).
Figure 4—figure supplement 1
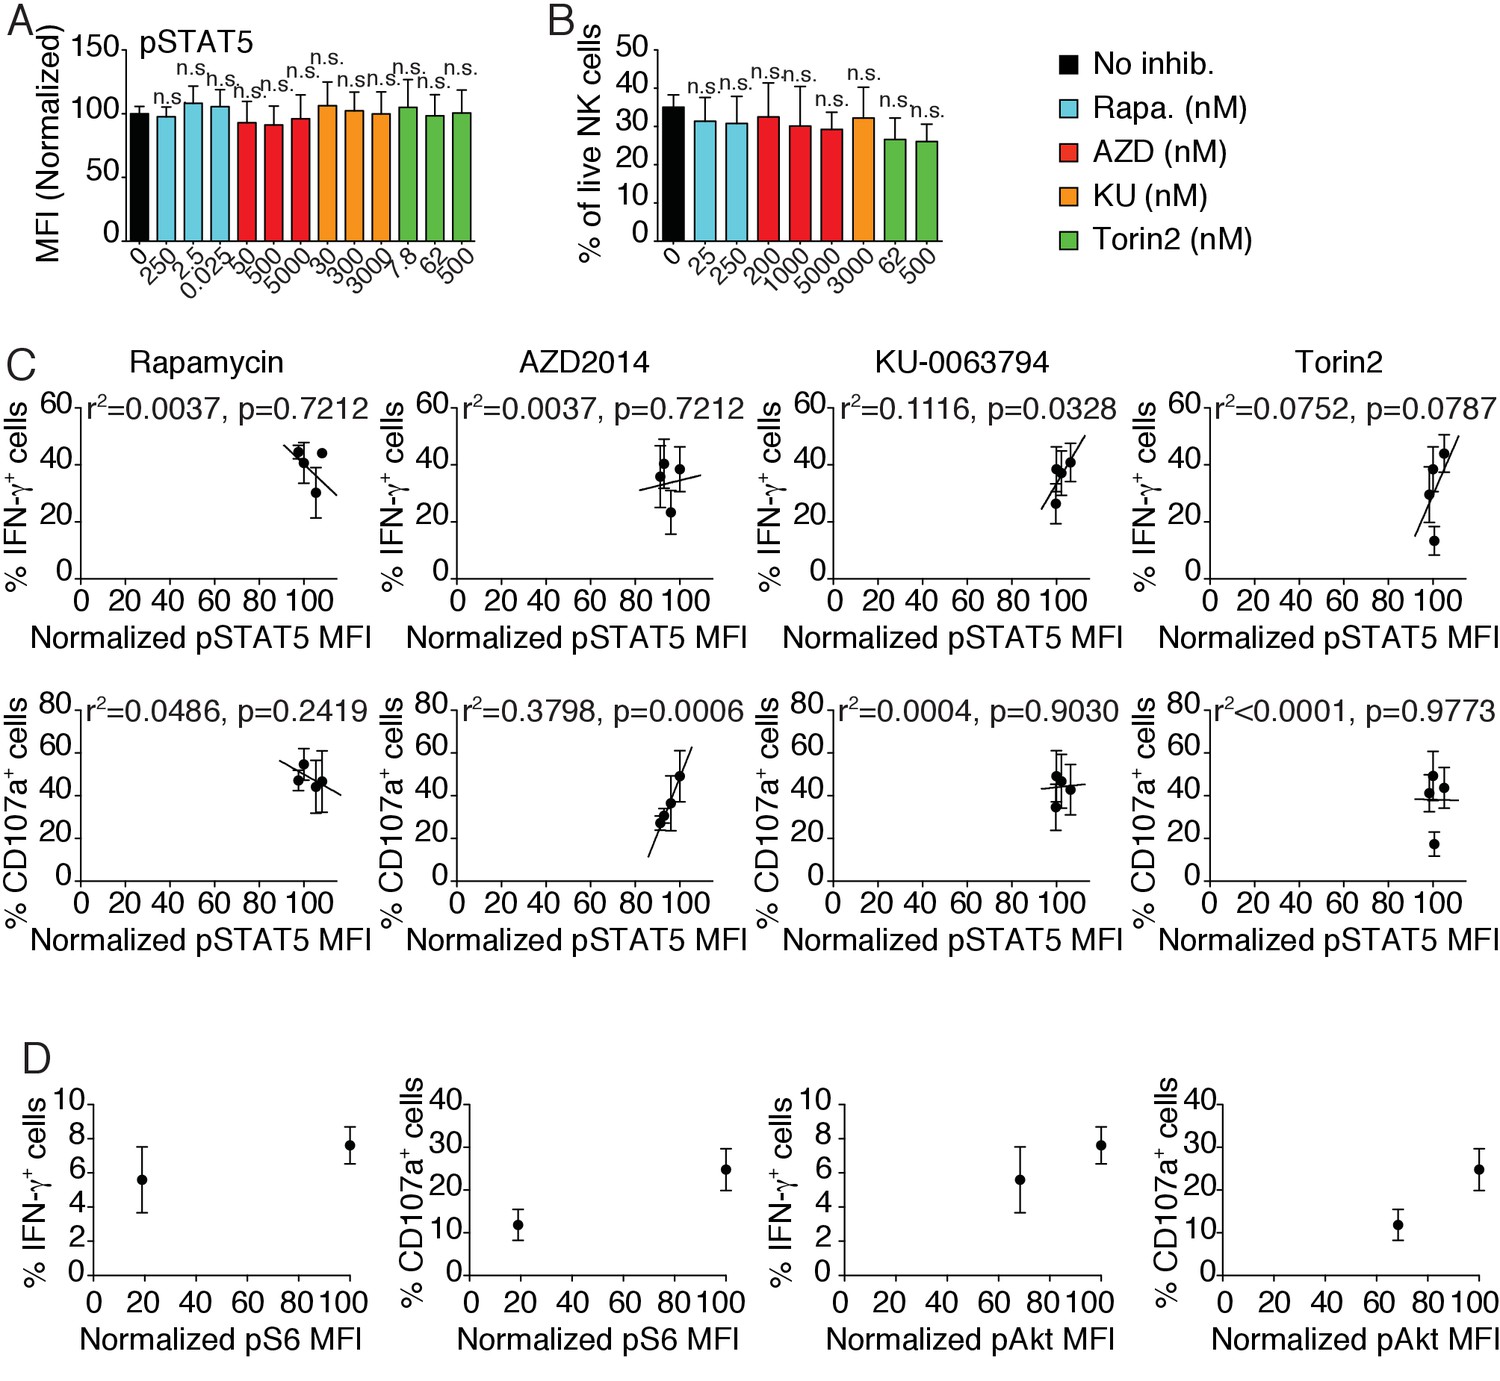
Bar graphs showing (A) the phosphorylation level of STAT5 in splenic NK cells following 1 hr treatment with 100 ng/ml IL-15 or (B) the percentage of live NK cells following a 24 hr culture in the presence or absence of the indicated mTOR inhibitors at the indicated concentration (A) mean of the MFI normalized to the No inhibitor condition or (B) percentage of live cells + SD, n = 9 mice in three independent experiments for pSTAT5 and 4 mice in two independent experiments for Viability, one-way ANOVA comparing the No inhibitor condition with the indicated condition, n.s. non significant).
(C) Linear regression plots showing the correlation between pSTAT5 and the percentage of IFN-γ+ or CD107a+ NK cells following 4 hr stimulation with coated anti-NK1.1 in the presence of 100 ng/ml IL-15 and mTOR inhibitors (mean ±SD, n = 4–5 mice in three independent experiments, the r2 and p-value calculated by linear regression are indicated). (D) Dot plots showing the correlation between pS6 or pAkt S473 in the presence of 100 ng/ml IL-15 and the percentage of IFN-γ+ or CD107a+ CD11blo NK cells from Ncr1iCre/+ or Ncr1iCre/+ Mtorlox/lox mice following 4 hr stimulation with coated anti-NK1.1(mean ±SD, n = 5–7 mice in three independent experiments).
Figure 5
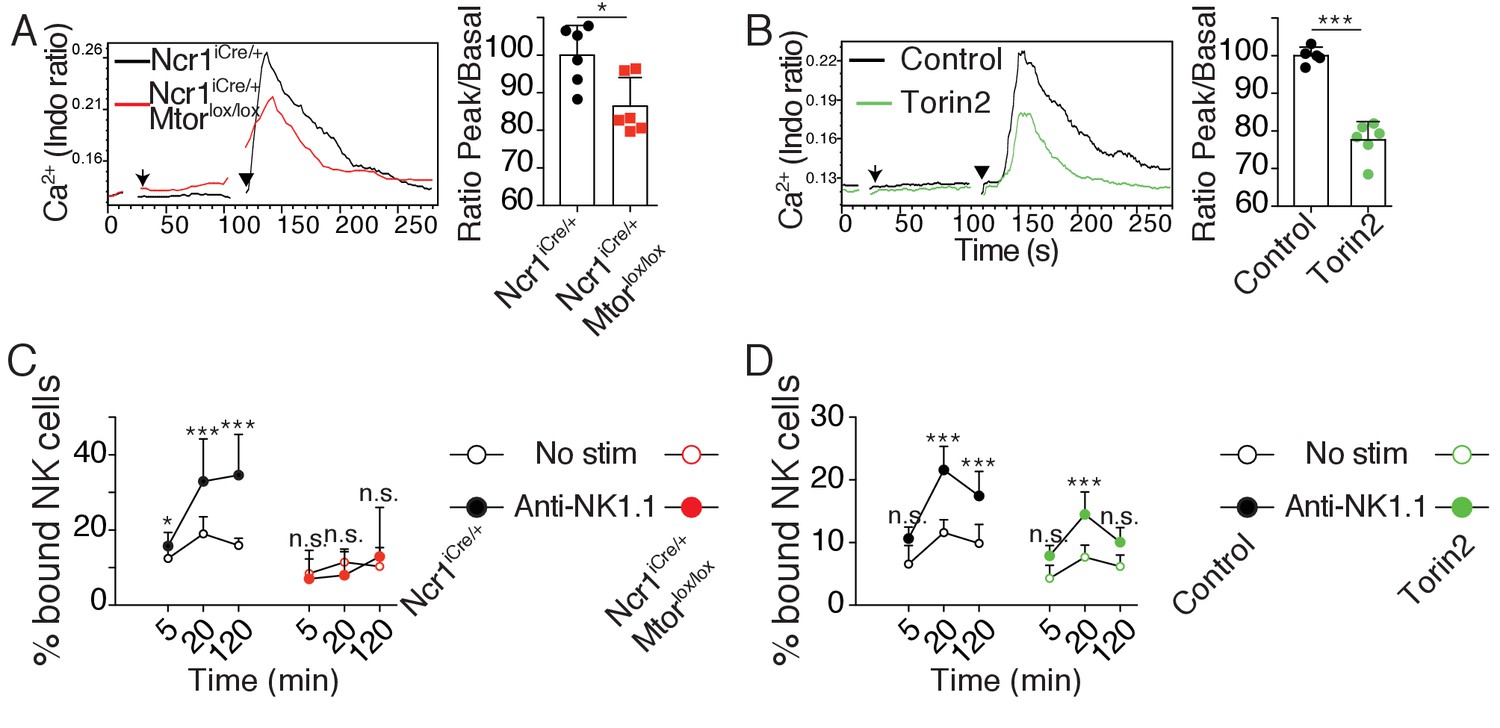
mTOR is essential for calcium response and integrin activation following NKar engagement.
(A) Left: Representative histogram overlay showing the Ca2+ flux intensity in splenic CD11blo NK cells from Ncr1iCre/+ or Ncr1iCre/+ Mtorlox/lox mice. NK cells were activated following incubation with biotinylated anti-NK1.1 (Arrow) followed by cross-linking with streptavidin (Arrowhead). Right: Bar graph showing the Ratio Peak/basal normalized to the ratio of control NK cells (mean +SD, t-test *p<0.05). (B) Left: Representative histogram overlay showing the Ca2+ flux intensity in splenic NK cells from C57BL/6 mice in the presence or absence of 500 nM Torin2. Right: Bar graph showing the Ratio Peak/basal normalized to the ratio of control NK cells (mean +SD, t-test ***p<0.001). (C) Percentage of splenic CD11blow NK cells from Ncr1iCre/+ or Ncr1iCre/+ Mtorlox/lox mice bound to beads coated with ICAM-1 after the indicated incubation time with or without NK1.1 stimulation (mean +SD, n = 6 mice of each genotype in four independent experiments, two-way ANOVA comparing the conditions with or without NK1.1 stimulation, n.s. non significant, **p<0.01, ***p<0.001). (D) Percentage of splenic C57BL/6 NK cells bound to beads coated with ICAM-1 after the indicated incubation time with or without NK1.1 stimulation, in the presence or absence of 250 nM Torin2 (mean +SD, n = 6 mice in four independent experiments, two-way ANOVA comparing the conditions with or without NK1.1 stimulation, n.s. non significant, ***p<0.001).
Figure 6
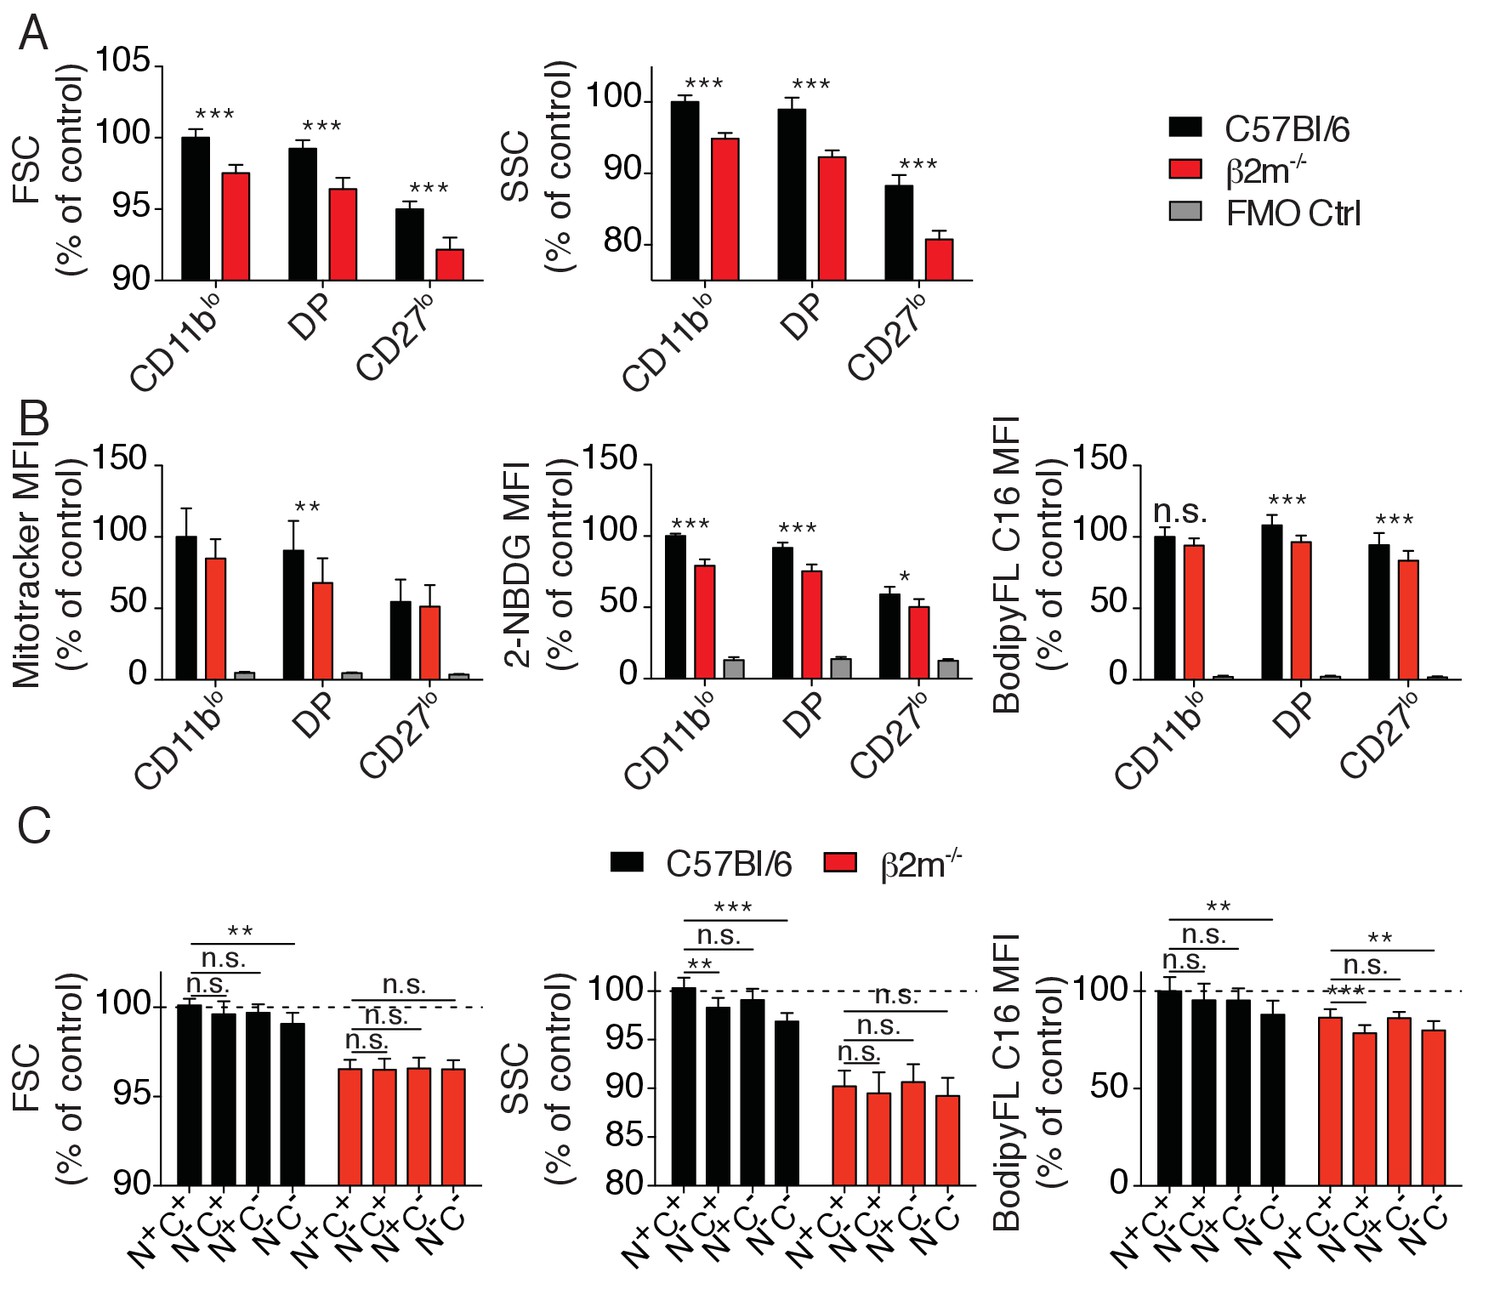
Metabolic parameters of reactive and hyporesponsive NK cells.
(A) Bar graphs showing FSC and SSC values of splenic NK cell subsets from C57BL/6 or B2m−/− mice (mean +SD, n = 6 mice of each genotype in three independent experiments, t-test, ***p<0.001). MFI were normalized to the CD11blo subset of C57BL/6 mice. (B) Bar graphs showing MFI of mitotracker staining, 2-NBDG or BodipyFL C16 incorporation of splenic NK cell subsets from C57BL/6 or B2m−/− mice (mean +SD, n = 6–10 mice of each genotype in three independent experiments, t-test, *p<0.05, **p<0.01, ***p<0.001, n.s. non significant). MFI were normalized to the CD11blo subset of C57BL/6 mice. (C) Bar graphs showing FSC and SSC values or BodipyFL C16 incorporation of splenic NK cell subsets (gated on CD27low) from C57BL/6 or B2m−/− mice (mean +SD, n = 6–10 mice of each genotype in three independent experiments, t-test, n.s. non significant, *p<0.05, ***p<0.001). MFI were normalized to the N+C+ subset of C57BL/6 mice.
Figure 7 with 2 supplements
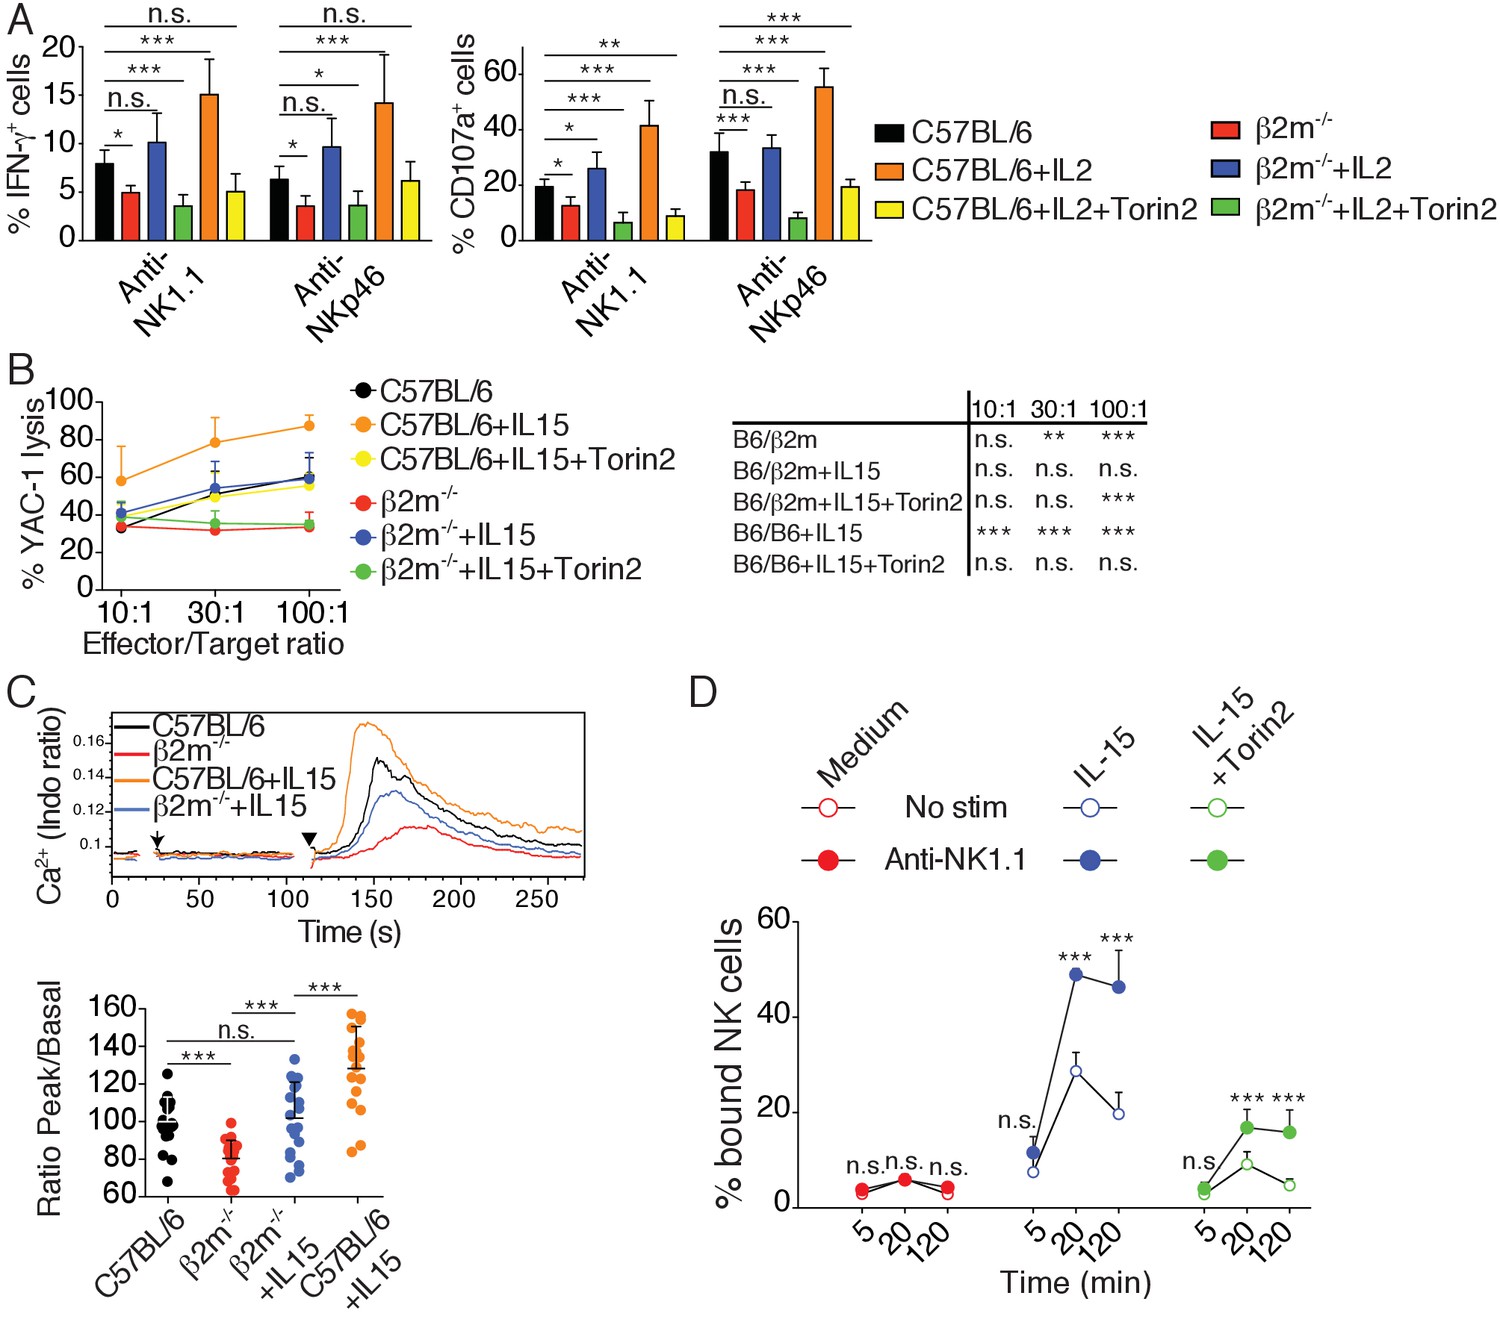
Cytokine stimulation overcomes NK cell education by inducing high mTOR activity that restores NKar signaling.
(A) Percentage (mean +SD) of IFN-γ or CD107a positive cells among splenic NK cells from C57BL/6 or B2m−/− mice following 4 hr stimulation with coated anti-NK1.1 or anti-NKp46 in the presence or absence of 200UI/ml IL-2 and 250 nM Torin2 as indicated (n = 9–10 mice of each genotype in five independent experiments, one-way ANOVA comparing each condition to the C57BL/6 condition, *p<0.05, **p<0.01, ***p<0.001, n.s. non significant). (B) Percentage (mean +SD) of dead YAC-1 cells after a 4 hr co-culture with purified NK cells from C57BL/6 or B2m−/− mice at the indicated Effector/Target ratio in the presence or absence of 10 ng/ml IL-15 and 250 nM Torin2 as indicated (n = 7 mice of each genotype in three independent experiments, the table on the right presents the results of a two-way ANOVA comparing C57BL/6 with the other experimental conditions for the indicated Effector/Target ratio, **p<0.01, ***p<0.001 n.s. non significant). (C) Top: Representative histogram overlay showing the Ca2+ flux intensity in splenic NK cells from C57BL/6 or B2m−/− mice with or without IL-15 (100 ng/ml). NK cells were activated following incubation with biotinylated anti-NK1.1 (Arrow) followed by cross-linking with streptavidin (Arrowhead). Down: Bar graph showing the Ratio Peak/basal normalized to the ratio of control NK cells (mean +SD of n = 17–20 replicates from 6 mice in six independent experiments, one-way ANOVA comparing the indicated conditions, **p<0.01, ***p<0.001). (D) Percentage of splenic NK cells from B2m−/− mice bound to beads coated with ICAM-1 after the indicated incubation time with or without NK1.1 stimulation, in the presence or absence of 100 ng/ml IL-15 and 250 nM Torin2 (n = 6 mice in four independent experiments, two-way ANOVA comparing stimulated to non-stimulated conditions, n.s. non significant, ***p<0.001).
Figure 7—figure supplement 1
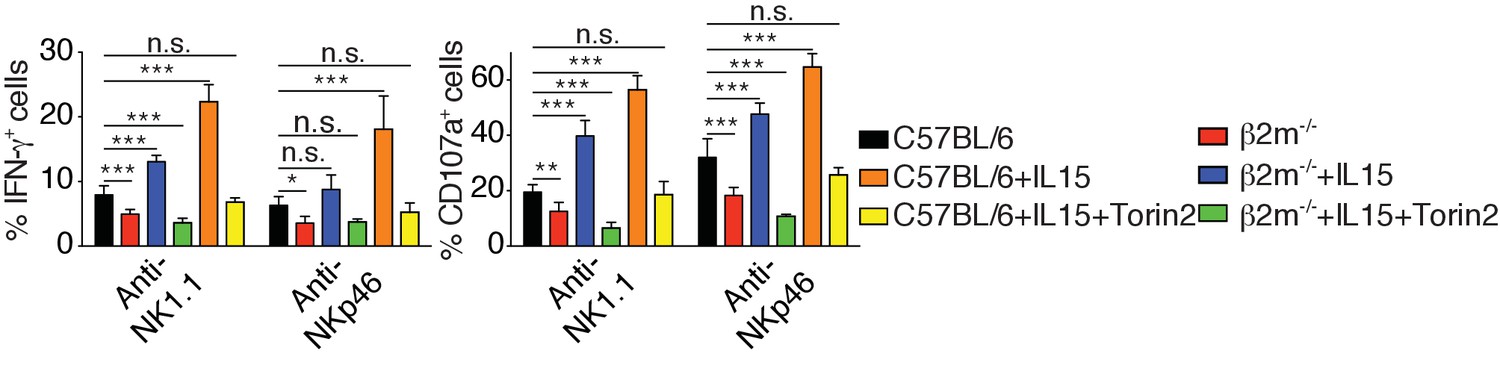
Percentage (mean +SD) of IFN-γ or CD107a positive cells among splenic NK cells from C57BL/6 or B2m−/− mice following 4 hr stimulation with coated anti-NK1.1 or anti-NKp46 in the presence or absence of 10 ng/ml IL-15 and 250 nM Torin2 as indicated (n = 4 mice of each genotype in two independent experiments, one-way ANOVA comparing each condition to the C57BL/6 condition, *p<0.05, **p<0.01, ***p<0.001, n.s. non significant).
https://doi.org/10.7554/eLife.26423.018
Figure 7—figure supplement 2
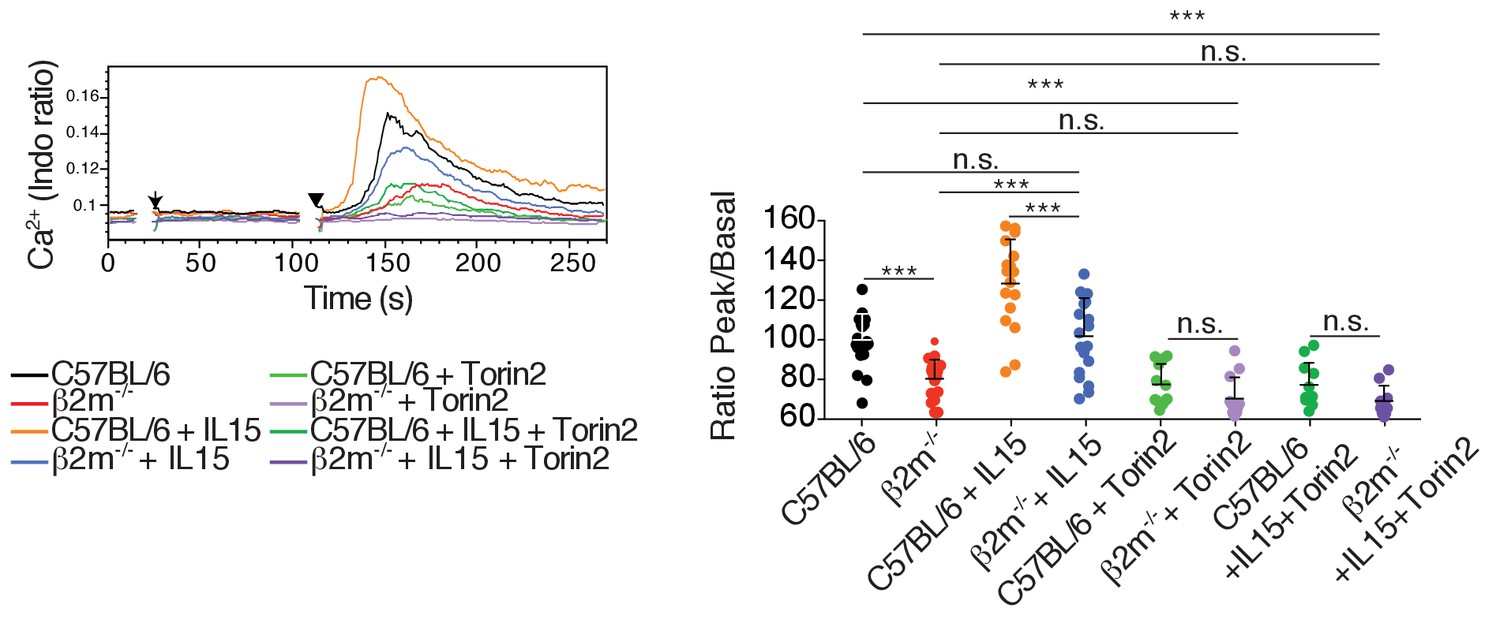
Left: Representative histogram overlay showing the Ca2+ flux intensity in splenic NK cells from C57BL/6 or B2m−/− mice with or without IL-15 (100 ng/ml) and Torin2 (500 nM).
NK cells were activated following incubation with biotinylated anti-NK1.1 (Arrow) followed by cross-linking with streptavidin (Arrowhead). Right: Bar graph showing the Ratio Peak/basal normalized to the ratio of control NK cells (mean +SD of n = 12–20 replicates from 6 mice in six independent experiments, one-way ANOVA comparing the indicated conditions ***p<0.001, n.s. non significant).
Author response image 1
Percentage (mean + SD) of IFNγ+ cells among splenic CD11blo NK cells of the indicated subset from Ncr1iCre/+ or Ncr1iCre/+ Mtorlox/lox mice following 4-hour stimulation with coated anti-NK1.1 or anti-NKp46 (n=5 mice of each genotype in 3 independent experiments, t-tests comparing each subset in both genotype, **p<0.01, n.s. non significant).
Author response image 2

Bar graphs showing MFI of Glut1 staining, MitoSox staining, Bodipy incorporation and Lipid peroxidation staining of splenic NK cell subsets from C57BL/6 or β2m-/- mice (mean +SD, n=10 mice of each genotype in 3 independent experiments, except Glut1: 4 mice in 2 independent experiments, no statistical differences were detected between C57BL/6 and β2m-/-, t-test).
MFI were normalized to the CD11blo subset of C57BL/6 mice.
Tables
Table 1
List of the antibodies used in this study and the phosphoepitopes they recognize.
https://doi.org/10.7554/eLife.26423.007| Phosphoepitope | Clone (Supplier) |
|---|---|
| pCD3ζ (Y142) | K25-407.69 (BD) |
| pLck (Y505) | 4/LCK-Y505 (BD) |
| pSyk (Y342) | I120-722 (BD) |
| pSLP76 (Y128) | J141-668.36.58 (BD) |
| pItk (Y180) | N35-86 (BD) |
| pPLCg2 (Y759) | K86-689.37 (BD) |
| pWIP (S478) | K32-824 (BD) |
| p-p38 (T180/Y182) | 36/p38 (pT180/pY182) (BD) |
| pERK1/2 (T203/Y205) | 20A (BD) |
| p-c-Cbl (Y698) | 47/c-Cbl (BD) |
| pJNK (T183/Y185) | N9-66 (BD) |
| pNFkB p65 (S468) | #3039 (CST) |
| pNFkB p65 (S529) | K10-895.12.50 (CST) |
| pNFkB p65 (S536) | 93H1 (CST) |
| pAkt (T308) | C31E5E (CST) |
| pAkt (S473) | M89-61 (BD) |
| pS6 (S235/236) | D57.2.2E (CST) |
| p4EBP1 (T36/45) | 236B4 (CST) |
| p-mTOR (S2448) | D9C2 (CST) |
| p-mTOR (S2481) | #2974 (CST) |
Additional files
-
Transparent reporting form
- https://doi.org/10.7554/eLife.26423.020
Download links
A two-part list of links to download the article, or parts of the article, in various formats.
Downloads (link to download the article as PDF)
Open citations (links to open the citations from this article in various online reference manager services)
Cite this article (links to download the citations from this article in formats compatible with various reference manager tools)
High mTOR activity is a hallmark of reactive natural killer cells and amplifies early signaling through activating receptors
eLife 6:e26423.
https://doi.org/10.7554/eLife.26423


