Simultaneous enumeration of cancer and immune cell types from bulk tumor gene expression data
- University of Lausanne, Switzerland
- Swiss Institute of Bioinformatics, Switzerland
- Lausanne University Hospital (CHUV), Switzerland
Figures
Figure 1 with 2 supplements
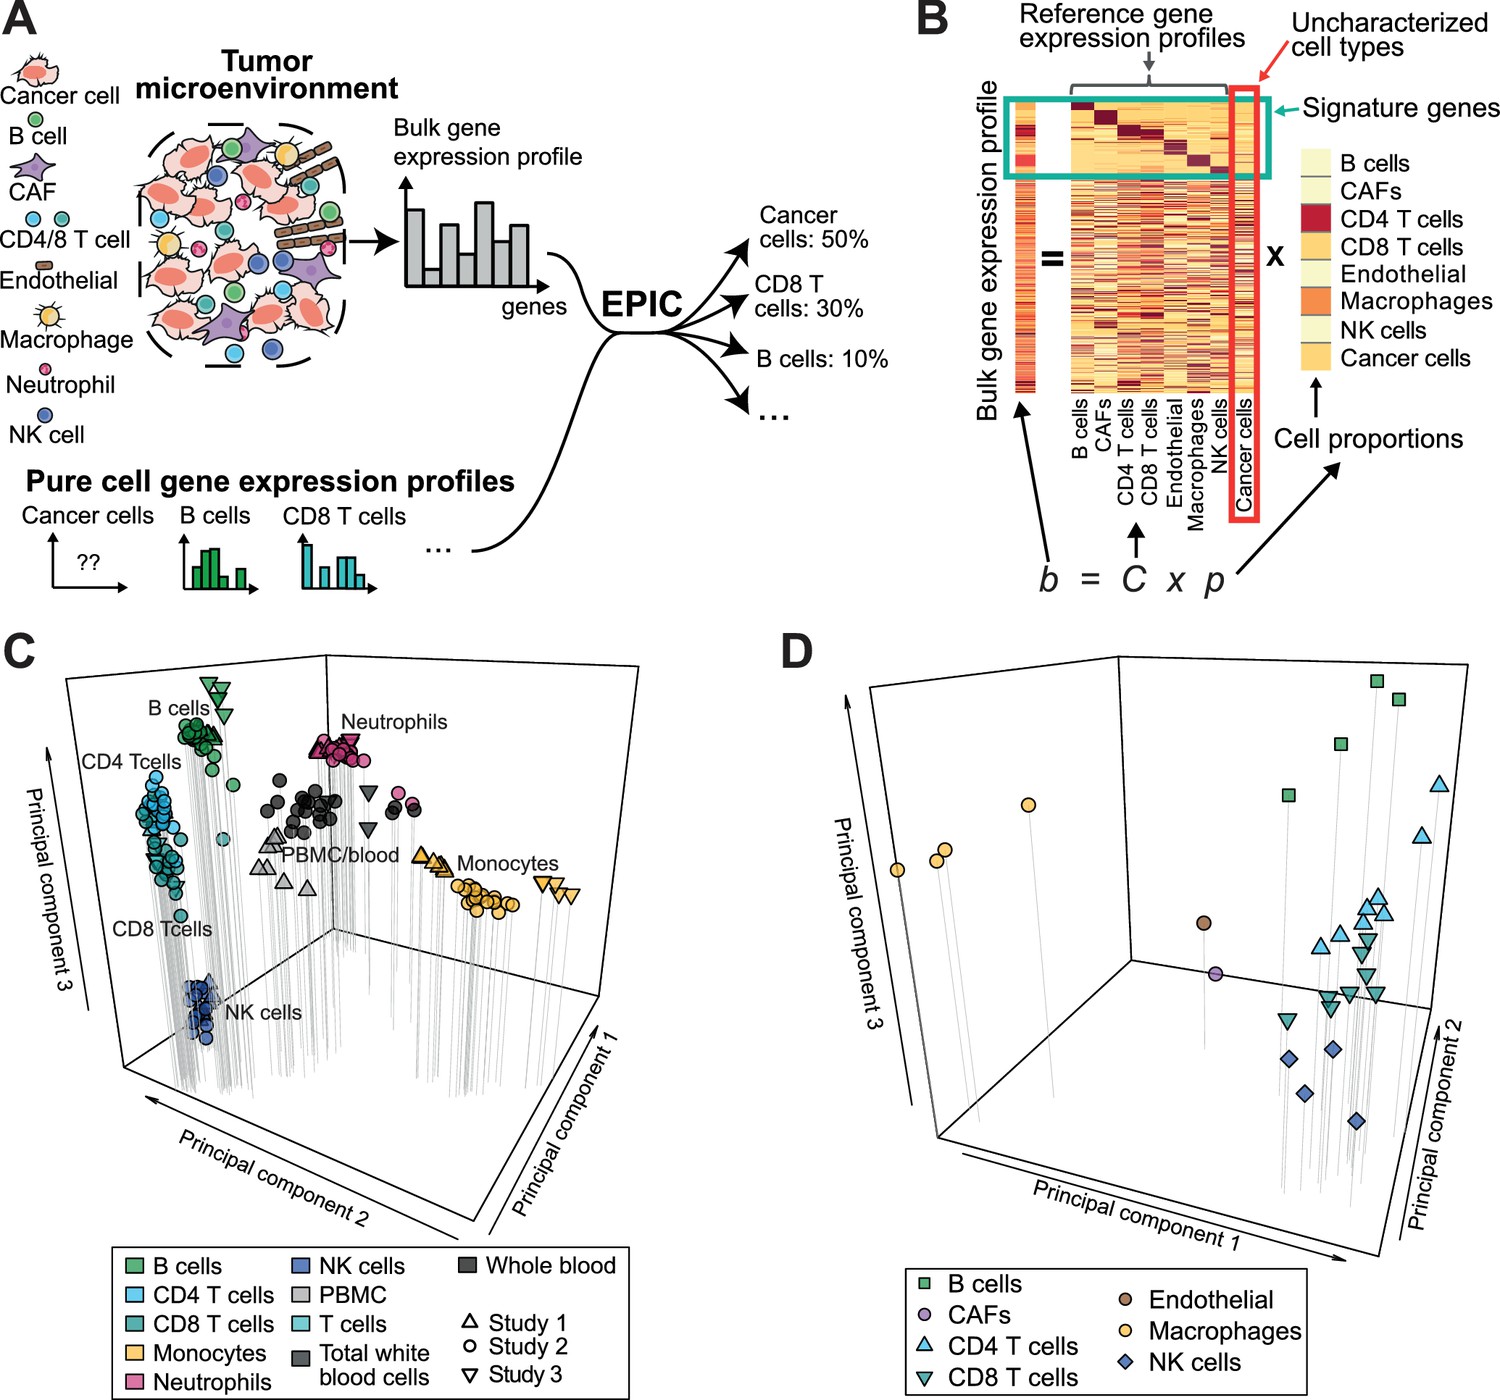
Estimating the proportion of immune and cancer cells.
(A) Schematic description of our method. (B) Matrix formulation of our algorithm, including the uncharacterized cell types (red box) with no or very low expression of signature genes (green box). (C) Low dimensionality representation (PCA based on the 1000 most variable genes) of the samples used to build the reference gene expression profiles from circulating immune cells (study 1 [Hoek et al., 2015], study 2 [Linsley et al., 2014], study 3 [Pabst et al., 2016]). (D) Low dimensionality representation (PCA based on the 1000 most variable genes) of the tumor- infiltrating cell gene expression profiles from different patients. Each point corresponds to cell-type average per patient of the single-cell RNA-Seq data of Tirosh et al. (2016) (requiring at least 3 cells of a given cell type per patient). Only samples from primary tumors and non-lymphoid tissue metastases were considered. Projection of the original single-cell RNA-Seq data can be found in Figure 1—figure supplement 1.
Figure 1—figure supplement 1
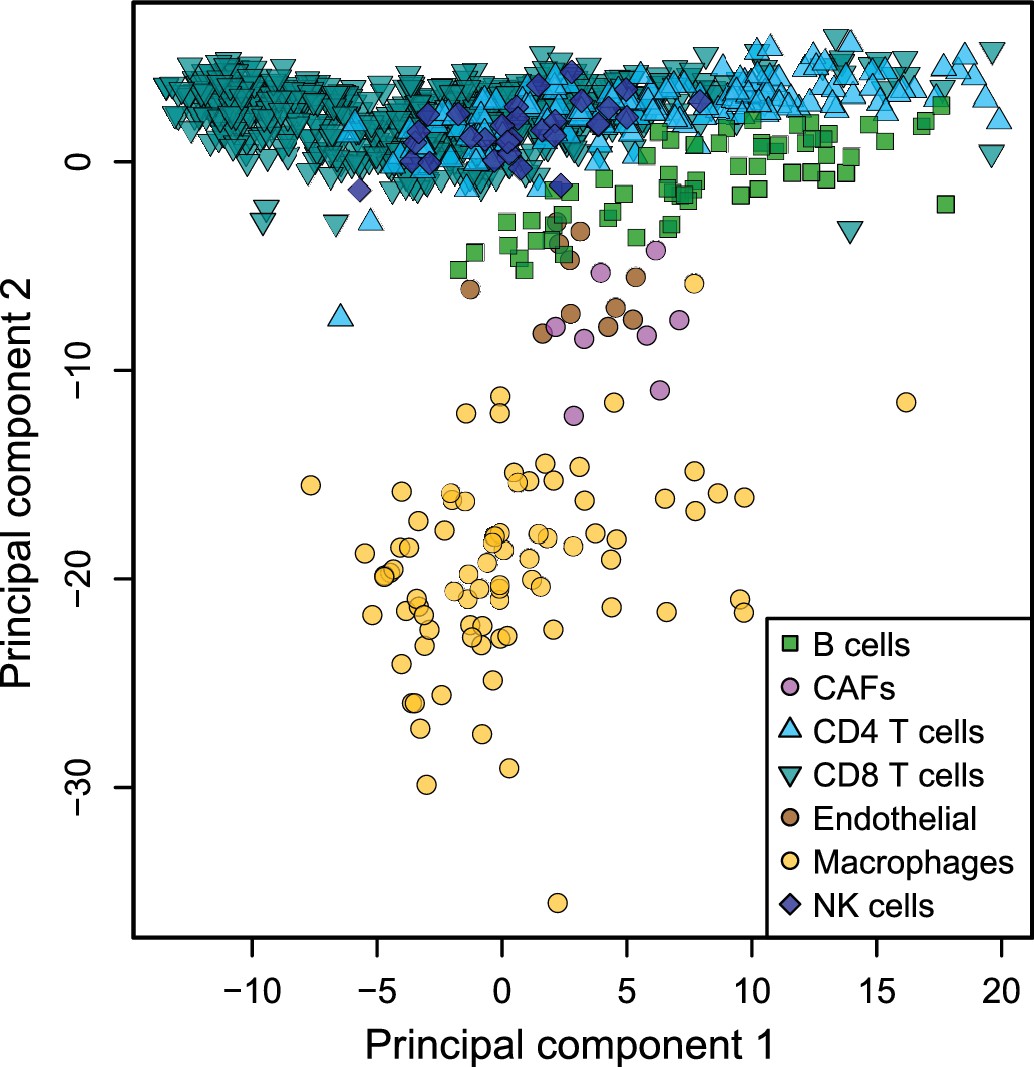
Low dimensionality representation of the tumor-infiltrating cell samples.
Principal component analysis of the samples used to build the reference gene expression profiles from tumor-infiltrating immune cells, based on the data from Tirosh et al. (2016), considering only the primary tumor and non-lymphoid tissue metastasis samples.
Figure 1—figure supplement 2

Cell type mRNA content.
(A) mRNA content per cell type obtained for cell types sorted from blood. Values for B, NK, T cells and monocytes were obtained as described in Materials and methods. Values for Neutrophils are from Subrahmanyam et al. (2001). (B) Width of the forward scatter values for the different immune and cancer cells from flow cytometry data of melanoma metastatic lymph nodes. Data were first normalized by the mean FSC-W for each donor. Error bars represent the standard deviation from data of 4 patients.
Figure 2 with 4 supplements
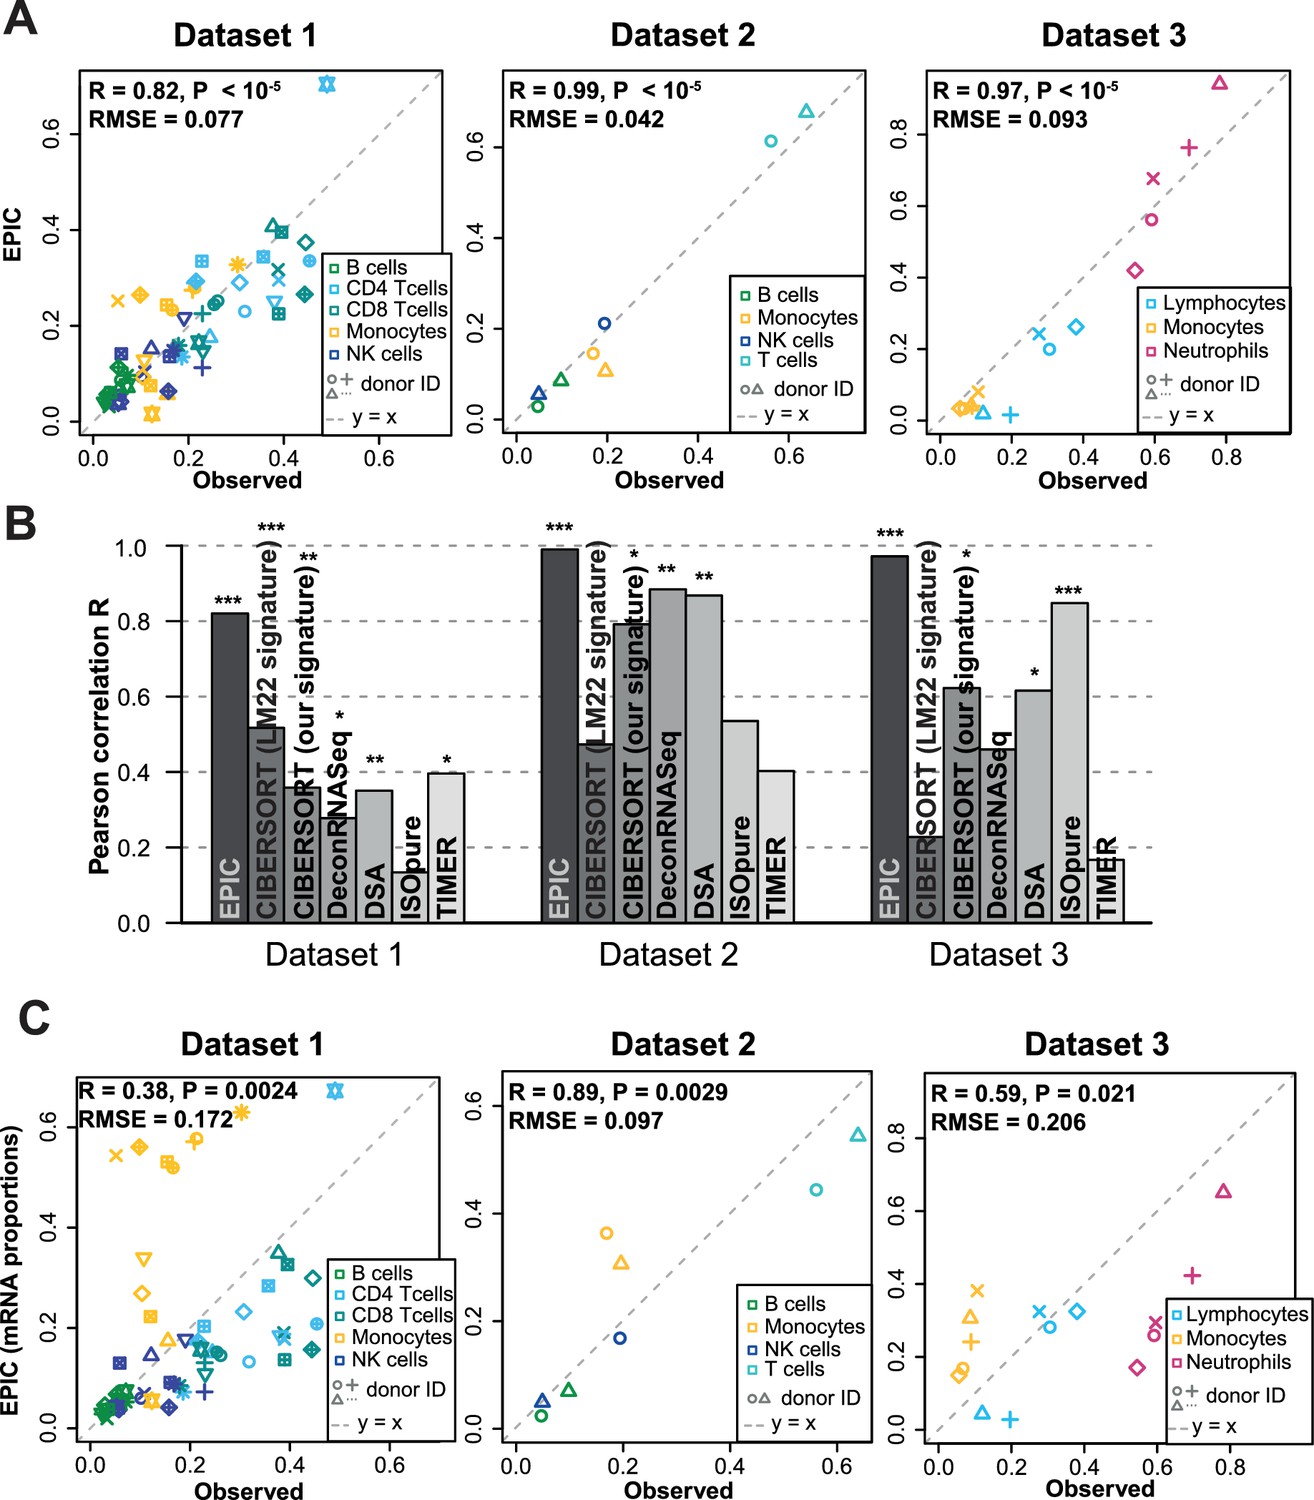
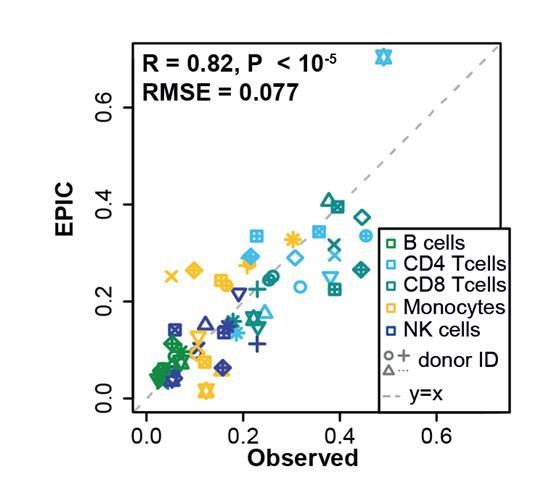
Predicting cell fractions in blood samples.
(A) Predicted vs. measured immune cell proportions in PBMC (dataset 1 (Zimmermann et al., 2016), dataset 2 (Hoek et al., 2015)) and whole blood (dataset 3 (Linsley et al., 2014)); predictions are based on the reference profiles from circulating immune cells. (B) Performance comparison with other methods. Significant correlations are indicated above each bar (*p<0.05; **p<0.01; ***p<0.001). (C) Predicted immune cells' mRNA proportions (i.e., without mRNA renormalization step) vs. measured values in the same datasets. Correlations are based on Pearson correlation; RMSE: root mean squared error. Proportions of cells observed experimentally are given in Supplementary file 3B-D.
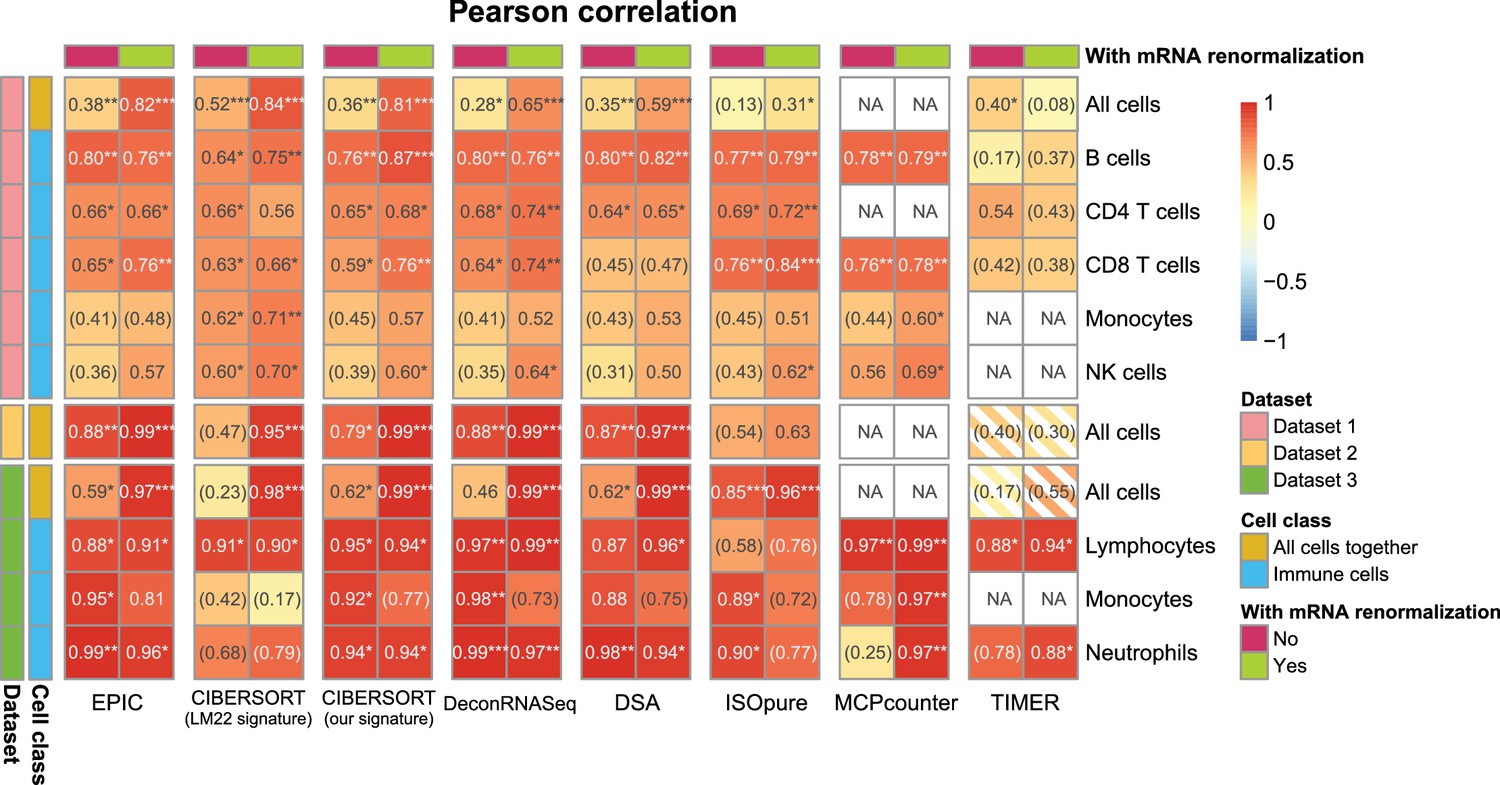
Figure 2—figure supplement 1
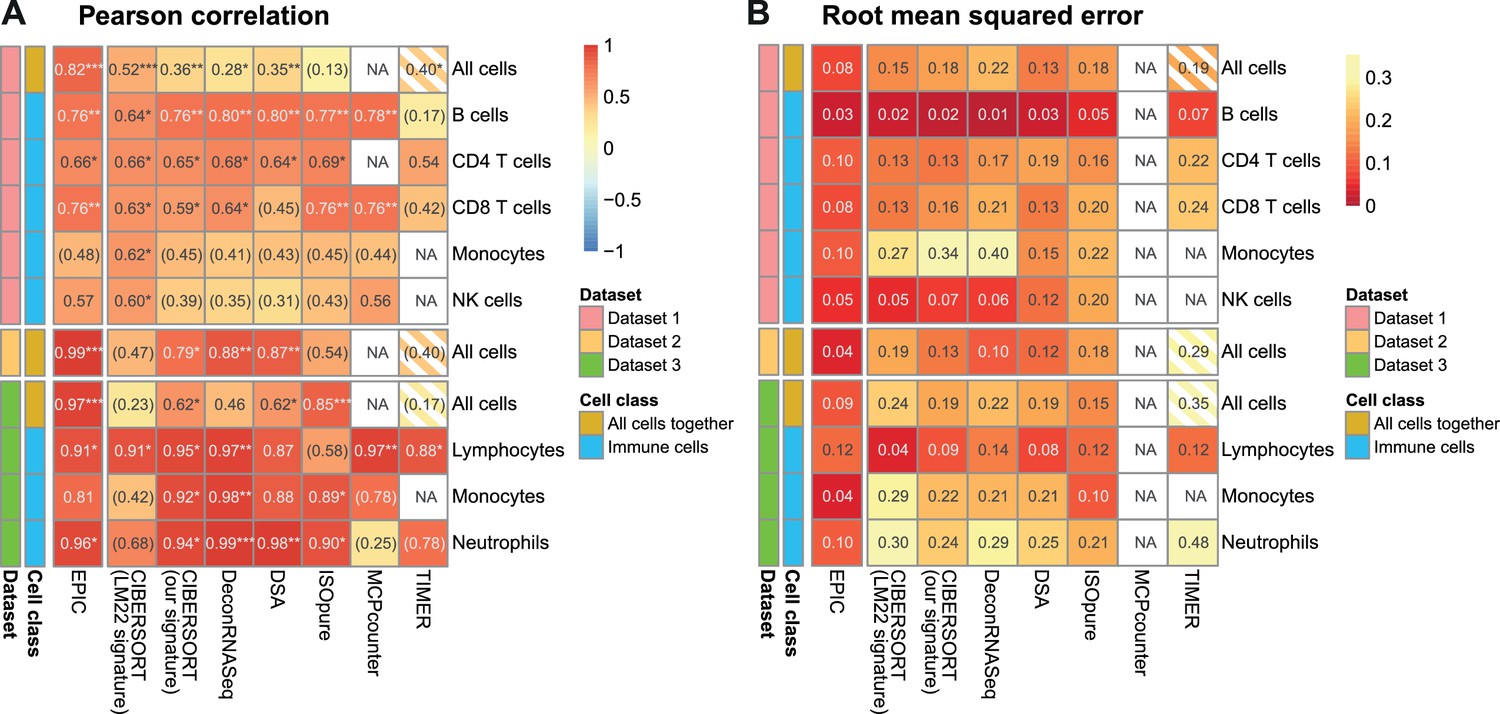
Comparison of multiple cell fraction prediction methods in blood datasets.
Heatmaps show (A) the Pearson R correlation and (B) the root mean squared error, between the cell fractions predicted by each method and the experimentally measured fractions (dataset 1 [Zimmermann et al., 2016], dataset 2 [Hoek et al., 2015], dataset 3 [Linsley et al., 2014]). Results are based either on all cell types together (noted as ‘All cells’) or for each individual cell type measured experimentally. NA's indicate cases where the cell type could not be predicted by a method. The ‘All cells’ boxes are hatched for TIMER as it does not predict the proportions from all the cell types so that the values computed there correspond to less cell types than for the other methods. For the dataset 2, as there are only two donors data, the results are only presented with all cells together (includes eight data points). In (A) the significance of the Pearson correlation is indicated by stars: *p<0.05, **p<0.01, ***p<0.001, while results with p-values above 0.1 are inside parentheses.
Figure 2—figure supplement 2
Effect of including an mRNA renormalization step for multiple cell fraction prediction methods.
Pearson R correlations are shown as in Figure 2—figure supplement 1A, showing here for each method its original result and the result if the predicted proportions are then renormalized by the mRNA per cell values as is done in EPIC.
Figure 2—figure supplement 3
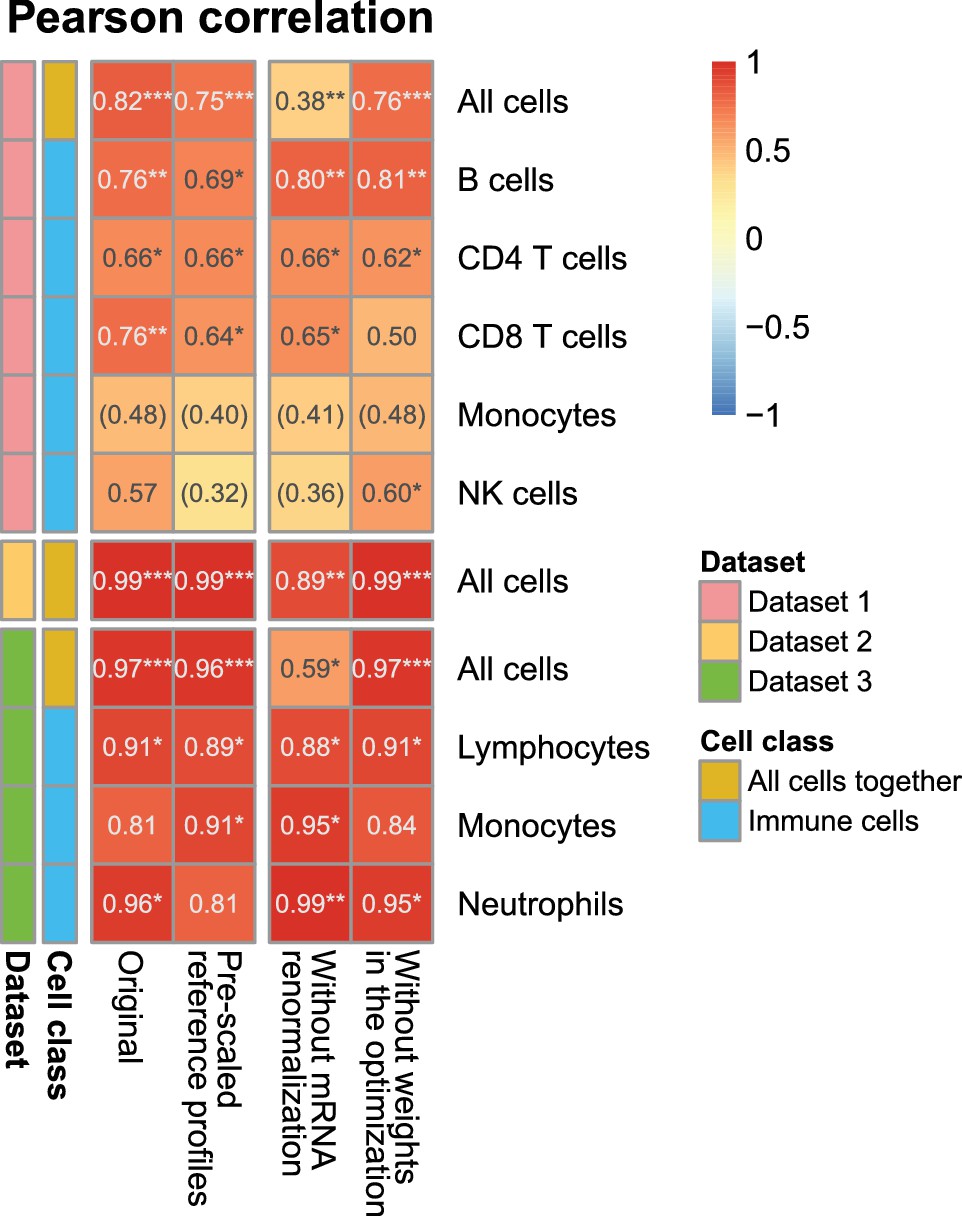
Effect of the various steps in EPIC on the prediction accuracy.
Comparison of the predictions as done in Figure 2—figure supplement 1A, for different variations from EPIC: (1) full EPIC method; (2) EPIC if the gene expression reference profiles are scaled a priori by the mRNA per cell values instead of doing the mRNA normalization step a posteriori; (3) EPIC results without the mRNA normalization step at all; (4) EPIC results when the optimization does not include any weights based on the gene expression variability from the reference profiles.
Figure 2—figure supplement 4
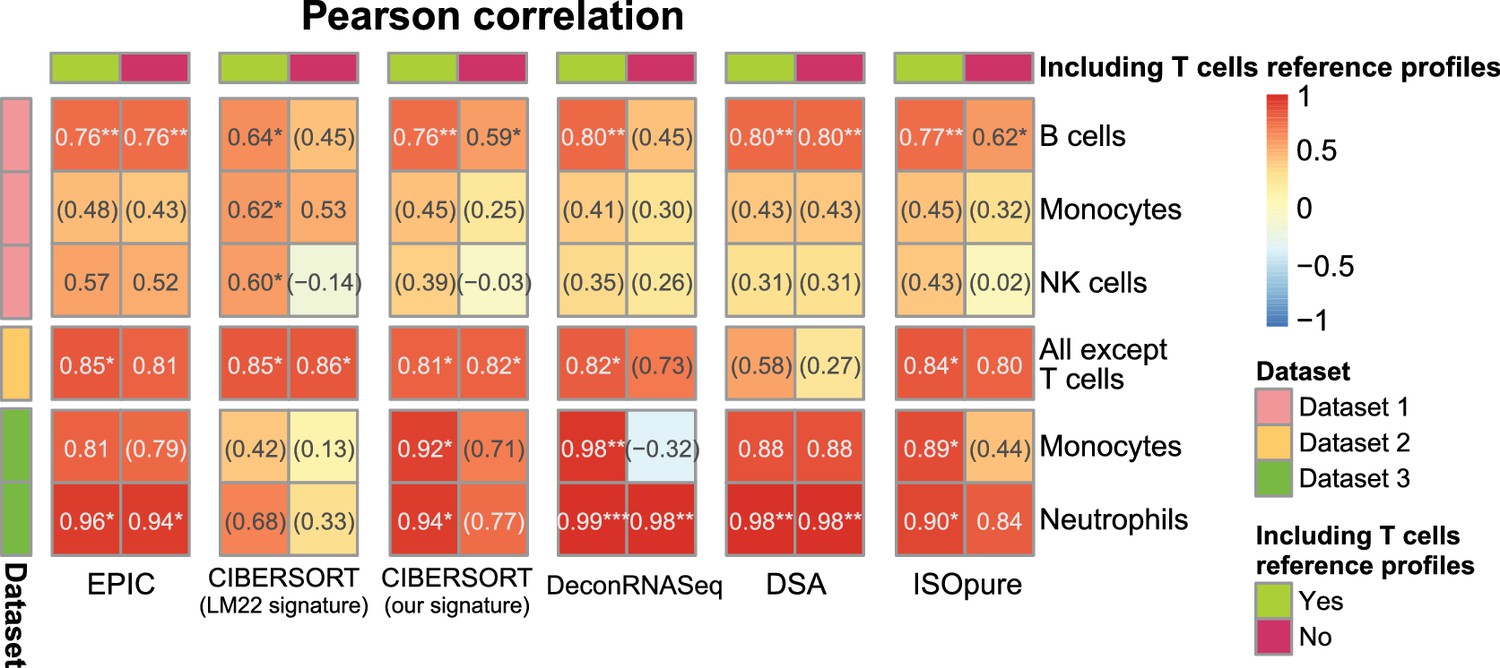
Results with or without known reference profiles for T cells for the cell fraction predictions from various methods.
Results are shown similarly than in Figure 2—figure supplement 1A. Here, we present for various cell fraction prediction methods the results considering all the immune cell types in the gene expression reference profiles followed by the results obtained when removing all references to T cell (and their subsets) from these reference profiles. Only the results of the predictions from the other immune cells than T cells are shown. The effect of removing T cells from MCPcounter and TIMER could not be tested because one cannot select the cell reference profiles or cell types to use in the input of the R codes for these methods.
Figure 3 with 1 supplement

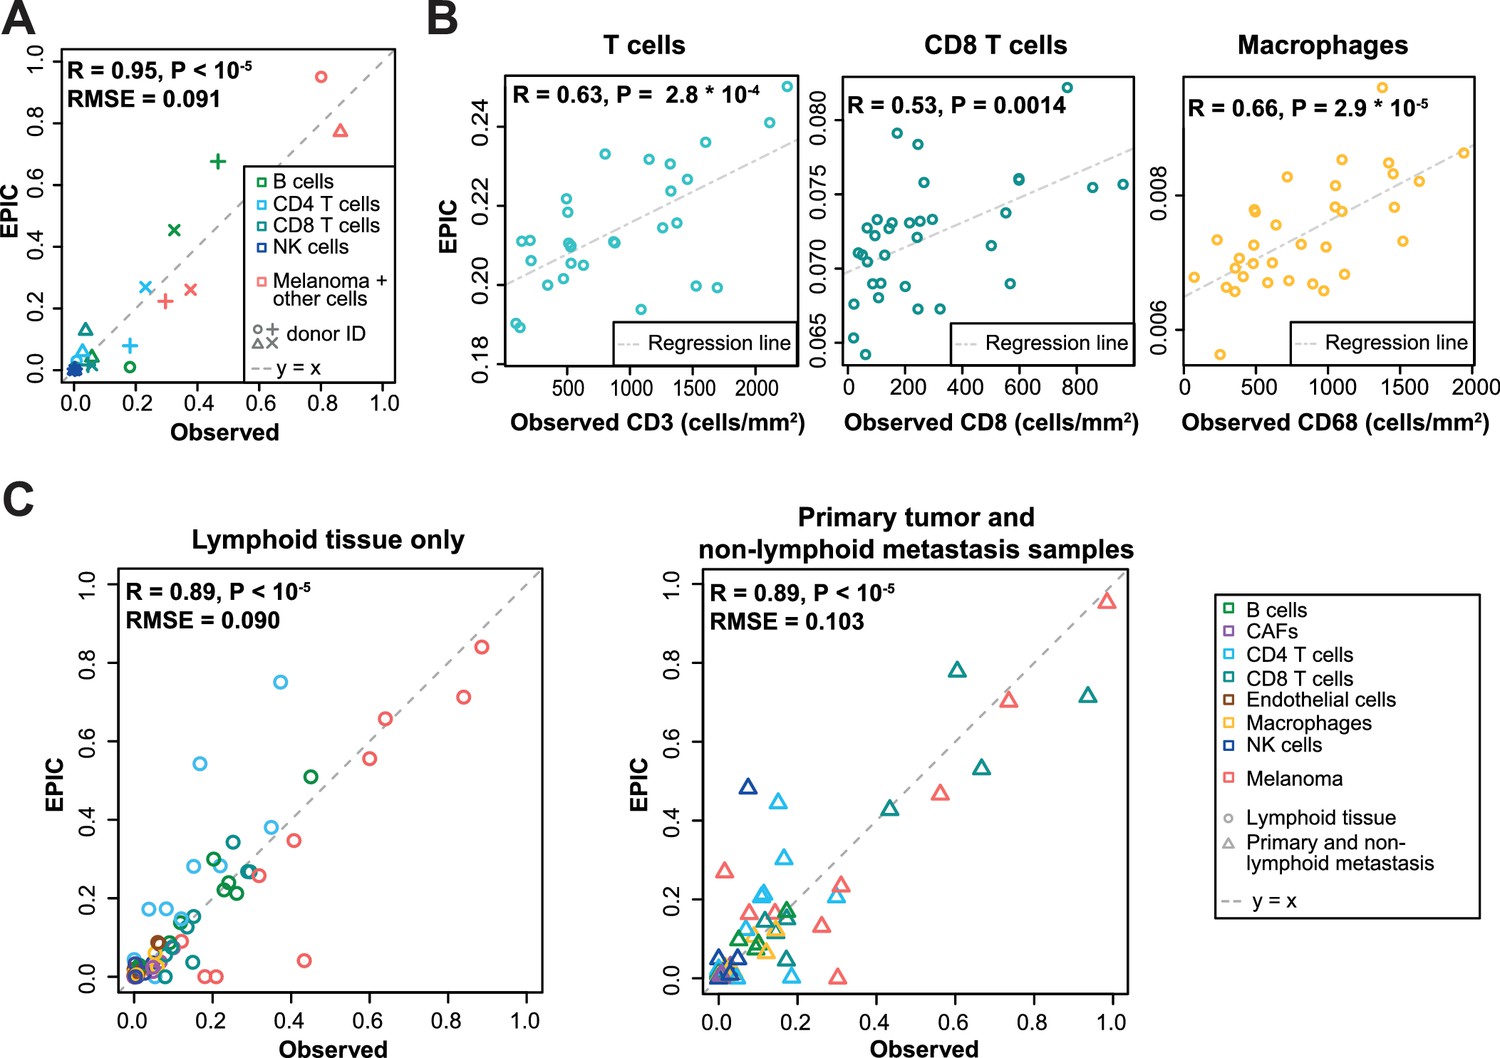
Predicting cell fractions in solid tumors with reference profiles from circulating cells.
(A) Comparison of EPIC predictions with our flow cytometry data of lymph nodes from metastatic melanoma patients. (B) Comparison with immunohistochemistry data from colon cancer primary tumors (Becht et al., 2016). (C) Comparison with single-cell RNA-Seq data (Tirosh et al., 2016) from melanoma samples either from lymphoid tissues or primary and non-lymphoid metastatic tumors. Correlations are based on Pearson correlation. Proportions of cells observed experimentally are given in Supplementary file 3A,E.
Figure 3—figure supplement 1
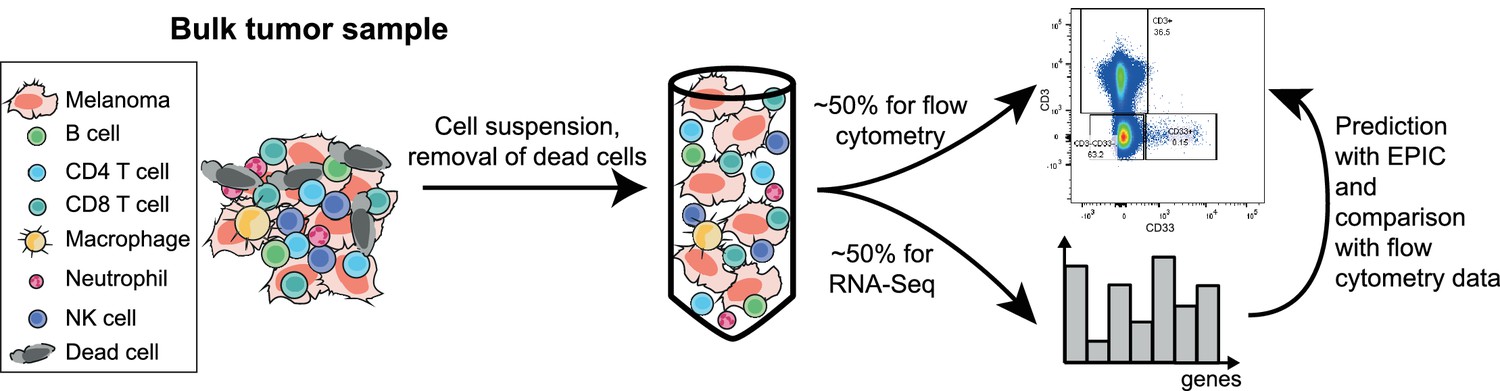
Sketch of the experiment designed to validate EPIC predictions starting from in vivo tumor samples.
https://doi.org/10.7554/eLife.26476.012
Figure 4 with 1 supplement
Predictions with reference profiles from tumor-infiltrating cells.
Same as Figure 3 but based on reference profiles built from the single-cell RNA-Seq data of primary tumor and non-lymphoid metastatic melanoma samples from Tirosh et al. (2016). (A) Comparison with flow cytometry data of lymph nodes from metastatic melanoma patients. (B) Comparison with IHC from colon cancer primary tumors (Becht et al., 2016). (C) Comparison with single-cell RNA-Seq data (Tirosh et al., 2016). For primary tumor and non-lymphoid metastasis samples, a leave-one-out procedure was used (see Materials and methods). Proportions of cells observed experimentally are given in Supplementary file 3A,E.
Figure 4—figure supplement 1
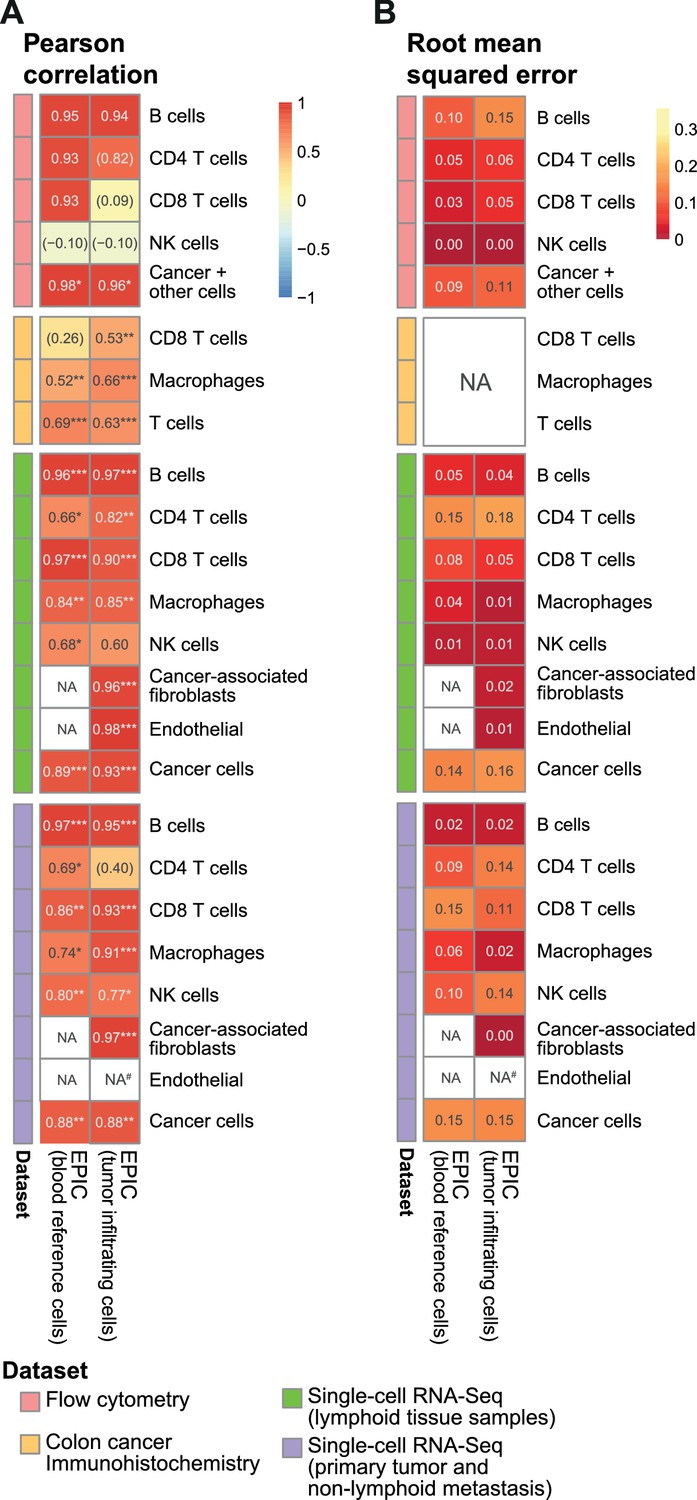
Comparison of EPIC results per cell type for gene expression reference profiles from circulating or tumor-infiltrating immune cells.
(A) Pearson R correlation and (B) RMSE between the cell fractions predicted and the experimentally measured fractions (from flow cytometry of lymph nodes from metastatic melanoma patients (this study), colorectal cancer IHC from primary tumors (Becht et al., 2016) and single-cell RNA-Seq data from melanoma (Tirosh et al., 2016). NA’s indicate cases where the cell type could not be predicted by a method. #: No predictions for endothelial cells were done in the primary tumors from single-cell RNA-seq data as only one patient had such cells and no profiles could be built through the leave-1-out procedure used for this dataset. The ‘Cancer +other cells’ correspond to cancer cells and other stromal and endothelial cells. No RMSE value can be computed for the IHC data in (B) as the measured values are not for all cells and do not reflect cell proportions. In (A) the significance of the Pearson correlation is indicated by stars: * p.value < 0.05, ** p.value < 0.01, *** p.value < 0.001, while results with p-values above 0.1 are inside parentheses.
Figure 5 with 6 supplements

Performance comparison with other methods in tumor samples.
(A) Pearson correlation R-values between the cell proportions predicted by EPIC and ISOpure and the observed proportions measured by flow cytometry or single-cell RNA-Seq (Tirosh et al., 2016), considering all cell types together (i.e., B, CAFs, CD4 T, CD8 T, endothelial, NK, macrophages and cancer cells). (B) Same analysis as in Figure 5A but considering only immune cell types (i.e., B, CD4 T, CD8 T, NK and macrophages) in order to include more methods in the comparison. (C) Analysis of ESTIMATE predictions in the single-cell RNA-Seq dataset for the sum of all immune cells, the proportion of stromal cells (cancer-associated fibroblasts) and the proportion of cancer cells (cells identified as melanoma cells in Tirosh et al.). (D) Same as Figure 5C but for EPIC predictions of immune, stromal and cancer cells. Significant correlations in (A–B) are indicated above each bar (*p<0.05; **p<0.01; ***p<0.001).
Figure 5—figure supplement 1
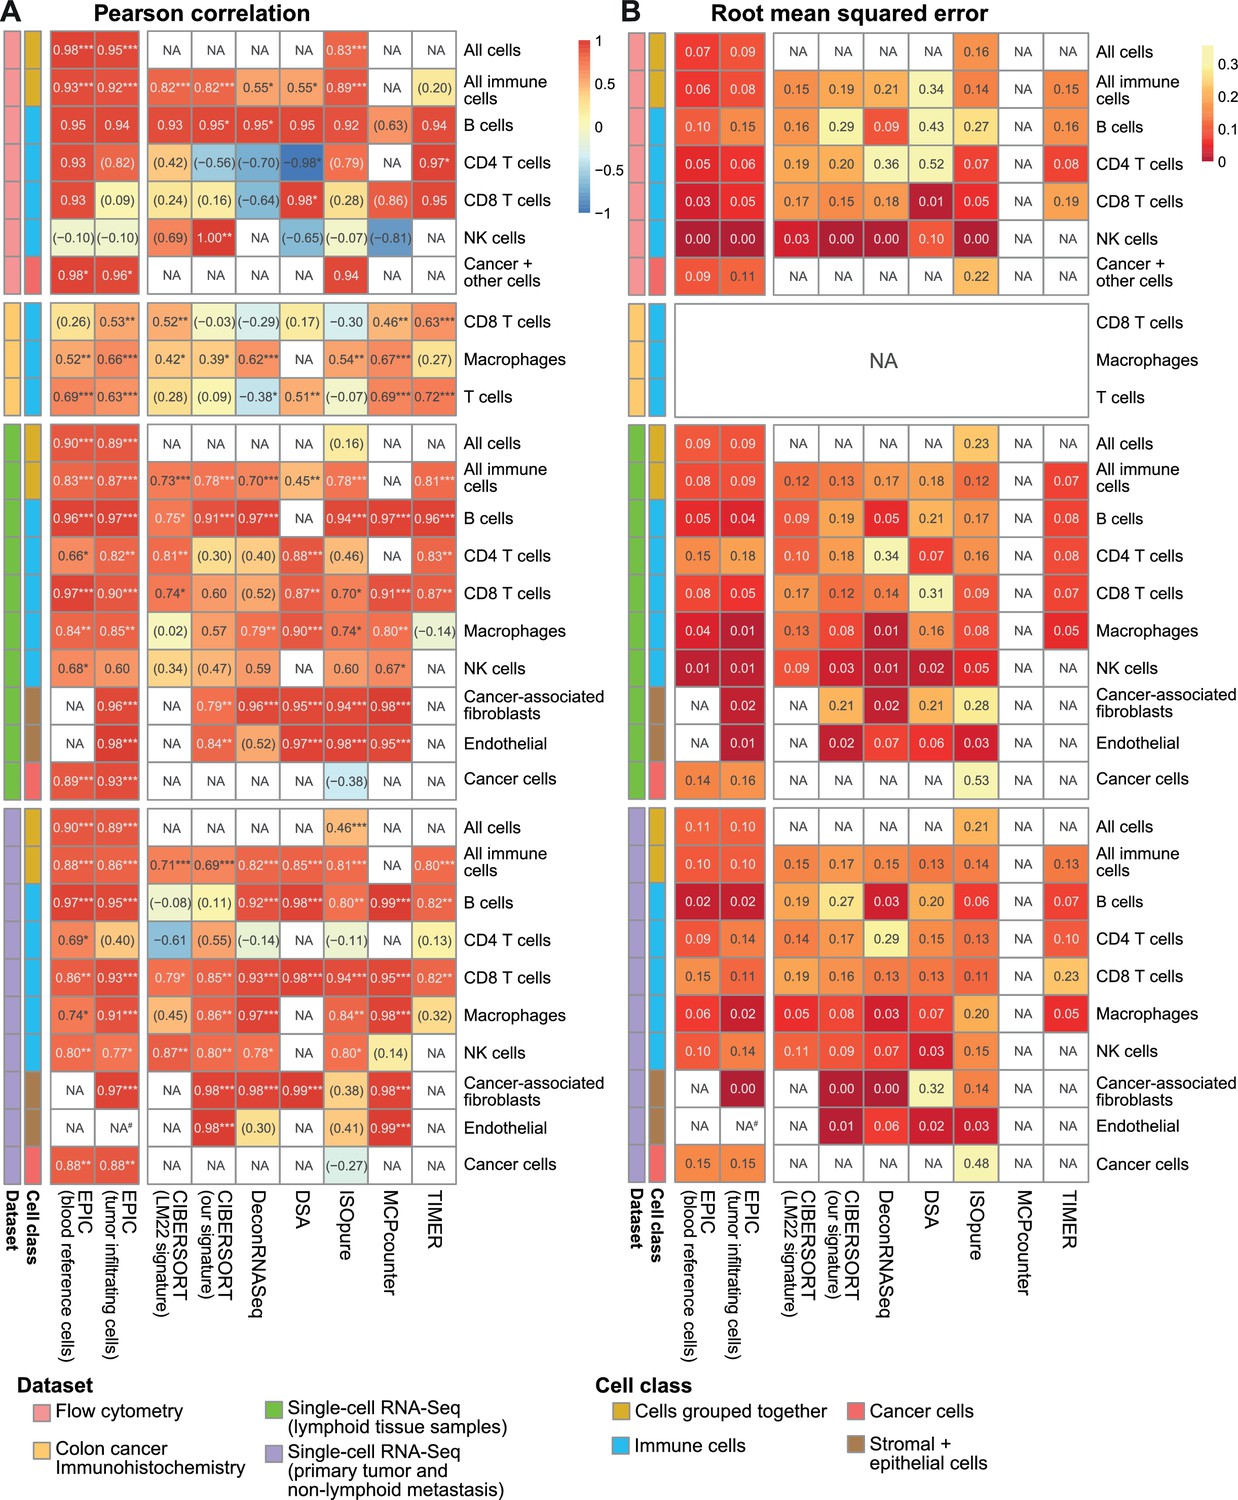
Comparison of multiple cell fraction prediction methods in tumor datasets.
(A) Pearson R correlation and (B) root mean squared error between the cell fractions predicted by each method and the experimentally measured fractions (from flow cytometry (this study), colorectal cancer immunohistochemistry (Becht et al., 2016) and single-cell RNA-Seq data (Tirosh et al., 2016). Results are based either on cell types grouped together (noted as ‘All cells’, including the immune, endothelial, stromal and cancer cells, or ‘All immune cells’, including only the immune cell types) or for each individual cell type that had been measured experimentally. NA’s indicate cases where the cell type could not be predicted by a method. #: No predictions for endothelial cells were done with EPIC in the primary tumors from single-cell RNA-seq data as only one patient had such cells and no profiles could be built through the leave-1-out procedure used for this dataset. The ‘Cancer + other cells’ correspond to cancer cells and other stromal and endothelial cells. In (A) the significance of the Pearson correlation is indicated by stars: *p<0.05, **p<0.01, ***p<0.001, while results with p-values above 0.1 are inside parentheses.
Figure 5—figure supplement 2
Comparison of cell fraction prediction methods with flow cytometry data of melanoma tumors.
(A) Comparison directly of all cell types together. When a cell type could not be predicted by a given method, this cell type is absent from the subfigure. (B) Comparison per cell type for MCP-counter as the predictions are not comparable across different cell types. CD4 T cells and melanoma cell proportions are not predicted by MCP counter. Correlation and RMSE values are available in Figure 5—figure supplement 1.
Figure 5—figure supplement 3
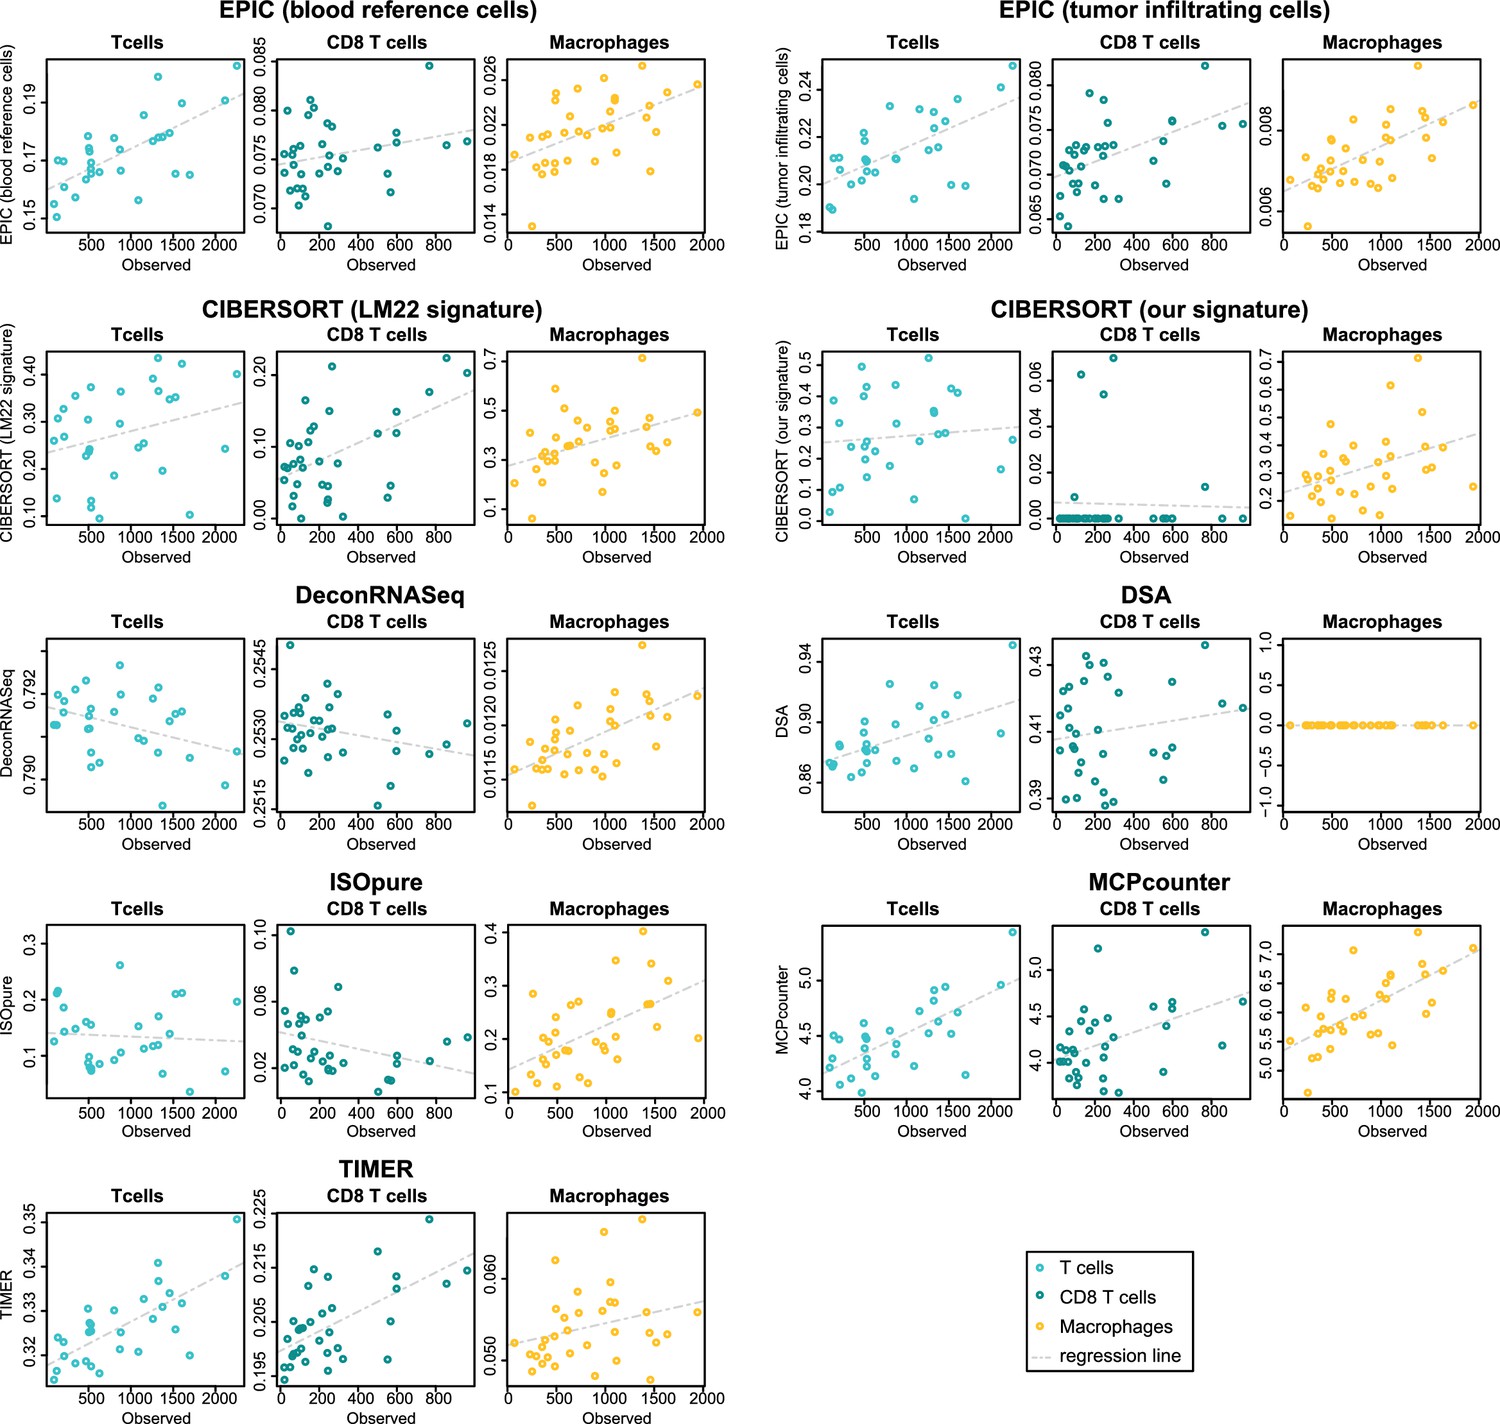
Comparison of cell fraction prediction methods with immunohistochemistry data in colon cancer data (Becht et al., 2016) for T cell, CD8 T cell and macrophage infiltration values.
Observed values are in number of cells/mm2. Correlation values are available in Figure 5—figure supplement 1.
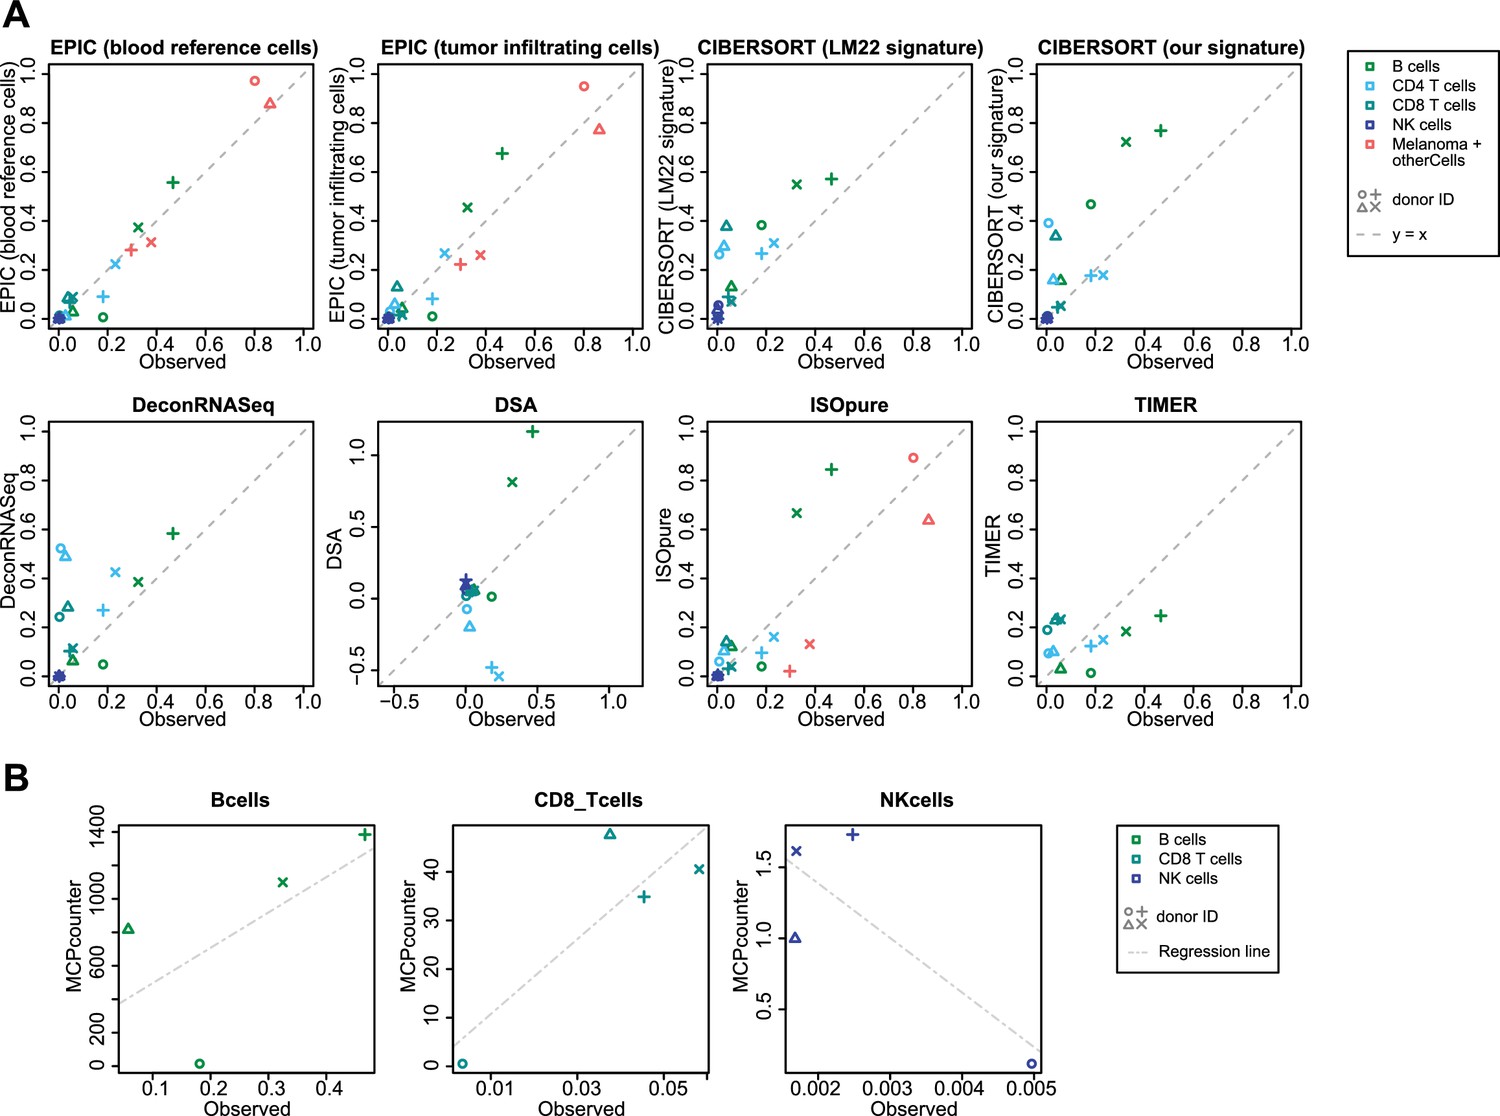
Figure 5—figure supplement 4
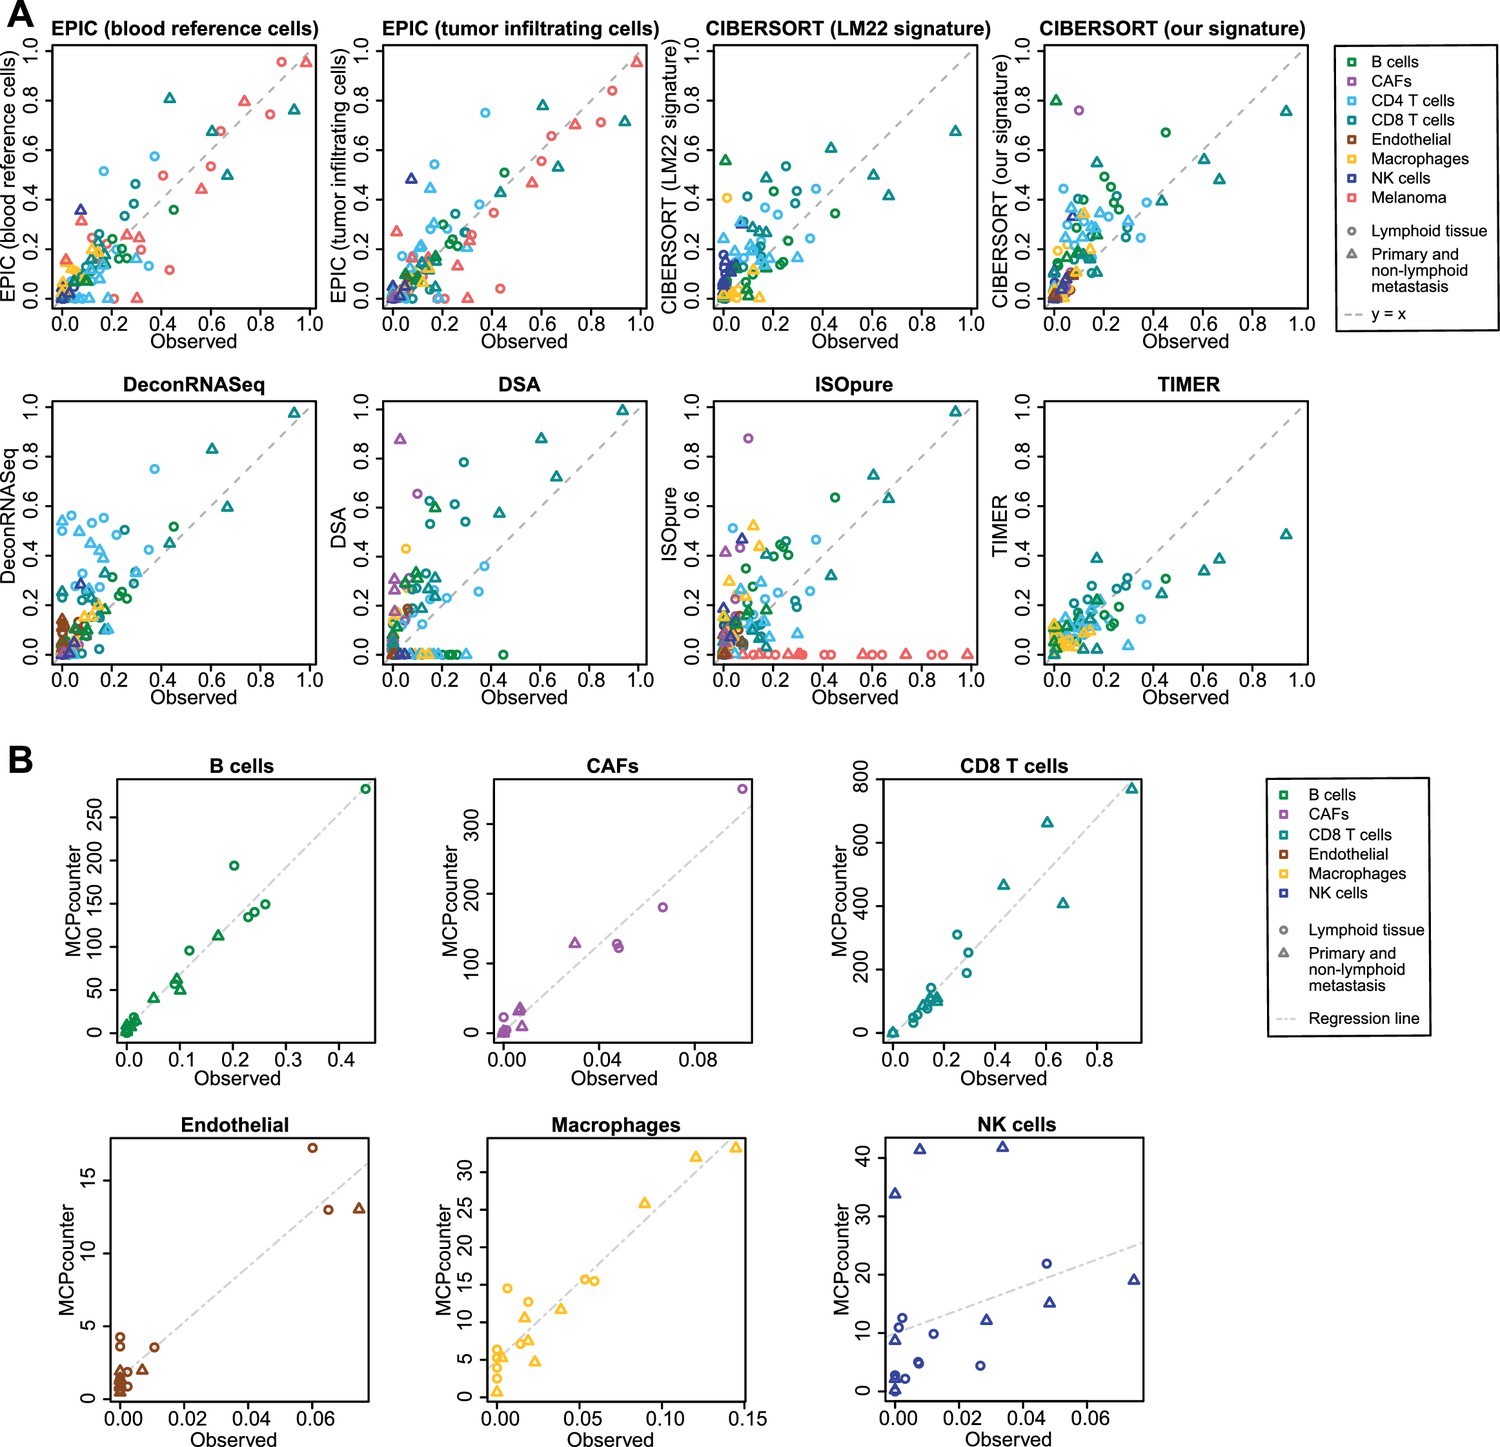
Comparison of cell fraction prediction methods with single-cell RNA-Seq data from melanoma tumors (Tirosh et al., 2016).
(A) Comparison directly of all cell types together. When a cell type could not be predicted by a given method, this cell type is absent from the subfigure. (B) Results for MCP-counter, splitting the different cell types as the predictions are not comparable across different cell types. CD4 T cells and melanoma cell proportions are not predicted by MCP counter. Correlation and RMSE values are available in Figure 5—figure supplement 1.
Figure 5—figure supplement 5
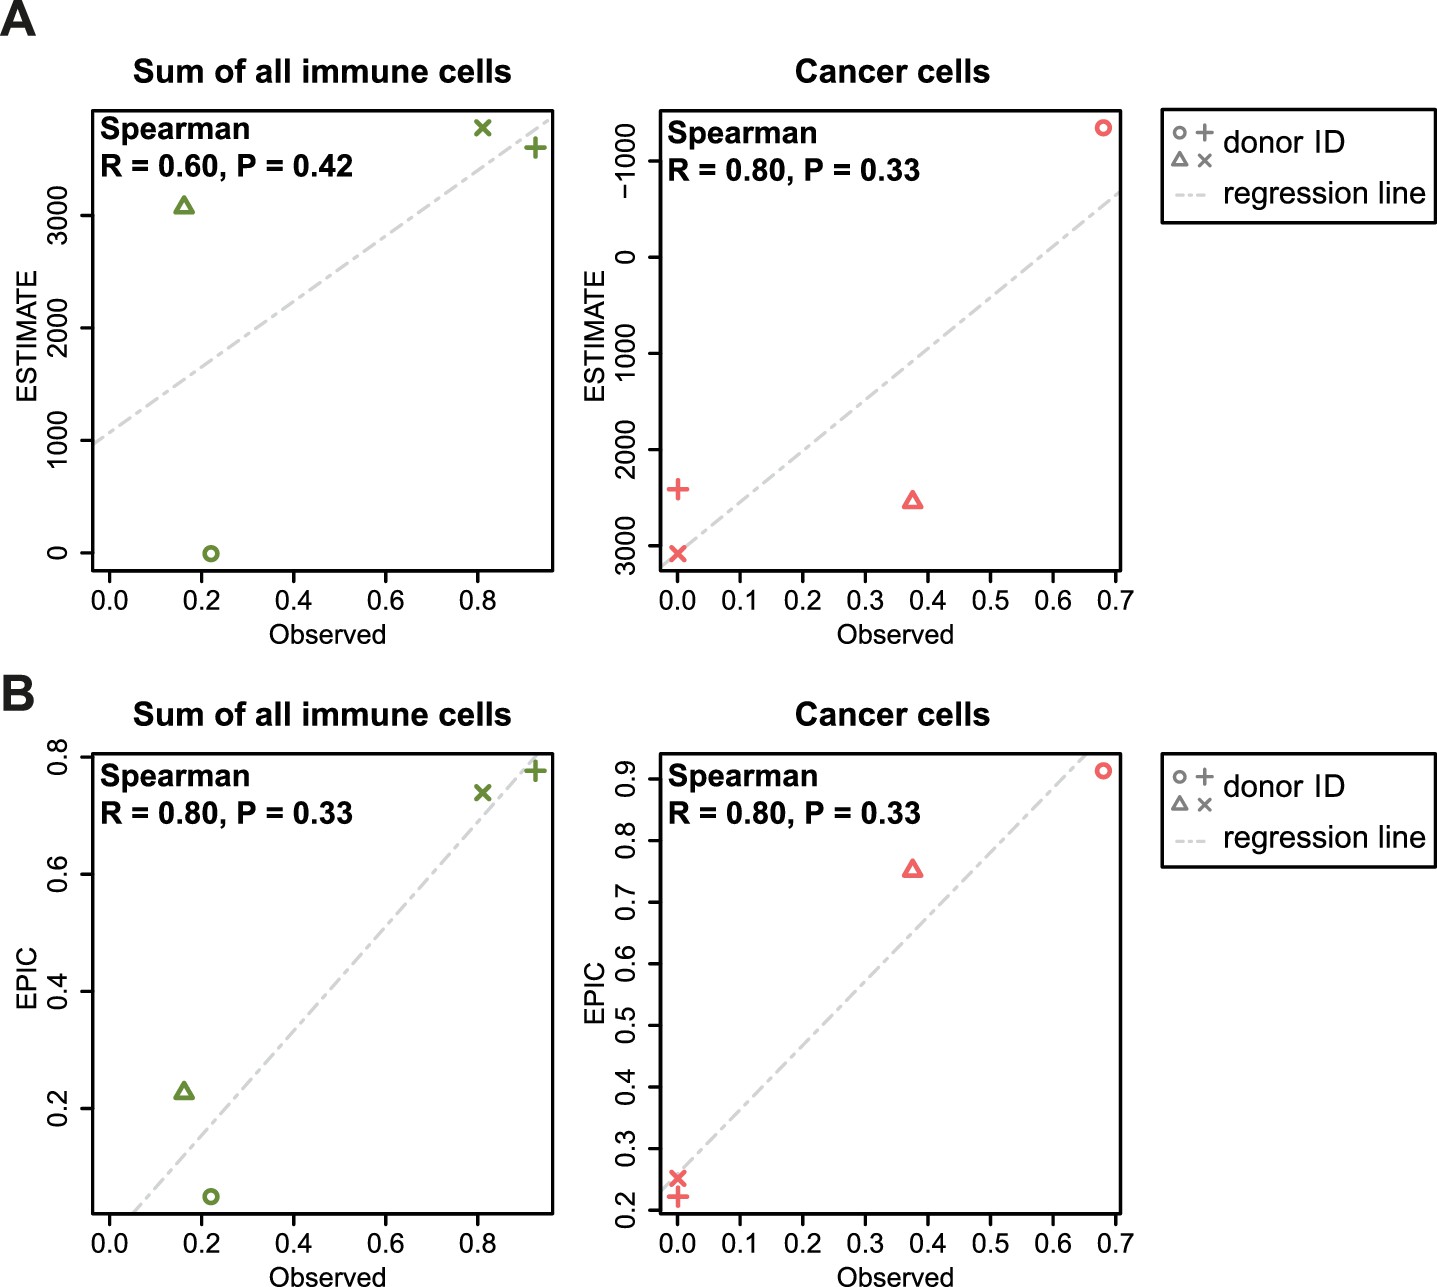
Comparison between ESTIMATE scores (A) and EPIC predictions (B) in our new flow cytometry dataset.
The predictions are compared to the observed cell proportions. ESTIMATE returns a score of global immune infiltration and thus the sum of all observed immune cells has been taken for the comparison. The observed cancer cells correspond to the melan-A + cells. Correlations between observed fractions and predictions are based on Spearman correlations.
Figure 5—figure supplement 6
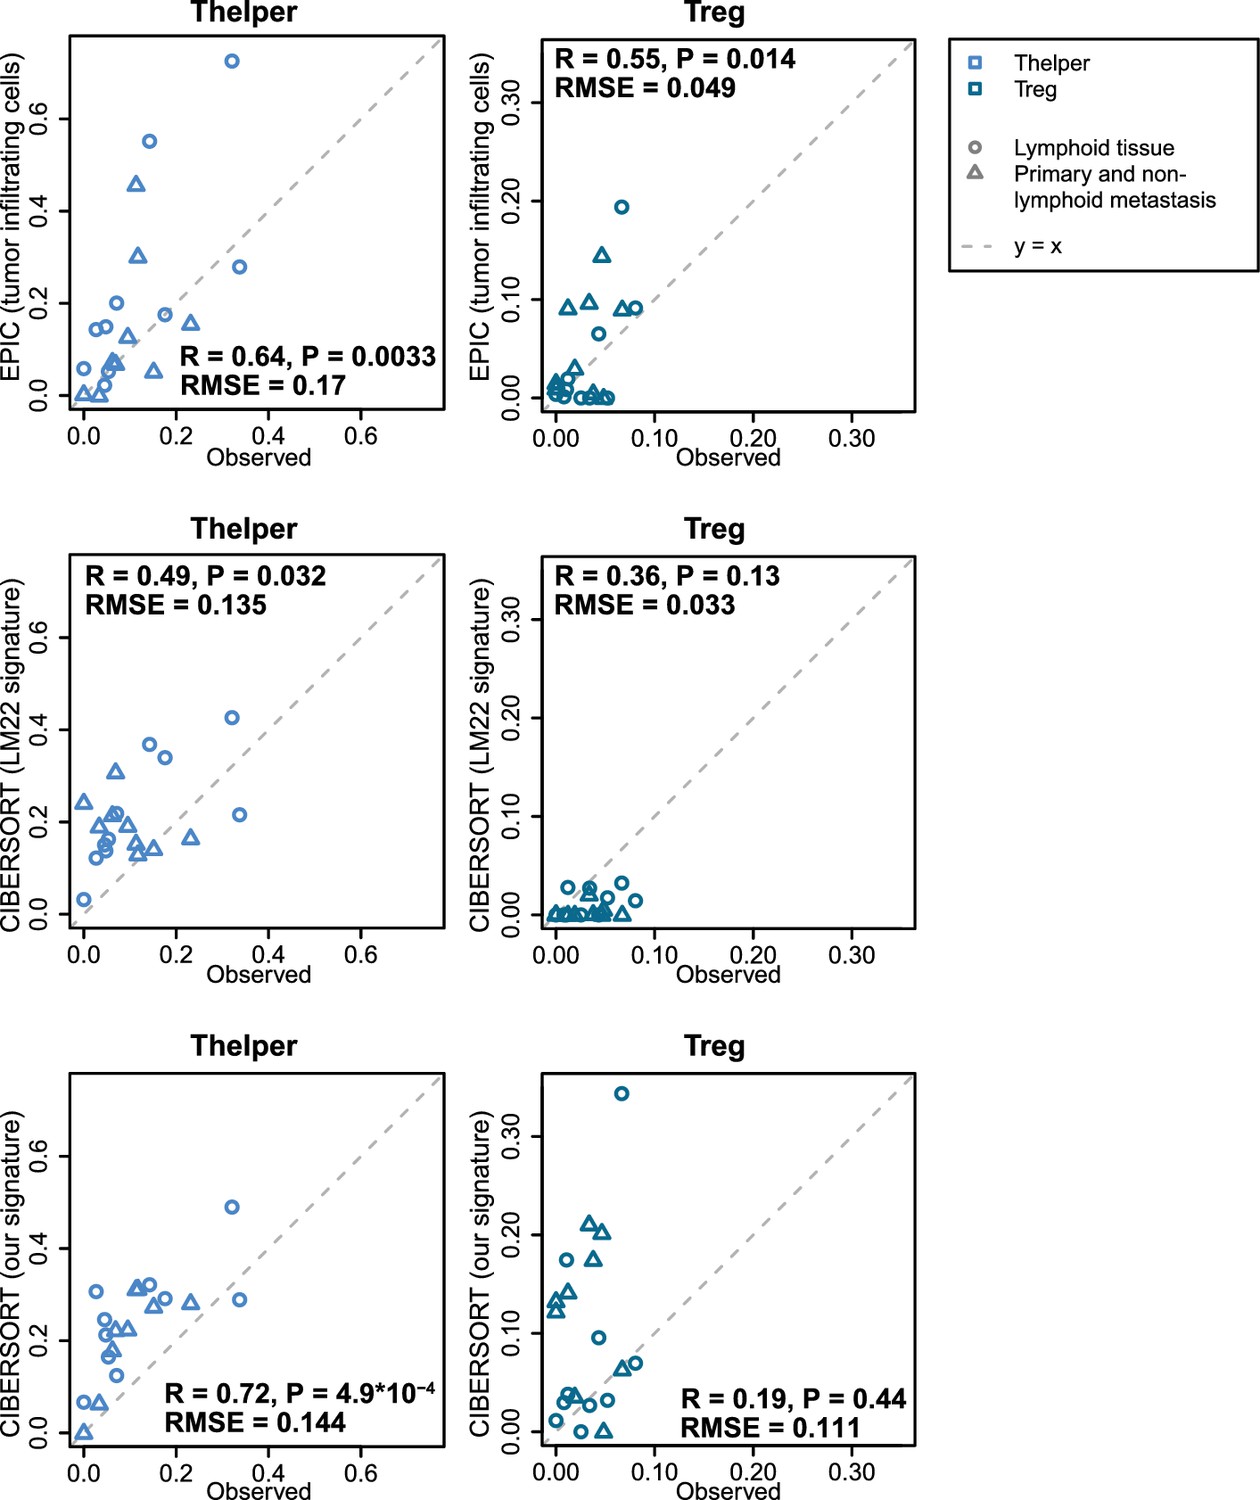
Predicting Thelper and Treg cell fractions in tumors.
The proportions of Thelper and Treg cells predicted by EPIC and CIBERSORT are compared to the proportions observed in the bulk samples reconstructed from the single-cell RNA-seq data from melanoma tumors (Tirosh et al., 2016). Pearson correlations and RMSE are indicated on the figures.
Author response image 1
Comparison between EPIC predictions and measured cell fractions in PBMC dataset from Zimmermann et al. 2016.
https://doi.org/10.7554/eLife.26476.031
Author response image 2

Comparison between the experimentally measured cell fractions and EPIC predictions, including additional cell types in: (A) our expanded flow cytometry analysis of melanoma; (B) lymph node metastasis and primary tumor melanoma data from Tirosh et al., 2016.
https://doi.org/10.7554/eLife.26476.032
Author response image 3
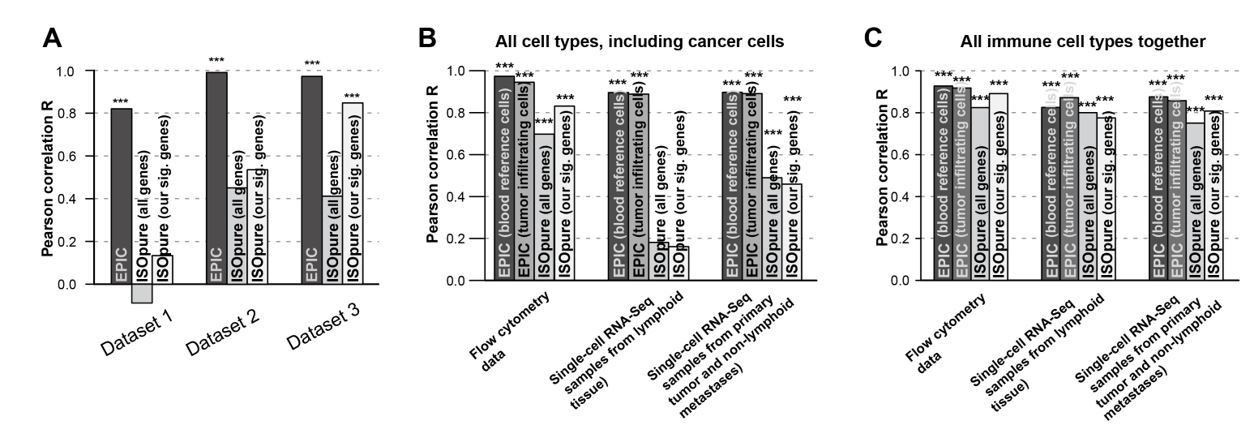
Comparison of the prediction accuracies for EPIC, ISOpure based on all genes and ISOpure based on the subset of signature genes we derived for EPIC.
(A) For all immune cell types in the blood datasets (dataset 1: Zimmermann et al. 2016; dataset2: Hoek et al. 2015; dataset 3: Linsley et al. 2014). (B) and (C) in the tumor datasets, based on all cell types, including immune, stromal and cancer cells (B), or based only on all the immune cell types (C) (flow cytometry: our new experiment; single-cell RNA-seq: data from Tirosh et al. 2016). The stars above each bar indicate if the Pearson correlation was significant (* p < 0.05; ** p < 0.01; *** p < 0.001). These figures are the same than in our manuscript Figures 2B and 5A-B but comparing different ISOpure results and EPIC ones.
Tables
Appendix 1—table 1
Gene markers used per cell type.
Only markers of cell types present in the respective reference gene expression profiles are used.
| Cell type | Genes markers |
|---|---|
| B cells | BANK1, CD79A, CD79B, FCER2, FCRL2, FCRL5, MS4A1, PAX5, POU2AF1, STAP1, TCL1A |
| CAFs | ADAM33, CLDN11, COL1A1, COL3A1, COL14A1, CRISPLD2, CXCL14, DPT, F3, FBLN1, ISLR, LUM, MEG3, MFAP5, PRELP, PTGIS, SFRP2, SFRP4, SYNPO2, TMEM119 |
| CD4 T cells | ANKRD55, DGKA, FOXP3, GCNT4, IL2RA, MDS2, RCAN3, TBC1D4, TRAT1 |
| CD8 T cells | CD8B, HAUS3, JAKMIP1, NAA16, TSPYL1 |
| Endothelial cells | CDH5, CLDN5, CLEC14A, CXorf36, ECSCR, F2RL3, FLT1, FLT4, GPR4, GPR182, KDR, MMRN1, MMRN2, MYCT1, PTPRB, RHOJ, SLCO2A1, SOX18, STAB2, VWF |
| Macrophages | APOC1, C1QC, CD14, CD163, CD300C, CD300E, CSF1R, F13A1, FPR3, HAMP, IL1B, LILRB4, MS4A6A, MSR1, SIGLEC1, VSIG4 |
| Monocytes | CD33, CD300C, CD300E, CECR1, CLEC6A, CPVL, EGR2, EREG, MS4A6A, NAGA, SLC37A2 |
| Neutrophils | CEACAM3, CNTNAP3, CXCR1, CYP4F3, FFAR2, HIST1H2BC, HIST1H3D, KY, MMP25, PGLYRP1, SLC12A1, TAS2R40 |
| NK cells | CD160, CLIC3, FGFBP2, GNLY, GNPTAB, KLRF1, NCR1, NMUR1, S1PR5, SH2D1B |
| T cells | BCL11B, CD5, CD28, IL7R, ITK, THEMIS, UBASH3A |
Appendix 2—table 1
Characteristics of the patients with metastatic melanoma and corresponding lymph node samples.
https://doi.org/10.7554/eLife.26476.029| Patient | Age (years) | Gender | Tissue |
|---|---|---|---|
| LAU125 | 59 | male | iliac lymph node |
| LAU355 | 70 | female | iliac-obturator lymph node |
| LAU1255 | 87 | male | axillary lymph node |
| LAU1314 | 81 | male | iliac-obturator lymph node |
Additional files
-
Supplementary file 1
Gene expression reference profiles, built from TPM (transcripts per million) normalized RNA-Seq data of immune cells sorted from blood as described in the Materials and methods: ‘Reference gene expression profiles from circulating cells’.
The file includes two sheets: (A) the reference gene expression values; (B) the gene variability relating to the reference profile. Columns indicate the reference cell types; rows indicate the gene names.
- https://doi.org/10.7554/eLife.26476.022
-
Supplementary file 2
Gene expression reference profiles built from tumor-infiltrating cells obtained from TPM normalized single-cell RNA-Seq data as described in the Materials and methods: ‘Reference profiles from tumor-infiltrating cells’.
The file includes two sheets: (A) the reference gene expression values; (B) the gene variability relating to the reference profile. Columns indicate the reference cell types; rows indicate the gene names.
- https://doi.org/10.7554/eLife.26476.023
-
Supplementary file 3
Proportion of cells measured in the different datasets: (A) this study; (B) dataset 1 (Zimmermann et al., 2016); (C) dataset 2 (Hoek et al., 2015); (D) dataset 3 (Linsley et al., 2014); and (E) single-cell RNA-Seq dataset (Tirosh et al., 2016).
The ‘Other cells’ type corresponds always to the rest of the cells that were not assigned to one of the given cell types from the tables.
- https://doi.org/10.7554/eLife.26476.024
-
Transparent reporting form
- https://doi.org/10.7554/eLife.26476.025
Download links
A two-part list of links to download the article, or parts of the article, in various formats.
Downloads (link to download the article as PDF)
Open citations (links to open the citations from this article in various online reference manager services)
Cite this article (links to download the citations from this article in formats compatible with various reference manager tools)
Simultaneous enumeration of cancer and immune cell types from bulk tumor gene expression data
eLife 6:e26476.
https://doi.org/10.7554/eLife.26476


