Sleep homeostasis regulated by 5HT2b receptor in a small subset of neurons in the dorsal fan-shaped body of drosophila
- Peking University, China
- National Institute of Biological Sciences, China
- Nanjing Medical University, China
Figures
Figure 1 with 4 supplements
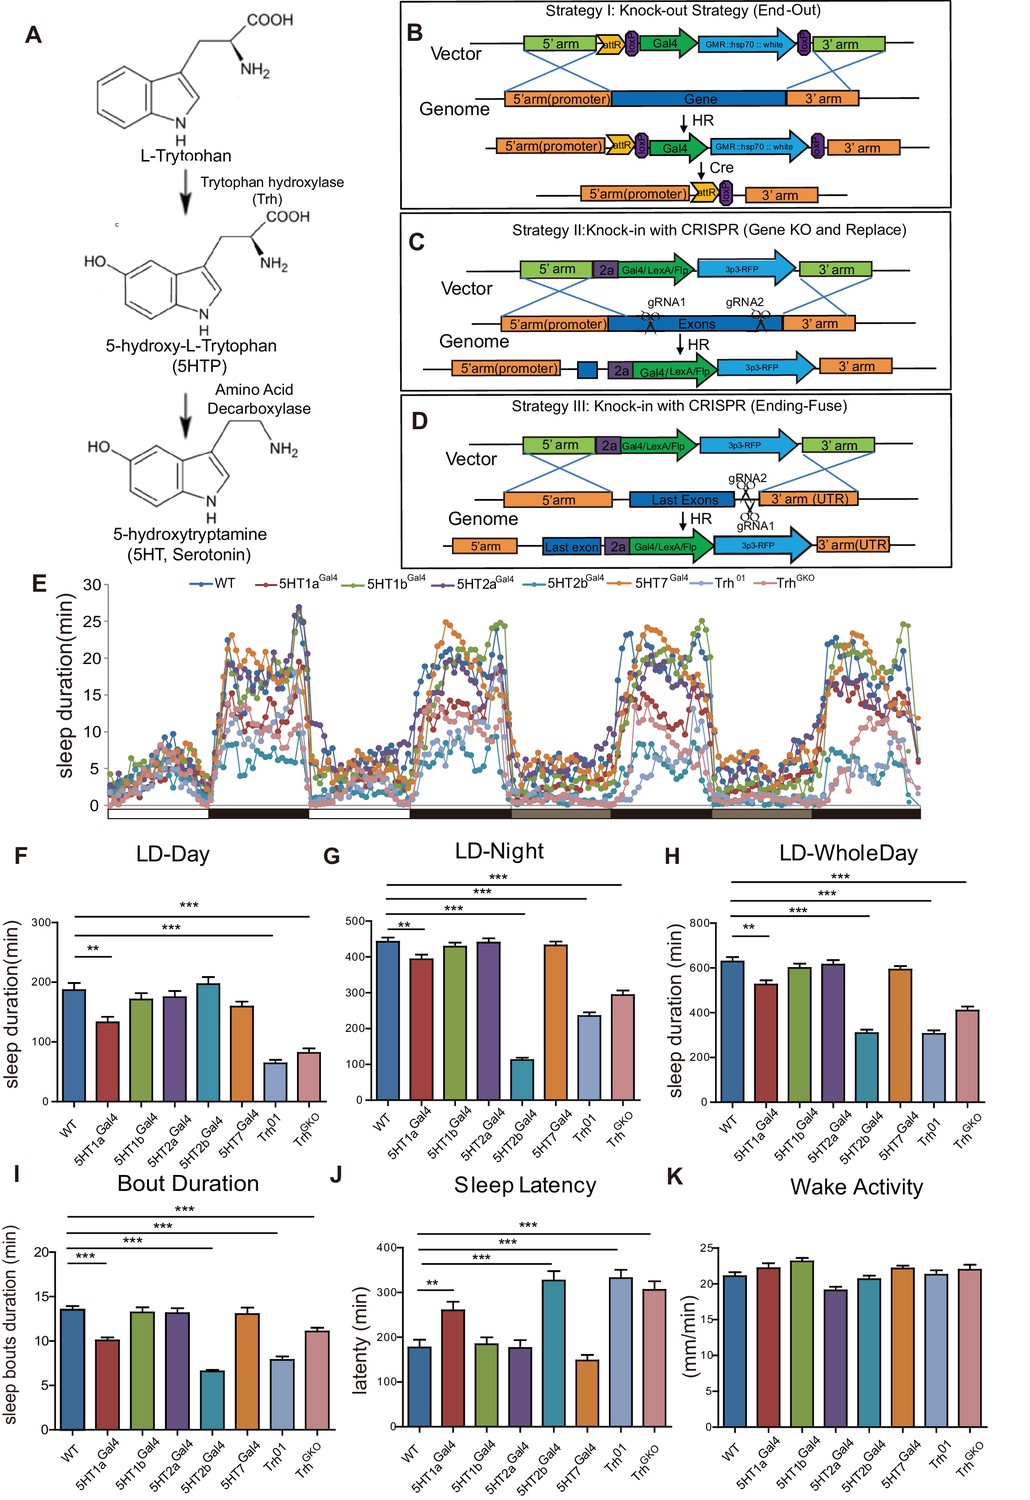
Sleep in Trh and 5-HT receptor mutants.
(A) 5-HT synthesis in the brain. (B–D) Three strategies used in constructing drosophila lines. (B) The end-out method. All five receptor mutants were constructed by this method. (C and D) The CRISPR/Cas9 system was used to delete target DNA and/or to insert DNA. Gal4, Flp or LexA were introduced at specific locations, such as the beginning of the first exon (C), or the end of the open reading frame (ORF) with the 2a peptide as linker (D). (E) Sleep profiles over four consecutive days, the first two days were in 12 hr light/12 hr dark (LD) cycle, and last two days in constant darkness (DD). (F–H) Trh, 5HT1a and 5HT2b mutant flies slept less than wild type (wt) controls. Sleep bout durations in LD are shown for: nighttime (F), daytime (G) and whole 24 hour day (H). (I) Sleep bout duration was reduced in Trh01, TrhGKO, 5HT1a and 5HT2b mutants during LD. (J) Latency after light-off was delayed in Trh01, TrhGKO, 5HT1a and 5HT2b mutants. (K) All mutants showed normal activity when awake, as measured by locomoter distance per waking min. (B–K, mean ± SEM, n = 48 for WT, n = 37 for 5HT1a mutants, n = 48 for 5HT1b mutants, n = 45 for 5HT2a mutants, n = 40 for 5HT2b mutants, n = 48 for 5HT7 mutants, n = 43 for Trh01 mutants, and n = 48 for TrhGKO mutant).
Figure 1—figure supplement 1
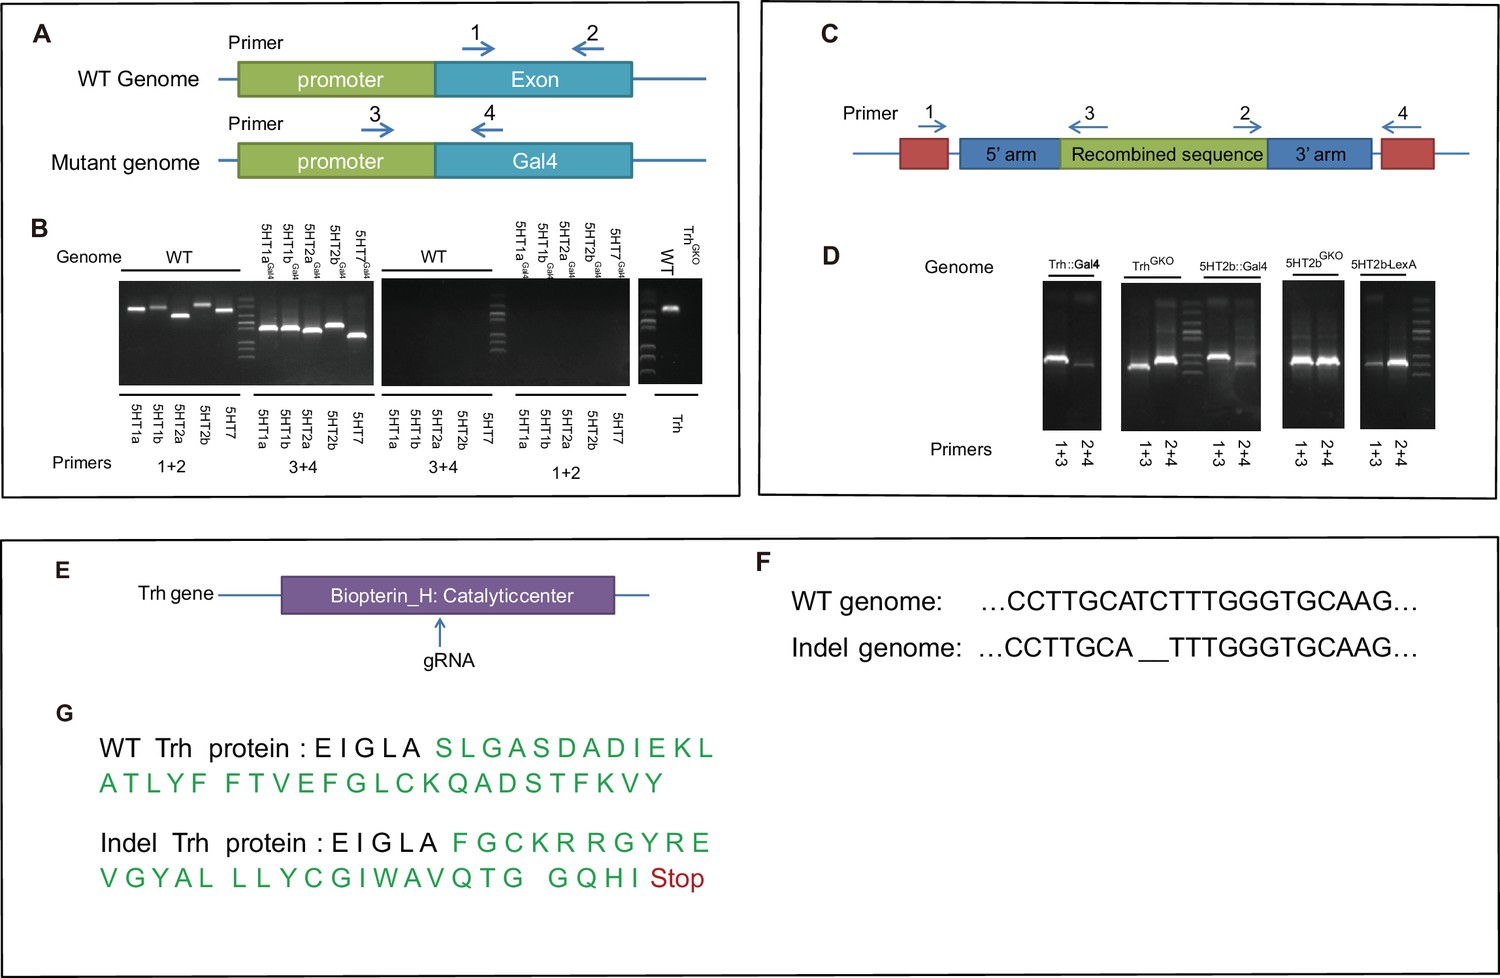
Genotype confirmation for constructed lines.
(A) Schematic illustration of wt and mutant genomes, and the PCR primers used to detect inserted sequences. (B) PCR confirmation of five serotonin receptor mutants. (C) Schematic illustration of wt and KI genomes, and the PCR primers used to detect inserted sequences. (D) PCR confirmation of the completed arms retained after homologous recombination in KI flies. (E) Guide RNA targets the catalytic center of Trh. (F) Sequencing results indicated deletion of two base pairs (bp) of the Trh gene. (G) Indel-caused nonsense mutation and early translational stop in the Trh protein.
Figure 1—figure supplement 2
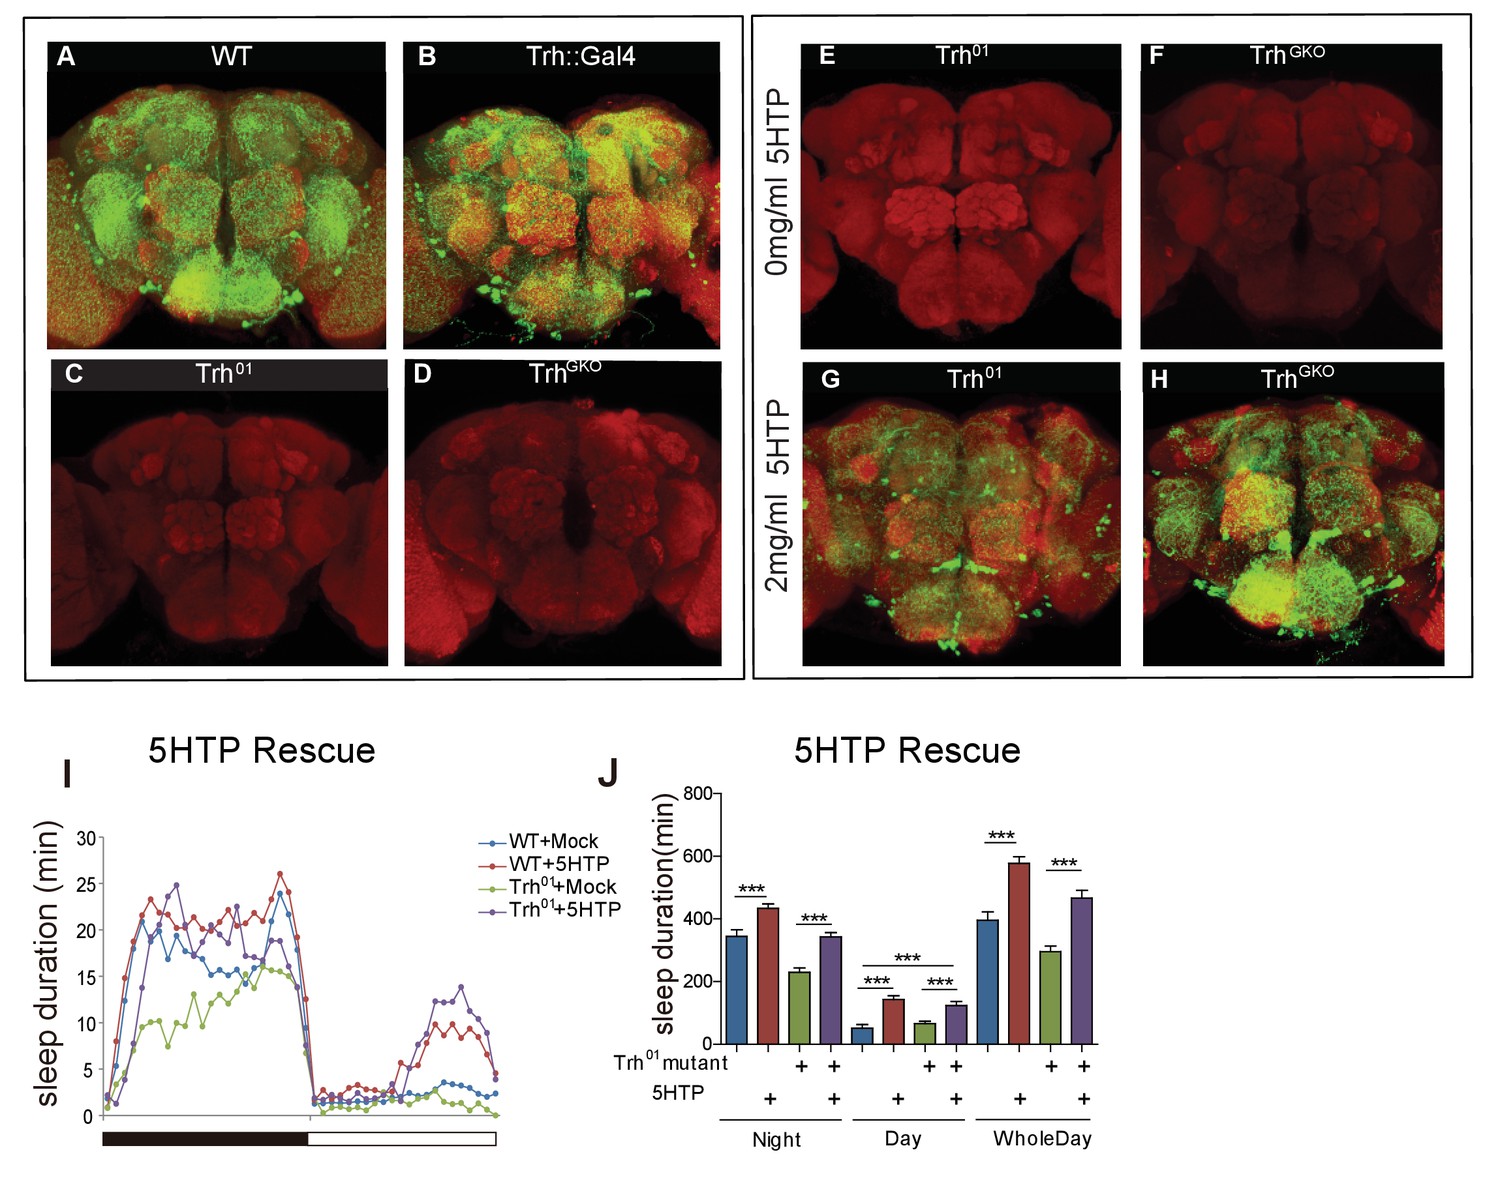
5HTP restored serotonin expression and behavioral defects in Trh mutant flies.
(A–D) Brains of wt and Trh mutant flies immunostained with an anti-serotonin antibody (green) and the neuropil marker NC82 antibody (red). (A) wt. (B) a Trh::Gal4 homozygous knock-in fly. (C) A Trh01 homozygous mutant. (D) A TrhGKO homozygous mutant. (E–H) Brains of Trh mutant flies immunostained with an anti-serotonin antibody (green) and NC82 (red). (E) Trh01 mutant. (F) TrhGKO mutant. (G) Trh01 mutant with 5HTP feeding for 3 days. (H) TrhGKO mutant with 5HTP feeding for 3 days. (I and J) Two mg/ml feeding of 5HTP promoted sleep in wt flies and rescued sleep duration time in Trh01. (I) Sleep profile, (J) Statistical analysis (mean ± SEM, n = 24 for each group). One-way ANOVA was used to detect statistical difference between the different genotypes. *p<0.05, **p<0.01, ***p<0.001.
Figure 1—figure supplement 3

Sleep phenotype of female flies.
(A–C) Trh, 5HT1a and 5HT2b mutant flies slept less than wt controls. Sleep in DD: subjective daytime (A), subjective nighttime (B) and wholeday (C). (D) Both the Trh01 mutant and the 5HT2b mutant flies exhibited shorter sleep bout duration in the subjective daytime of DD (C). (E–F) 5HT1a, 5HT2b, and Trh mutant flies showed shorter sleep bout duration in the subjective nighttime and the whole day of DD. One-way ANOVA detected significant effect: **p<0.01, ***p<0.001.
Figure 1—figure supplement 4
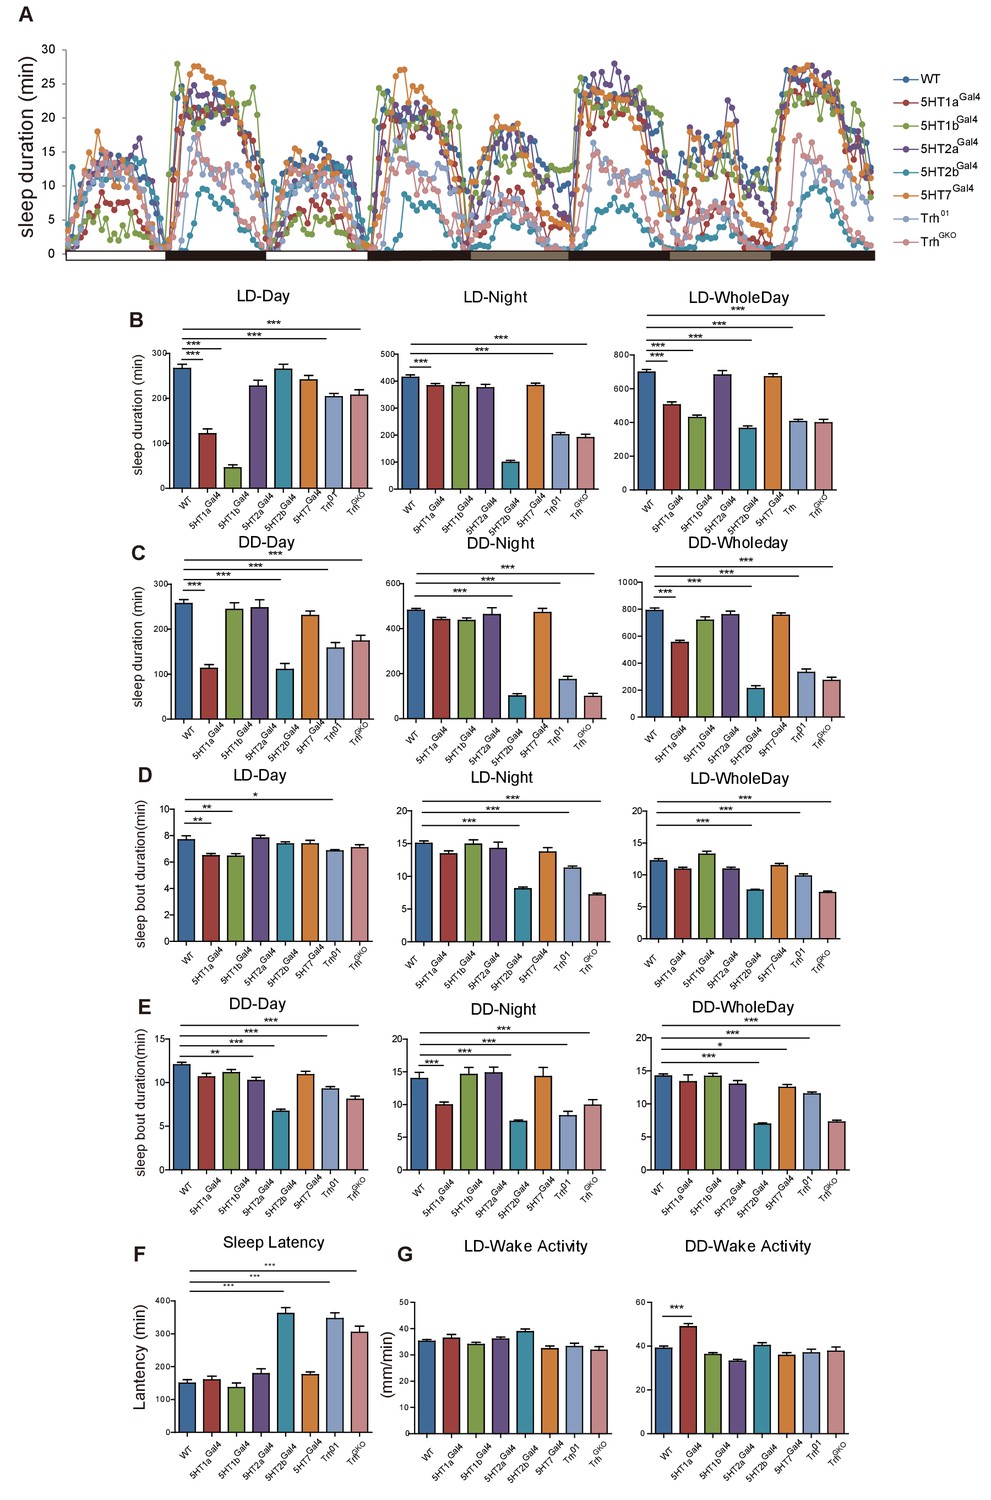
Sleep in Trh and 5-HT receptor male mutant flies.
(A) Sleep profiles over four consecutive days, the first two days were in 12-12 hr LD cycle, and the last two days in DD. (B) Trh, 5HT1a, 5HT1b and 5HT2b mutant flies slept less than wt controls in LD. (C) Trh, 5HT1a and 5HT2b mutant flies slept less than wt controls in DD. (D and E) Sleep bout duration was reduced in Trh01, TrhGKO, 5HT1a and 5HT2b mutants. (F) Delayed latency occurred in Trh01, TrhGKO and 5HT2b mutants. (G) All mutants showed normal activities when awake, as measured by locomoter distance per waking min. (B–G mean ± SEM, n = 42 for WT, n = 33 for 5HT1a mutants, n = 36 for 5HT1b mutants, n = 26 for 5HT2a mutants, n = 44 for 5HT2b mutants, n = 45 for 5HT7 mutants, n = 39 for Trh01 mutants, and n = 41 for TrhGKO mutants. One-way ANOVA was used to detect statistical difference: *p<0.05, **p<0.01, ***p<0.001.)
Figure 2 with 3 supplements

Sleep homeostasis in Trh and 5-HT receptor mutants.
(A) Trh and 5HT2b mutant flies regained a lower percentage of lost sleep time than wt after 12-hr overnight sleep deprivation. Other receptor mutants showed normal recovery rate after sleep deprivation. (B) Statistical analysis of sleep rebound after 24-hr recovery (mean ± SEM, n = 39 for wt, n = 38 for 5HT1a mutants, n = 38 for 5HT1b mutants, n = 38 for 5HT2a mutants, n = 45 for 5HT2b mutants, n = 47 for 5HT7 mutants, n = 44 for Trh01 mutants, and n = 42 for TrhGKO mutants, respectively). (C) Sleep recovery rate after sleep deprivation. Three-day feeding of 2 mg/ml 5HTP did not change sleep recovery in wt flies, but rescued sleep rebound in Trh01 and TrhGKO flies. (D) Statistical analysis (mean ± SEM, n = 47 for wt with H2O, n = 34 for Trh01 with H2O, n = 34 for TrhGKO with H2O, n = 48 for wt with 5HTP, n = 36 for Trh01 with 5HTP, and n = 45 for TrhGKO with 5HTP). (E–G) Sleep profiles after thermogenetical activation of dopaminergic neurons in wt (E), Trh mutant (F), or 5HT2b mutant flies (G). (H) Sleep loss during neural activation. (I) Sleep gain over 24 hr after thermogenetically induced sleep deprivation. (J) Statistical analysis of sleep rebound after 24-hr recovery. (E–J, n = 32–48 for each strain). One-way ANOVA was used to detect statistical difference between different genotypes. *p<0.05, **p<0.01, ***p<0.001.
Figure 2—figure supplement 1
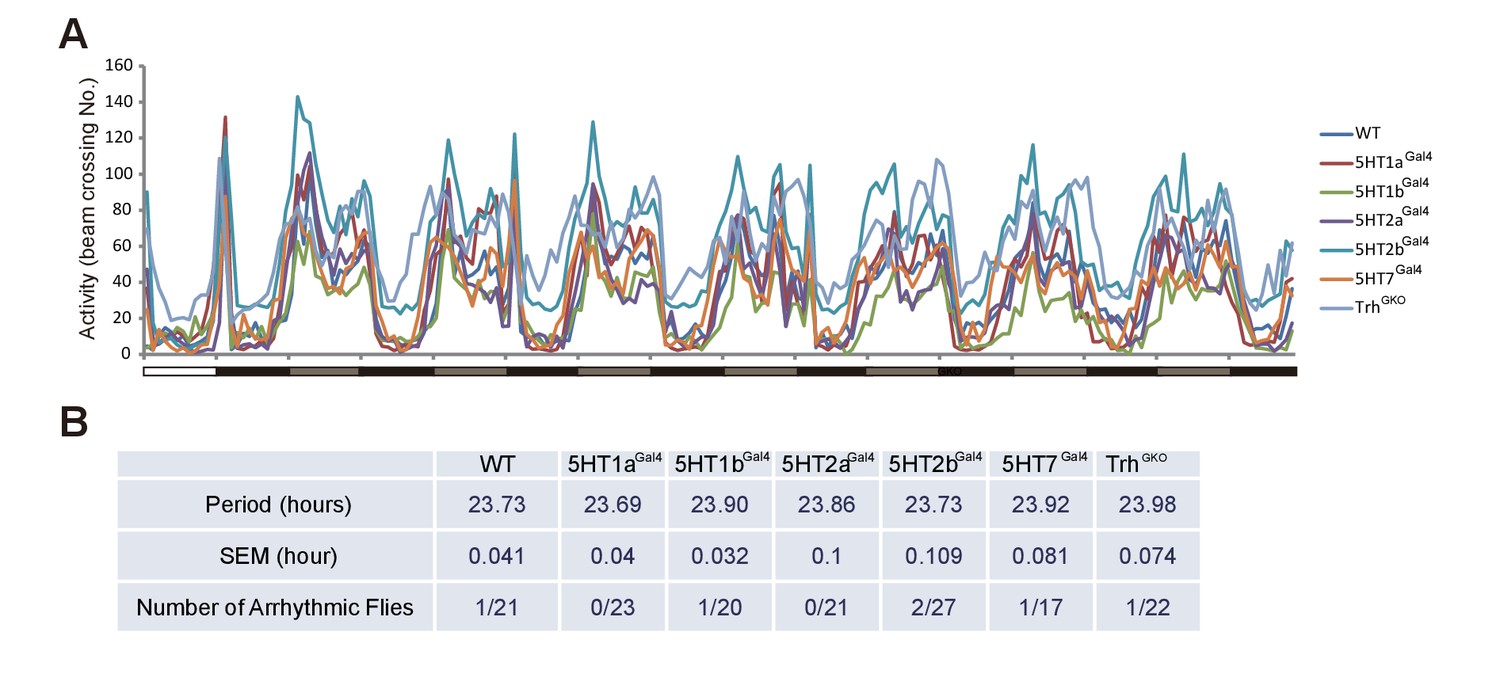
Circaidian rhythms in Trh and 5-HT receptor mutant flies.
(A) Activity profiles in wt, Trh and five serotonin receptor mutants during 7 days in DD. (B) Period and rythmicity analysis.
Figure 2—figure supplement 2
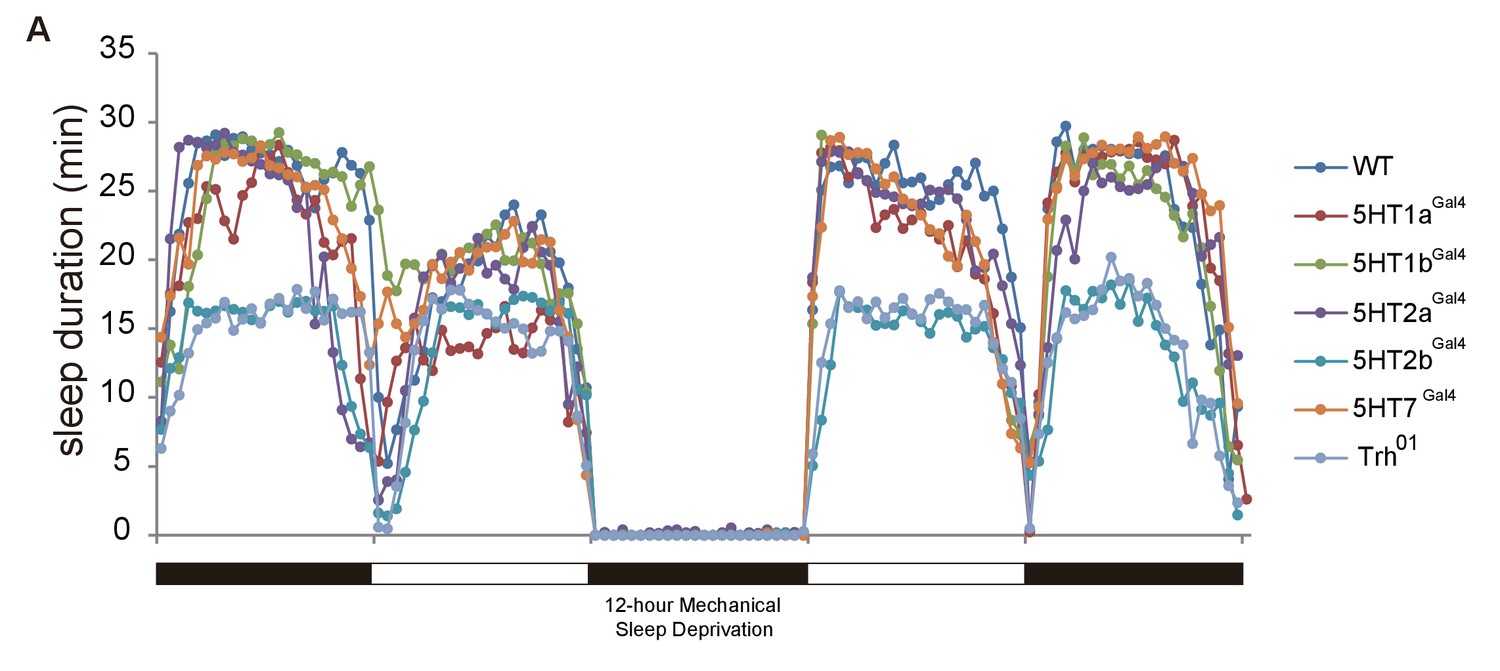
Efficiency of sleep deprivation.
Flies normally had their sleep recorded for 24 hr and were then deprived of sleep for 12 hr overnight. During sleep deprivation, about 100% of night sleep was lost. DAMs (Drosophila Activity Monitor) were used for recording. n = 16–32 for each genotype.
Figure 2—figure supplement 3
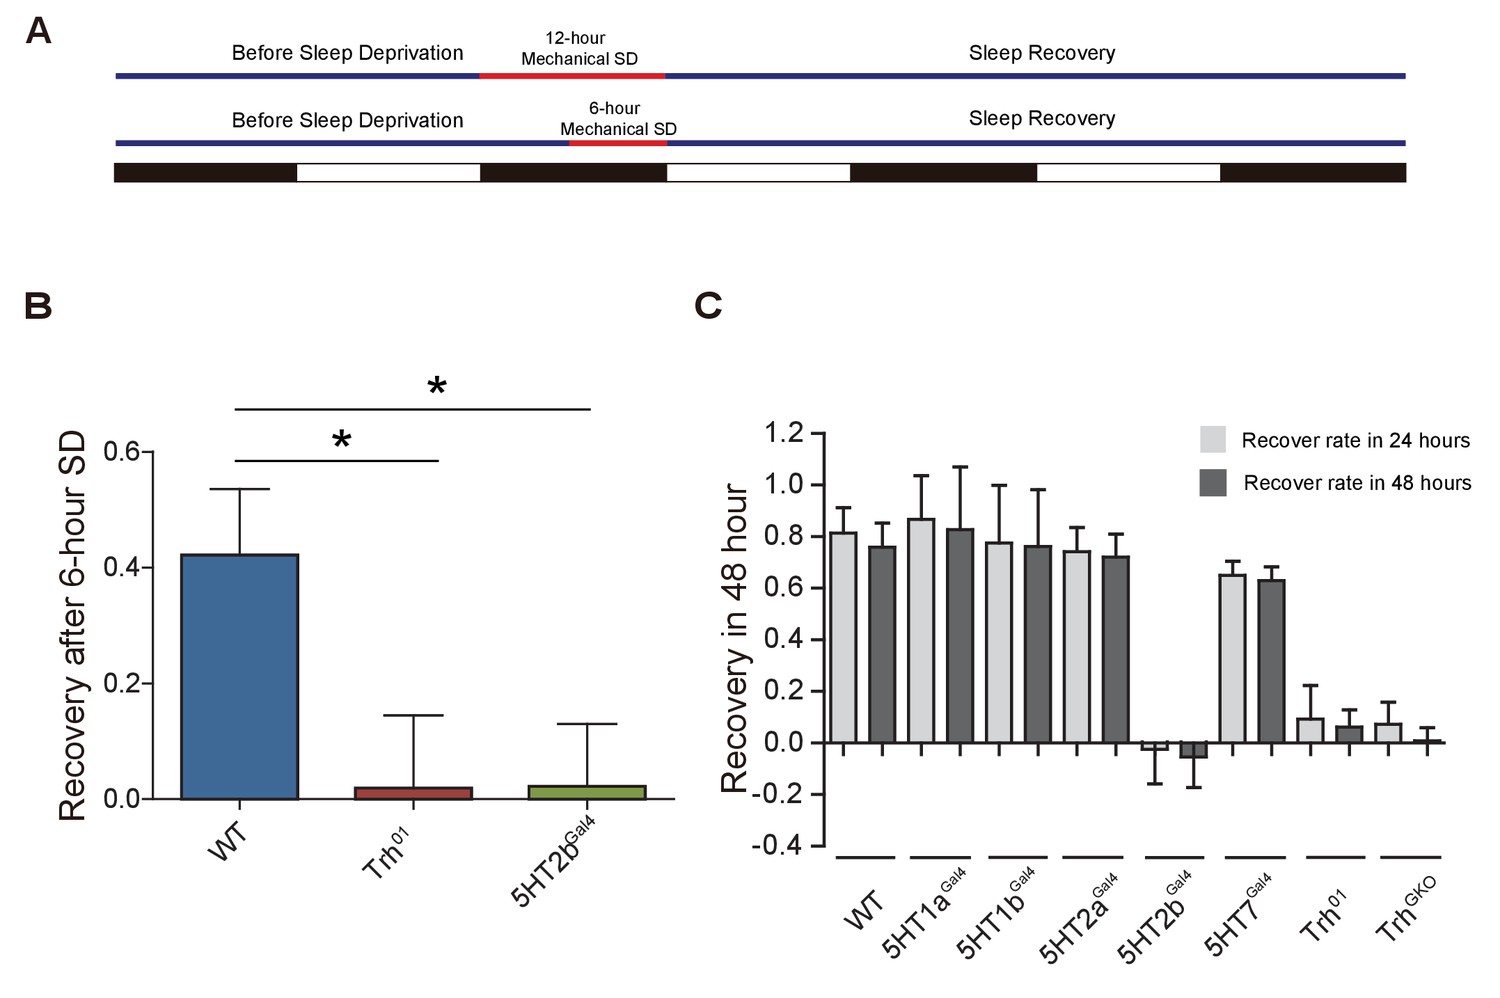
Sleep homeostasis.
(A) Schematic illustration of mechanical sleep deprivation. (B) After 6 hr sleep deprivation, Trh and 5HT2b mutants showed impaired sleep rebound after 24-hr recovery (mean ± SEM, n = 40 for wt, n = 35 for Trh mutants and n = 36 for 5HT2b mutants). (C) Sleep rebound after 24-hr recovery and 48-hr recovery (mean ± SEM, n = 39 for wt, n = 38 for 5HT1a mutants, n = 38 for 5HT1b mutants, n = 38 for 5HT2a mutants, n = 45 for 5HT2b mutants, n = 47 for 5HT7 mutants, n = 44 for Trh01 mutants, and n = 42 for TrhGKO mutants). One-way ANOVA was used to detect statistical difference: *p<0.05, **p<0.01, ***p<0.001.
Figure 3 with 1 supplement

Expression patterns of Trh and 5HT2b genes in the brain.
(A–D) Brains of UAS-mCD8GFP; Trh::Gal4 (A), UAS-stingerGFP; Trh::Gal4 (B), UAS-DscamGFP; Trh::Gal4 (C) and UAS-sytGFP; Trh::Gal4 (D) flies immunostained with the anti-GFP antibody (green) and the neuropil marker nc82 antibody (red). (E–H) Brains of UAS-mCD8GFP; 5HT2b::Gal4 (E), UAS-stingerGFP; 5HT2b::Gal4 (F), UAS-DscamGFP; 5HT2b::Gal4 (G) and UAS-sytGFP; 5HT2b::Gal4 (H), immunostained with anti-GFP antibody (green) and nc82 antibody (red).
Figure 3—figure supplement 1

Expression patterns of different Trh and 5HT2b strains.
(A–B) Brains of UAS-mCD8GFP; Trh::Gal4 (A) or those of UAS-mCD8GFP; TrhGKO (B) immunostained with the anti-GFP antibody (green) and NC82 (red). Brains of UAS-mCD8GFP; 5HT2b::Gal4 (C), or of UAS-mCD8GFP; 5HT2bGKO (D), or of UAS-rCD2GFP; 5HT2bGKO (E) immunostained with the anti-GFP antibody (green) and NC82 (red). (F–M) Expression patterns of the Trh and 5HT2b genes in the VNC. (F–I) VNCs of UAS-mCD8GFP; Trh::Gal4 (F), UAS-stingerGFP; Trh::Gal4 (G), UAS-DscamGFP; Trh::Gal4 (H) and UAS-sytGFP; Trh::Gal4 (I) flies immunostained with the anti-GFP antibody (green) and NC82 (red). (J–M) VNCs of UAS-mCD8GFP; 5HT2b::Gal4 (J), UAS-stingerGFP; 5HT2b::Gal4 (K), UAS-DscamGFP; 5HT2b::Gal4 (L) and UAS-sytGFP; 5HT2b::Gal4(M) flies immunostained with the anti-GFP antibody (green) and NC82 (red).
Figure 4 with 1 supplement

A single pair of dFB neurons expressing 5HT2b.
(A) Schematic illustration of different brain regions regulating sleep (above). dFB, dorsal fan-shaped body; DN1, dorsal neurons 1; lLNv, large ventral lateral clock neurons; MB, mushroom body; PI, pars intercerebralis. Sleep in flies expressing different Gal4-driven 5HT2b RNAi lines (below). (B) Brain of UAS-mCD8GFP; 23E10-Gal4 flies, immunostained with the anti-GFP antibody (green) and the nc82 antibody (red). (C) Brain of UAS-DenMark,UAS-sytGFP; 23E10-Gal4 fly, immunostained with the anti-GFP antibody (green), the anti-RFP antibody (red) and the neuropil marker nc82 antibody (blue). (D and E) Intersectional neurons of 23E10 and 5HT2b. Brain of 23E10-LexA/UAS-FRT-mCD8GFP-FRT; LexAop-Flp/Trh::Gal4 fly, immunostained with the anti-GFP antibody (green) and the neuropil marker nc82 antibody (red). Two intersectional neurons were labeled (E). (F–H) One pair of 5HT2b and 23E10 co-stained neurons. 5HT2b-LexA driven LexAop-tdTomato labelled 5HT2b neurons after anti-RFP immunostaining, and 23E10-Gal4 driven UAS-stingerGFP labelled 23E10 neurons after anti-GFP immunostaining. (F1, G1, and H1) Whole-mount staining. (F2, G2, and H2) Cell bodies of two co-stained neurons. NC82 fluorescences blue. Arrows indicate the cell bodies of co-stained neurons. (I–K) Immunostainings of 5HT2bsfGFP and serotonin. 5HT2bsfGFP labelled green, 5-HT labelled red and NC82 labelled blue as background. (I1, J1, and K1) Whole-mount staining. (I2, J2, and K2) Slice of FB region staining. (L–N) Immunostaining of 5HT2bsfGFP at dFB and serotonin. UAS-5HT2bsfGFP driven by 23E10 labelled green, 5HT labelled red and NC82 labelled blue as background. (L1, M1, and N1) Whole-mount staining. (L2, M2, and N2) Slice of FB region.
Figure 4—figure supplement 1

Intersections of 5HT2b neurons with different brain regions.
(A) qRT-PCR validation of UAS-5HT2b-RNAi efficiency. (B) Intersectional neurons of 5HT2b and brain regions labelled by different Gal4s. Brain of 5HT2b-LexA/UAS-FRT-mCD8GFP-FRT; LexAop-Flp/X-Gal4 flies, immunostained with the anti-GFP antibody (green) and the neuropil marker nc82 antibody (red).
Figure 5 with 1 supplement
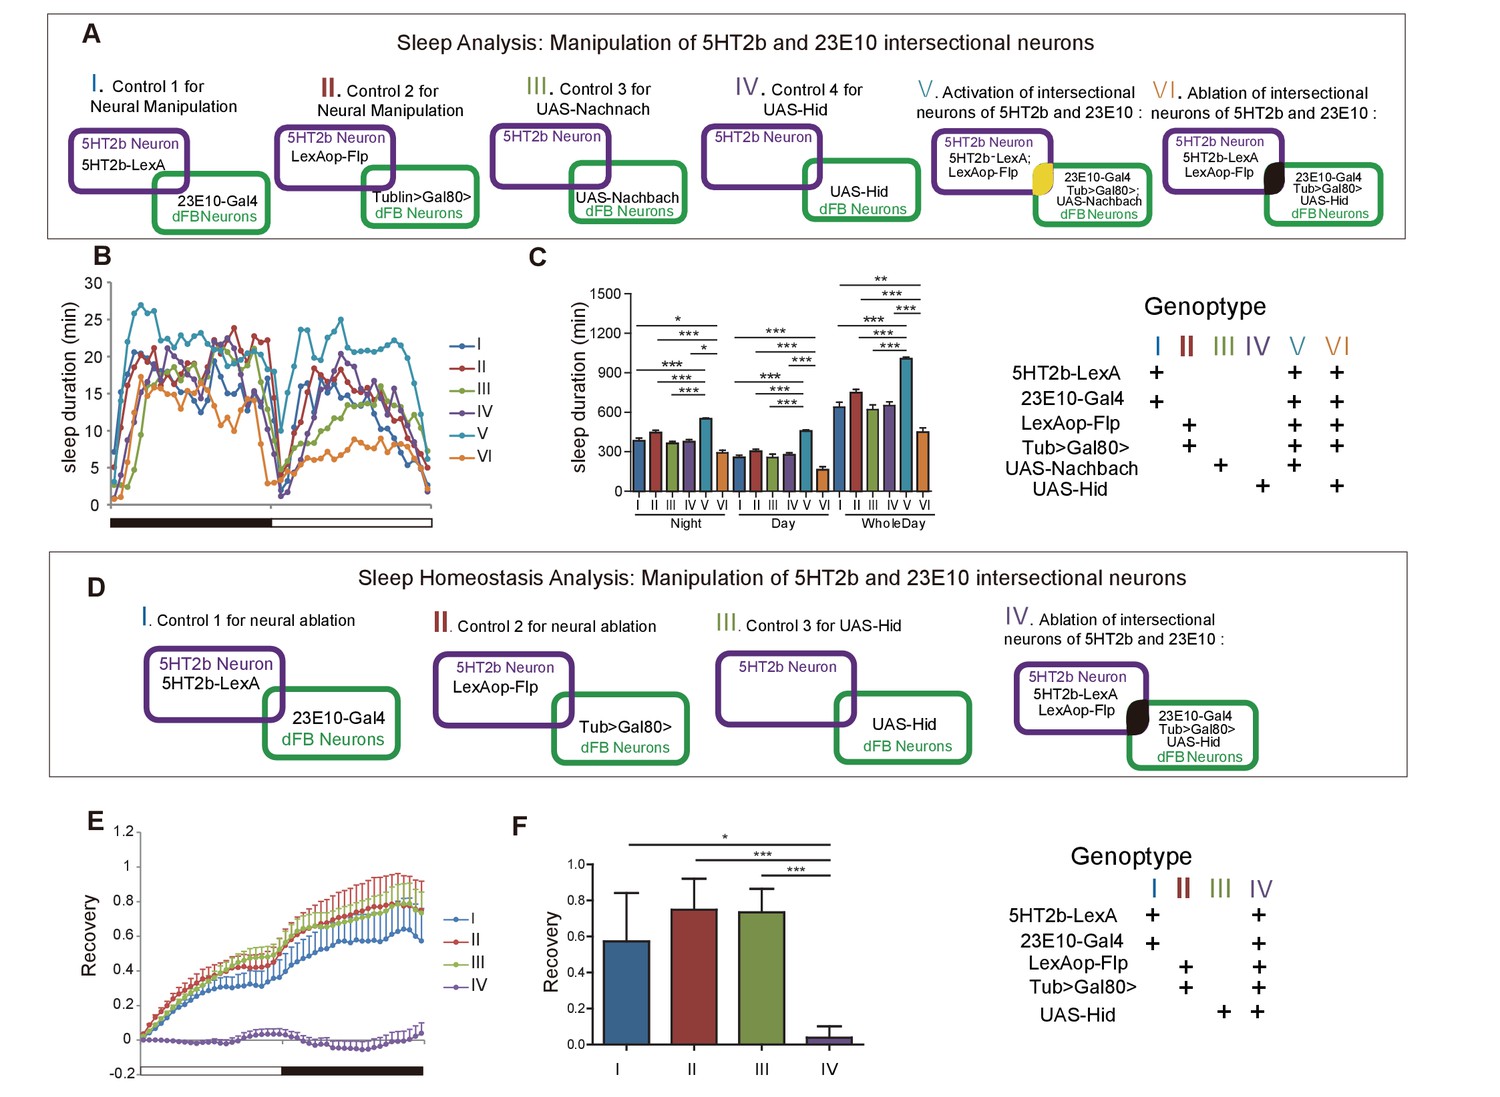
Effect of manipulating 5HT2b and dFB intersectional neurons on sleep.
(A) Schematic illustration of the genetic manipulation of 5HT2b and dFB neurons for sleep analysis. (B–C) Activation of 5HT2b and 23E10 intersectional neurons increased sleep, and ablation of these neurons reduced sleep. Sleep profiles for flies with 23E10 neuron activation and control flies for 24 hr (B). Flies with neural activation slept more whereas those with ablation slept less . (C). Mean ± SEM, n = 48 for I, n = 48 for II, n = 48 for III, n = 48 for IV, n = 47 for V and n = 41 for VI flies. (D) Schematic illustration of genetic manipulation of 5HT2b and dFB neurons for sleep homeostasis analysis. (E–F) Ablation of 23E10 neurons impaired sleep rebound. Flies with 5HT2b and 23E10 intersectional neuron ablation had abnormal recovery rate after 12-hr sleep deprivation (mean ± SEM, n = 32 for I, n = 35 for II, n = 44 for III, and n = 40 for IV). Statistical analysis was performed with one-way ANOVA: *p<0.05, **p<0.01, ***p<0.001.
Figure 5—figure supplement 1
Effect of manipulating 5HT2b and dFB intersectional neurons on sleep.
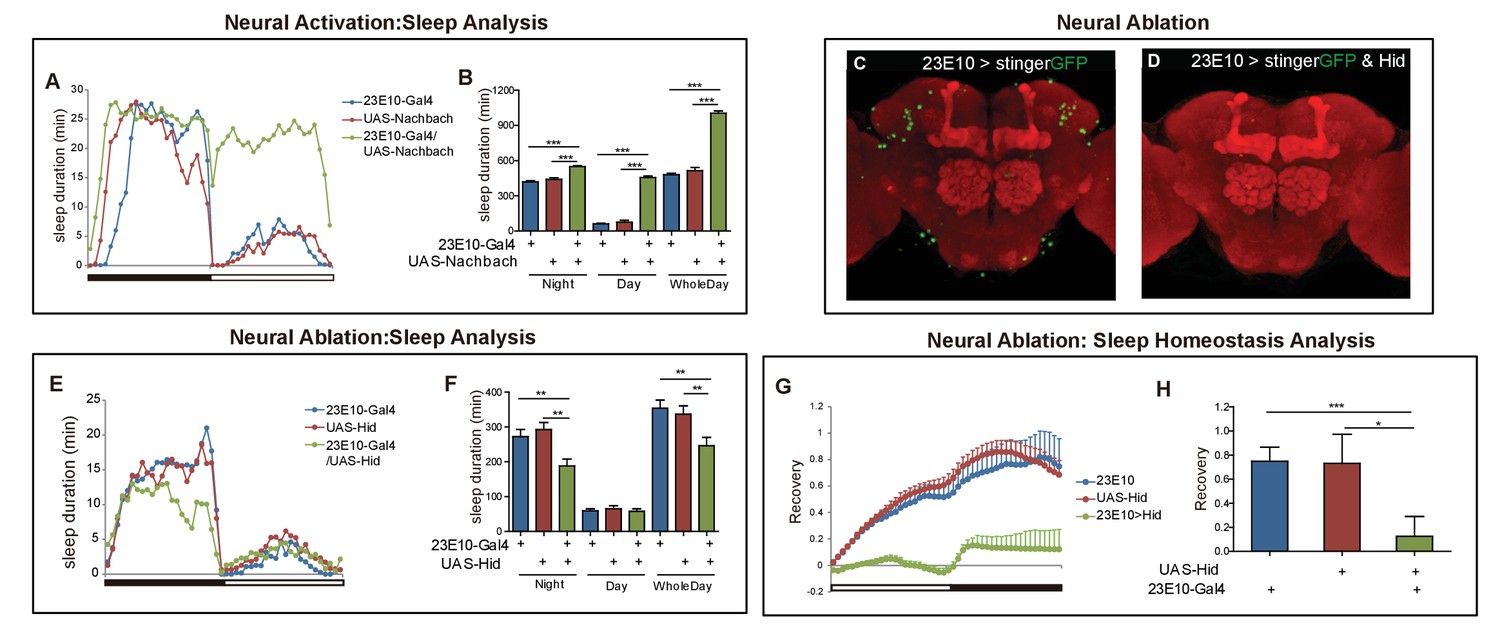
(A–B) Activation of 23E10 neurons increased sleep. Sleep profiles for flies with 23E10 neuron activation and control flies for 24 hr (A). Flies with 23E10-Gal4/UAS-Nachbach activation slept more than UAS-Nachbach and 23E10-Gal4 flies (B) mean ± SEM, n = 42 for UAS-Nachbach/ +flies, n = 43 for 23E10-Gal4/+flies, and n = 42 for UAS-NachBach/23E10-Gal4 flies). (C–D) Genetic ablation of neurons with hid and DTI. Brains of UAS-stingerGFP; 23E10-Gal4 control fly (C) and UAS-stingerGFP,UAS-hid; 23E10-Gal4 ablation (D) immunostained with the anti-GFP antibody (green) and NC82 (red). (E and F) Ablation of 23E10 neurons suppressed sleep. Flies with 23E10-Gal4/UAS-hid slept less than those with UAS-hid and 23E10-Gal4 control. (F) Mean ± SEM, n = 48 for each group. (G–H) Ablation of 23E10 neurons impaired sleep rebound. 23E10-Gal4/UAS-hid flies had abnormal recovery rate after 12-hr sleep deprivation. (H) Mean ± SEM, n = 47 for UAS-Hid/+flies, n = 40 for 23E10-Gal4/+flies, and n = 39 for UAS-Hid/23E10-Gal4 flies. Statistical analysis was performed with one-way ANOVA: *p<0.05, **p<0.01, ***p<0.001.
Figure 6 with 1 supplement

Regulation of sleep and sleep homeostasis by the 5HT2b gene in one pair of dFB neurons.
(A) Schematic illustration of genetic rescue with 5HT2b cDNA in 5HT2b mutants. (B) Sleep profile for 5HT2b homozygous heterzygous mutants and genetic rescue lines with 5HT2bGKO or 23E10-Gal4. (C) 5HT2b mutants slept less than wt or genetic rescue stains with 5HT2bGKO or 23E10-Gal4 (mean ± SEM, n = 48 for I, n = 48 for II, n = 48 for III, n = 848 for IV, n = 32 for V and n = 48 for VI). (D and E) Heterozygous mutants and flies with 5HT2b cDNA restored in 5HT2b or 23E10 neurons had normal recovery rate after 12-hr sleep deprivation (D). (E) Statistical analysis (mean ± SEM, n = 43 for I, n = 47 for II, n = 36 for III, n = 25 for IV, n = 31 for V and n = 33 for VI). (F) Schematic illustration of genetic rescue in 5HT2b but not 23E10 neurons. (G) Sleep profile for the 5HT2b homozygous mutant and genetic rescue in 5HT2b neurons and genetic rescue lines in all 5HT2b neurons but not in 23E10 neurons. 5HT2b mutant flies and flies with 5HT2b rescue in all 5HT2b neurons but not in 23E10 neurons were similar in sleep duration during both days and nights, but slept less than genetic rescue strains with 5HT2bGKO in night-time sleep (G). (H) Statistical analysis (mean ± SEM, n = 48 for I, 48 for II, and 46 for III, respectively). (I–J) 5HT2b mutant flies and flies with 5HT2b rescue in all 5HT2b neurons but not 23E10 neurons showed impaired sleep homeostasis (I). (J) Statistical analysis (mean ± SEM, n = 41 for I, n = 40 for II, and n = 43 for III). (K) Schematic illustration of 5HT2b gene knockdown in 23E10 neurons or in all 5HT2b neurons but not 23E10 neurons. (L) Sleep profile for strains of 5HT2b gene knockdown 23E10 neurons and Gal80 rescue in 23E10 neurons. Gene knockdown in dFB neurons showed shortened sleep duration (II), and the Gal80 rescued strain (V) showed normal sleep duration. (M) Statistical analysis (mean ± SEM, n = 46 for I, n = 42 for II, n = 43 for III, n = 48 for IV and n = 44 for V). (N–O) Gene knockdown in dFB neurons showed abnormal sleep homeostasis, and the Gal80 rescued strain (V) was able to restore the sleep homeostasis. (O) Statistical analysis (mean ± SEM, n = 43 for I, n = 30 for II, n = 37 for III, n = 48 for IV and n = 35 for V). One-way ANOVA was used to detect statistical difference between different genotypes. *p<0.05, **p<0.01, ***p<0.001.
Figure 6—figure supplement 1

Appoaches for neural manipulation and genetic rescue.
(A) Schematic illustration of strategy for 5HT2b and dFB neural intersection. (B) Intersctional neurons of 5HT2b and dFB. (C) LexAop-Gal80 suppression of Gal4 expression in 23E10 neurons. (D) Schematic illustration of 23E10-LexA and 5HT2bGKO dual-labeling neurons. (E) 5HT2b and 23E10 co-stained neuron in the dFB. 23E10-LexA-driven LexAop-tdTomato label 23E10 neurons (anti-RFP), whereas 5HT2bGKO-driven UAS-stingerGFP label 5HT2b neurons (anti-GFP). Arrows indicate the cell bodies of co-stained neurons. (F) Schematic illustration of 23E10-LexA and 5HT2bGKO dual-labeling neurons with LexAop-Gal80 suppression of Gal4 expression in 23E10 neurons. (G) No co-stained neurons were detected. 23E10-LexA-driven LexAop-tdTomato and Gal80 label 23E10 neurons (anti-RFP) and 5HT2bGKO-driven UAS-stingerGFP label 5HT2b neurons (anti-GFP).
Videos
Video 1
Expression pattern of the Trh gene.
About 200 neurons were labeled in the brain. The neural projections were found in optic lobes, olfactory lobes central complex, subesophageal ganglion and mushroom bodies.
Video 2
Expression pattern of the 5HT2b gene.
More than 500 neurons were labeled in the brain. The neural projections were found in the central complex, the olfactory lobe, the optic lobe, the subesophageal ganglion and the ventrolateral protocerebrum, but not in the MBs.
Video 3
23E10 and 5HT2b intersectional neurons.
Two pairs of 23E10 and 5HT2b intersectional neurons in the brain.
Tables
Table 1
Complete genotypes used in the figures.
This table contains the genotypes of flies used in imaging and behavioral analysis.
| Figure 1 | |
|---|---|
| E–J | Iso-CS |
| w+;5HT1aGal4;+ | |
| w+;5HT1bGal4;+ | |
| w+;+;5HT2aGal4 | |
| w+;+;5HT2bGal4 | |
| w+;+;5HT7Gal4 | |
| w+;+;Trh01 | |
| w+;+;TrhGKO | |
| Figure 2 | |
| A,B | Iso-CS |
| w+;5HT1aGal4;+ | |
| w+;5HT1bGal4;+ | |
| w+;+;5HT2aGal4 | |
| w+;+;5HT2bGal4 | |
| w+;+;5HT7Gal4 | |
| w+;+;Trh01 | |
| w+;+;TrhGKO | |
| C,D | Iso-CS(Mock) |
| Iso-CS(5HTP) | |
| w+;+;Trh01(Mock) | |
| w+;+;Trh01(5HTP) | |
| w+;+;TrhGKO(Mock) | |
| w+;+;TrhGKO(5HTP) | |
| E, H–J | w−;+;UAS-TrpA1/+ |
| w-−;+;TH-Gal4/+ | |
| w−;+;UAS-TrpA1/TH-Gal4 | |
| F, H–J | w−;+;UAS-TrpA1,Trh01/Trh01 |
| w−;+;TH-Gal4,Trh01/Trh01 | |
| w−;+;UAS-TrpA1,Trh01/TH-Gal4,Trh01 | |
| G, H–J | w−;+;UAS-TrpA1,5HT2battp/5HT2battp |
| w−;+;TH-Gal4,5HT2battp/5HT2battp | |
| w−;+;UAS-TrpA1,5HT2battp/TH-Gal4,5HT2battp | |
| Figure 3 | |
| A | w−;UAS-mCD8GFP/+;Trh::Gal4/+ |
| B | w−;UAS-stingerGFP/+;Trh::Gal4/+ |
| C | w−;UAS-DscamGFP/+;Trh::Gal4/+ |
| D | w−;UAS-sytGFP/+;Trh::Gal4/+ |
| E | w−;UAS-mCD8GFP/+;5HT2b::Gal4/+ |
| F | w−;UAS-stingerGFP/+;5HT2b::Gal4/+ |
| G | w−;UAS-DscamGFP/+;5HT2b::Gal4/+ |
| H | w−;UAS-sytGFP/+;5HT2b::Gal4/+ |
| Figure 4 | |
| A | w−;+;UAS-5HT2b-RNAi/+ |
| w−;+;5HT2b::Gal4/+ | |
| w−;+;5HT2b::Gal4/UAS-5HT2b-RNAi | |
| w−;+;MB247-Gal4/+ | |
| w−;+;MB247-Gal4/UAS-5HT2b-RNAi | |
| w−;+;R69F08-Gal4/+ | |
| w−;+;R69F08-Gal4/UAS-5HT2b-RNAi | |
| w−;+;pdf-Gal4/+ | |
| w−;+;pdf-Gal4/UAS-5HT2b-RNAi | |
| w−;+;dilp2-Gal4/+ | |
| w−;+;dilp2-Gal4/UAS-5HT2b-RNAi | |
| w−;+;R18H11-Gal4/+ | |
| w−;+;R18H11-Gal4/UAS-5HT2b-RNAi | |
| w−;+;R23E10-Gal4/+ | |
| w−;+;R23E10-Gal4/UAS-5HT2b-RNAi | |
| B | w−;UAS-mCD8GFP/+;23E10-Gal4/+ |
| C | w−;UAS-DenMark,UAS-sytGFP/+;23E10-Gal4/+ |
| D,E | w−;UAS-FRT-stop-FRT-mCD8GFP/+; |
| 5HT2b-LexA,23E10-Gal4/LexAop-Flp | |
| F–H | w−;UAS-stingerGFP,LexAop-TdTomato/+;5HT2b-LexA,23E10-Gal4/+ |
| I–K | w−;+;5HT2bsfGFP/+ |
| L–N | w−;UAS-5HT2bsfGFP/+;23E10-Gal4/+ |
| Figure 5 | |
| B–C(I) | w−; +;5HT2b-LexA,23E10-Gal4/+ |
| B–C (II) | w−;Tub > Gal80>/+;LexAop-Flp/+ |
| B–C (III) | w−;UAS-Nachbach/+;+ |
| B–C (IV) | w−;UAS-Hid/+;+ |
| B–C (V) | w−;Tub > Gal80>,UAS-Nachbach/+;5HT2b-LexA,23E10-Gal4/LexAop-Flp |
| B–C (VI) | w−;Tub > Gal80>,UAS-Hid/+;5HT2b-LexA,23E10-Gal4/LexAop-Flp |
| E–F(I) | w−;+;5HT2b-LexA,23E10-Gal4/+ |
| E–F(II) | w−;+;Tub > Gal80>/+;Lexop-Flp/+ |
| E–F(III) | w−;UAS-Hid/+;+ |
| E–F(IV) | w−;Tub > Gal80>,UAS-Hid/+;5HT2b-LexA,23E10-Gal4/LexAop-Flp |
| Figure 6 | |
| B–E(I) | w+;+;+ |
| B–E(II) | w−;+;5HT2bGKO/5HT2battp |
| B–E(III) | w−;UAS-5HT2b/+;5HT2bGKO/5HT2battp |
| B–E(IV) | w−;UAS-5HT2b/+;5HT2battp/5HT2battp |
| B–E(V) | w−;+;23E10-Gal4,5HT2battp/5HT2battp |
| B–E(VI) | w−;UAS-5HT2b/+;23E10-Gal4,5HT2battp/5HT2battp |
| G–J(I) | w−;23E10-LexA/+;5HT2bGKO/5HT2battp |
| G–J(II) | w−;UAS-5HT2b/+;5HT2bGKO,LexAop-Gal80/5HT2battp |
| G–J(III) | w−;UAS-5HT2b/23E10-LexA;5HT2bGKO,LexAop-Gal80/5HT2battp |
| L–O(I) | w−;+;23E10-Gal4/+ |
| L–O(II) | w−;UAS-5HT2b-RNAi/+;23E10-Gal4/+ |
| L–O(III) | w−;23E10-LexA/+;5HT2b::Gal4/+ |
| L–O(IV) | w−;LexAop-Gal80/+;UAS-5HT2b-RNAi/+ |
| L–O(V) | w−;LexAop-Gal80/23E10-LexA;5HT2b::Gal4/UAS-5HT2b-RNAi |
| Figure 1—figure supplement 2 | |
| A | w+;+;+ |
| B | w-;+;Trh::Gal4 |
| C | w+;+;Trh01 |
| D | w+;+;TrhGKO |
| E | w+;+;Trh01 |
| F | w+;+;TrhGKO |
| G | w+;+;Trh01 |
| H | w+;+;TrhGKO |
| I-J | isoCS |
| w+;+;Trh01 | |
| Figure 1—figure supplement 3 | |
| A–F | Iso-CS |
| w+;5HT1aGal4;+ | |
| w+;5HT1bGal4;+ | |
| w+;+;5HT2aGal4 | |
| w+;+;5HT2bGal4 | |
| w+;+;5HT7Gal4 | |
| w+;+;Trh01 | |
| w+;+;TrhGKO | |
| Figure 1—figure supplement 4 | |
| A–F | Iso-CS |
| w+;5HT1aGal4;+ | |
| w+;5HT1bGal4;+ | |
| w+;+;5HT2aGal4 | |
| w+;+;5HT2bGal4 | |
| w+;+;5HT7Gal4 | |
| w+;+;Trh01 | |
| w+;+;TrhGKO | |
| Figure 2—figure supplement 1 | |
| A–B | Iso-CS |
| w+;5HT1aGal4;+ | |
| w+;5HT1bGal4;+ | |
| w+;+;5HT2aGal4 | |
| w+;+;5HT2bGal4 | |
| w+;+;5HT7Gal4 | |
| w+;+;TrhGKO | |
| Figure 2—figure supplement 2 | |
| A–B | Iso-CS |
| w+;5HT1aGal4;+ | |
| w+;5HT1bGal4;+ | |
| w+;+;5HT2aGal4 | |
| w+;+;5HT2bGal4 | |
| w+;+;5HT7Gal4 | |
| w+;+;Trh01 | |
| Figure 2—figure supplement 3 | |
| B | Iso-CS |
| w+;+;5HT2bGal4 | |
| w+;+;Trh01 | |
| C | Iso-CS |
| w+;5HT1aGal4;+ | |
| w+;5HT1bGal4;+ | |
| w+;+;5HT2aGal4 | |
| w+;+;5HT2bGal4 | |
| w+;+;5HT7Gal4 | |
| w+;+;Trh01 | |
| w+;+;TrhGKO | |
| Figure 3—figure supplement 1 | |
| A | w+;UAS-mCD8GFP/+;Trh::Gal4/+ |
| B | w+;UAS-mCD8GFP/+;TrhGKO/+ |
| C | w+;UAS-mCD8GFP/+;5HT2b::Gal4/+ |
| D | w+;UAS-mCD8GFP/+;5HT2bGKO/+ |
| E | w+;UAS-mCD8GFP/+;5HT2b-LexA/+ |
| F | w−;UAS-mCD8GFP/+;Trh::Gal4/+ |
| G | w−;UAS-stingerGFP/+;Trh::Gal4/+ |
| H | w−;UAS-DscamGFP/+;Trh::Gal4/+ |
| I | w−;UAS-sytGFP/+;Trh::Gal4/+ |
| J | w−;UAS-mCD8GFP/+;5HT2b::Gal4/+ |
| K | w−;UAS-stingerGFP/+;5HT2b::Gal4/+ |
| L | w−;UAS-DscamGFP/+;5HT2b::Gal4/+ |
| M | w−;UAS-sytGFP/+;5HT2b::Gal4/+ |
| Figure 4—figure supplement 1 | |
| A | w−;+;5HT2b::Gal4/+ |
| w−;+;UAS-5HT2b-RNAi | |
| w−;+;5HT2b::Gal4/UAS-5HT2b-RNAi | |
| B | w−;UAS > Stop > mCD8GFP/+;Lexop-Flp,5HT2b-LexA/MB247-Gal4 |
| w−;UAS > Stop > mCD8GFP/+;Lexop-Flp,5HT2b-LexA/R69F08-Gal4 | |
| w−;UAS > Stop > mCD8GFP/+;Lexop-Flp,5HT2b-LexA/Pdf-Gal4 | |
| w−;UAS > Stop > mCD8GFP/+;Lexop-Flp,5HT2b-LexA/Dilp2-Gal4 | |
| w−;UAS > Stop > mCD8GFP/+;Lexop-Flp,5HT2b-LexA/R18H11-Gal4 | |
| w−;UAS > Stop > mCD8GFP/+;Lexop-Flp,5HT2b-LexA/R23E10-Gal4 | |
| Figure 5—figure supplement 1 | |
| A–B | w−;23E10-Gal4/+;+ |
| w−;UAS-Nachbach/+;+ | |
| w−;23E10-Gal4/UAS-Nachbach;+ | |
| C | w−;23E10-Gal4/UAS-stingerGFP;+ |
| D | w−;23E10-Gal4/UAS-Hid,UAS-stingerGFP;+ |
| E–H | w−;23E10-Gal4/+;+ |
| w−;UAS-Hid/+;+ | |
| w−;23E10-Gal4/UAS-Hid;+ | |
| Figure 6—figure supplement 1 | |
| B | w−;Tub > Gal80>,UAS-mCD8GFP/+;5HT2b-LexA,23E10-Gal4/LexAop-Flp |
| C | w−;Tub > Gal80>,UAS-mCD8GFP/+;23E10-Gal4/+ |
| E | w−;UAS-stingerGFP,LexAop-tdTom/23E10-LexA;5HT2bGKO/+ |
| F | w−;UAS-stingerGFP,LexAop-tdTom/23E10-LexA; |
-
5HT2bGKO,LexAop-Gal80/+
Table 2
Primers and sgRNA.
The table contains the primers and sgRNA used in line construction.
| 5HT1a | 3' arm | For | ATGCTAGCGGCCGCGAGATTCGGA GGGAAAAGAATGTG |
| Rev | TACCATGGTACCTTTGTGGATACTCG GTGTGTTTTTTTG | ||
| 5' arm | For | AAGTCGACTAGTAGCCAAAGCCCAAACATAGA | |
| Rev | TTCCATGGCGCGCCCCAACGAGCCATTTGAGATT | ||
| 5HT1b | 3' arm | For | ATGCTAGCGGCCGCTGGCATAGTTTTTCGCTGTG |
| Rev | TACCATGGTACCCTCGCTTGTATATATGTA TATGTATATC | ||
| 5' arm | For | AAGTCGACTAGTCCATATCGCCGACAAAAACT | |
| Rev | TTCCATGGCGCGCCGTTGGCATTTGTTTGGCTTT | ||
| 5HT2a | 3' arm | For | ATGCTAGCGGCCGCCATGGTCAACATGGGTTCAA |
| Rev | TACCATGGTACCTTCATTCTAAAGCTGTGGGGC | ||
| 5' arm | For | TTCCATGGCGCGCCAAACTTGTTGGCCTTGTTGG | |
| Rev | TACTGCAGGCCTGCGCAATTGCTTAACAGACA | ||
| 5HT2b | 3' arm | For | ATGCTAGCGGCCGCGAAATGTTGCCGTGAGTCT |
| Rev | TAGGATCCGCGGTCCGCGTTATTATTCCTATTGTG | ||
| 5' arm | For | AAGTCGACTAGTTTCAAAGTCCGGAACAGAGG | |
| Rev | TTCCATGGCGCGCCAAACTCCATTTTCCGCACAG | ||
| 5HT7 | 3' arm | For | ATGCTAGCGGCCGCAAGGACAAAGGCGACACATC |
| Rev | TACCATGGTACCCAGCAGTCTTTCAATGGTGG | ||
| 5' arm | For | AAGTCGACTAGTCCCTAGGTTTCCGGAAGAAG | |
| Rev | TTCCATGGCGCGCCACACATATCCCCGTCCACAT | ||
| Primers and sgRNAs used in strategies II and III | |||
| TrhGKO | For | cggGGTACCATGAACAGTCTTTAGCCACG | |
| 5’ arm | Rev | cgcggatccGCGGCCGC TCACCCTGCGTAACCAGGTG | |
| 3’ arm | For | cgcggatccGGCGCGCC CACAACAGCCTGAATGTGAG | |
| Rev | tccccgcggTGCTACATTAAATCCTCCCA | ||
| gRNA | GAATGTGCTCATGTACGGCTCGG | ||
| GAGAGCATCCAACGGCCATTTGG | |||
| Trh::Gal4 | 5’ arm | For | cggggtaccAAGTCTCGGCAGAAACGCCTC |
| Rev | taacaccggtgcggccgcATCTCCCTCCGCCGTAGAGTT | ||
| 3’ arm | For | taacaccggtggcgcgccTTCTCGGGACCACAGAGCAGT | |
| Rev | tccccgcggAATTTCGGCAGGACACCTCTG | ||
| gRNA | GGACAGCAATGAAACCTTAAGGG | ||
| ACAGAGCAGTATAATTCACTTGG | |||
| 5HT2bGKO/LexA | 5’ arm | cggGGTACCATTTGTGCCGTGTCCTGTAT | |
| cgcggatccGCGGCCGCCTGCAGCCGGCGCTCCCAGG | |||
| 3’ arm | cgcggatccGGCGCGCCTGCGGCTAATCTTAGTTGGA | ||
| tccccgcggGCATGGGTCTTGTTTCGTTT | |||
| gRNA | GGGCATCCTTACGCTGGTGAAAGG | ||
| GGATAGAAAAATGGAATCGCTGG | |||
| 5HT2b::Gal4 | 5’ arm | For | cggggtaccCGAGCTGACCACAAAGCGTGC |
| Rev | taacaccggtgcggccgcTCTGCTCGGTCGCCAGGCACT | ||
| 3’ arm | For | taacaccggtggcgcgccAGGATTCCACTGCTCCGGTGC | |
| Rev | tccccgcggAGTTTCGCTCTGTGGAAACCG | ||
| gRNA | TAACAGACGCCCGTTAAACCGGG | ||
| ATCCACACTGGCGCACTTGT GGG | |||
| Primers in qRT-PCR | |||
| 5HT2b For | CCAACTACTTCCTTATGTCG | ||
| Rev | GATAAATATCTGTCCACGGA | ||
| Act42a | For | CTCCTACATATTTCCATAAAAGATCCAA | |
| Rev | GCCGACAATAGAAGGAAAAACTG | ||
| gRNA for Trh01 | GGAGATTGGCCTTGCATCTTTGGG | ||
Additional files
-
Transparent reporting form
- https://doi.org/10.7554/eLife.26519.024
Download links
A two-part list of links to download the article, or parts of the article, in various formats.
Downloads (link to download the article as PDF)
Open citations (links to open the citations from this article in various online reference manager services)
Cite this article (links to download the citations from this article in formats compatible with various reference manager tools)
Sleep homeostasis regulated by 5HT2b receptor in a small subset of neurons in the dorsal fan-shaped body of drosophila
eLife 6:e26519.
https://doi.org/10.7554/eLife.26519


