Structural basis for interdomain communication in SHIP2 providing high phosphatase activity
- Spanish National Cancer Research Centre, Spain
Figures
Figure 1 with 2 supplements
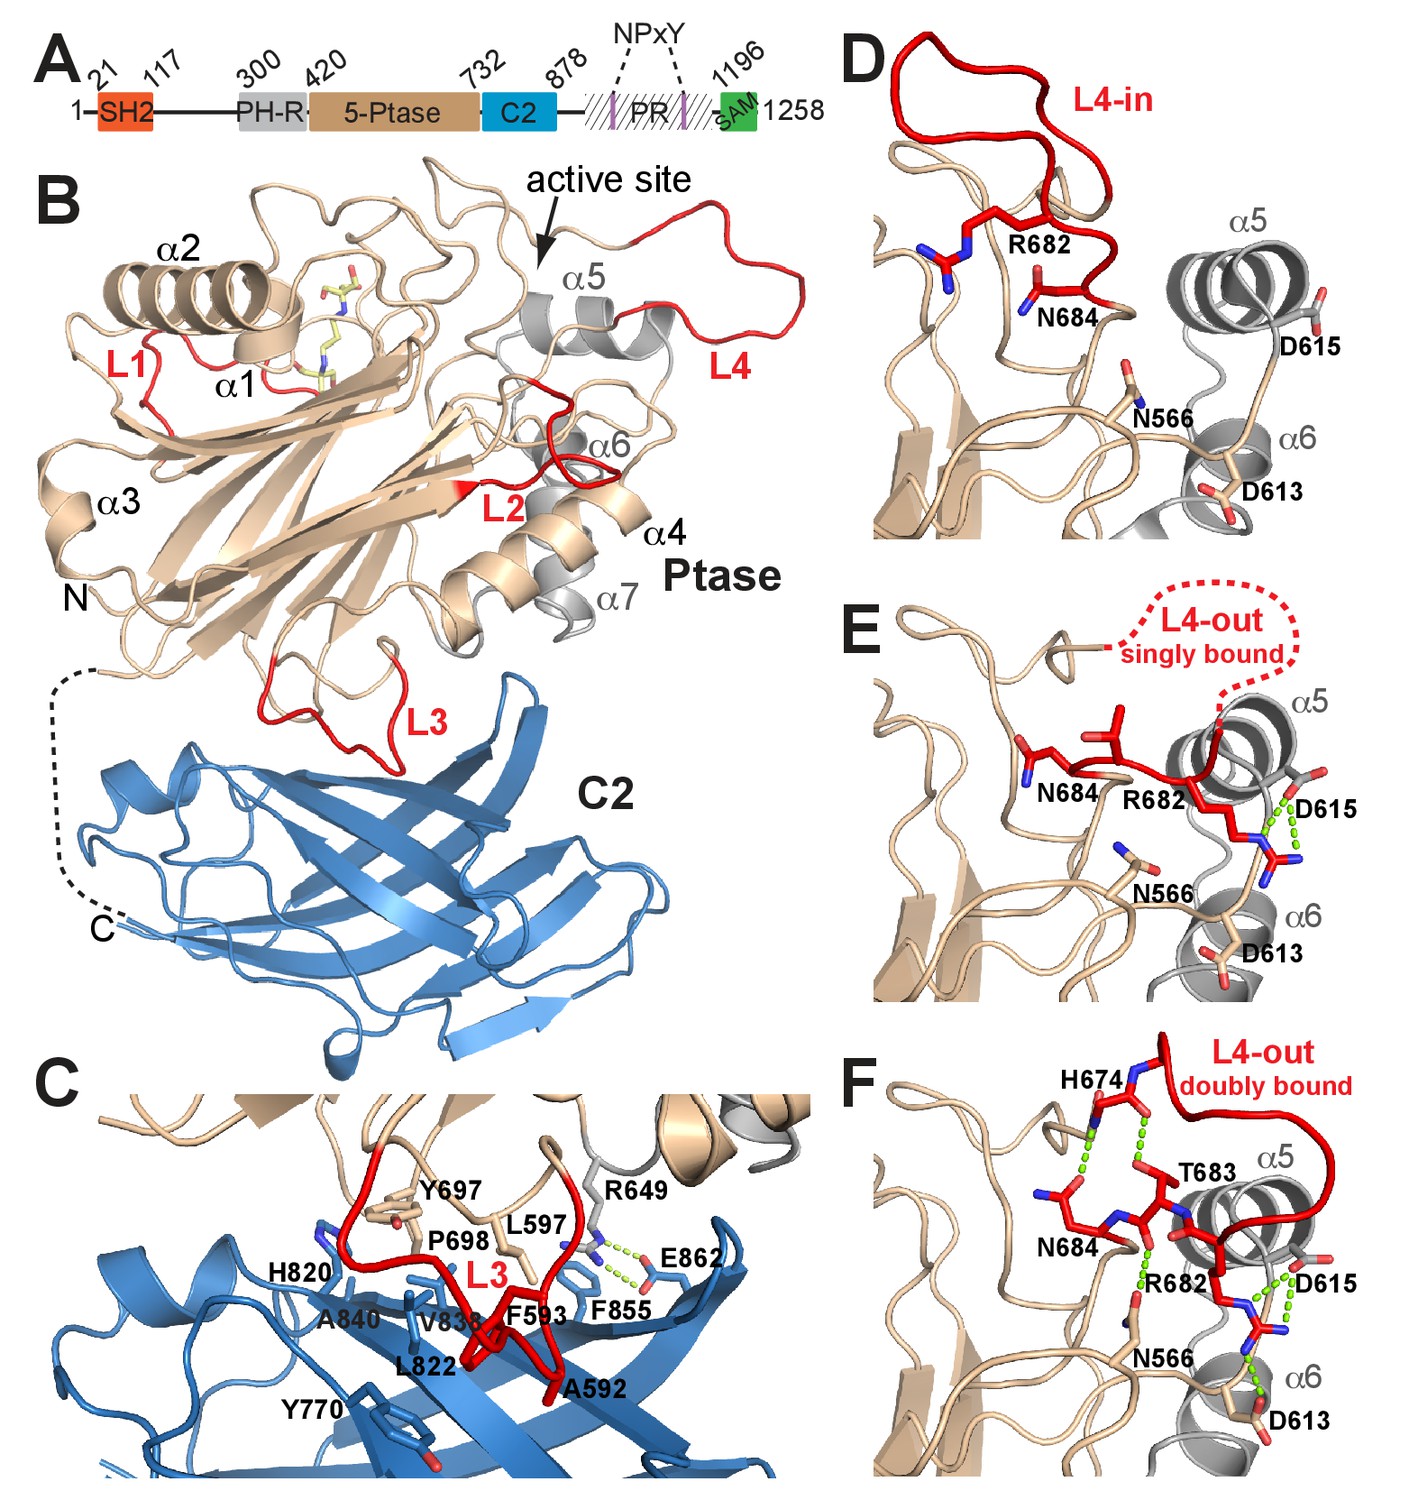
Structure of SHIP2 Ptase-C2.
(A) Schematic domain structure of human SHIP2. SH2, Src homology domain 2; PH-R, pleckstrin homology related domain; 5-Ptase, 5-phosphatase; PR, proline rich; SAM, sterile-α-motif. (B) Ribbon representation of SHIP2 Ptase-C2, molecule B. The 5-Ptase domain is colored in tan and gray with loops (L1–L4) in red and the C2 domain in blue. The disordered linker is shown as dashed line and the site of catalysis is marked (active site). (C) Close-up of the domain interface. (D–F) L4 can switch between ‘in’ and ‘out’ conformations. The L4-in conformation, with R682 pointing towards the active site is seen in two Ptase crystal structures (shown in panel D is PDB 3NR8, chain B). The L4-out conformation is only seen in Ptase-C2 WT crystal structures, where R682 is either singly bound to D615 (panel E, shown is molecule G) or doubly bound to D613 and D615 (panel F, shown is molecule B).
Figure 1—figure supplement 1
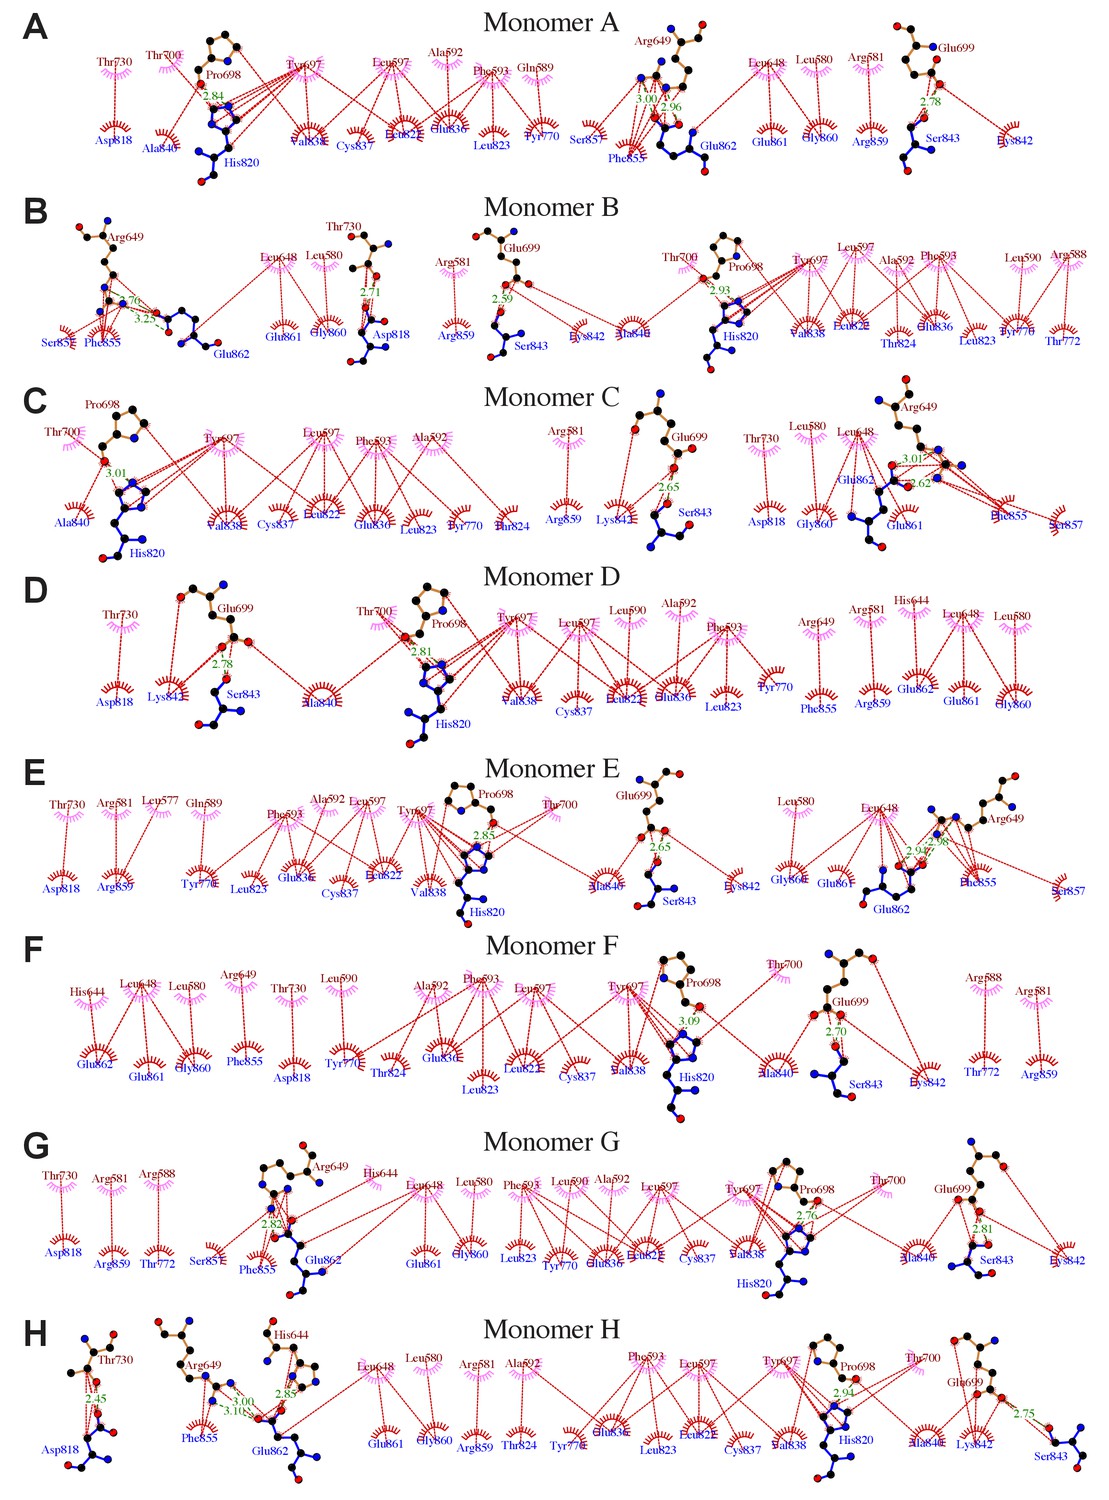
Details of interactions between the Ptase and C2 domains in Ptase-C2 WT.
(A–H) Details of the interdomain interactions are shown for the 8 Ptase-C2 WT molecules A-H. Ptase residues are labeled in brown, C2 residues in blue. Hydrophobic interactions are indicated as red lines, hydrogen bonds as green dashed lines. Plots are generated using LigPlot (Wallace et al., 1995).
Figure 1—figure supplement 2
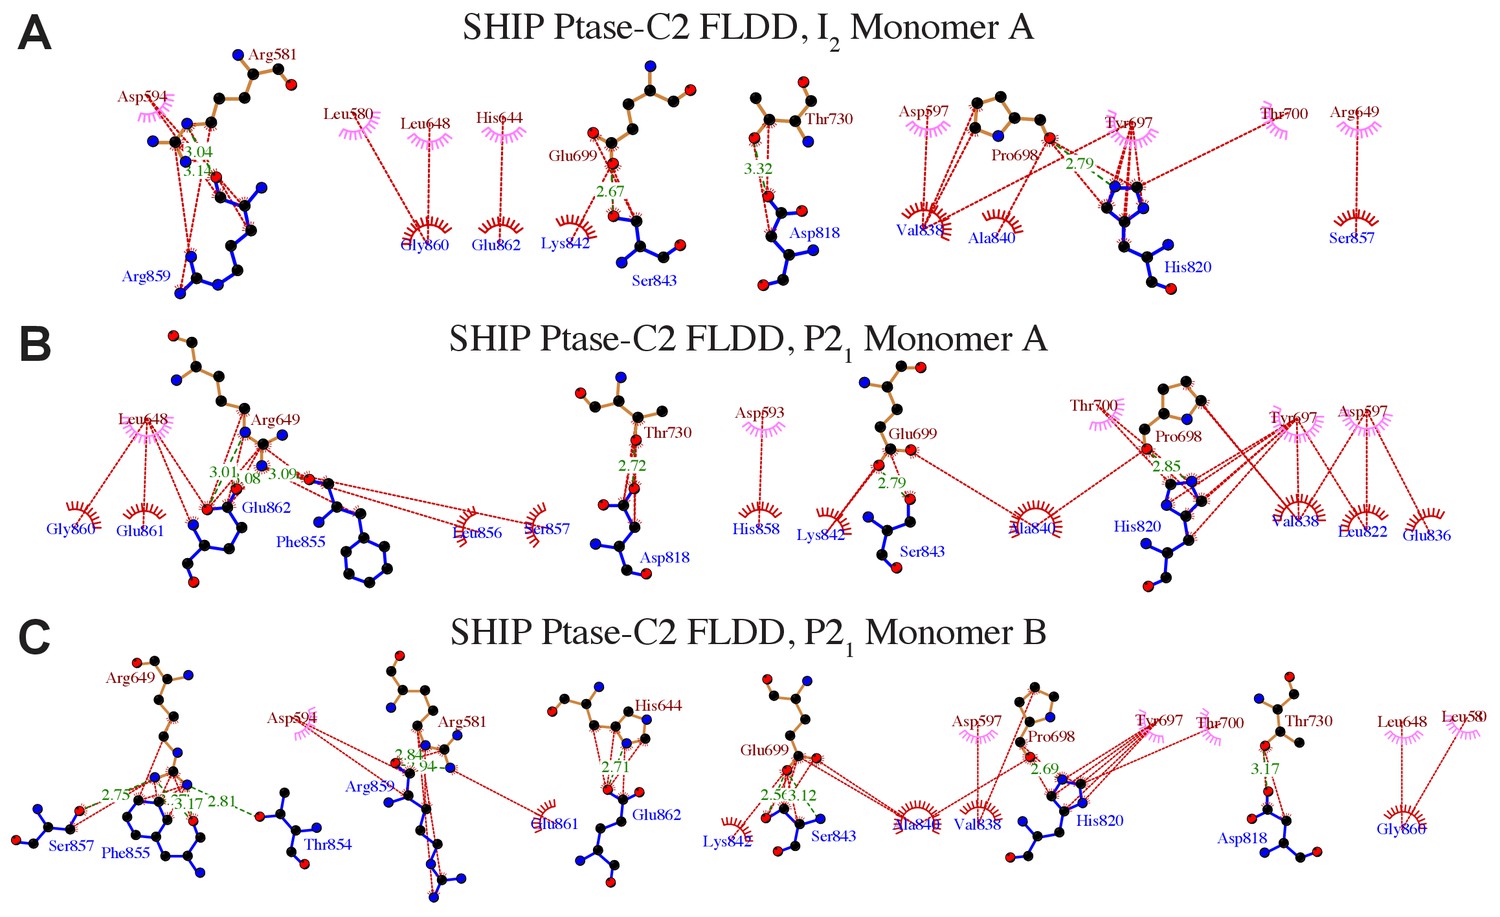
Details of interactions between the Ptase and C2 domains in Ptase-C2 FLDD.
(A–C) Ptase-C2 interactions in the FLDD mutant. Details of the interdomain interactions are shown for the Ptase-C2 FLDD molecule in the I2 (A) and the two molecules in the P21 crystal form (B–C). Ptase residues are labeled in brown, C2 residues in blue. Hydrophobic interactions are indicated as red lines, hydrogen bonds as green dashed lines. Plots are generated using LigPlot (Wallace et al., 1995).
Figure 2 with 1 supplement
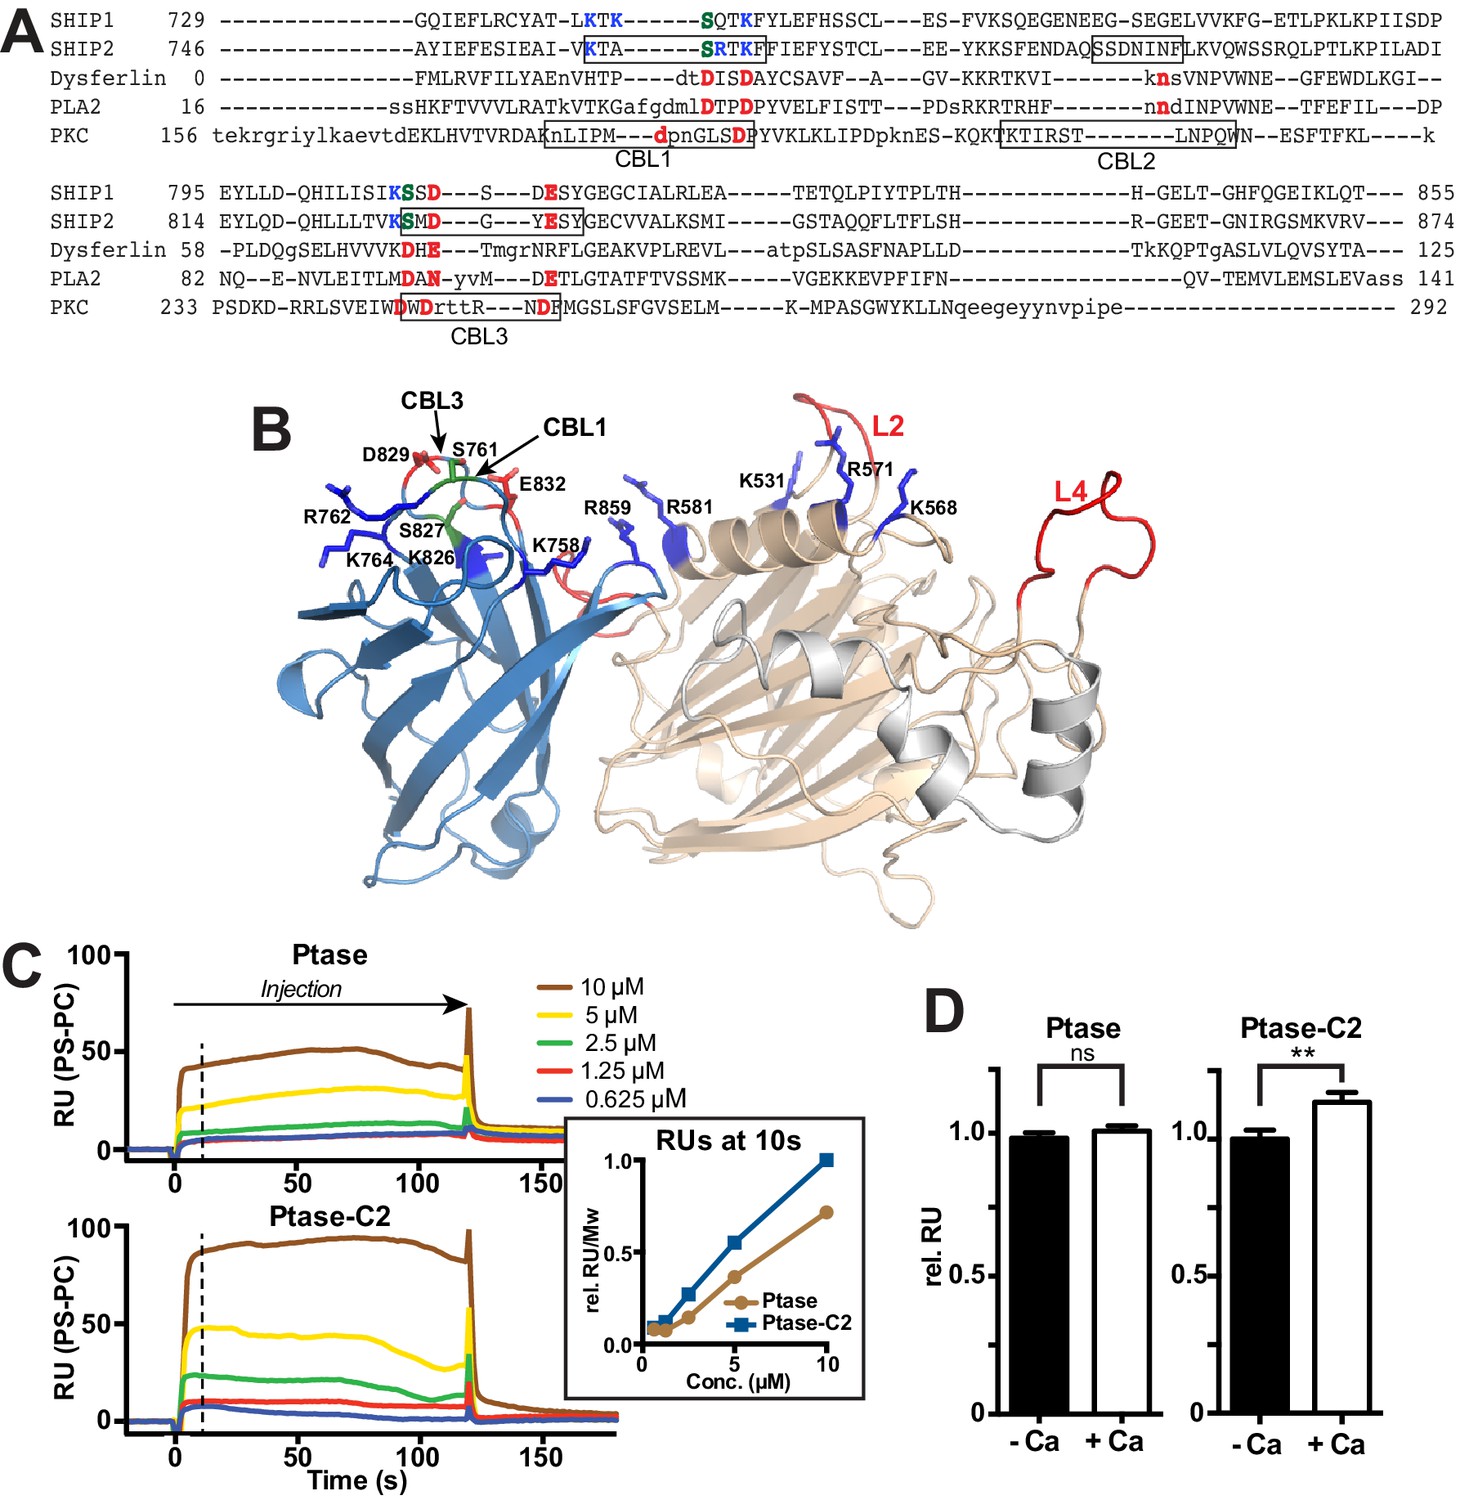
The C2 domain of SHIP2 and lipid binding.
(A) Structure-based sequence alignment of the C2 domains of SHIP2, dysferlin, phospholipase A2 (PLA2) and protein kinase Cα (PKCα) and alignment of the corresponding sequence of SHIP1. Structurally equivalent positions with the SHIP2 C2 domain are in uppercase, insertions relative to SHIP2 are in lowercase. Calcium-binding loops (CBL) 1–3 of PKCα and corresponding loops in SHIP2 are boxed. Conserved acidic Ca2+-binding residues and corresponding residues in SHIP are colored red, changes to serines are green and basic residues within or near the CBL’s in SHIP are colored blue. (B) Putative lipid interactions in the SHIP2 Ptase-C2 region. Conserved acidic residues on CBL3 of SHIP2 (D829 and E832) are colored red and changes to serines green (S761 on CBL1 and S827 on CBL3). Basic residues on the Ptase and C2 domains expected to face the membrane are colored blue. For the mentioned residues, side chains are shown in stick representation. (C) SHIP2 binding to phosphatidylserine (PS) by surface plasmon resonance (SPR). SHIP2 Ptase and Ptase-C2 interactions to PS were studied using vesicles immobilized on a L1 sensor chip. Displayed are sensorgrams showing the difference in response between the active flow cell coated with 30% (mol/mol) PS vesicles and the reference cell containing phosphatidylcholine (PC) vesicles. The horizontal arrow indicates the association phase of Ptase and Ptase-C2 proteins, and the time axis is set to zero at the beginning of the injection. Insert: The SPR response units (RU) at 10 s of injection (dashed line), where we consider the steady state phase to be reached, is plotted. Values are corrected for the molecular weight (Mw) and relative to the highest response for Ptase-C2 at 10 μM. (D) Calcium dependency of the SHIP2 PS interaction. SPR responses of Ptase and Ptase-C2 were recorded as in panel C, but in presence or absence of 0.5 mM CaCl2. Plotted are mean RUs relative to RUs in absence of Ca2+ from triplicate injections of 5 μM protein and error bars represent SEM. ns: p>0.05; **p<0.01 (unpaired Student t test). See also.
-
Figure 2—source data 1
Source data for plots in Figure 2C-insert and 2D.
- https://doi.org/10.7554/eLife.26640.007
Figure 2—figure supplement 1
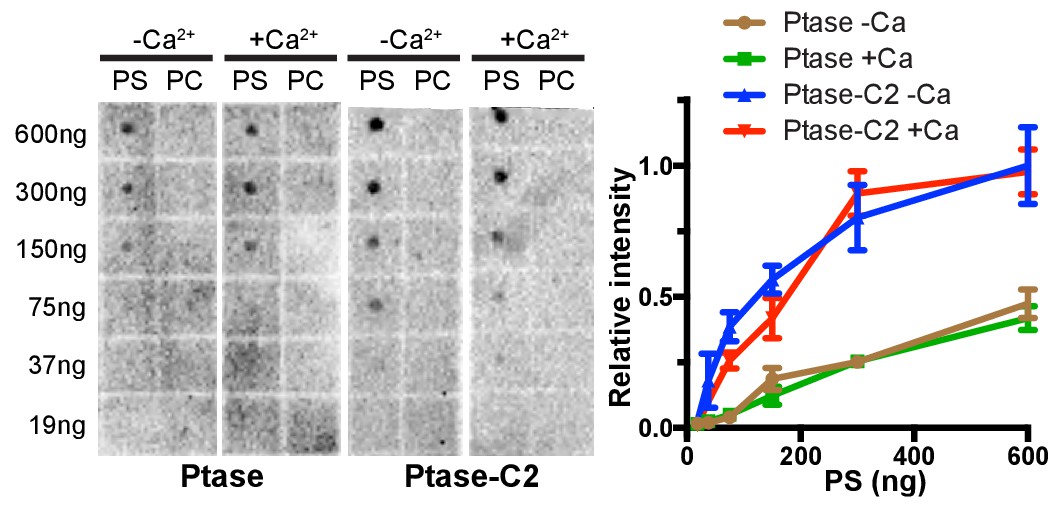
Lipid binding by protein lipid overlay.
A protein lipid overlay (PLO) assay was employed to probe for SHIP binding to indicated amounts of PS-diC16 or PC-diC16 lipids spotted on a nitrocellulose membrane in presence or absence of Ca2+. Experiments were performed in triplicates, of which representative blots are shown on the left and mean quantified values with SEM are plotted for PS binding experiments on the right.
-
Figure 2—figure supplement 1—source data 1
Source data for plot in Figure 2—figure supplement 1.
- https://doi.org/10.7554/eLife.26640.009
Figure 3
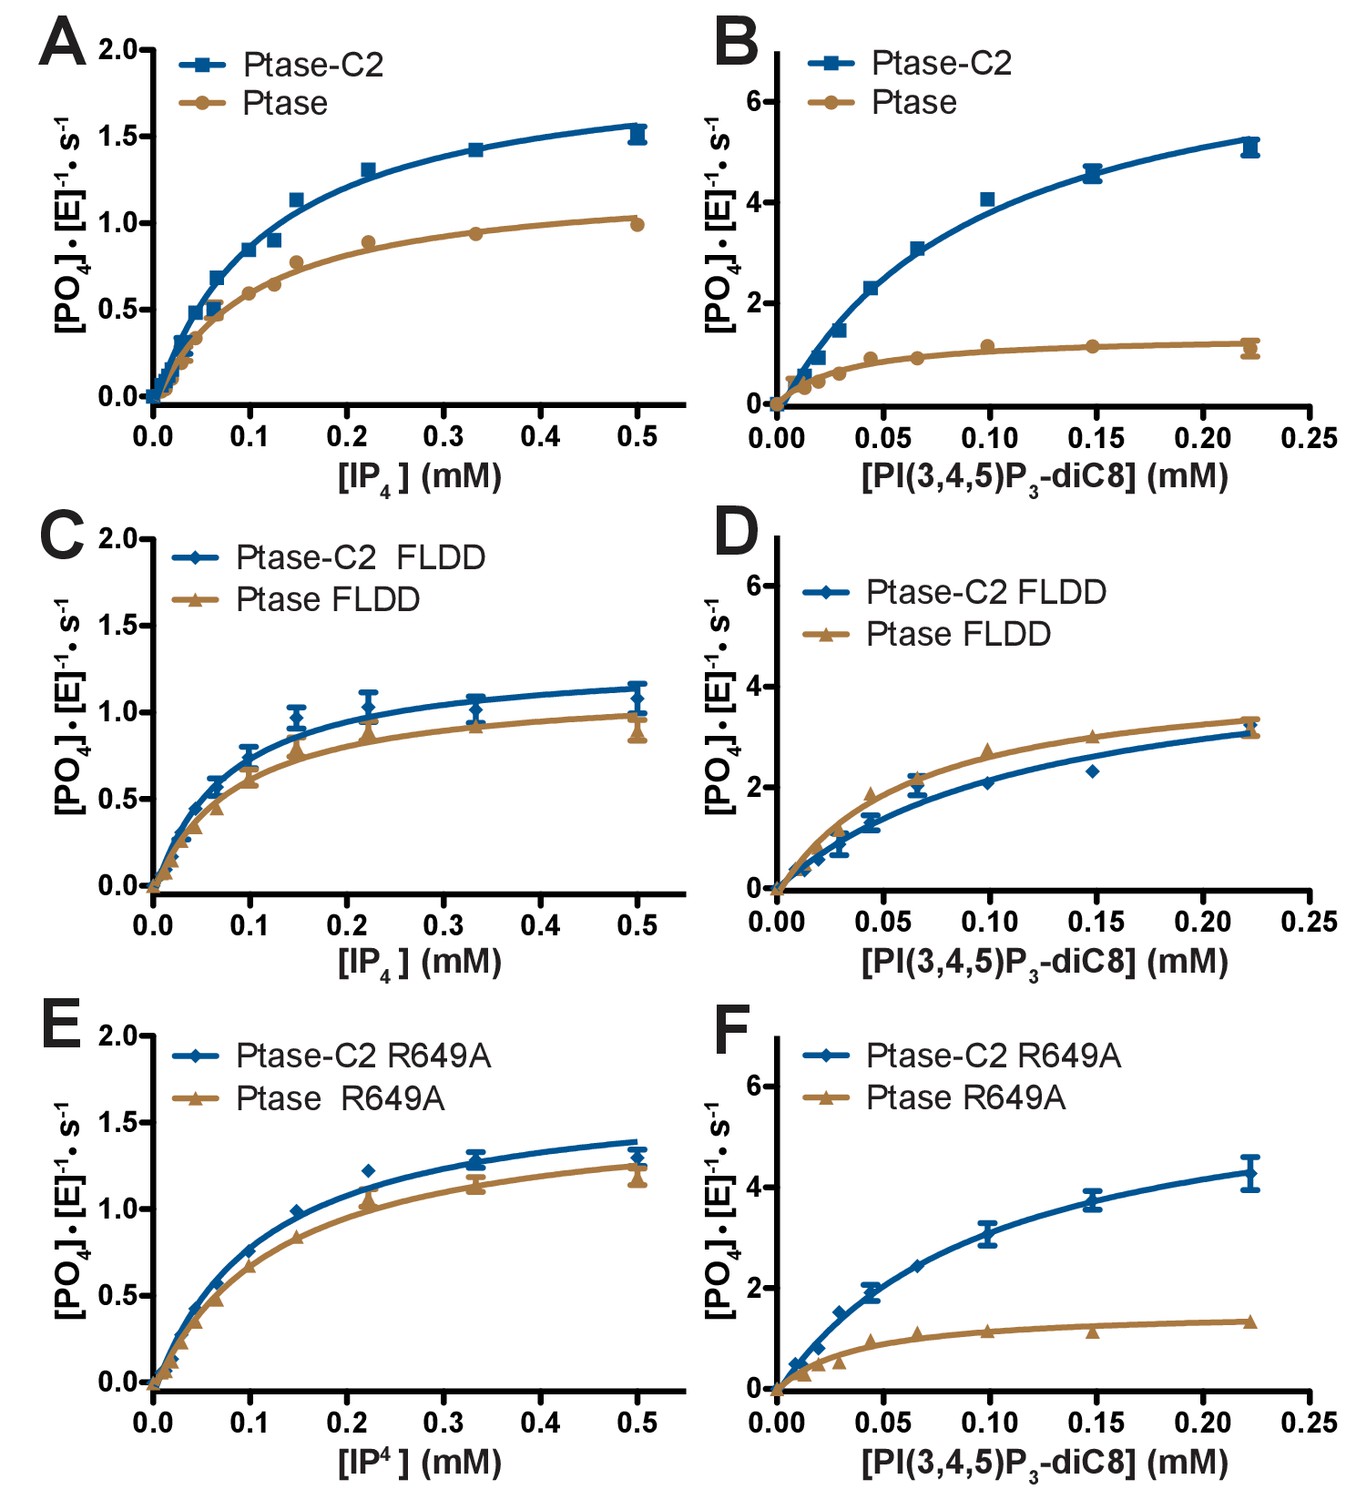
Enzyme kinetics of SHIP2.
(A–F) Enzyme activity for SHIP2 Ptase and Ptase-C2 was measured using a Malachite Green assay, with IP4 or PI(3,4,5)P3-diC8 as substrates. Substrate titrations of wild type SHIP2 (A–B) and the interface mutants FLDD (C–D) and R649A (E–F) are shown. The enzyme concentration used in the shown plots is 400 nM (for IP4) or 50 nM (for PI(3,4,5)P3-diC8). Curves are fitted using the Michelis-Menten equation and derived kcat and KM values are shown in Table 2. Error bars represent SEM from at least three measurements.
-
Figure 3—source data 1
Source data for plots in Figure 3A–F.
Values are in [PO4]*[E]−1*s−1. The values in red were excluded. Numbers (#i) above data indicate independent experiment number. Equation used to fit data in Figure 3A–F: Y = Bo + Vm*X/(X + Km); Variables: Vmax, Km, Bo = baseline. Software used: Graphpad Prism.
- https://doi.org/10.7554/eLife.26640.011
Figure 4
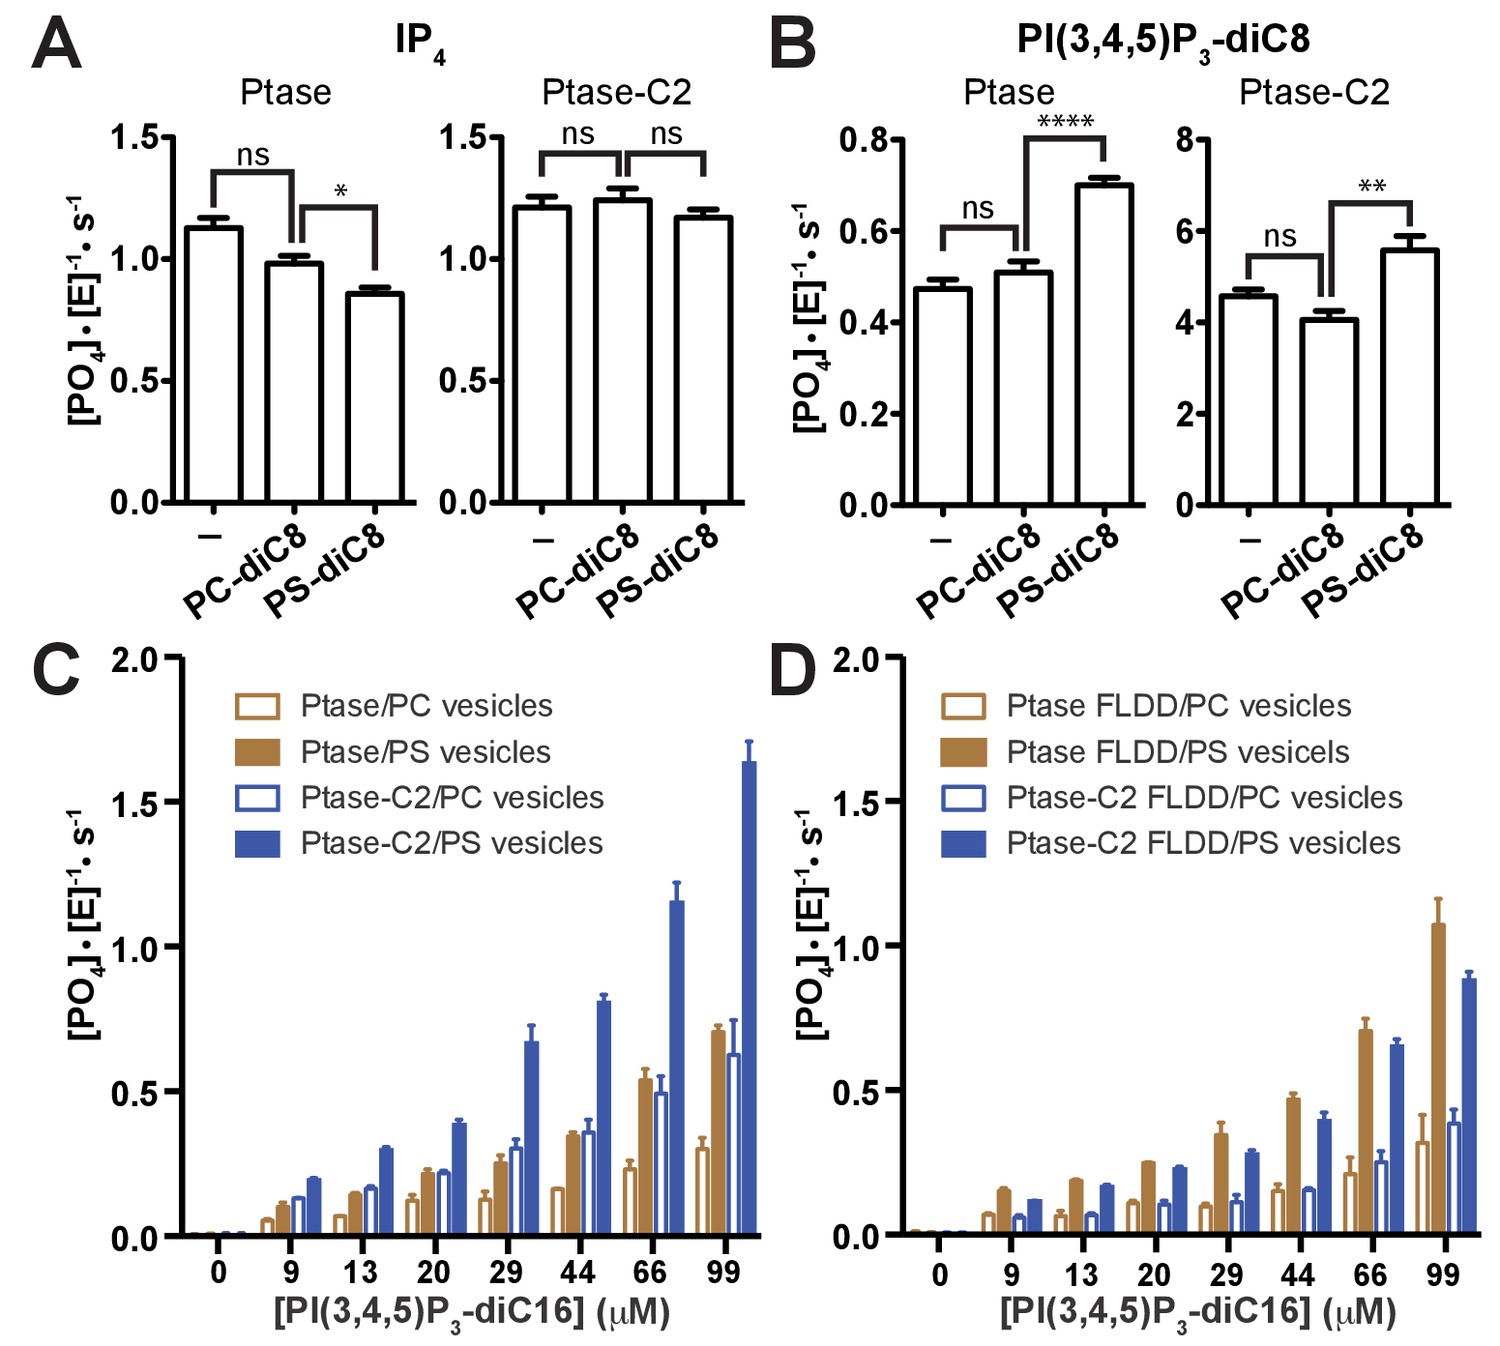
Effect of PS binding on SHIP activity.
(A–B) Activity was measured in presence or absence of 100 μM PC-diC8 or PS-diC8 and as substrate 150 μM IP4 (A) or PI(3,4,5)P3-diC8 (B). Enzyme concentrations used were 400 nM for measurements with IP4 (A) and 400 nM or 50 nM for Ptase and Ptase-C2 reactions, respectively, for measurements with PI(3,4,5)P3-diC8 (B). ns: p>0.05; *p<0.05; **p<0.01; ****p<0.0001 (unpaired Student t test). (C–D) Activity was measured with the substrate PI(3,4,5)P3-diC16 embedded in vesicles (10% mol/mol) that additionally contained 30% (mol/mol) PS or only PC. Enzyme concentrations used were 400 nM Ptase or 250 nM Ptase-C2 (C) or 400 nM of the FLDD interface mutants (D).
-
Figure 4—source data 1
Source data for graphs in Figure 4A–F.
Values are in [PO4]*[E]−1*s−1. The values in red were excluded. Numbers (#i) above data indicate independent experiment number. p-Values are calculated using a two-tailed unpaired Student t test assuming Gaussian distribution. Exact p-values are shown if >0.001.
- https://doi.org/10.7554/eLife.26640.015
Figure 5 with 1 supplement
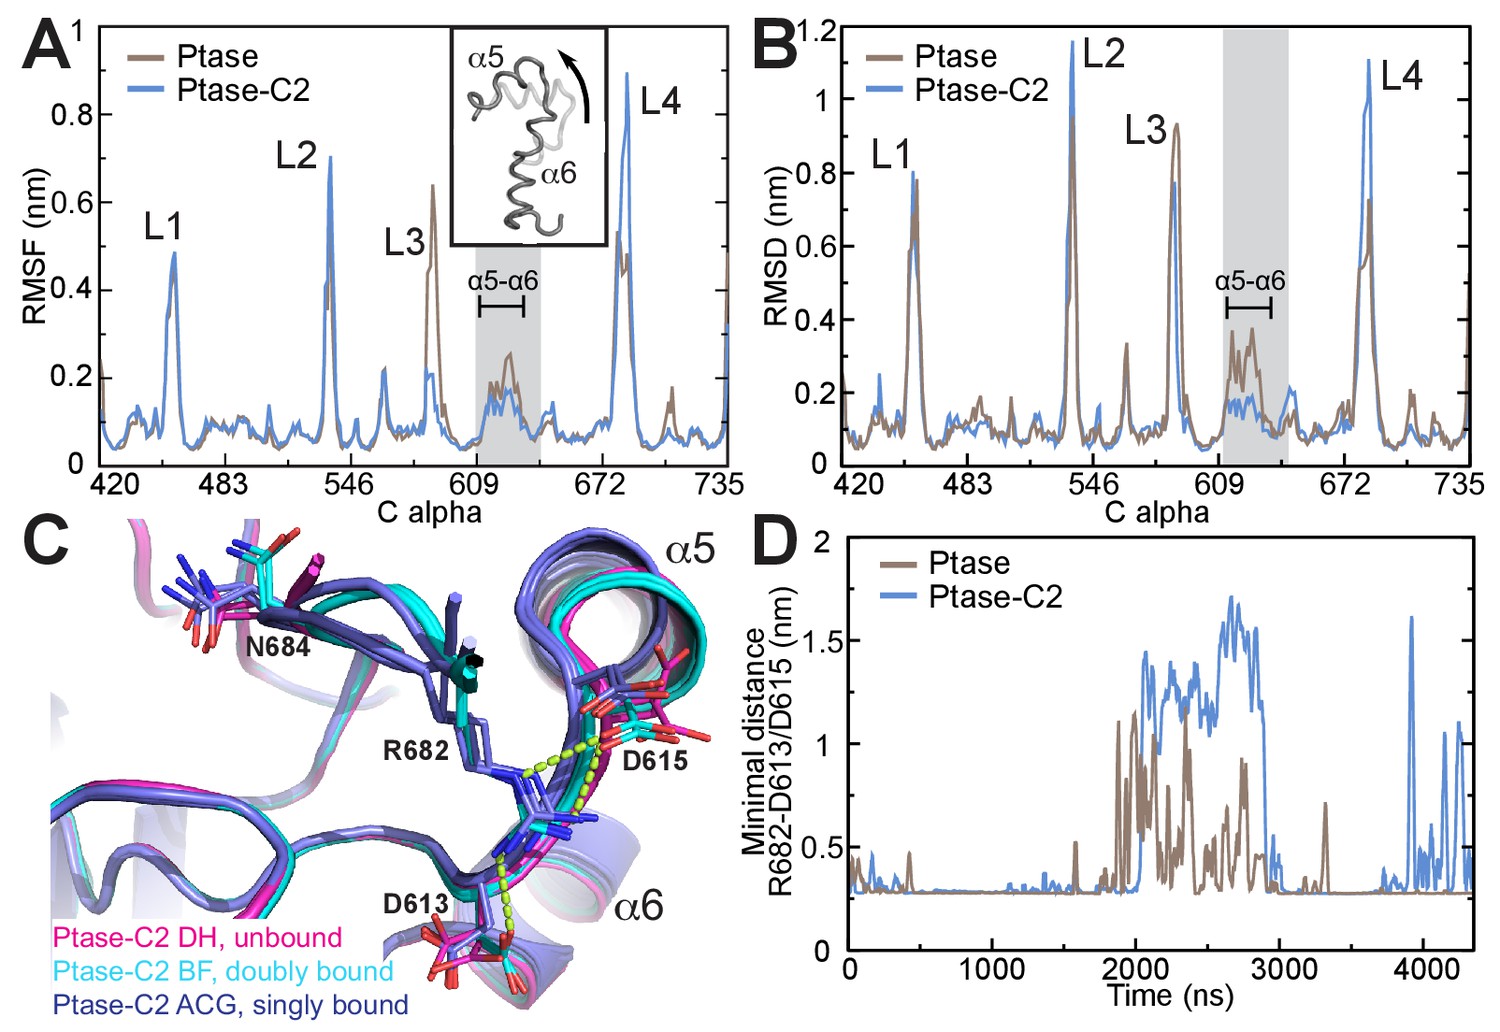
SHIP2 dynamics.
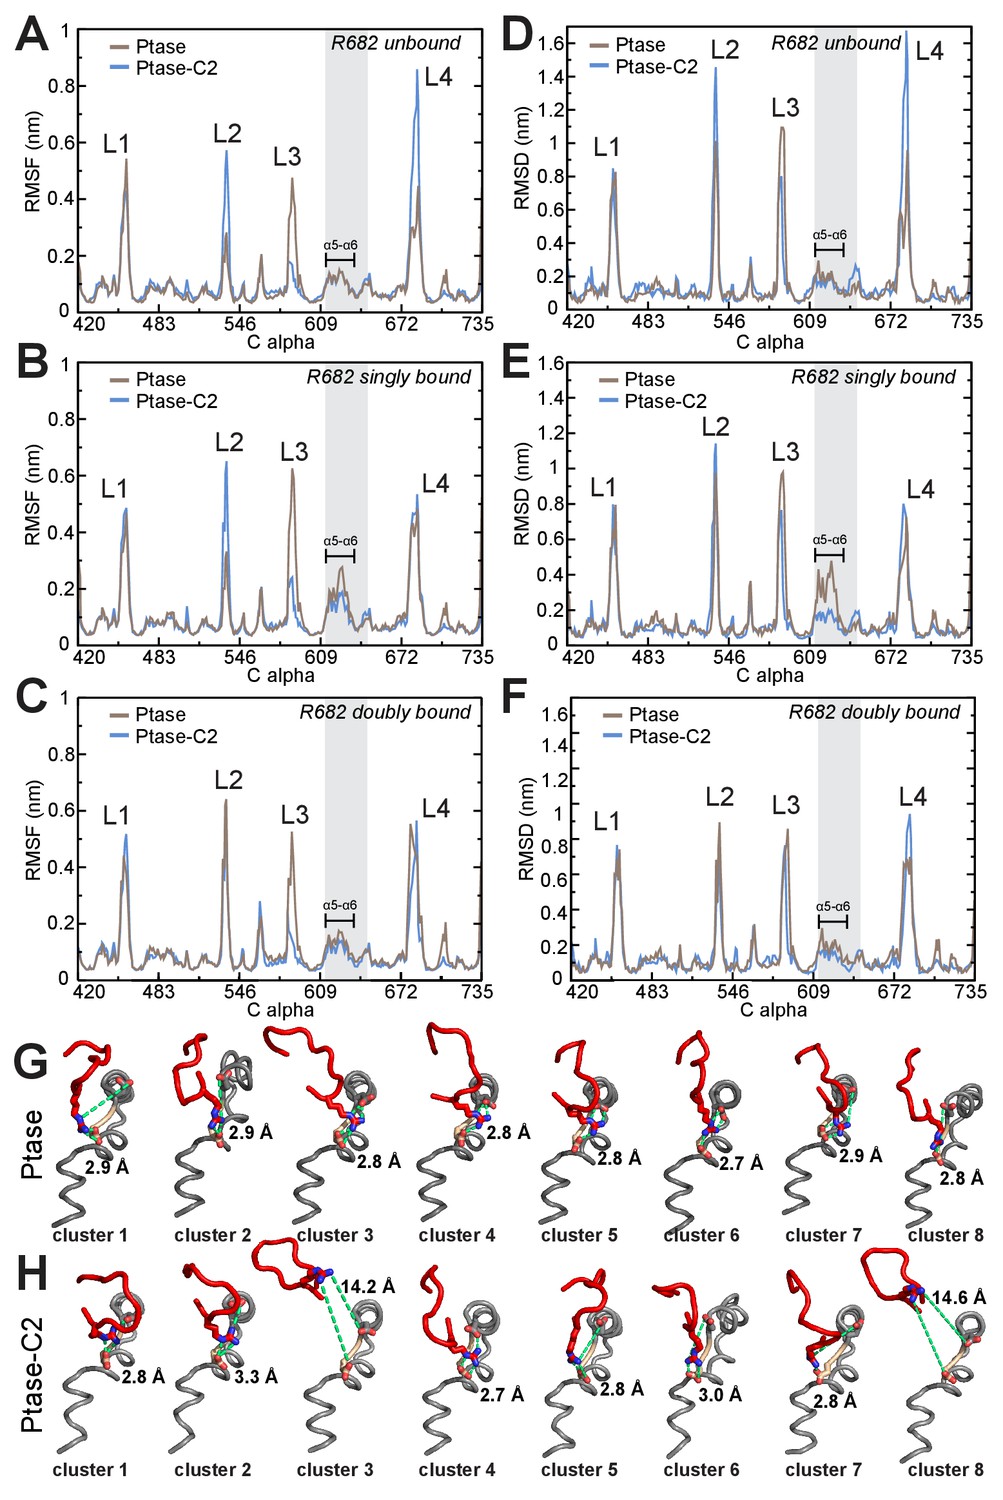
(A) Root mean square fluctuations (RMSF) during MD simulations of the Ptase (brown) or Ptase-C2 (blue) are plotted for Cα atoms in the Ptase domain. Peaks correspond to loop regions (L1–L4) and the region corresponding to helices α5–7 is shaded gray with α5 and α6 indicated. Insert: Shown is the movement of helices α5 and α6 according to the first eigenvector from PCA analysis. (B) Root mean square deviations (RMSD) with respect to the L4-out starting structure, analyzed per residue and averaged over time is shown for Cα atoms in the Ptase domain. (C) Superposition of SHIP2 Ptase-C2 WT structures. R682 unbound structures are shown in magenta (molecules D and H), R682 doubly bound molecules in cyan (molecules B, F) and R682 singly bound molecules in blue (molecules A, C, G). Structures with singly bound R682 display displacement of helix α5. Doubly bound structures exhibit a N684 ‘up’ conformation. Hydrogen bonds between R682 and D613/D615 are shown as light green dashed lines for molecule B. Molecule E is not included since it exhibits an alternate D613 conformation for the singly and doubly bound conformations with stronger occupancy for the singly bound state. (D) Plotted are the minimal distances between R682 and D613/D615 throughout the Ptase (brown) and Ptase-C2 (blue) simulations.
Figure 5—figure supplement 1
SHIP dynamics for different L4 states.
(A–C) RMSF plots of Ptase (brown) and Ptase-C2 (blue) simulations are shown, separated into conformations where R682 is unbound (A), R682 is singly bound (B) or R682 is doubly bound to D613/D615 (C). (D–F) RMSD plots of Ptase (brown) and Ptase-C2 (blue) simulations showing deviations to the doubly bound L4-out starting conformation are shown separated into R682 unbound (D), R682 singly bound (E) and R682 doubly bound conformations (F). R682 is considered bound if the minimal distance (not including hydrogens) to D613/D615 is below 4 Å. RMSD’s are calculated per residue, averaged over time. (G–H) Shown are L4 (red), helix α5 and α6 (grey) including D613 (tan) and D615 (grey) conformations of the eight most represented clusters in Ptase (G) or Ptase-C2 (H) simulations, with cluster one being the most frequently visited conformation. R682, D613 and D615 are shown as sticks and the R682-D613/D615 distances indicated as green dashed lines with the minimal distances indicated.
Figure 6 with 1 supplement
Model of substrate bound SHIP2.
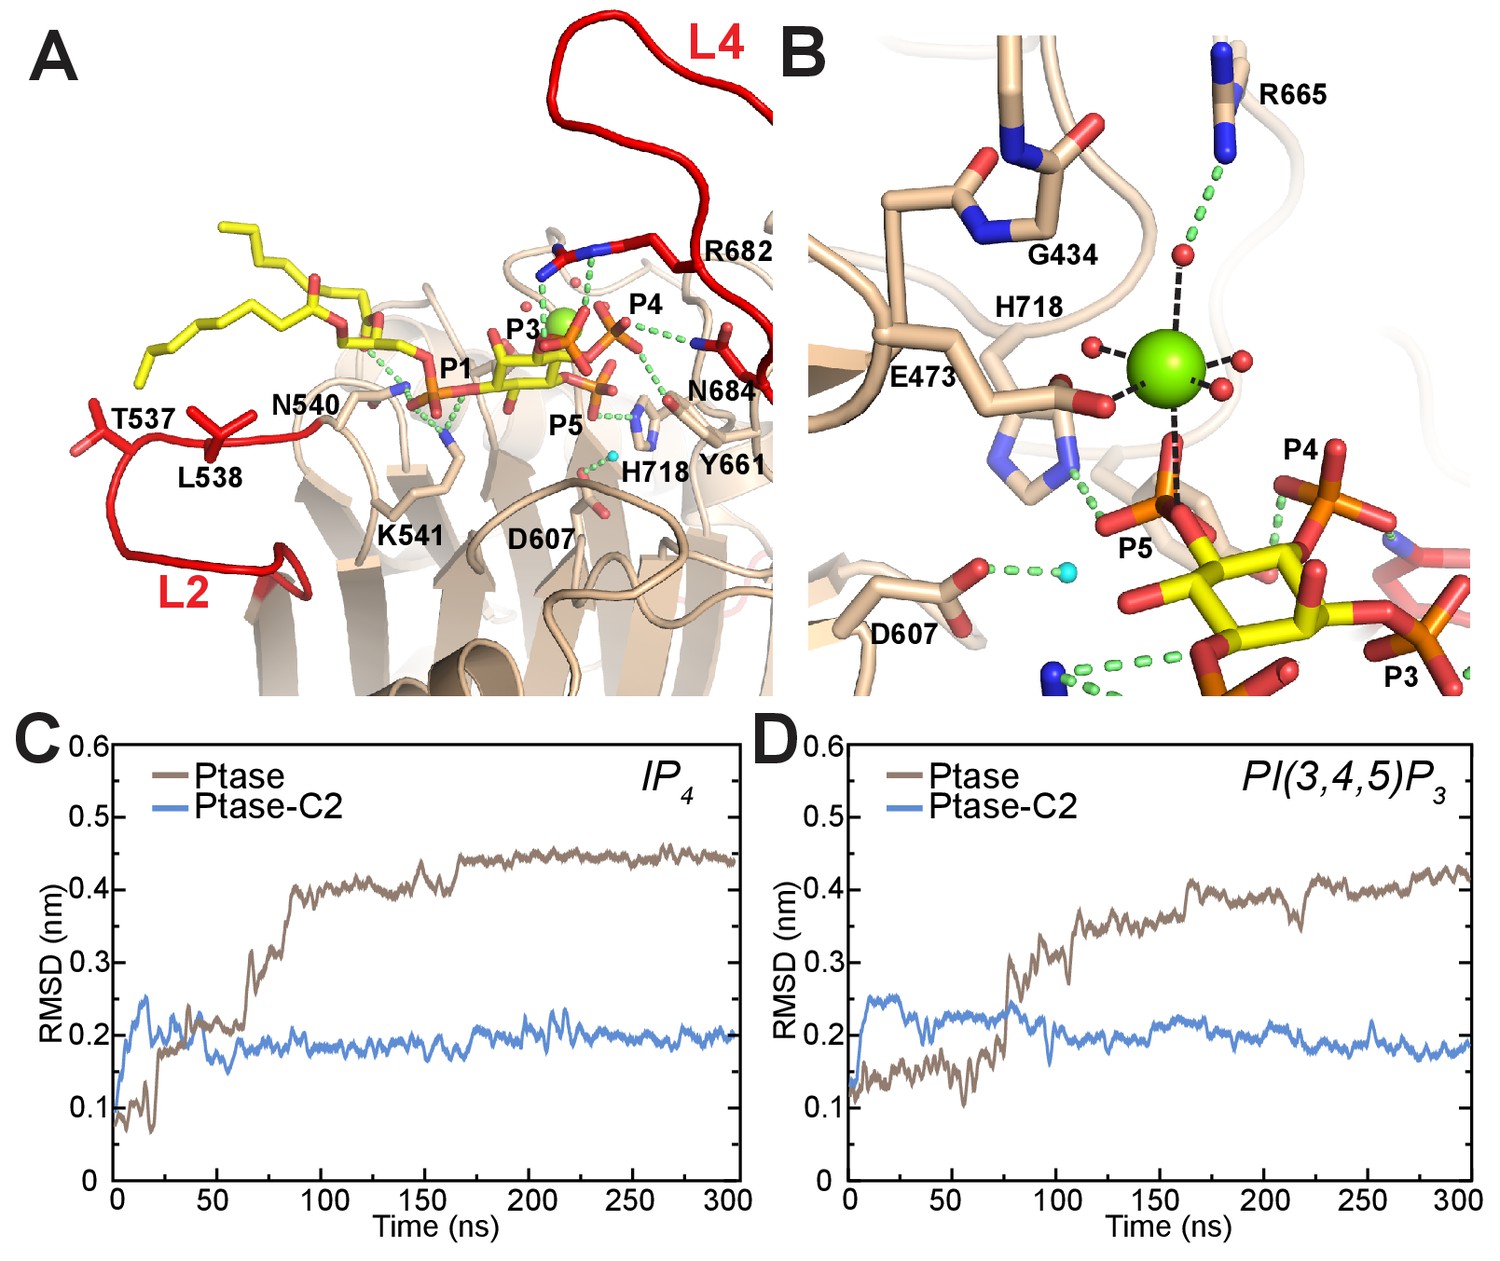
(A) The SHIP2 Ptase-PI(3,4,5)P3-diC8 complex is modeled based on crystal structures of the homologue INPP5B crystal structure bound to PI(4)P (pdbs: 3MTC). L4 is in the ‘in’ conformation and R682 makes hydrogen bonds to the PI(3,4,5)P3 3-phosphate (P3). N540 and K541 interact with P1, N684 and Y661 with P4, H718 with P5 and L2 with PI(3,4,5)P3 lipid chains. The attacking water, bound to D607, is colored light blue and the Mg2+ ion is shown as green sphere. (B) Close-up of the Mg2+ coordination. (C–D) Plotted are RMSDs of the substrate headgroup atoms compared to the starting positions during MD simulations of the SHIP2 Ptase or Ptase-C2 bound to IP4 (C) or PI(3,4,5)P3-diC8 (D). The simulations are started with substrate positions according to the model shown in panel (A).
Figure 6—figure supplement 1
Structure of Ptase-C2 D607A, crystallized in presence of PI(3,4,5)P3-diC8 and Mg2+.
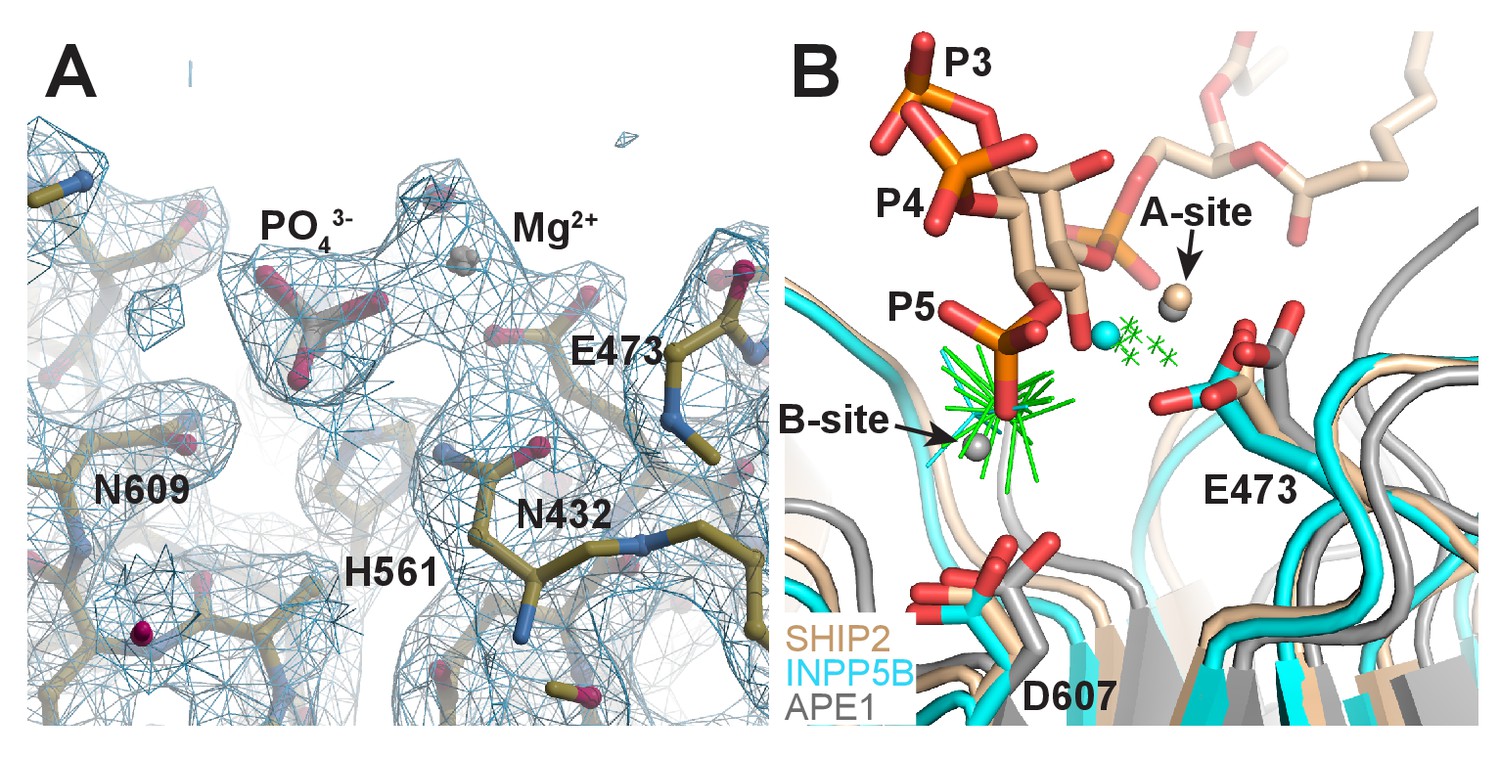
(A) Electron density for one Mg2+ and one phosphate group is clearly visible in 6 of the eight molecules (shown is molecule H). 2Fo-Fc electron density is shown in blue countered at a σ level of 1.0. (B) Superposition of our model of the SHIP2 Ptase bound to PI(3,4,5)P3 and Mg2+ in the Michaelis-Menten complex (tan) with the 6 Ptase-C2 D607A molecules bound to Mg2+ and phosphate (green; only Mg2+ as small crosses and phosphates are shown), the Mg2+ and phosphate bound INPP5B structure (cyan, pdb: 5A7I) and the two-metal bound APE1 structure (grey, pdb: 1E9N). The E473 and D607 side chains labeling corresponds to SHIP2 numbering and the A- and B-metal sites in the APE1 structure are indicated.
Figure 7 with 1 supplement
SHIP2 mutational analysis.
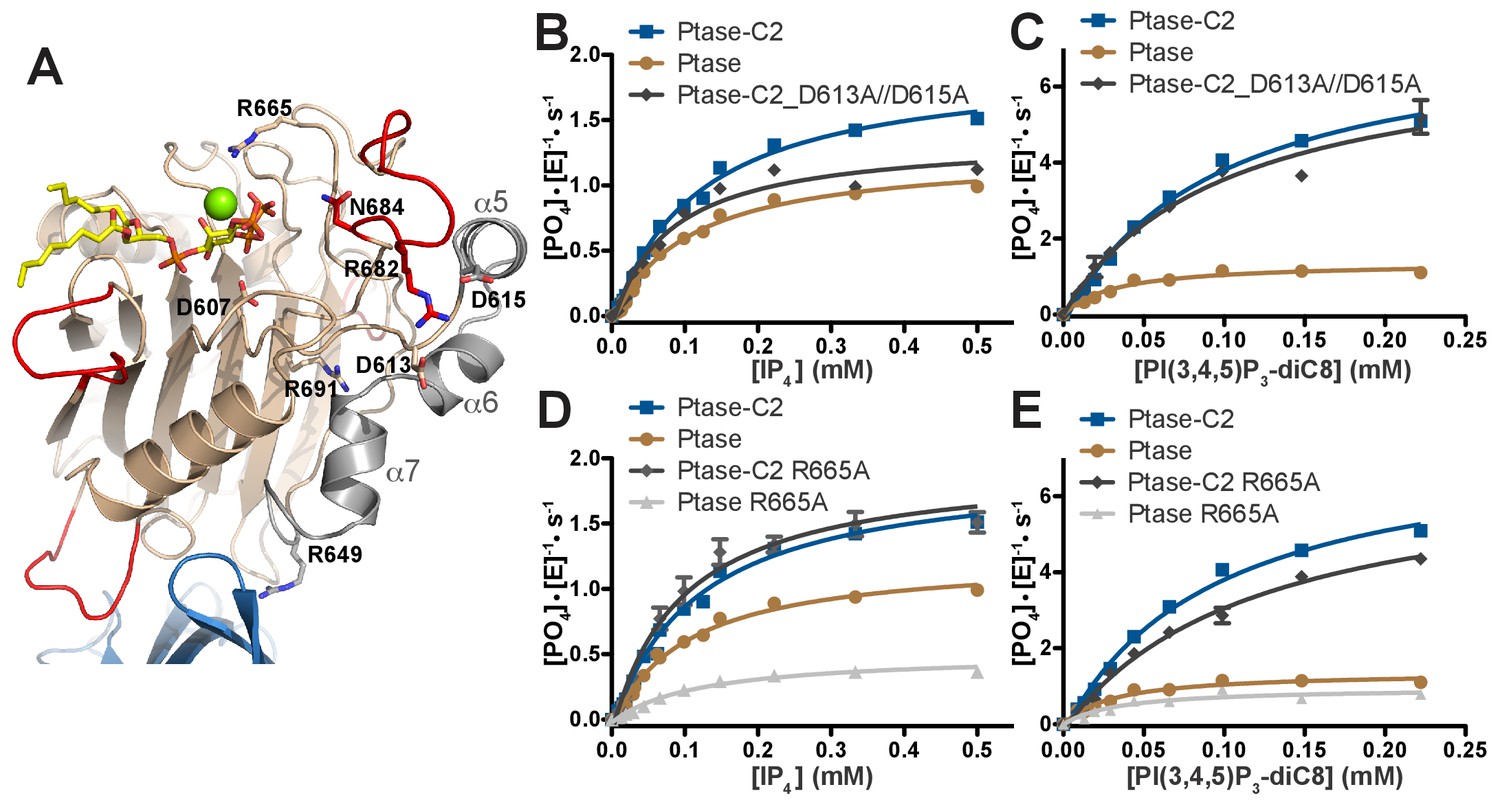
(A) Residues mutated in the SHIP2 Ptase domain are shown as sticks and are labeled. (B–E) For mutants that display significant activity (D613A/D615A and R665A), substrate titration curves are shown. The enzyme concentration used in the shown plots is 400 nM (with IP4) or 50 nM (with PI(3,4,5)P3-diC8). Curves are fitted using the Michaelis-Menten equation and derived kcat and KM values are shown in Table 3. Error bars represent SEM from at least three measurements.
-
Figure 7—source data 1
Source data for plots in Figure 7B–E.
Values are in [PO4]*[E]−1*s−1. The values in red were excluded. Numbers (#i) above data indicate independent experiment number. Equation used to fit data in Figure 3A–F: Y = Bo + Vm*X/(X + Km); Variables: Vmax, Km, Bo = baseline. Software used: Graphpad Prism.
- https://doi.org/10.7554/eLife.26640.025
Figure 7—figure supplement 1
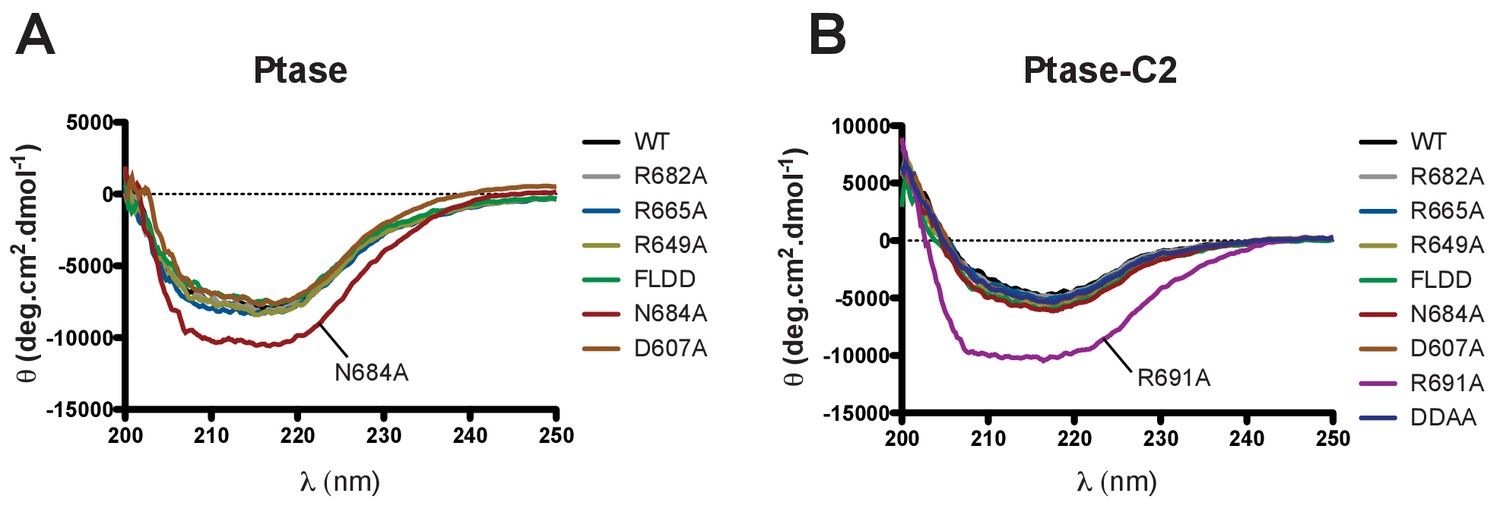
Circular dichroism analysis of purified SHIP proteins.
(A–B) Far UV CD spectra of SHIP2 Ptase (A) and Ptase-C2 (B) are shown for WT and all purified mutants.
Figure 8 with 1 supplement
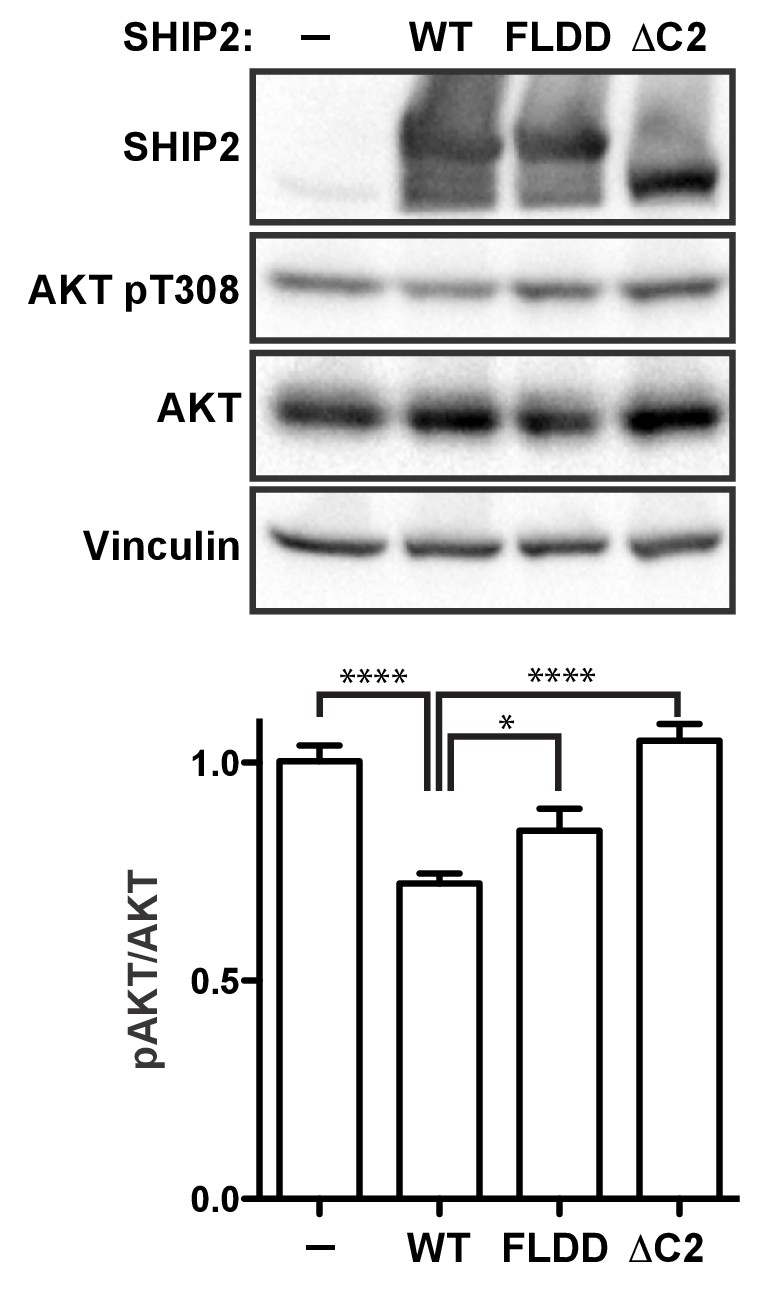
SHIP2 cellular activity.
Full-length SHIP2 proteins were transiently expressed in HEK293 cells and resulting Akt-pT308 levels monitored. Shown are transfections of empty vector (-), wild type SHIP2 (WT), the FLDD mutant and C2 deleted SHIP2 (ΔC2). A typical blot is shown and quantifications of blots are averaged from eight independent experiments, each in triplicates (n = 24), with SEM’s indicated. *p<0.05; ****p<0.0001 (unpaired Student t test).
-
Figure 8—source data 1
Source data for graph in Figure 8.
Values are pAkt/totalAkt intensities, scaled relative to empty vector (-).The values in red were excluded. Numbers (#i) above data indicate independent experiment number. p-Values are calculated using a two-tailed unpaired Student t test assuming Gaussian distribution. Exact p-values are shown if >0.001. *Replicas from experiment #2 were loaded on different gels and scaled relative to empty vector (i.e. all scale to 1). Therefore empty vector values of experiment #2 are excluded in the statistical evaluation.
- https://doi.org/10.7554/eLife.26640.030
Figure 8—figure supplement 1
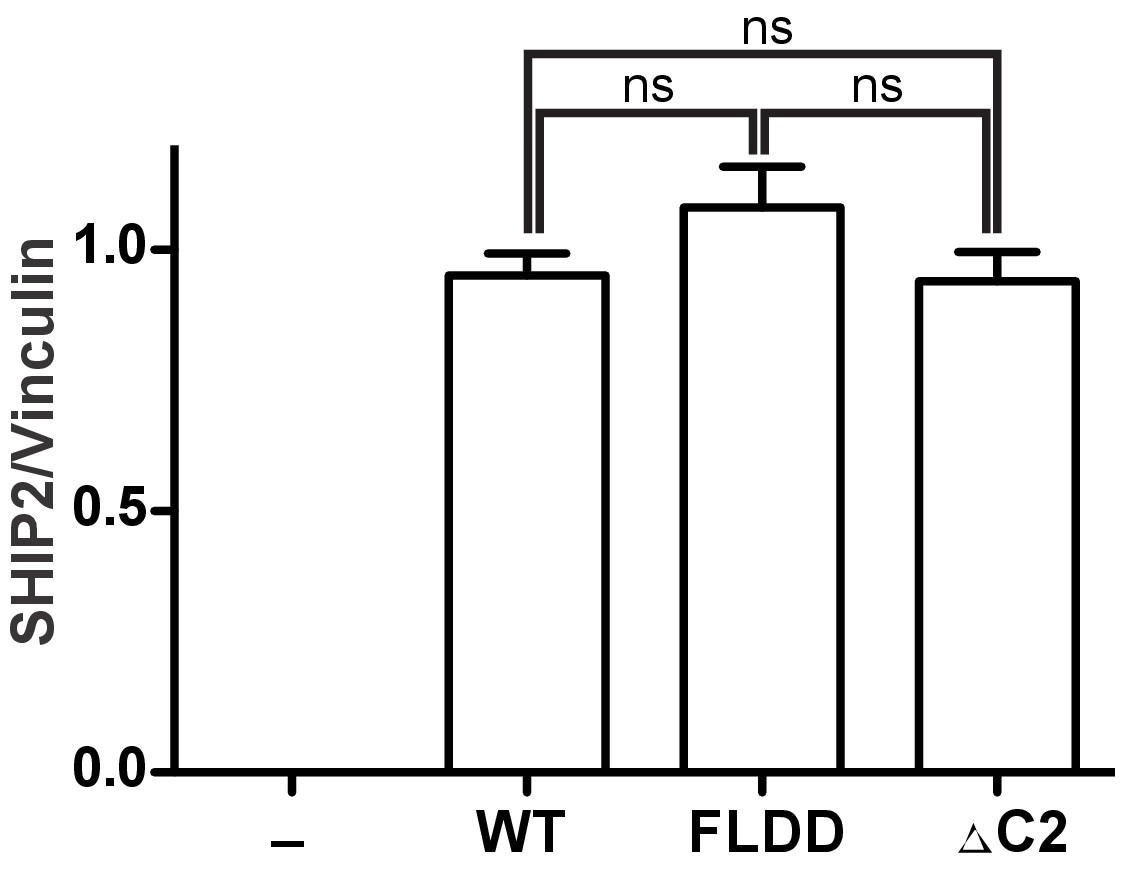
Quantification of SHIP expression levels.
HEK293 cells were transiently transfected with the empty vector (-) or vector expressing GST fused full-length SHIP2 constructs (WT, FLDD or ∆C2). Expression levels were assessed by quantifying immunoblots from eight independent experiments, each in triplicates (n = 24). ns: p>0.05 (unpaired Student t test).
-
Figure 8—figure supplement 1—source data 1
Source data for graph in Figure 8—figure supplement 1.
Values are SHIP2/Vinculin intensities, scaled relative to wild type-SHIP2 (WT).The values in red were excluded. Numbers (#i) above data indicate independent experiment number. p-Values are calculated using a two-tailed unpaired Student t test assuming Gaussian distribution. Exact p-values are shown.
- https://doi.org/10.7554/eLife.26640.032
Figure 9
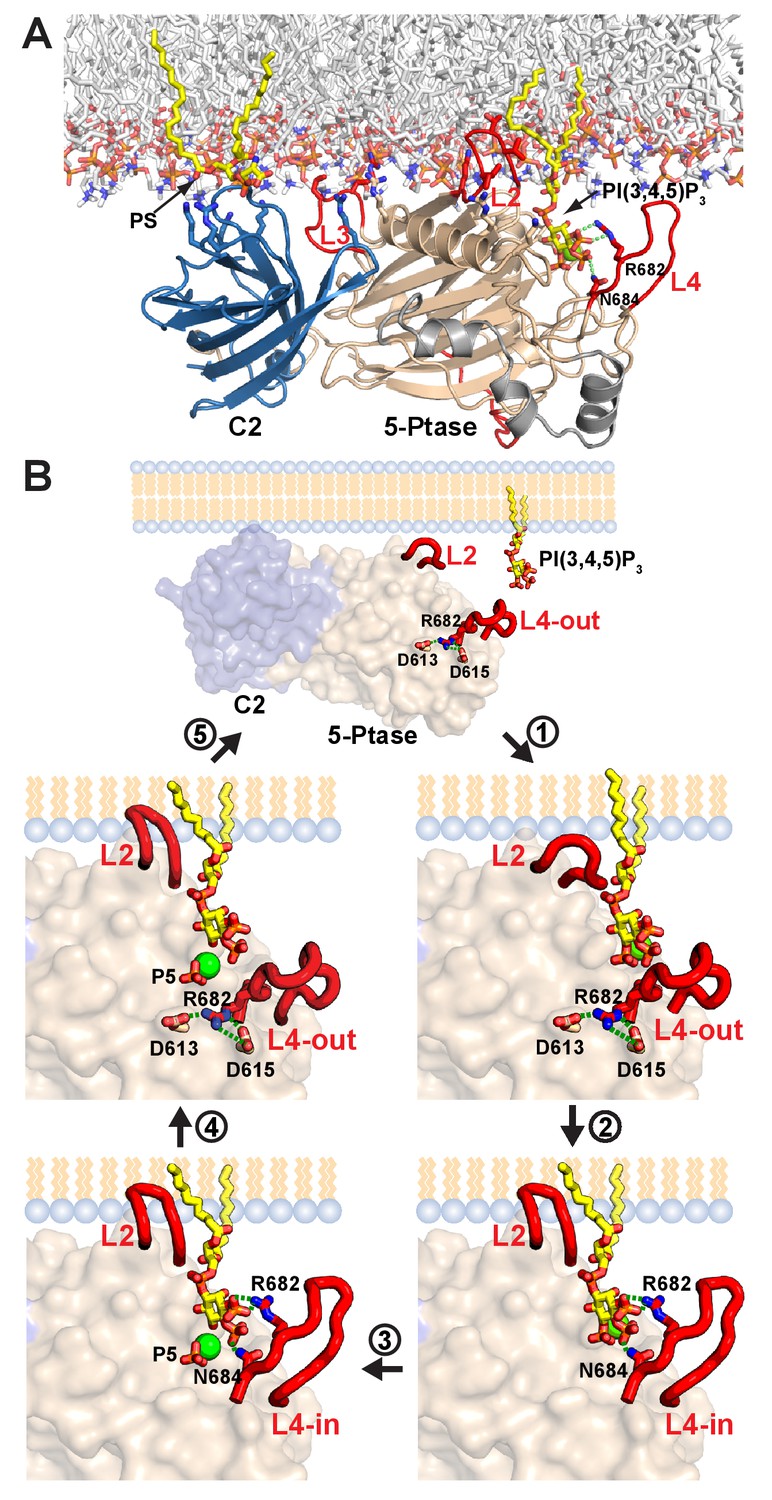
Model of SHIP2 catalytic cycle.
(A) Model of SHIP2 Ptase-C2 docked to the membrane and with PI(3,4,5)P3-Mg2+ bound to the active site. Basic and hydrophobic side chains of K531, I534, L538, K568, R571, R581, R588 and L590 in the Ptase and R762, K764, K779, K826 and R859 in the C2 domain (shown as sticks) are modelled to contribute to membrane interactions. L2, containing I534 and L538 is modeled to penetrate the lipid bilayer. The C2-PS interaction is based on PDB entry 1DSY and PI(3,4,5)P3 interactions on the model shown in Figure 6A. (B) The catalytic cycle. Top: Docking of Ptase-C2 to the membrane orients via the rigid domain interface the Ptase active site towards its membrane substrate. Step 1: L4 is ‘out’ to allow entry of the PI(3,4,5)P3 headgroup. Step 2: Initial engagement of the substrate 4 P with N684 destabilizes the doubly bound L4-out conformation and initiates the switch to L4-in, which allows R682 interactions with the substrate 3 P. L2 opens and penetrates the membrane to interact with PI(3,4,5)P3 lipid chains. Step 3: With the substrate correctly positioned, catalysis proceeds and the cleaved 5 P and the Mg2+ion move towards the metal B-site (see text). Step 4: Product interactions are weakened by L4 moving ‘out’, releasing R682 from the product 3 P. Further, N684 releases 4 P interactions by switching to bind H674 (see Figure 1F). Step 5: The weakly bound product is released and a new substrate can be engaged.
Author response image 1
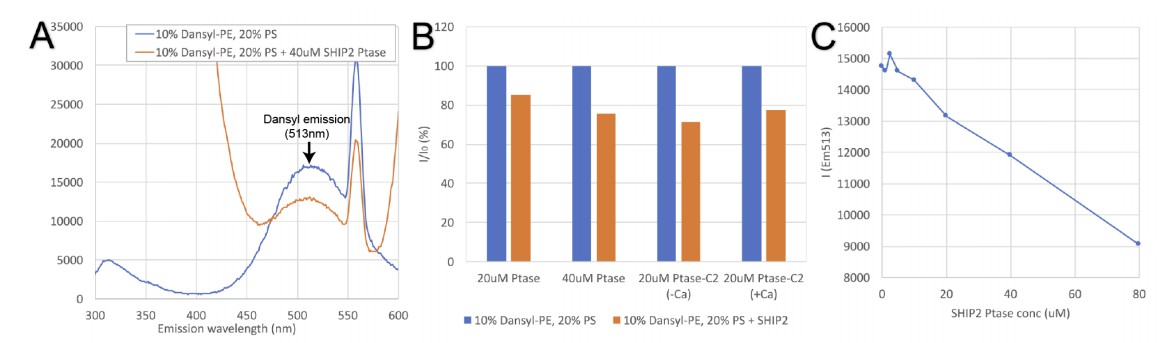
Tryptophan-dansyl FRET assay.
(A) Emission scan resulting from excitation at 280nm of dansyl vesicles alone (blue trace) or vesicles in presence of SHIP2 Ptase (red trace). SHIP2 Ptase induces a reduction of the emission signal at the dansyl emission (maximum at 513nm). (B) Emission of dansyl vesicles alone (I0 set to 100%; blue bars) or in presence of SHIP2 Ptase or PtaseC2 (as% of I0; red bars). (C) The emission at 513nm of dansyl vesicles decreases linearly with increasing concentrations of SHIP2 Ptase.
Videos
Video 1
Principal component analysis of Ptase simulation.
Movements according to the first four eigenvectors from the principle component analysis of the Ptase simulation are shown. The starting conformation in the doubly bound L4-out conformation, based on molecule B of the Ptase-C2 crystal structure, is superimposed and colored blue.
Video 2
Principal component analysis of Ptase-C2 simulation.
Movements according to the first four eigenvectors from the principle component analysis of the Ptase-C2 simulation are shown. The starting conformation in the doubly bound L4-out conformation, based on molecule B of the Ptase-C2 crystal structure, is superimposed and colored blue.
Video 3
Simulation of Ptase with substrate.
The first 100 ns of the trajectory from the simulation of Ptase bound to PI(3,4,5)P3-diC8 and Mg2+ are shown.
Video 4
Simulation of Ptase-C2 with substrate.
The first 100 ns of the trajectory from the simulation of Ptase-C2 bound to PI(3,4,5)P3-diC8 and Mg2+ are shown.
Video 5
The SHIP2 catalytic cycle.
The conformational changes between L4-out doubly bound, L4-out singly bound and L4-in conformations are shown as morphs between observed crystal structures and assembled in sequence according to the model of the catalytic cycle explained in Figure 9B.
Tables
Table 1
Diffraction and refinement statistics.
| Ptase-C2 WT | Ptase-C2 FLDD | Ptase-C2 FLDD | Ptase-C2 D607A | |
|---|---|---|---|---|
| Space group | P212121 | P21 | I2 | P212121 |
| Cell dimensions | ||||
| a, b, c (Å) | 136.0, 175.8, 176.9 | 44.0, 81.1, 128.9 | 43.7, 73.4, 158.0 | 137.1, 177.1, 177.4 |
| α, β, γ (°) | 90.0, 90.0, 90.0 | 90.0, 92.9, 90.0 | 90.0, 90.7, 90 | 90.0, 90.0, 90.0 |
| Resolution (Å)* | 48.97–1.96 (1.99–1.96) | 81.12–1.94 (1.99–1.94) | 78.98–1.85 (1.89–1.85) | 49.17–2.65 (2.70–2.65) |
| Rmerge* | 8.0 (88.1) | 13.3 (110.7) | 5.9 (59.5) | 16.1 (134.4) |
| Rmeas* | 8.6 (95.6) | 14.4 (120.0) | 7.0 (70.4) | 17.0 (142.5) |
| Rpim* | 3.3 (36.8) | 5.5 (45.9) | 3.8 (37.2) | 5.5 (46.7) |
| CC (1/2)* | 0.999 (0.743) | 0.998 (0.787) | 0.999 (0.768) | 0.996 (0.700) |
| Mean (I/σ(I))* | 14.8 (2.1) | 11.8 (2.3) | 11.6 (2.1) | 13.4 (2.2) |
| Completeness (%)* | 100.0 (100.0) | 100.0 (100.0) | 99.3 (99.1) | 100.0 (100.0) |
| Multiplicity * | 6.8 (6.7) | 6.8 (6.7) | 3.4 (3.5) | 9.0 (8.9) |
| Refinement | ||||
| Resolution (Å) | 48.96–1.96 | 81.12–1.94 | 78.98–1.85 | 49.17–2.65 |
| No. reflections | 287002 | 63790 | 40283 | 119204 |
| Rwork/Rfree | 18.0/20.8 | 19.0/22.9 | 17.8/20.5 | 20.6/24.5 |
| No. atoms | ||||
| Protein | 28142 | 6901 | 3423 | 27555 |
| Ligand | 225 | 39 | 16 | 237 |
| Water | 1564 | 288 | 139 | 284 |
| B- factors | ||||
| Protein | 46.77 | 27.37 | 34.01 | 61.54 |
| Ligand/ion | 42.66 | 34.64 | 42.10 | 66.88 |
| Water | 44.01 | 29.82 | 38.30 | 45.57 |
| R.m.s. deviation | ||||
| Bond lengths (Å) | 0.009 | 0.010 | 0.008 | 0.009 |
| Bond angles (°) | 1.306 | 1.354 | 1.260 | 1.267 |
-
*Highest resolution range shown in parentheses
Table 2
Enzymatic parameters are calculated by fitting the Michaelis-Menten equation to substrate titrations. Enzyme concentrations used for activity measurements were 400 nM, or if this caused saturated signals 50 nM (*).
| Ptase | Ptase-C2 | |||||||
|---|---|---|---|---|---|---|---|---|
| IP4 | PI(3,4,5)P3 | IP4 | PI(3,4,5)P3 | |||||
| kcat (s−1) | KM (μM) | kcat (s−1) | KM (μM) | kcat (s−1) | KM (μM) | kcat (s−1) | KM (μM) | |
| WT | 1.32 ± 0.02 | 98 ± 7 | 0.69 ± 0.02 | 43 ± 4 | 2.02 ± 0.04 | 115 ± 8 | 7.83 ± 0.26* | 94 ± 9* |
| FLDD | 1.20 ± 0.05 | 82 ± 13 | 4.44 ± 0.17* | 61 ± 8* | 1.39 ± 0.06 | 73 ± 13 | 4.79 ± 0.49* | 122 ± 31* |
| R649A | 1.64 ± 0.05 | 126 ± 13 | 1.35 ± 0.06 | 59 ± 8 | 1.79 ± 0.05 | 110 ± 10 | 6.37 ± 0.42* | 100 ± 18* |
-
Table 2—source data 1
Source data for values shown in Table 2.
All values are [PO4] (in μM). Numbers (#i) above data indicate independent experiment number. Most kinetic parameters (kcat, KM) are extracted from curves shown in Figure 3, for which source data are available with this figure. Below source data are shown for cases where experiments were repeated at higher enzyme concentration (400 nM) to extract reliable kinetic parameters. Equation used to extract Vmax and KM: Y = Bo + Vm*X/(X + KM); Variables: Vmax, KM, Bo = baseline. Software used: Graphpad Prism.
- https://doi.org/10.7554/eLife.26640.013
Table 3
Enzymatic parameters are calculated by fitting the Michaelis-Menten equation to substrate titrations. Enzyme concentrations used for activity measurements were 400 nM, or if this caused saturated signals 50 nM (*). NA, not analyzed; ND, not determinable.
| Ptase | Ptase-C2 | |||||||
|---|---|---|---|---|---|---|---|---|
| IP4 | PI(3,4,5)P3 | IP4 | PI(3,4,5)P3 | |||||
| kcat (s−1) | KM (μM) | kcat (s−1) | KM (μM) | kcat (s−1) | KM (μM) | kcat (s−1) | KM (μM) | |
| R691A | NA | NA | NA | NA | ND | ND | ND | ND |
| D613A, D615A | NA | NA | NA | NA | 1.45 ± 0.05 | 76 ± 11 | 7.10 ± 0.57* | 100 ± 22* |
| R682A | ND | ND | ND* | ND* | 0.27 ± 0.04 | ND | 1.74 ± 0.23 | 93 ± 35 |
| N684A | ND | ND | ND | ND | ND | ND | ND | ND |
| R665A | 0.53 ± 0.03 | 119 ± 19 | 0.23 ± 0.01 | 43 ± 10 | 2.07 ± 0.09 | 94 ± 15 | 7.02 ± 0.37* | 119 ± 16* |
| D607A | NA | NA | NA | NA | ND | ND | ND | ND |
-
Table 3—source data 1
Source data for values shown in Table 3.
All values are [PO4] (in μM). Numbers (#i) above data indicate independent experiment number. Most kinetic parameters (kcat, KM) are extracted from curves shown in Figure 6, for which source data are available with this figure. Below source data are shown for cases where no curve is shown or where experiments were repeated at higher enzyme concentration (400 nM) to extract reliable kinetic parameters. Equation used to extract Vmax and KM: Y = Bo + Vm*X/(X + KM); Variables: Vmax, KM, Bo = baseline. Software used: Graphpad Prism.
- https://doi.org/10.7554/eLife.26640.028
Additional files
-
Supplemental file 1
Thermal melting (Tm) of SHIP2 WT and mutants.
Tm values are determined by thermofluor. NA, not analyzed; WS, weak signal.
- https://doi.org/10.7554/eLife.26640.035
Download links
A two-part list of links to download the article, or parts of the article, in various formats.
Downloads (link to download the article as PDF)
Open citations (links to open the citations from this article in various online reference manager services)
Cite this article (links to download the citations from this article in formats compatible with various reference manager tools)
Structural basis for interdomain communication in SHIP2 providing high phosphatase activity
eLife 6:e26640.
https://doi.org/10.7554/eLife.26640


