Longitudinal imaging of Caenorhabditis elegans in a microfabricated device reveals variation in behavioral decline during aging
- School of Engineering and Applied Sciences, University of Pennsylvania, United States
- Perelman School of Medicine, University of Pennsylvania, United States
Figures
Figure 1 with 4 supplements

WorMotel design, fabrication, preparation, and experimental setup.
(a) 3D rendering of WorMotel geometry. (b) Schematic cross-section of a single well. (c) Fabrication and loading process (d) Image of WorMotel filled with agar, bacteria, and adult C. elegans. (e) Experimental setup (f) Schematic of blue light stimulation system. (g) Representative image of 240-well WorMotel (h) High resolution image of nine wells, each housing a single young adult N2 worm.
Figure 1—figure supplement 1

Comparison of image quality with standard 384-well plate and WorMotel.
(a) Image of L4 worms on agar in a standard 384-well plate. Scale bar: 2 mm. (b) Image of L4 worms on agar in a WorMotel. Individual animals are clearly visible in (b) but not in (a).
Figure 1—figure supplement 2
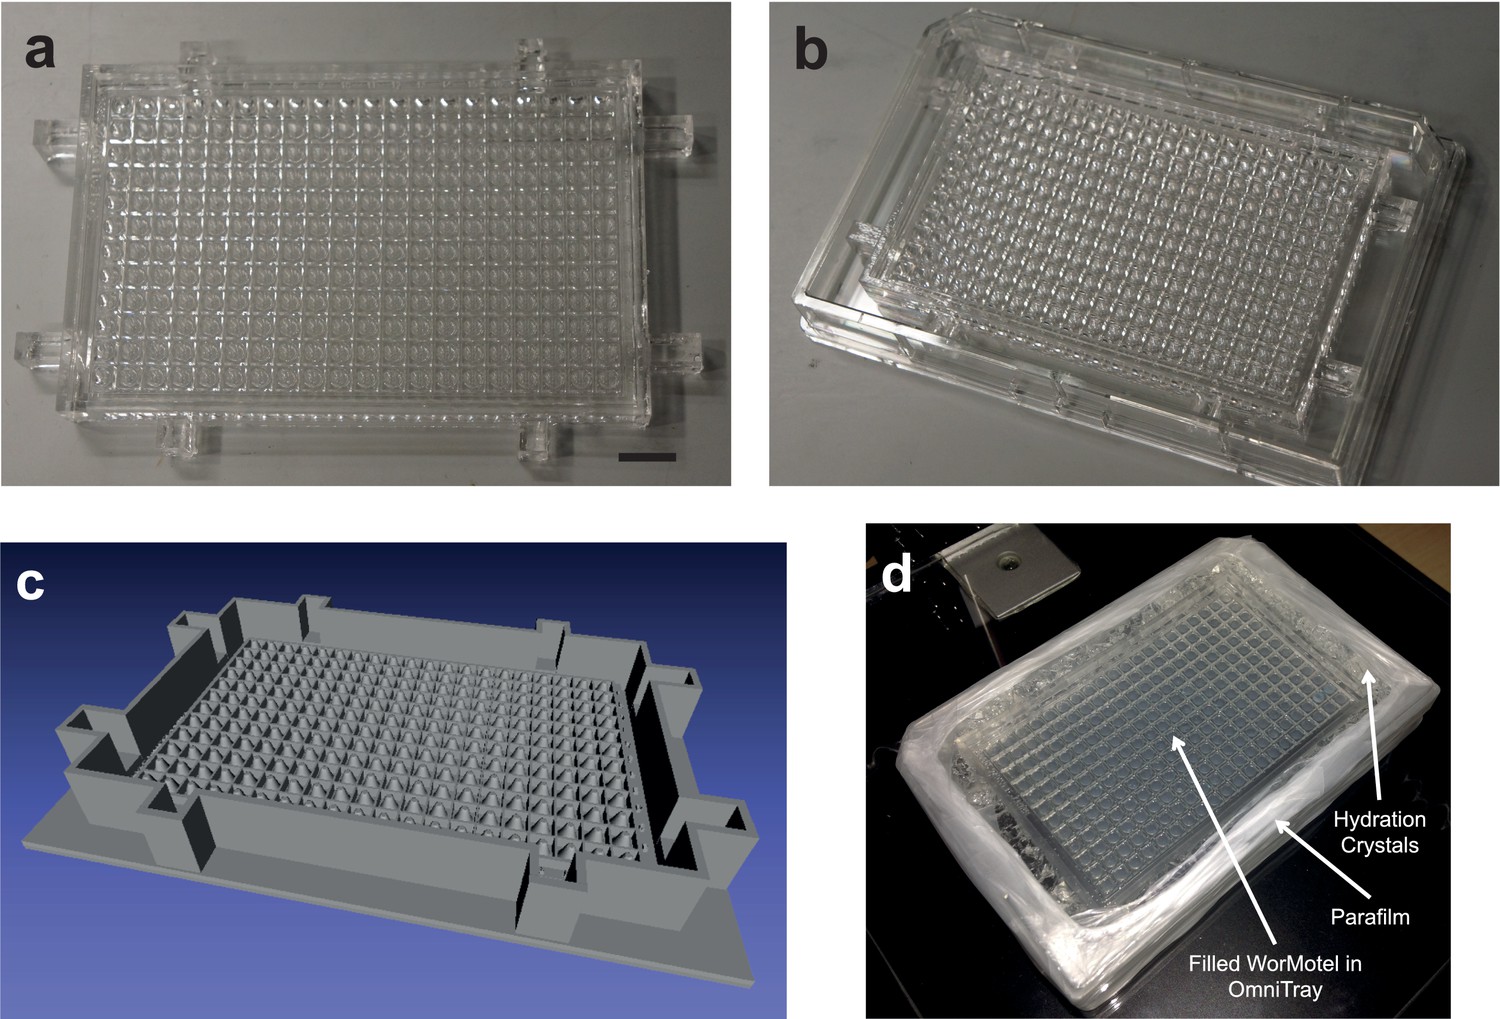
240-Well WorMotel (a) 240-well WorMotel PDMS insert.
Scale Bar: 1 cm. (b) PDMS insert placed inside an OmniTray. (c) Computer rendering of the 240-well WorMotel negative master (d) Image of a WorMotel filled with agar, bacteria, and worms in an OmniTray.
Figure 1—figure supplement 3
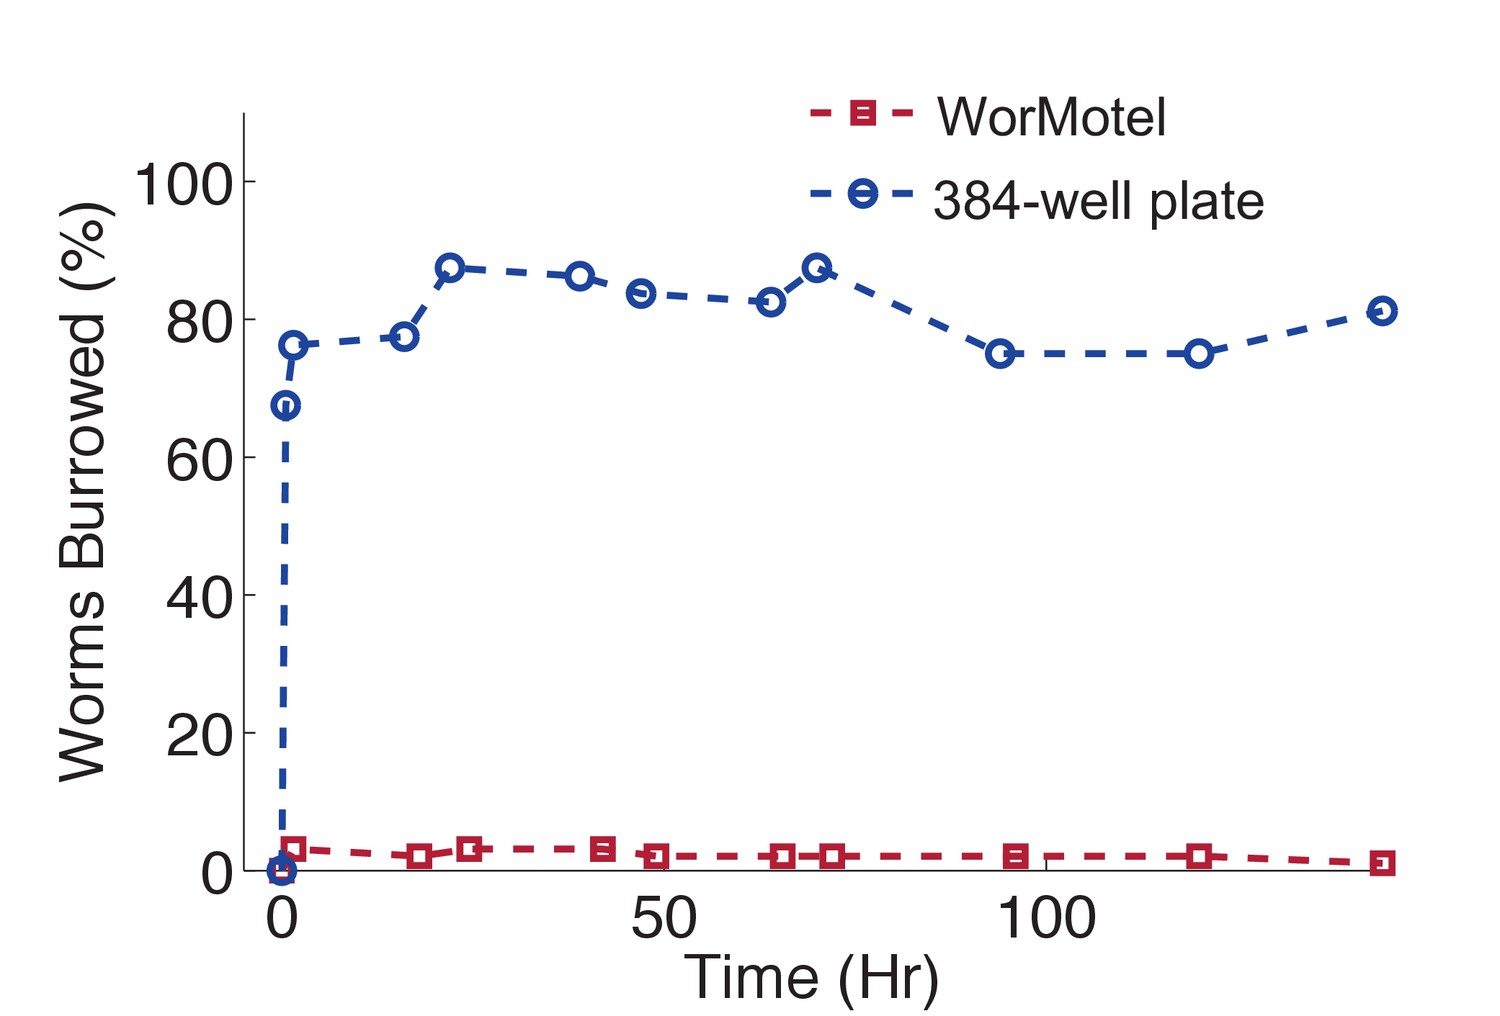
WorMotel prevents burrowing.
Percent of animals burrowing in the WorMotel (red squares, n = 96) and in a standard 384-well microplate (blue circles, n = 80).
Figure 1—figure supplement 4
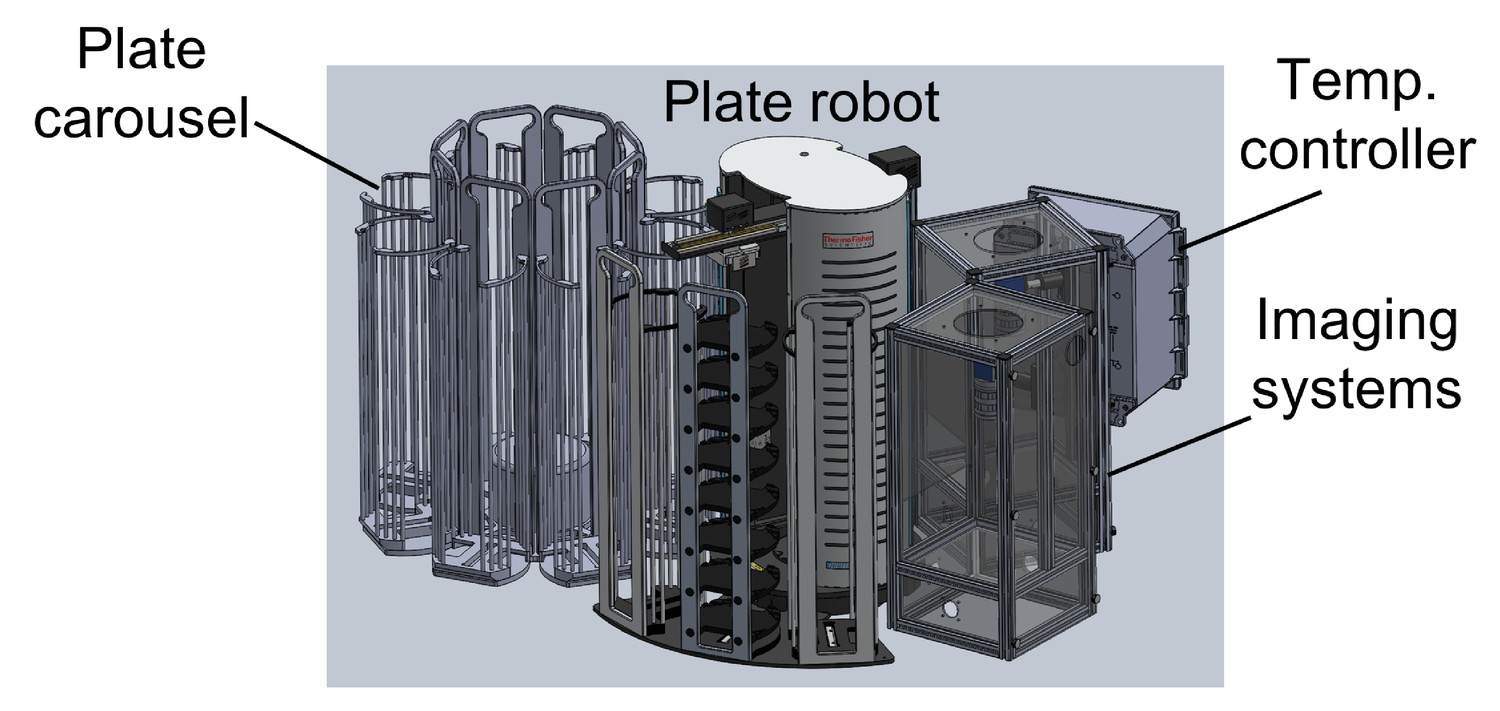
Schematic of automated imaging system.
An automated plate carousel (Thermo) containing eight plate stacks holds up to 240 WorMotel plates, each containing 240 C. elegans. A plate handling robot (Thermo Orbitor, ThermoFisher Scientific, Philadelphia, PA) moves plates onto one of 3 imaging/illumination systems, where they are serially imaged. The system is contained in a light-tight enclosure and temperature is controlled to within 0.2 C by a temperature controller. All functions are controlled by custom LabView software.
Figure 2
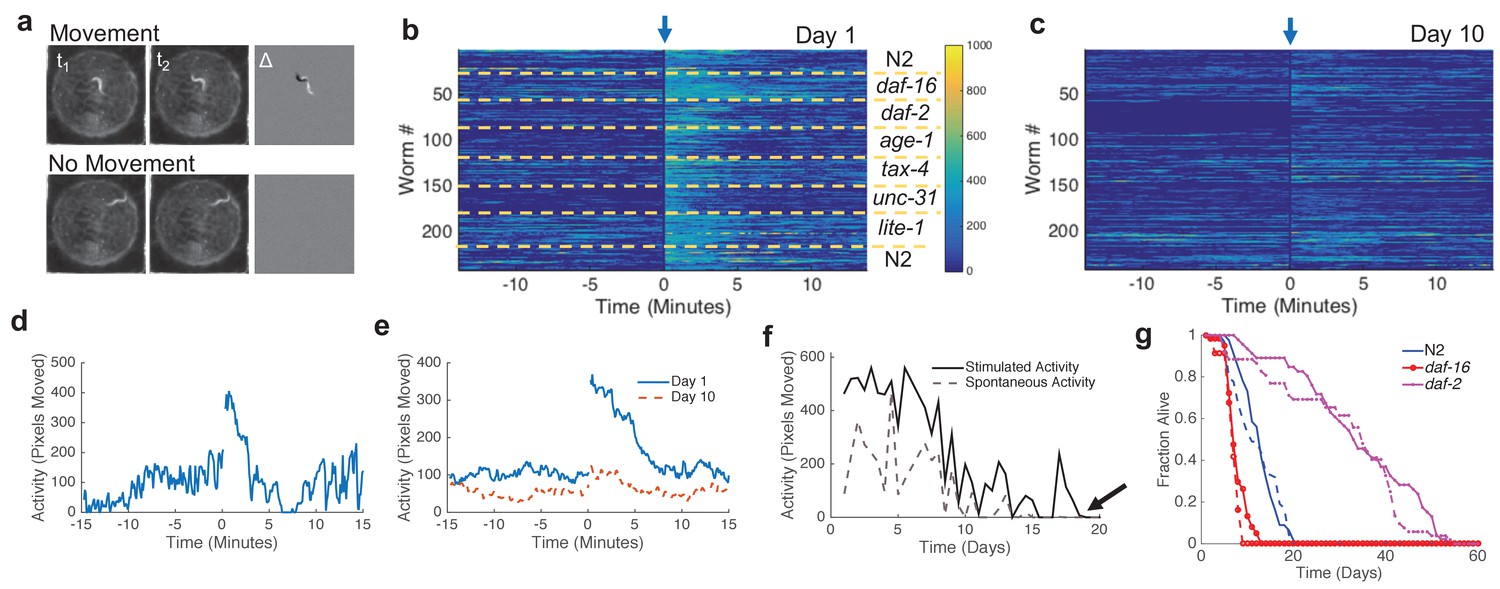
Image processing, automated lifespan calculation, and manual validation.
(a) Activity calculation. Delta image (right image) is calculated by pixel-by-pixel subtraction of images taken at time t1 from images taken at time t2. Examples are shown in which a worm moves (top) and does not move (bottom). (b) Activity, shown as a heat map, of young adult (day one) animals during a 30-min imaging epoch. Arrow indicates 10-s blue light stimulation. Color bar indicates the number of pixels changed over a 60-s interval. (c) Activity of adult C. elegans on day 10. Colorbar uses same scale as panel (b). (d) Activity trace from one wild-type animal. Blue light was applied at time zero. (e) Average wild-type population behavior on day 1 (solid curve) and day 10 (dashed curve) (n = 30). (f) Single animal trace of maximum spontaneous (dashed) or stimulated (solid) activity across entire lifespan. Arrow indicates time of death. (g) Lifespan of animals grown on the WorMotel (solid curves) or standard plates (dashed curves).
Figure 3 with 1 supplement
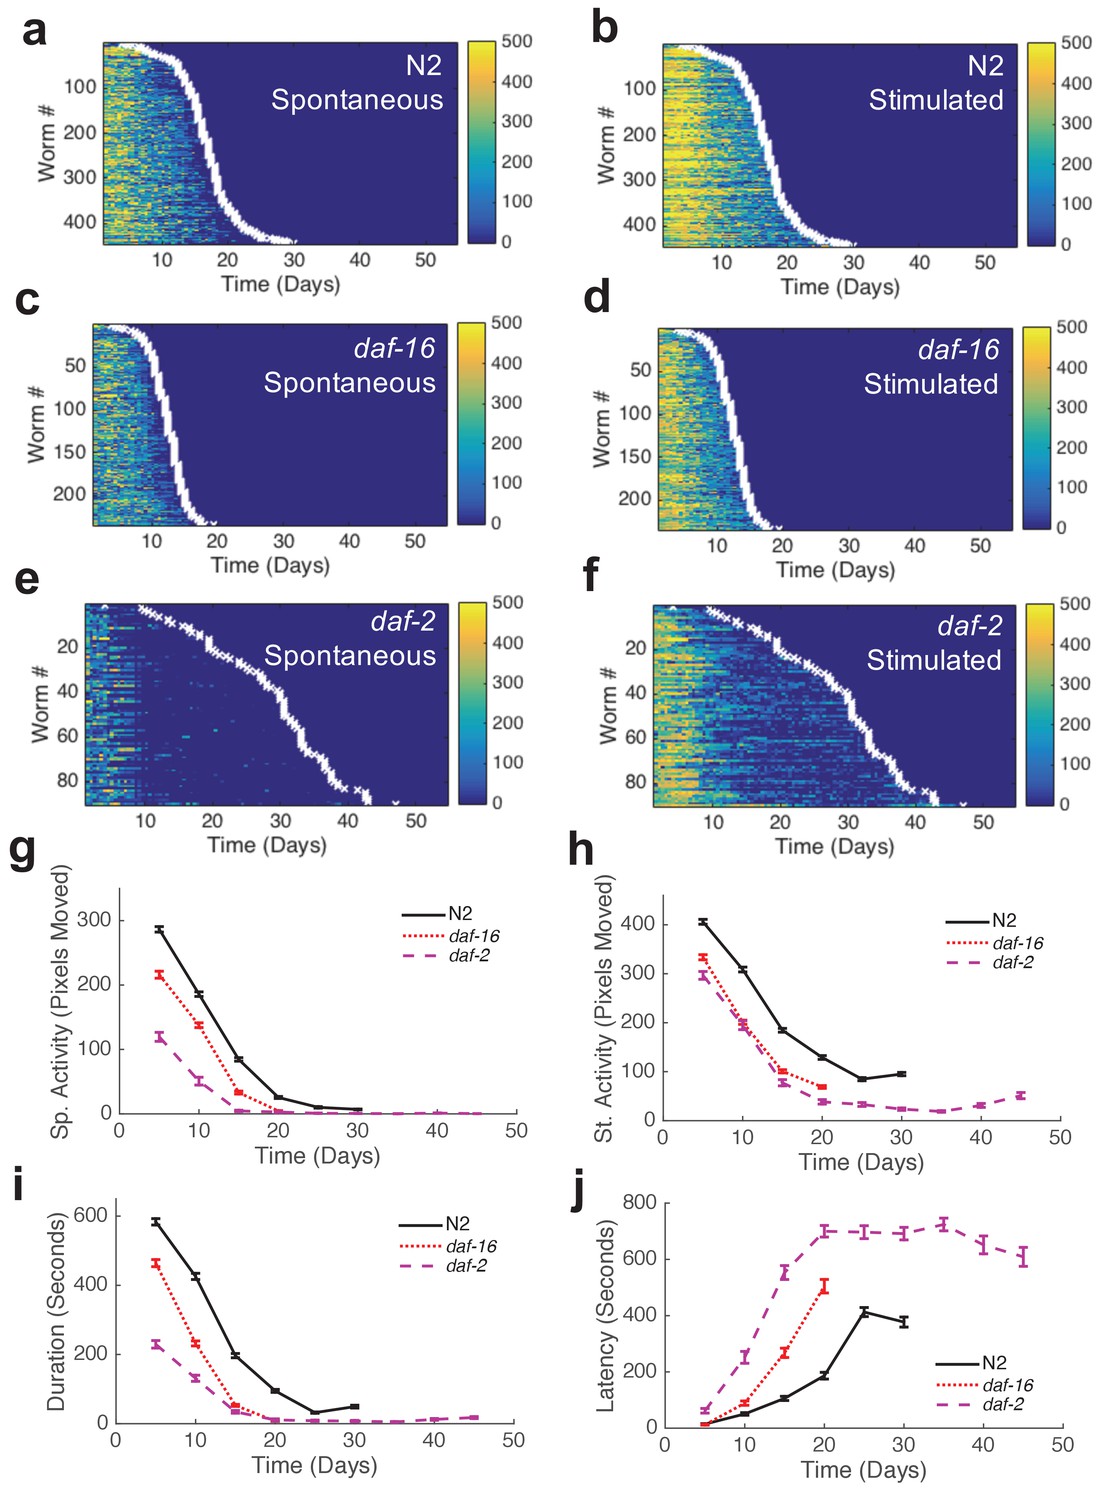
Automated quantification of behavioral changes during aging.
(a) Spontaneous behavior heat map for N2 (n = 445). Color bar indicates the number of pixels changed over a 60-s interval. (b) Stimulated behavior heat map for N2. (c) Spontaneous behavior heat map for daf-16 (n = 234). (d) Stimulated behavior heat map for daf-16. (e) Spontaneous behavior heat map for daf-2 (n = 90). (f) Stimulated behavior heat map for daf-2. (g) Survivor population spontaneous activity. (h) Survivor population stimulated activity. (i) Survivor population response duration. (j) Survivor population response latency.
-
Figure 3—source data 1
Includes data for lifespan, spontaneous locomotion, stimulated locomotion, response duration, and response latency for each strain shown.
- https://doi.org/10.7554/eLife.26652.014
Figure 3—figure supplement 1
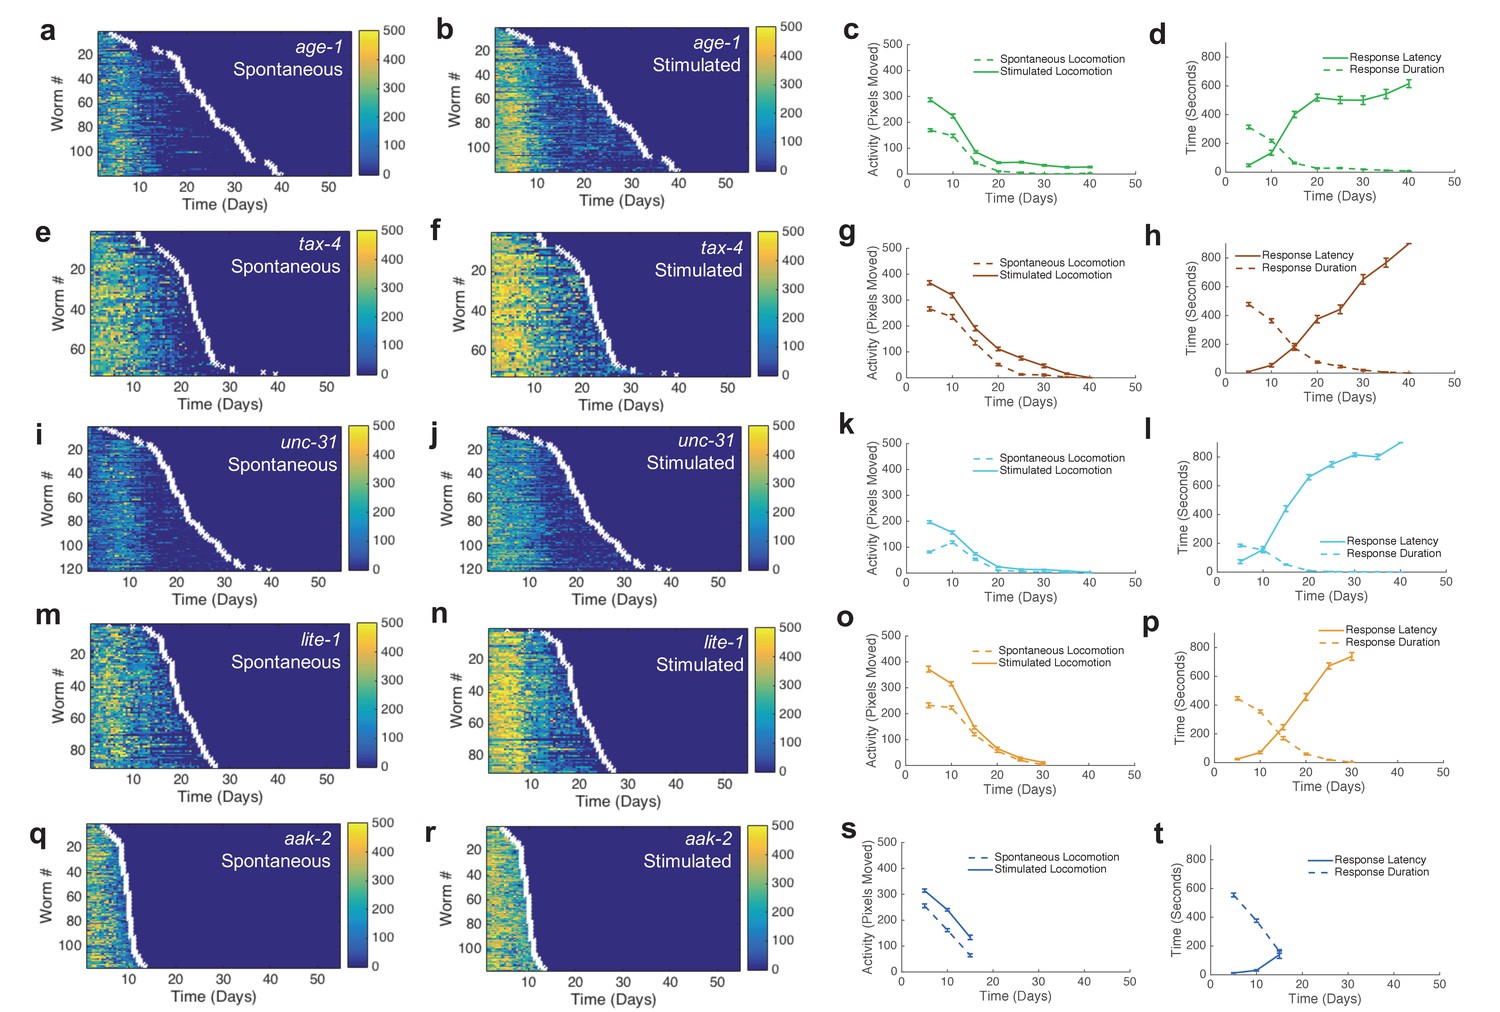
Additional behavior heat maps.
(a) Spontaneous behavior heat map for age-1 mutants. (b) Stimulated behavior heat map for age-1 mutants. (c) Survivor spontaneous (dashed curve) and stimulated (solid curve) activity for age-1 mutants. (d) Survivor response duration (dashed curve) and latency (solid curve) for age-1 mutants. (e–h) Same data as panels (a–d) shown for tax-4 mutants. (i–l) Same data as panels (a–d) shown for unc-31 mutants. (m–p) Same data as panels (a–d) shown for lite-1 mutants. (q–t) Same data as panels (a–d) shown for aak-2 mutants.
Figure 4
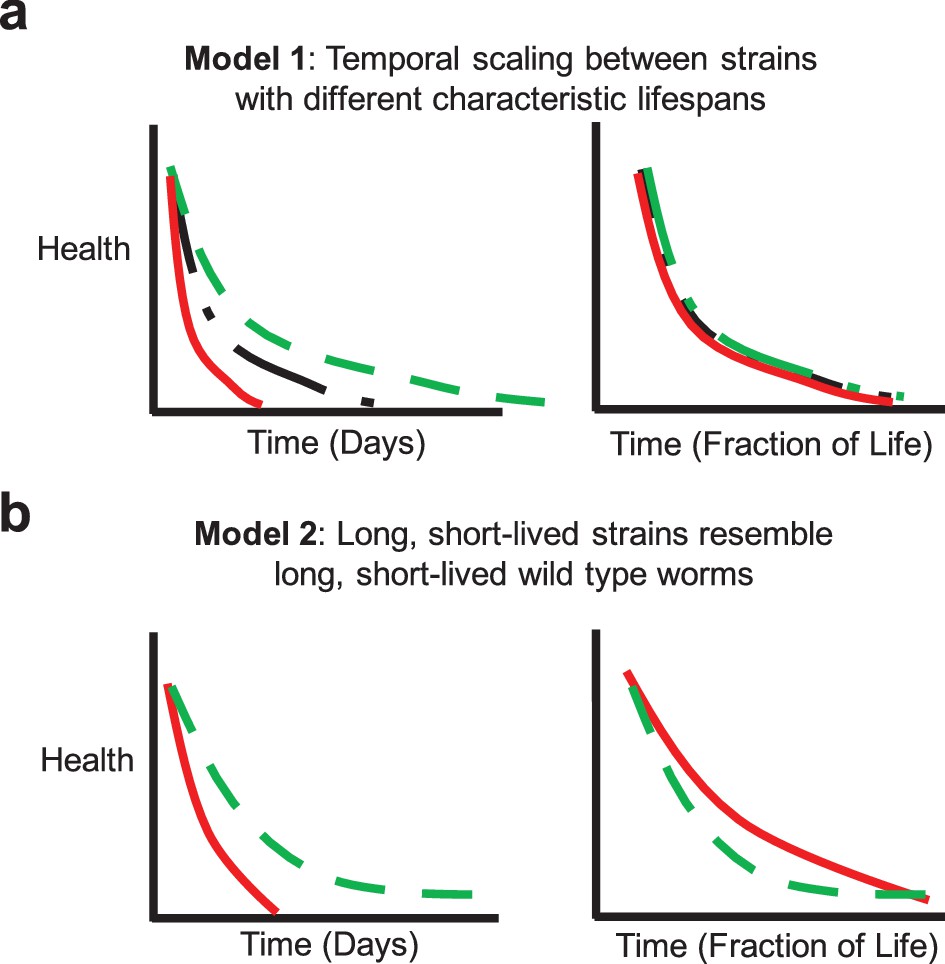
Potential aging models.
(a) Model 1: Temporal scaling results in identical patterns of behavioral decline when data are normalized by lifespan. Idealized decline curves for wild type (black dot-dashed), short-lived (red solid), and long-lived (green dashed) strains. Decline curves are shown as a function of chronological time (left) and fraction of life (right). (b) Model 2: Long-lived and short-lived strains resemble long-lived and short-lived wild type worms with respect to behavioral decline. Idealized decline curves for a short-lived (red solid) and a long-lived (green dashed) strain. Decline curves are shown as a function of chronological time (left) and fraction of life (right).
Figure 5 with 1 supplement
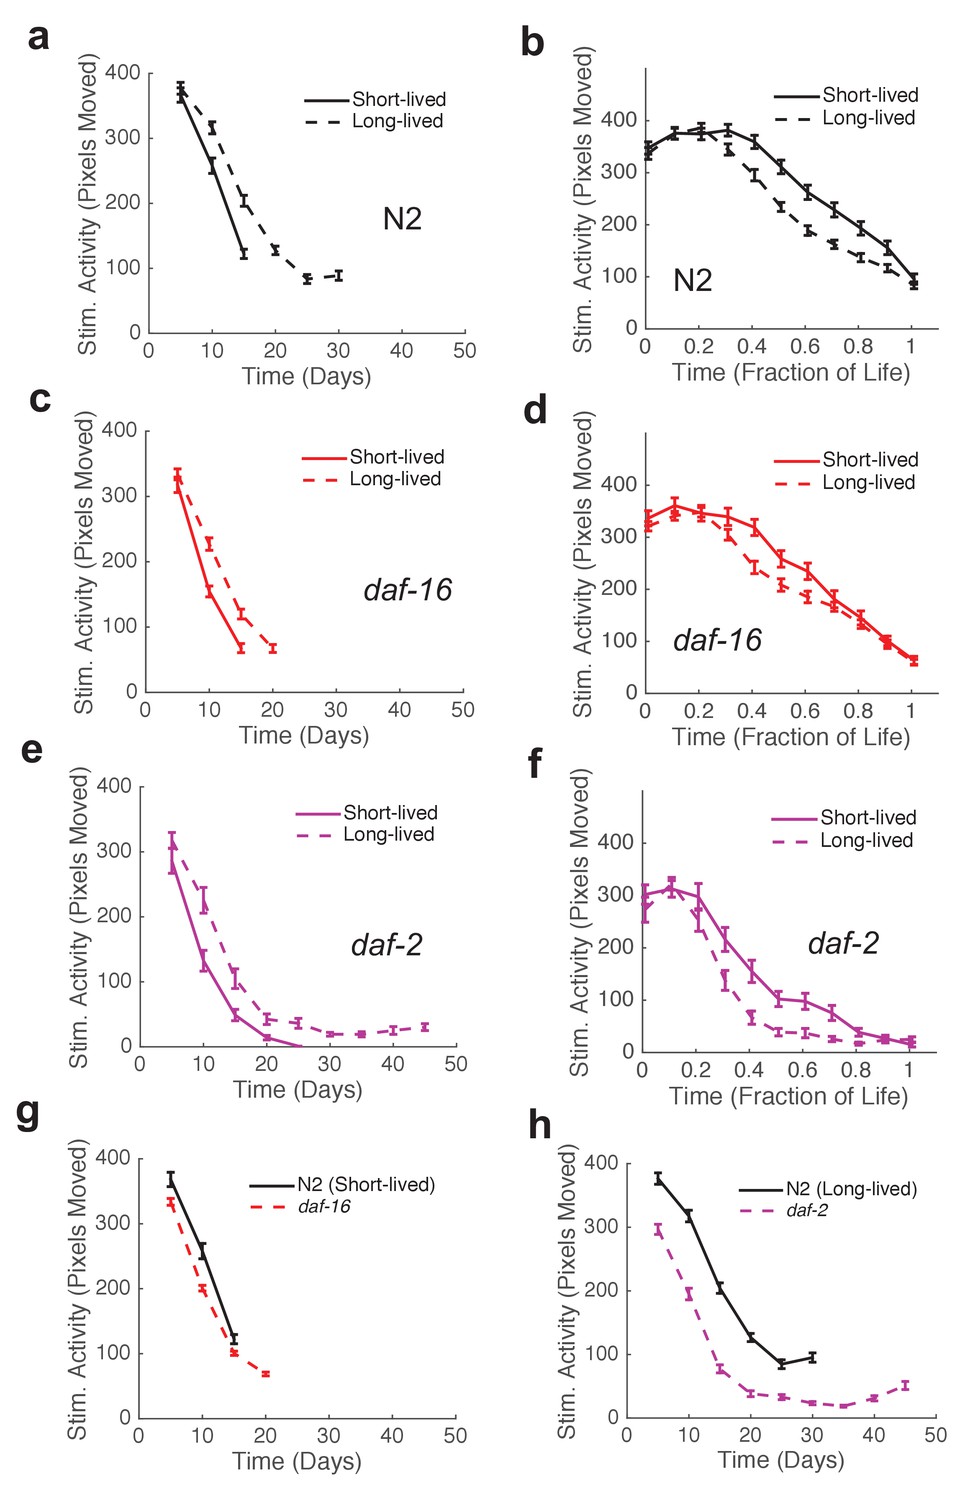
Mutants with short and long lifespan display patterns of late-life behavioral decline that resemble short and long-lived worms from a wild type population.
(a) N2 behavior over time for the lowest quartile (solid curve) and highest quartile (dashed curve) of survivors. (b) Data from panel (a) plotted as a fraction of each individual’s life. (c) daf-16 behavior over time. (d) daf-16 behavior over fraction of life. (e) daf-2 behavior over time. (f) daf-2 behavior over fraction of life. (g) Comparison of N2 lowest survivor quartile and daf-16. (h) Comparison of N2 highest survivor quartile with daf-2.
Figure 5—figure supplement 1
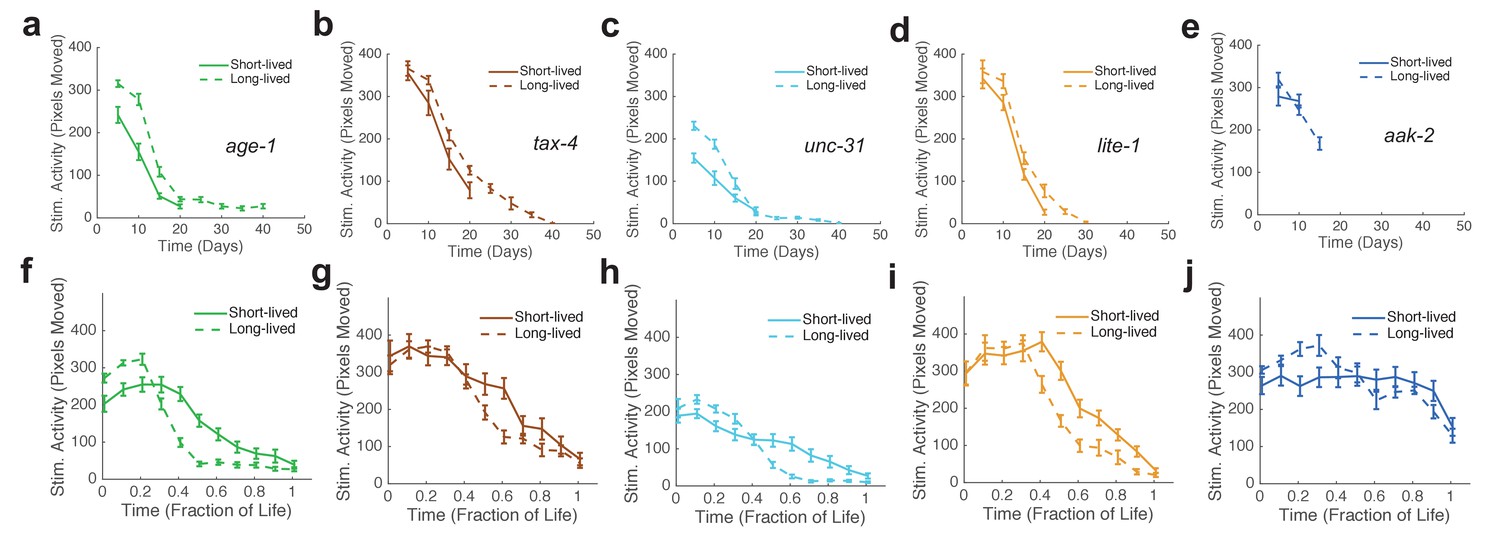
Stimulated activity versus chronological time and fraction of life for long-lived individuals and short-Lived individuals of the same strain.
(a) age-1 mutant behavior as a function of chronological time for the lowest (solid curve) and highest (dashed curve) survivor quartiles. (b) tax-4 mutant behavior as a function of chronological time for the lowest (solid curve) and highest (dashed curve) survivor quartiles. (c) unc-31 mutant behavior as a function of chronological time for the lowest (solid curve) and highest (dashed curve) survivor quartiles. (d) lite-1 mutant behavior as a function of chronological time for the lowest (solid curve) and highest (dashed curve) survivor quartiles. (e) aak-2 mutant behavior as a function of chronological time for the lowest (solid curve) and highest (dashed curve) survivor quartiles. (f–j) Same data as present in panels (a–e) presented as a function of life fraction.
Figure 6 with 1 supplement
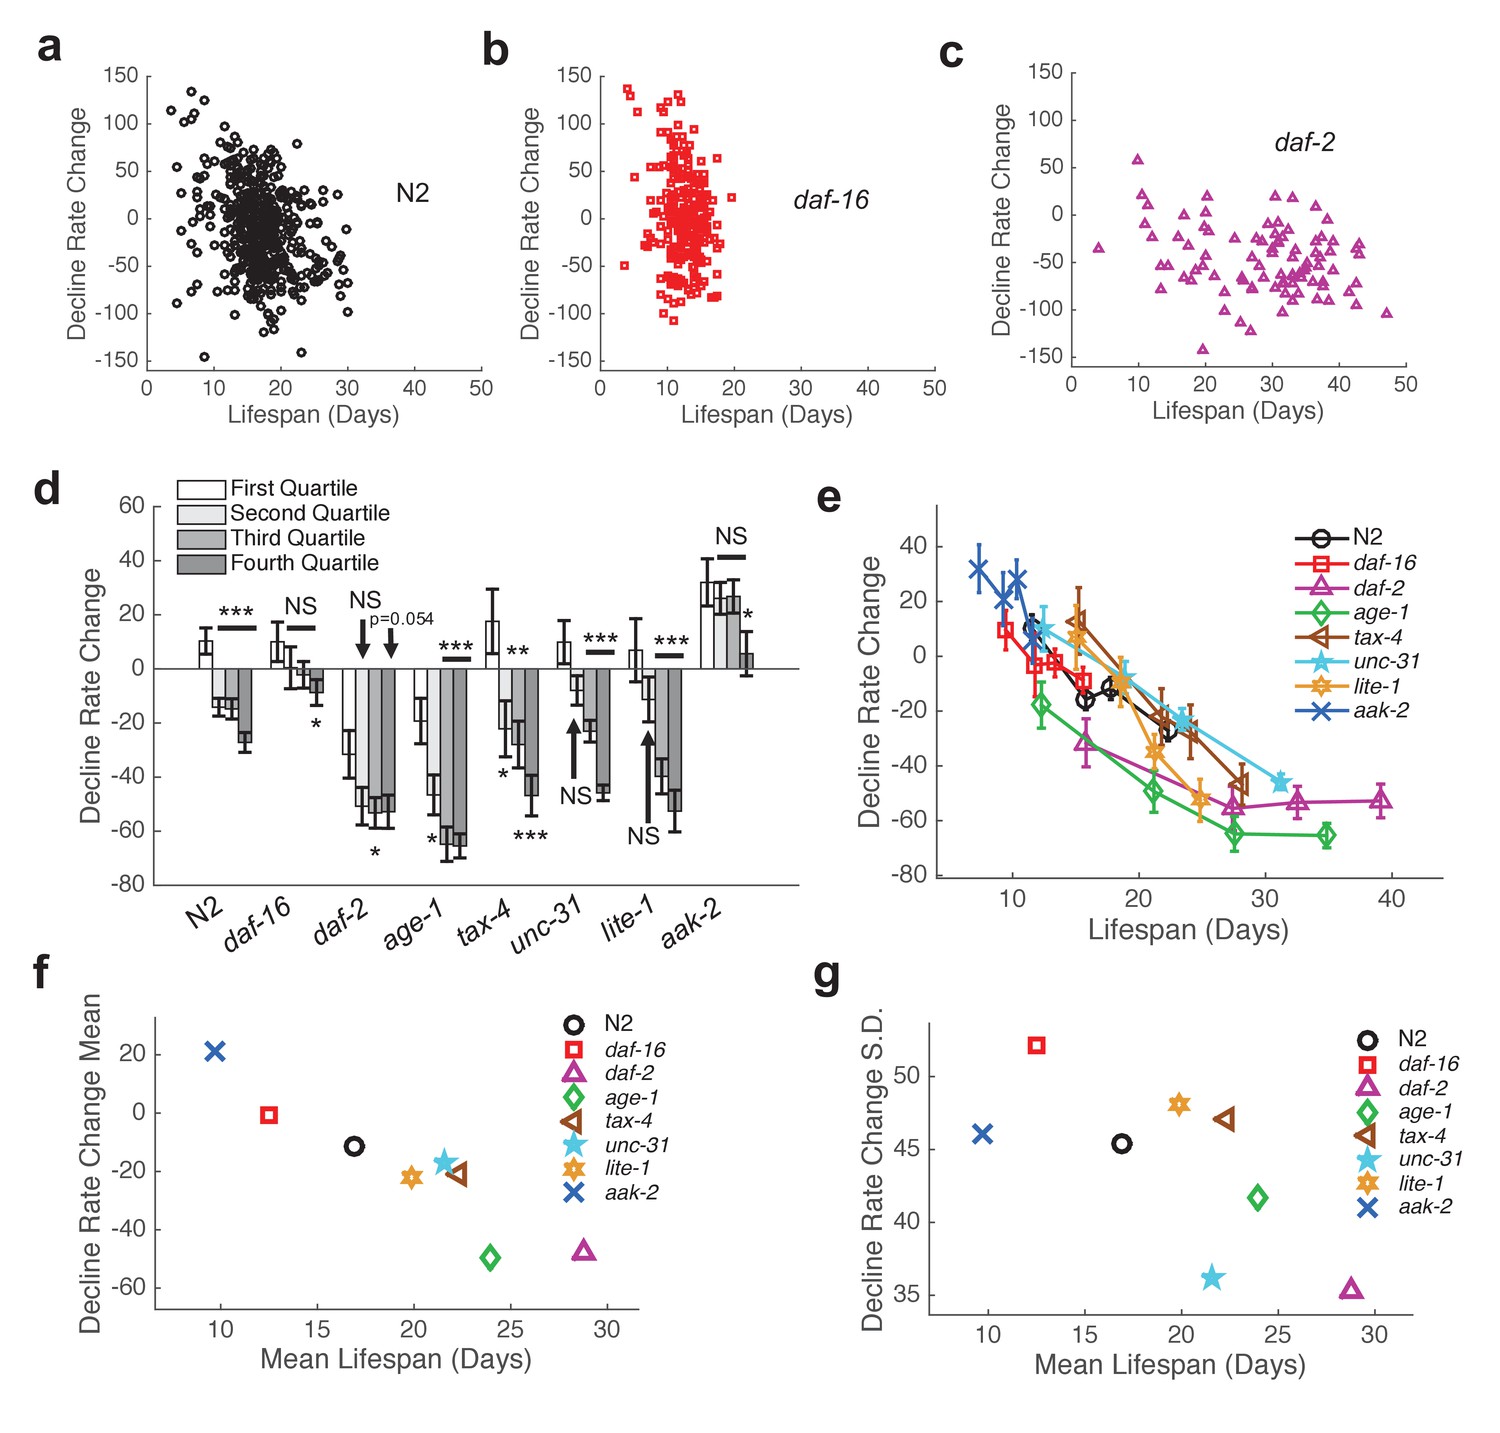
Shape of behavioral decline changes continuously with lifespan across individuals and strains.
(a) Change in decline rate (pixels/life fraction) versus lifespan for individual N2 animals. (b) Same data as in panel (a) presented for daf-16 mutants. (c) Same data as in panel (a) presented for daf-2 mutants. (d) Change in decline rate (pixels/life fraction) in lowest (white) to highest (dark gray) survivor quartiles. *, p<0.05; **, p<0.01; ***, p<0.001. (e) Change in decline rate (pixels/life fraction) versus lifespan for multiple strains. (f) Mean decline rate change (pixels/life fraction) plotted against mean lifespan for each strain tested. Correlation coefficient r = −0.94, p=0.0006. (g) Standard deviation of decline rate change (pixels/life fraction) plotted against mean lifespan for each strain tested. Correlation coefficient r = −0.70, p=0.055.
Figure 6—figure supplement 1
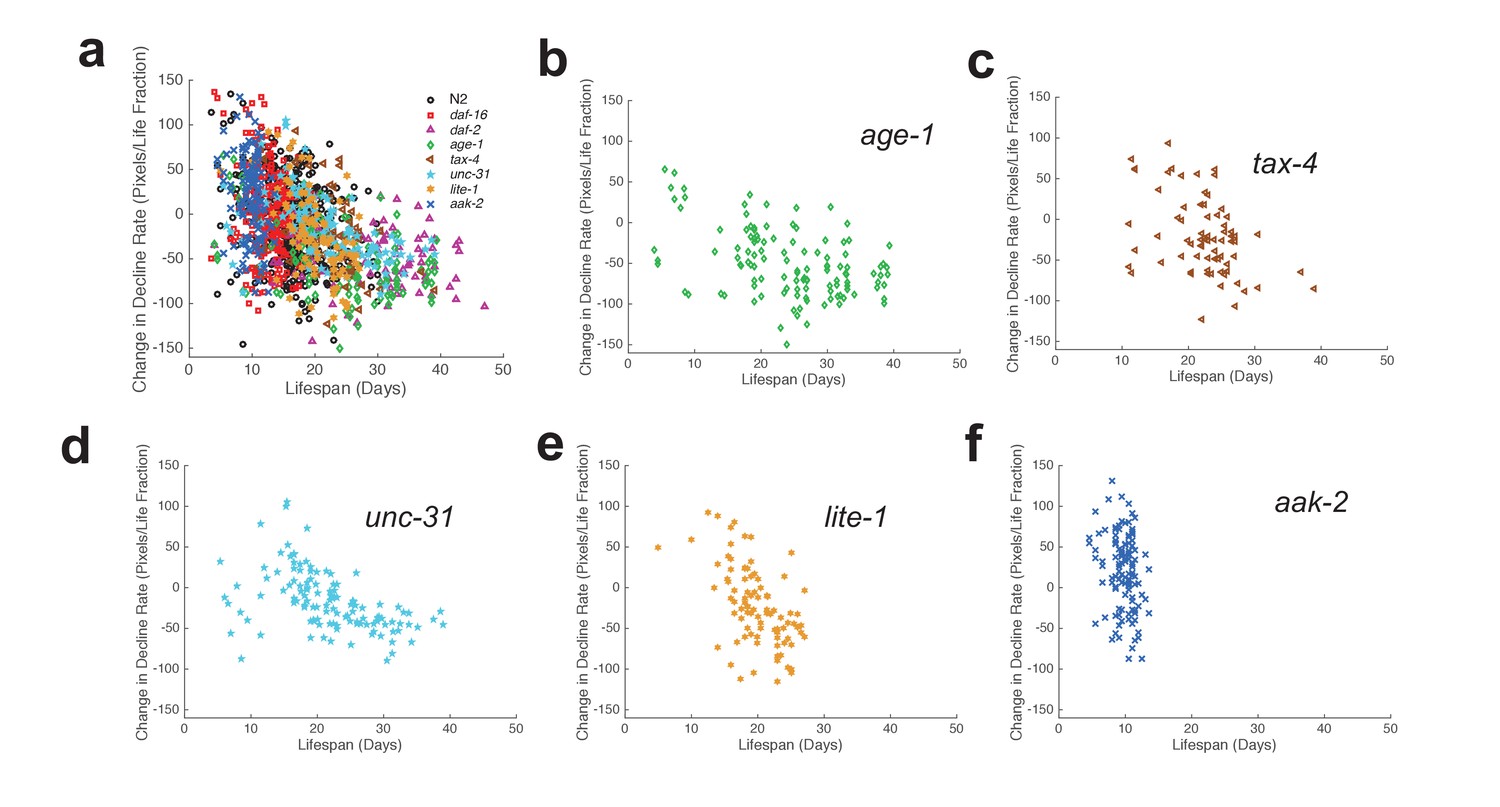
Change in decline rate versus lifespan in individual animals.
(a) Change in decline rate versus lifespan for individuals of all strains tested. (b) Change in decline rate versus lifespan for individual age-1 mutants. (c) Same data as in panel (b) presented for tax-4 mutants. (d) Same data as in panel (b) presented for unc-31 mutants. (e) Same data as in panel (b) presented for lite-1 mutants. (f) Same data as in panel (b) presented for aak-2 mutants.
Figure 7
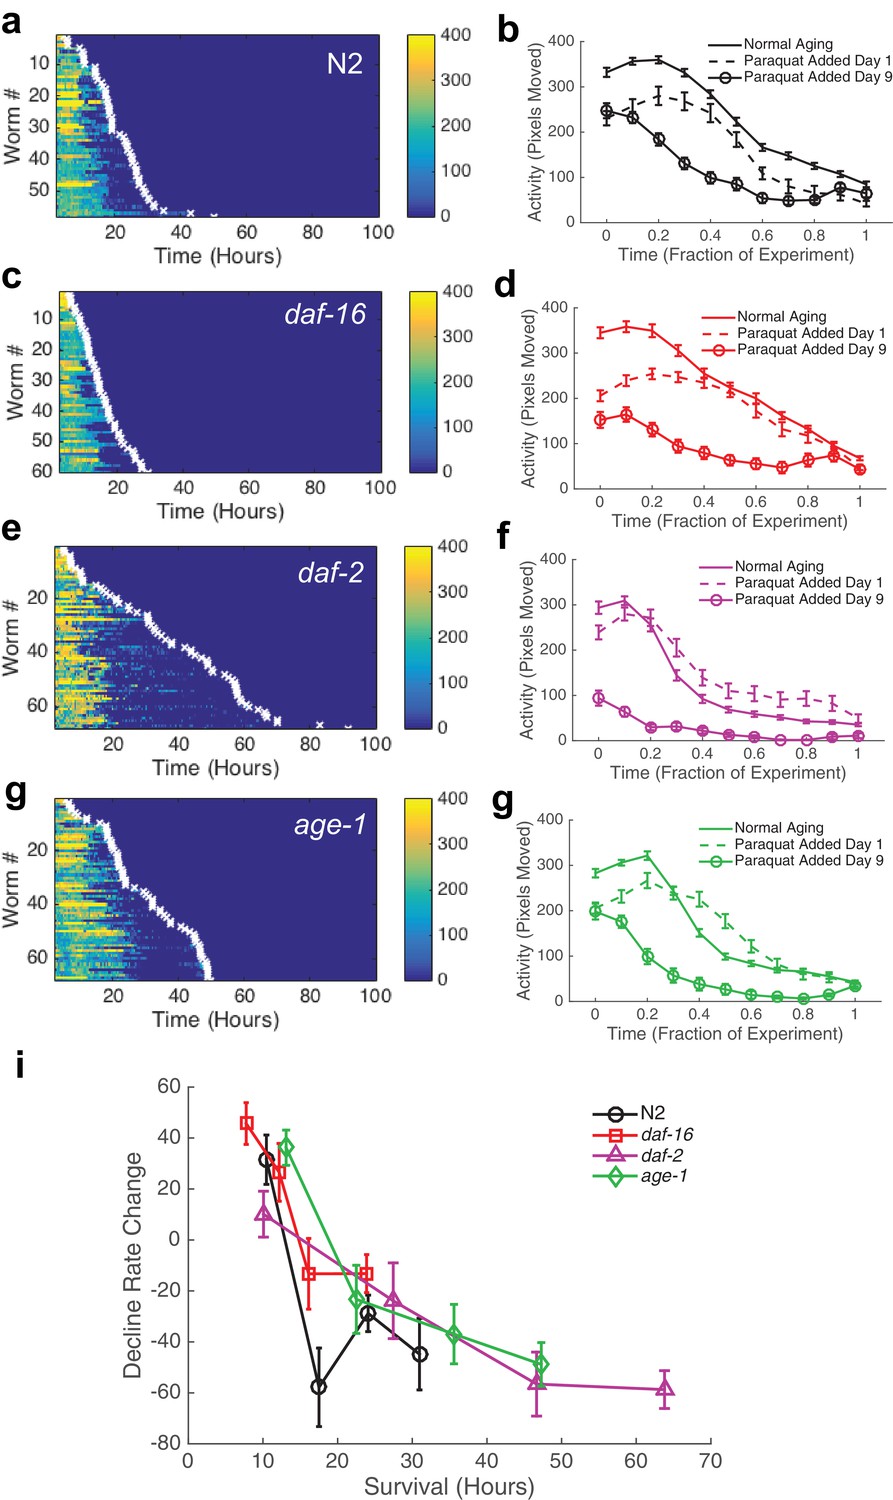
Behavioral decline during acute oxidative stress resembles behavioral decline during aging.
(a, c, e, g) Behavior and survival heat maps for N2 (n = 58), daf-16 (n = 60), daf-2 (n = 68), and age-1 (n = 68). (b, d, f, h) Comparison of behavioral decline during normal aging (solid curve), stress with paraquat added on day 1 of adulthood (dashed curve), and stress with paraquat added on day 9 of adulthood (solid curve with circles) (i) Change in decline rate (pixels/life fraction) for individuals versus survival on paraquat.
-
Figure 7—source data 1
Includes activity and paraquat survival data for each strain shown.
- https://doi.org/10.7554/eLife.26652.023
Figure 8
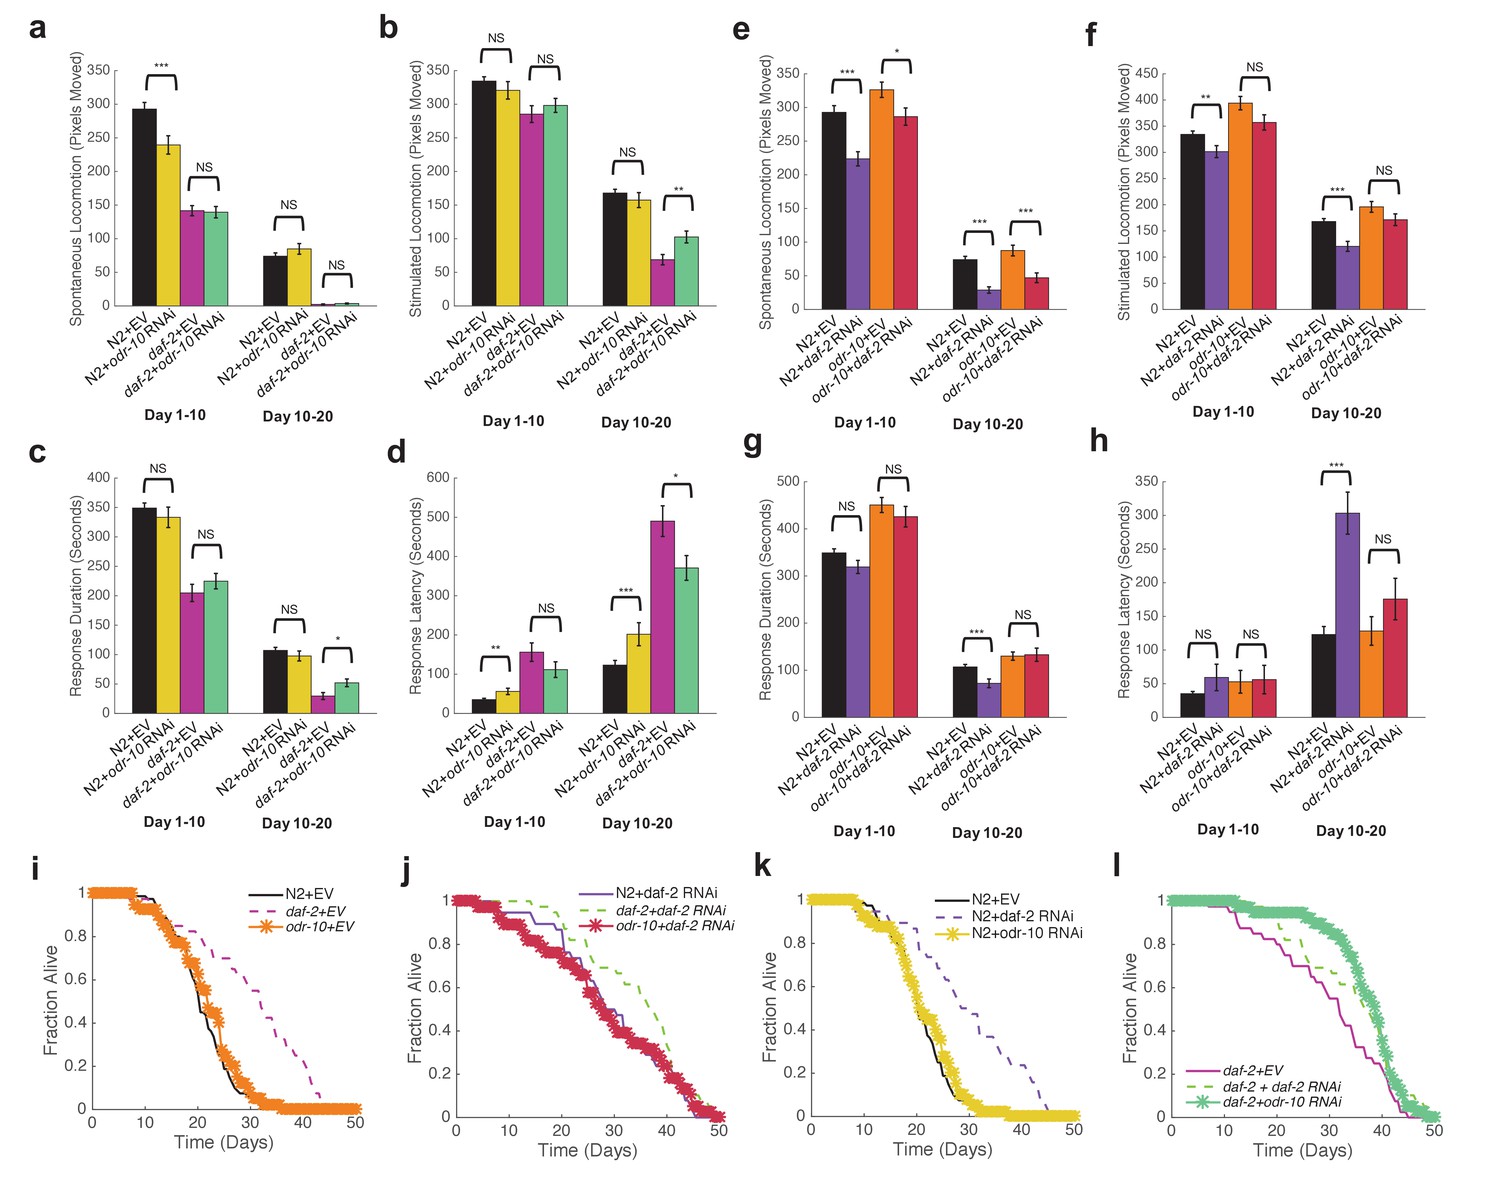
Reduced sensory response is not required for extended longevity in daf-2 mutants.
(a) Spontaneous activity during days 1–10 and 10–20 of adulthood for N2 grown on Empty Vector RNAi (n = 80), N2 grown on odr-10 RNAi (n = 40), daf-2 grown on Empty Vector RNAi (n = 40), and daf-2 grown on odr-10 RNAi (n = 39). *p<0.05; **p<0.01; ***p<0.001. (b) Stimulated activity for the same individuals shown in panel (a). (c) Response duration for the same individuals shown in panel (a). (d) Response latency for the same individuals shown in panel (a). (e) Spontaneous activity during days 1–10 and 10–20 of adulthood for N2 grown on Empty Vector RNAi (n = 80), N2 grown on daf-2 RNAi (n = 38), odr-10(ky32) mutants grown on Empty Vector RNAi (n = 40), and odr-10(ky32) mutants grown on daf-2 RNAi (n = 38). *p<0.05; **p<0.01; ***p<0.001. (f) Stimulated activity for the same individuals shown in panel (e). (g) Response duration for the same individuals shown in panel (e). (h) Response latency for the same individuals shown in panel (e). (i–l) Survival curves.
-
Figure 8—source data 1
Includes data for lifespan, spontaneous locomotion, stimulated locomotion, response duration, and response latency for each strain shown.
- https://doi.org/10.7554/eLife.26652.026
Videos
Video 1
Young (day 1) adults in the 240-well WorMotel.
A 10 s long blue light exposure (bright flash) occurs at the 15 min mark. FOV: 95 mm x 63 mm
Video 2
Detail of 9 wells containing day 1 N2 adults.
A 10 s long blue light exposure (bright flash) occurs at the 15 min mark. FOV: 14 mm x 14 mm
Video 3
Detail of 9 wells containing day 10 N2 adults.
A 10 s long blue light exposure (bright flash) occurs at the 15 min mark. FOV: 14 mm x 14 mm
Video 4
High resolution video of 9 WorMotel wells containing adult animals (day 1–4).
FOV: 14 mm x 14 mm
Tables
Table 1
Summary of lifespan data
| Strain | Food source | Lifespan (Mean ± SD) (Days) | N | P-value relative to N2 control |
|---|---|---|---|---|
| N2 | DA837 | 16.8 ± 4.4 | 445 | N/A |
| daf-16 | DA837 | 12.4 ± 2.6 | 234 | 3.0 x 10-45 |
| daf-2 | DA837 | 28.5 ± 9.2 | 90 | 2.1 x 10⁻¹⁶ |
| age-1 | DA837 | 23.7 ± 8.9 | 119 | 4.3 x 10⁻⁹ |
| tax-4 | DA837 | 22.0 ± 5.4 | 72 | 3.6 x 10⁻⁶ |
| unc-31 | DA837 | 21.2 ± 7.2 | 120 | 3.6 x 10⁻⁴ |
| lite-1 | DA837 | 19.7 ± 4.0 | 90 | 0.036 |
| aak-2 | DA837 | 9.6 ± 1.8 | 117 | 3.9 x 10⁻³⁰ |
| N2 | HT115 (EV RNAi) | 20.9 ± 10.5 | 80 | N/A |
| N2 | HT115 (daf-2 RNAi) | 29.9 ± 10.3 | 38 | 1.2x 10⁻⁶ |
| N2 | HT115 (odr-10 RNAi) | 21.5 ± 6.5 | 40 | 0.53 |
| daf-2 | HT115 (EV RNAi) | 30.0 ± 10.5 | 40 | 1.6 x 10⁻⁶ |
| daf-2 | HT115 (daf-2 RNAi) | 34.5 ± 9.5 | 39 | 7.9 x 10⁻¹¹ |
| daf-2 | HT115 (odr-10 RNAi) | 36.9 ± 7.4 | 39 | 8.2 x 10⁻¹⁵ |
| odr-10 | HT115 (EV RNAi) | 21.5 ± 6.6 | 40 | 0.40 |
| odr-10 | HT115 (daf-2 RNAi) | 28.3 ± 12.5 | 38 | 4.8 x 10⁻⁴ |
| odr-10 | HT115 (odr-10 RNAi) | 21.1 ± 7.5 | 40 | 0.49 |
Table 2
Summary of paraquat assay survival data.
| Strain | Food source | Lifespan (Mean ± SD) (Days) | N | P-value relative to N2 control |
|---|---|---|---|---|
| N2 | DA837 + 40 mM paraquat | 21.2 ± 8.9 | 58 | N/A |
| daf-16 | DA837 + 40 mM paraquat | 16.5 ± 12.0 | 60 | 0.001 |
| daf-2 | DA837 + 40 mM paraquat | 37.4 ± 22.0 | 68 | 2.0 x 10⁻⁵ |
| age-1 | DA837 + 40 mM paraquat | 29.7 ± 13.8 | 68 | 2.7 x 10⁻⁵ |
Additional files
-
Supplementary file 1
Detailed protocol for WorMotel preparation.
- https://doi.org/10.7554/eLife.26652.027
-
Supplementary file 2
Stereolithography (STL) file of the 240-well WorMotel mold.
- https://doi.org/10.7554/eLife.26652.028
-
Supplementary file 3
Stereolithography (STL) file of the 48-well WorMotel mold.
- https://doi.org/10.7554/eLife.26652.029
-
Supplementary file 4
Parts lists, instructions, and MATLAB software for imaging system and blue light stimulation apparatus.
- https://doi.org/10.7554/eLife.26652.030
-
Supplementary file 5
MATLAB software suite for image processing and data analysis, with instructions.
- https://doi.org/10.7554/eLife.26652.031
-
Supplementary file 6
Additional MATLAB scripts for data representation.
- https://doi.org/10.7554/eLife.26652.032
Download links
A two-part list of links to download the article, or parts of the article, in various formats.
Downloads (link to download the article as PDF)
Open citations (links to open the citations from this article in various online reference manager services)
Cite this article (links to download the citations from this article in formats compatible with various reference manager tools)
Longitudinal imaging of Caenorhabditis elegans in a microfabricated device reveals variation in behavioral decline during aging
eLife 6:e26652.
https://doi.org/10.7554/eLife.26652


