Exploiting CRISPR-Cas to manipulate Enterococcus faecalis populations
- The University of Texas at Dallas, United States
Figures
Figure 1 with 2 supplements

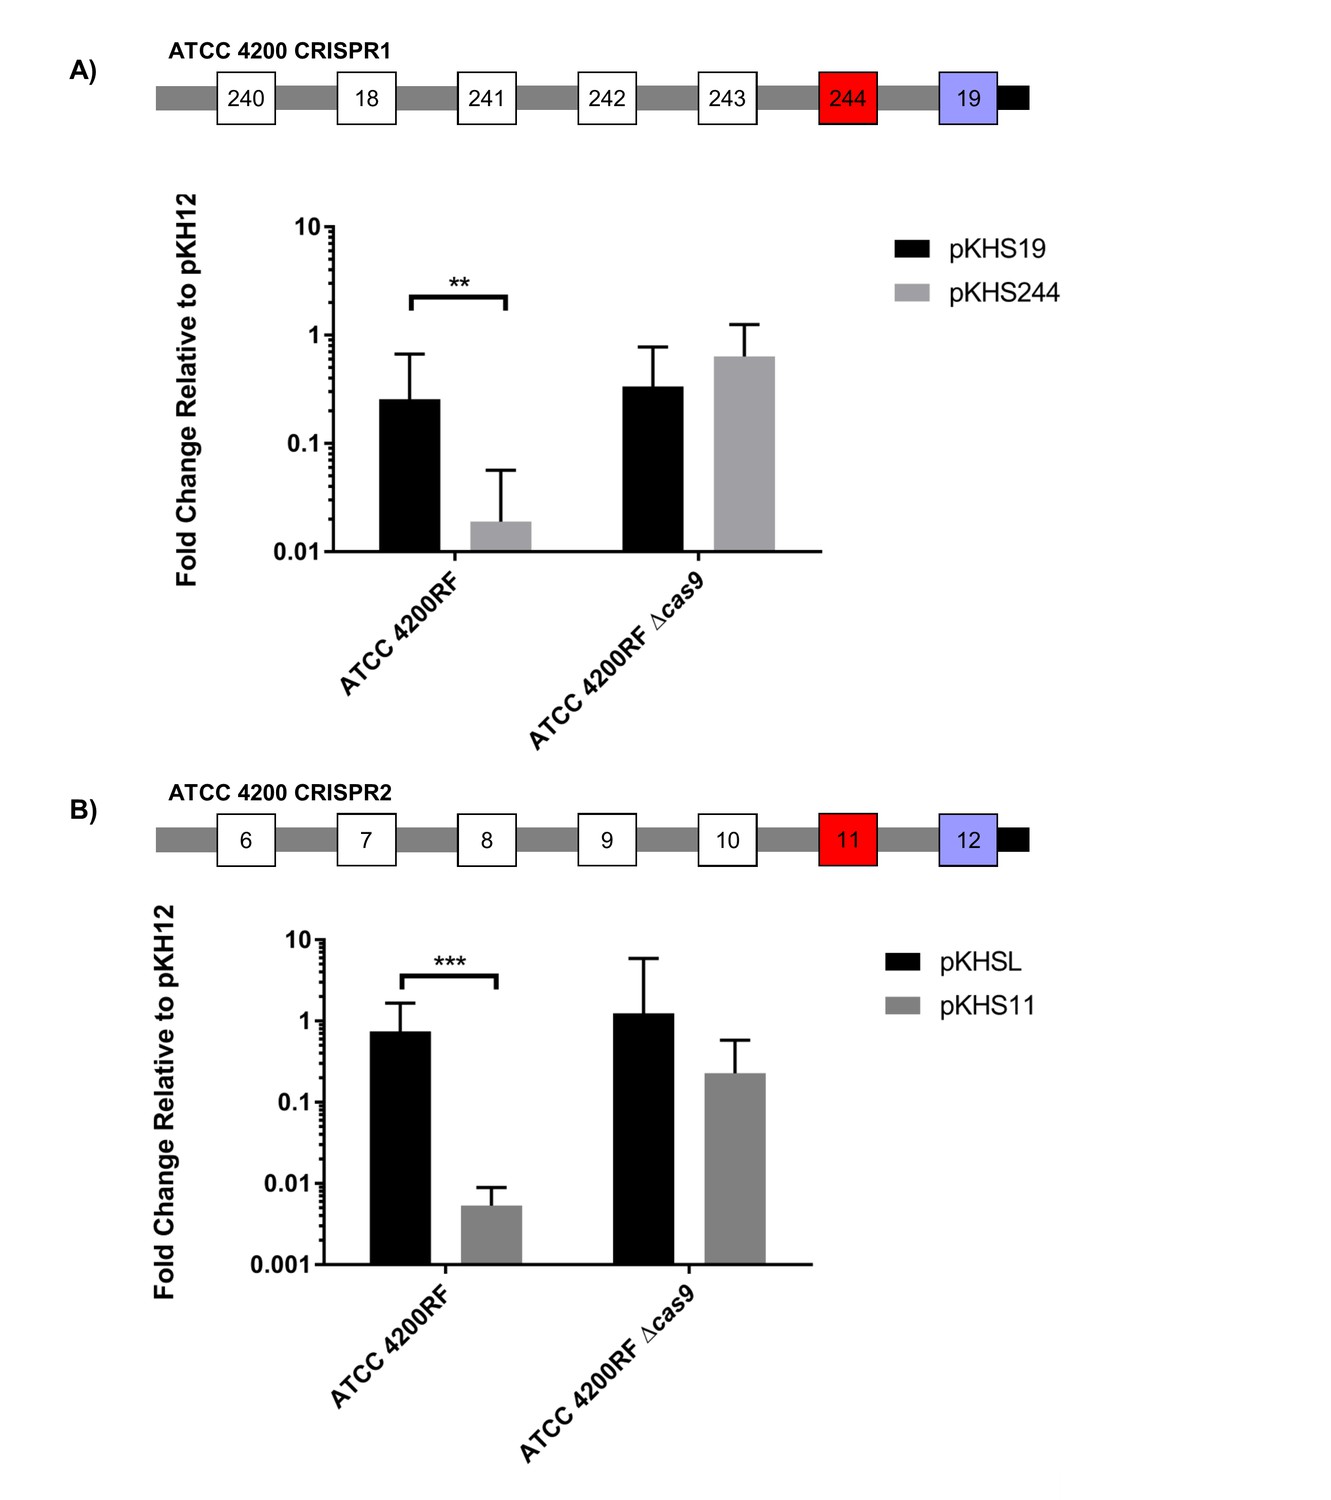
CRISPR defense in ATCC 4200RF.
(A) ATCC 4200RF CRISPR1 and CRISPR2 arrays are shown. Spacers assessed for functionality in CRISPR1 or CRISPR2 are shown in red. Fold changes of transconjugants per donor relative to pKH12 are shown for CRISPR1 using pKHS244 (B) and CRISPR2 using pKHS11 (C). pAS201 encodes CRISPR1-cas9 in a pMSP3535 backbone to complement the cas9 deletion strain. Reactions containing pMSP3535 and pAS201 were performed on BHI with erythromycin, and C173 was the donor for all reactions. The geometric mean and geometric standard deviation of 5 and 3 independent biological replicates for CRISPR1 and CRISPR2, respectively, are shown. ***p<0.001, **p<0.01.
Figure 1—figure supplement 1

CRISPR2 locus architecture and conjugation experiment setup.
Direct repeats are shown as grey rectangles and spacers are shown as squares. The terminal degenerate repeat is shown as a short black rectangle. The region between the TSS and the first repeat is known as the leader. A functional CRISPR system will reduce the conjugation frequency of pKHSX relative to pKH12. pKHSX contains the spacer X sequence and the NGG PAM motif, where X defines the specific spacer sequence from our previous typing system.
Figure 1—figure supplement 2
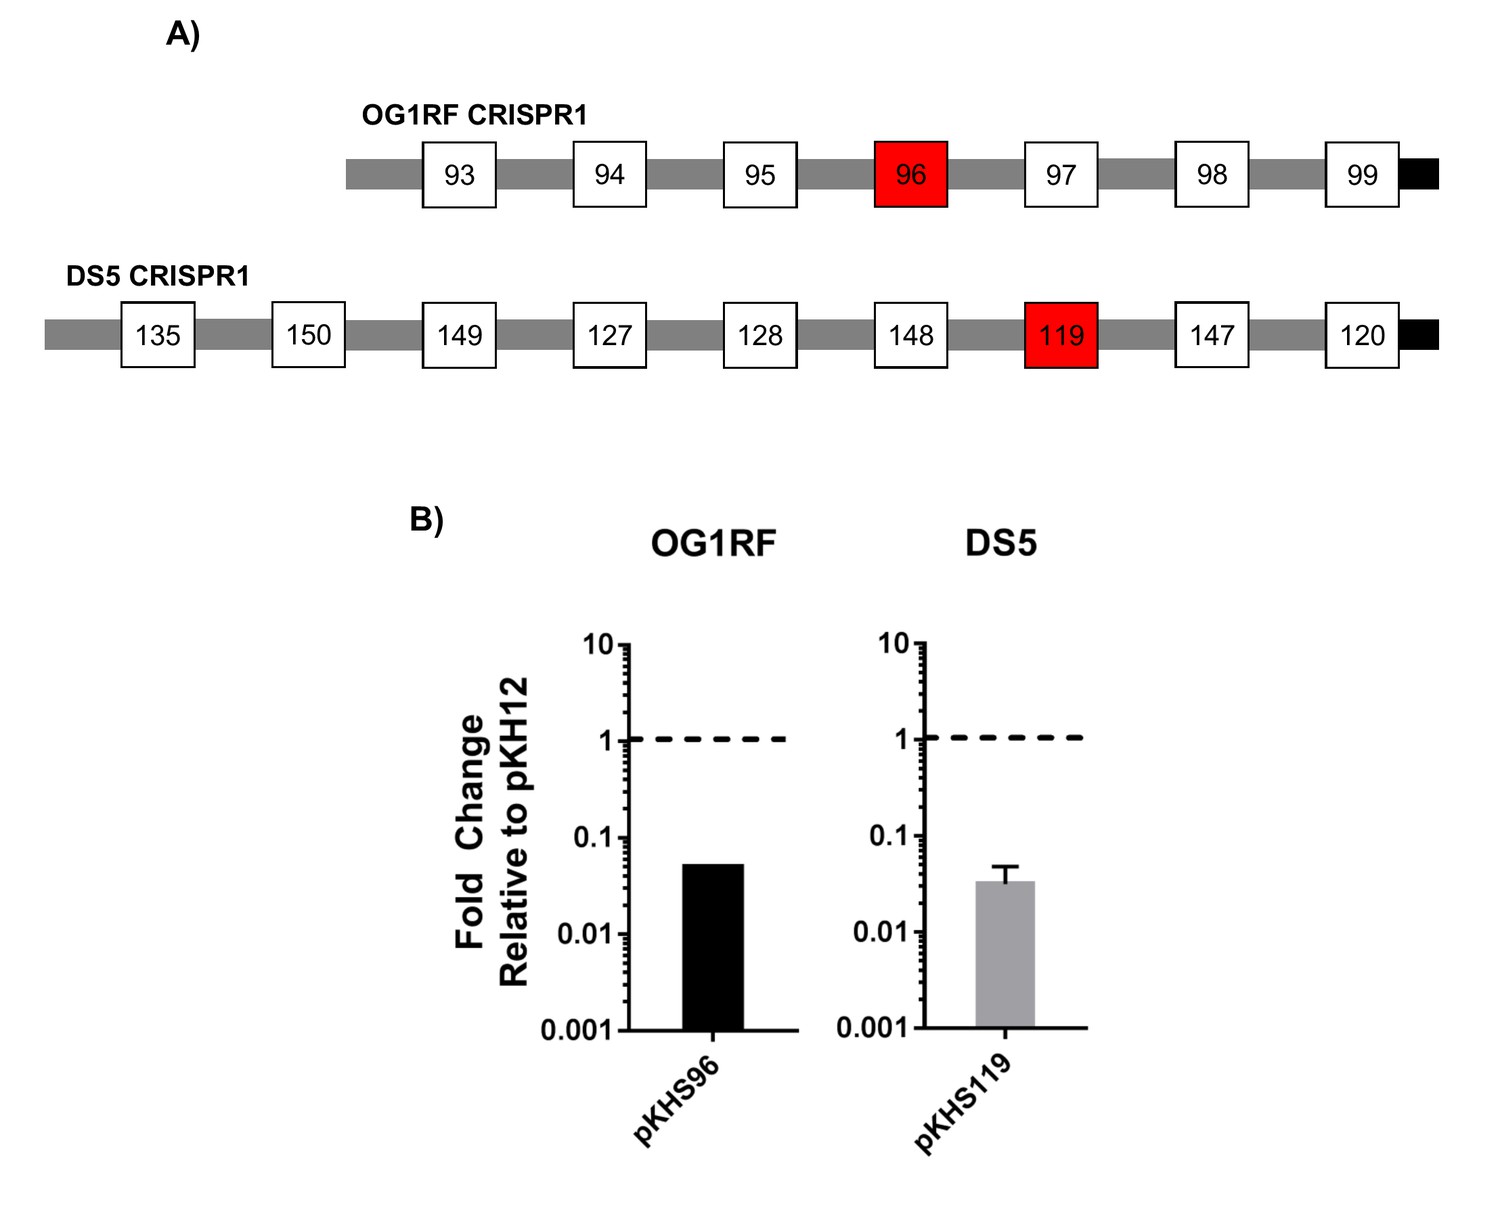
Conjugation assays to examine CRISPR1-Cas functionality in OG1RF and DS5.
(A) CRISPR1 arrays for OG1RF and DS5 are shown. Red spacers indicate those that are the examined for functionality. (B) Fold changes relative to pKH12 control plasmid are shown for 2 and 3 independent biological replicates for OG1RF and DS5, respectively.
Figure 2 with 4 supplements
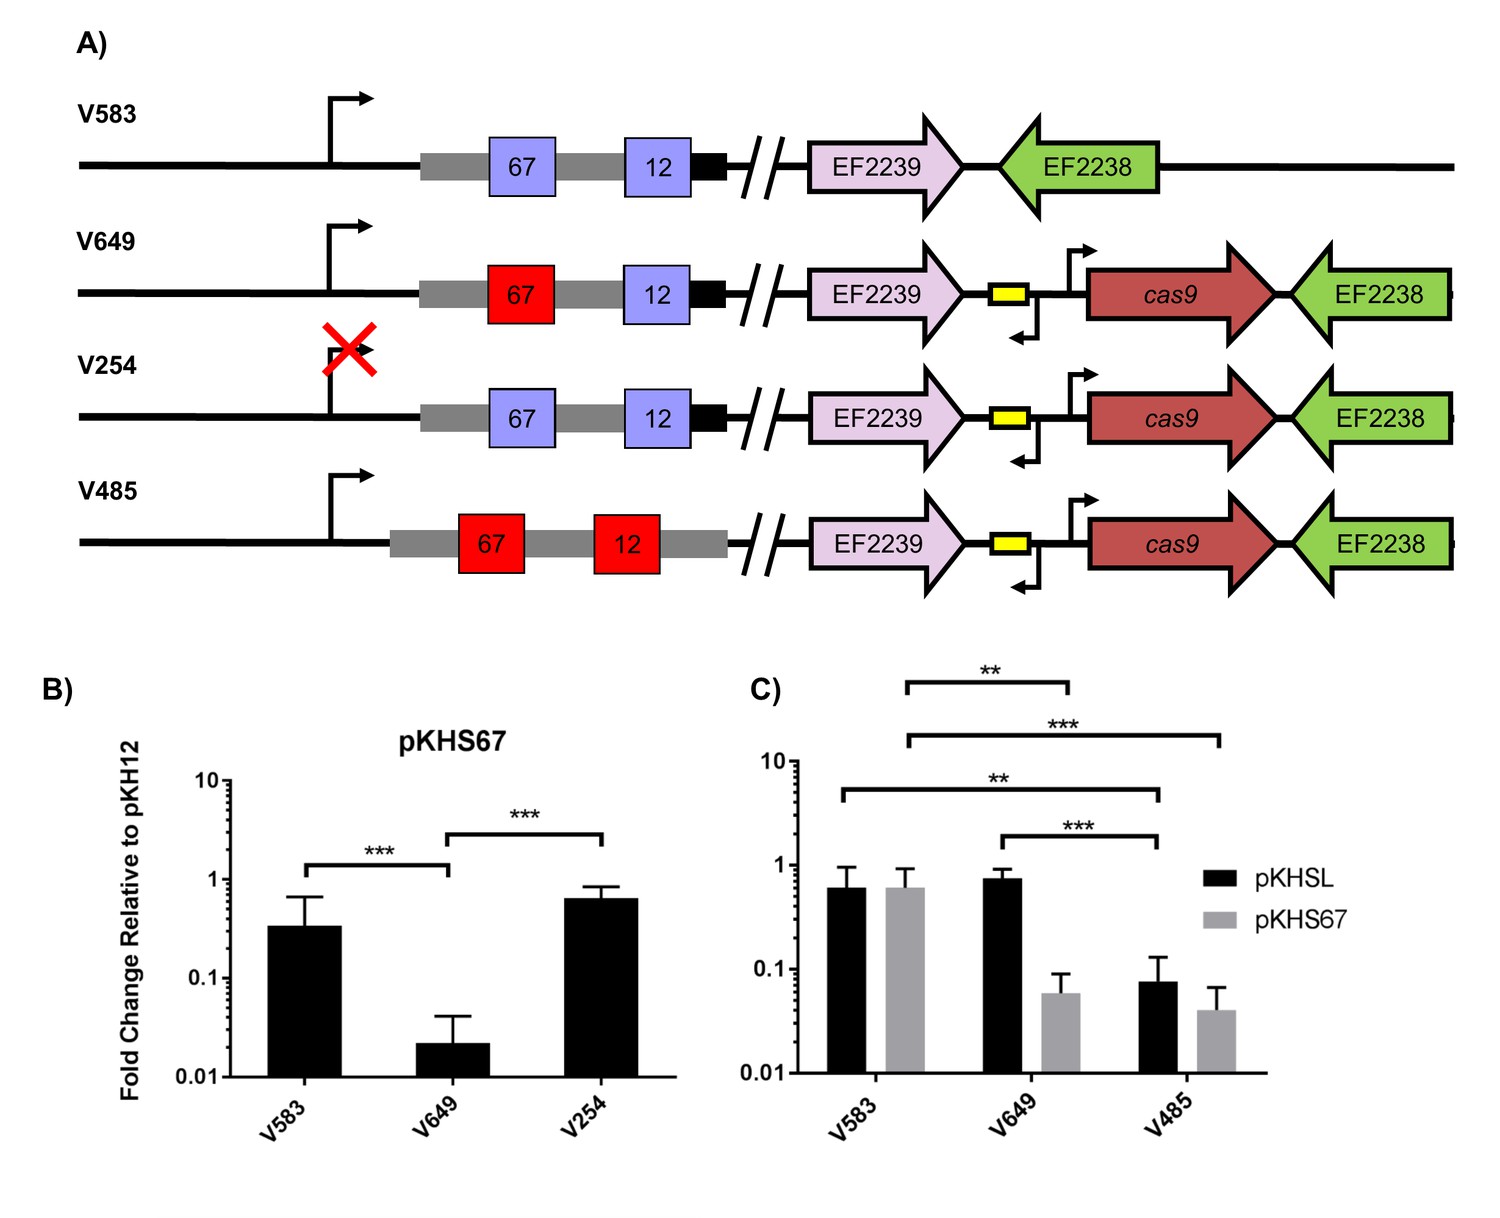
Assessment of CRISPR2 function in V583.
(A) Genotypes of relevant strains are diagrammed. In V485, the CRISPR2 terminal repeat is replaced with a direct repeat. Spacers in red were experimentally determined to provide genome defense, while blue spacers do not provide genome defense. (B) Conjugation frequencies relative to pKH12 are plotted for pKHS67 transfer into V583, V649, and V254. The geometric mean and geometric standard deviation are shown for 4 independent biological replicates. (C) Conjugation frequencies relative to pKH12 are plotted for pKHSL and pKHS67 transfer into V583, V649, and V485. pKHSL contains the S12 sequence from the V583 CRISPR2 array. The geometric mean and geometric standard deviation for 3 independent biological replicates are shown. ***p<0.001, **p<0.01.
Figure 2—figure supplement 1

CRISPR2 function in Merz96.
(A) Relevant genotypes are shown. Red spacers provide interference, blue spacers do not provide interference, and white spacers were not examined in the assay. (B) Conjugation frequencies of pKHS4 relative to pKH12 are shown for Merz96 and M236 for 4 independent biological replicates. ***p<0.001.
Figure 2—figure supplement 2
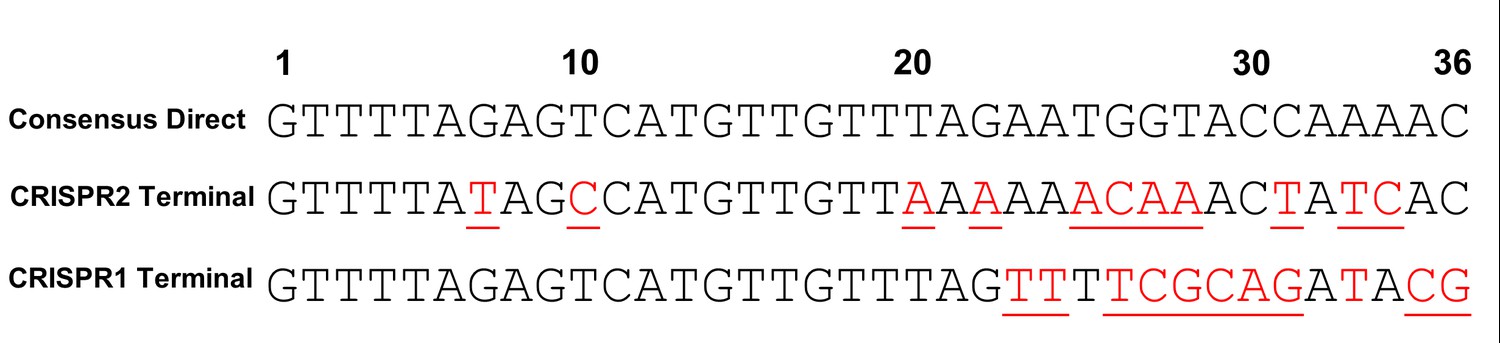
Repeat alignments.
Alignments of the consensus direct repeat, the CRISPR2 terminal repeat, and the CRISPR1 terminal repeat are shown. Bases underlined indicate those that differ from the consensus CRISPR2 direct repeat.
Figure 2—figure supplement 3
Conjugation of plasmids containing terminal spacers are unaffected by deletion of cas9.
Conjugation experiments are shown for terminal spacers and non terminal counterparts for (A) CRISPR1 and (B) CRISPR2 in ATCC 4200RF. Respective CRISPR2 arrays are shown. Spacers that showed no evidence of CRISPR defense are shown in blue. Geometric mean and geometric standard deviation are shown for 4 and 3 independent biological replicates for CRISPR1 and CRISPR2, respectively. **p<0.01, ***p<0.001.
Figure 2—figure supplement 4
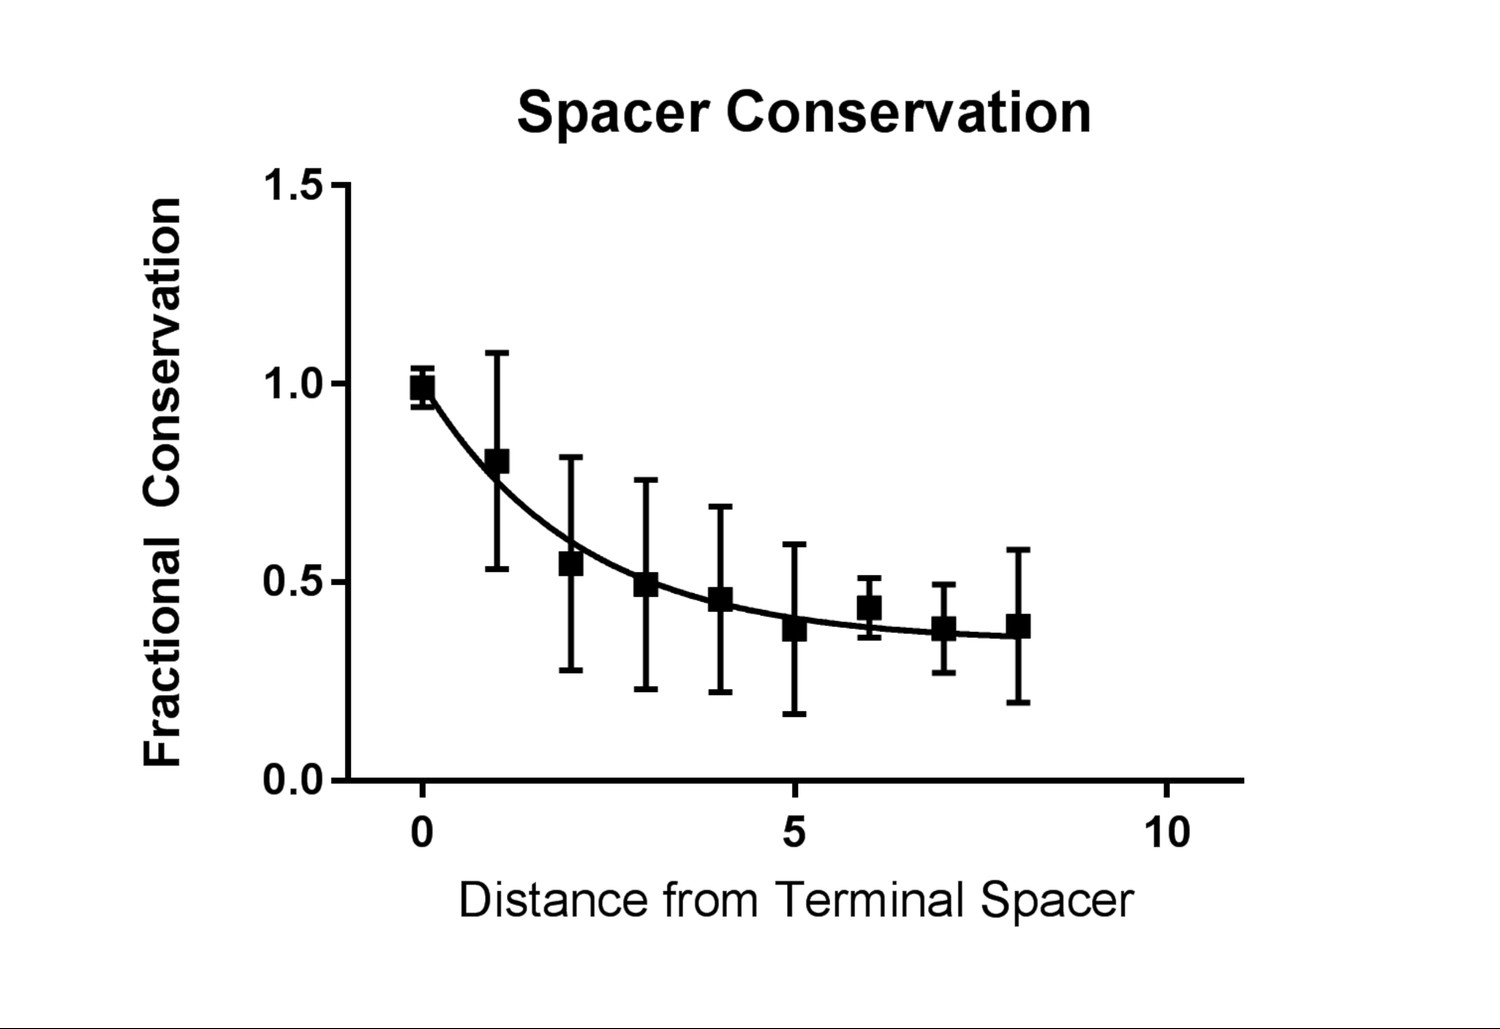
Conservation of spacers across CRISPR2.
The fraction of conservation is defined by the weighted average of the frequency of occurrence of any spacer at any given position. A value close to one indicates that a spacer found at that particular position is likely to only be found in that position. The conservation value is plotted against the distance, in spacers, from the terminal spacer.
Figure 3
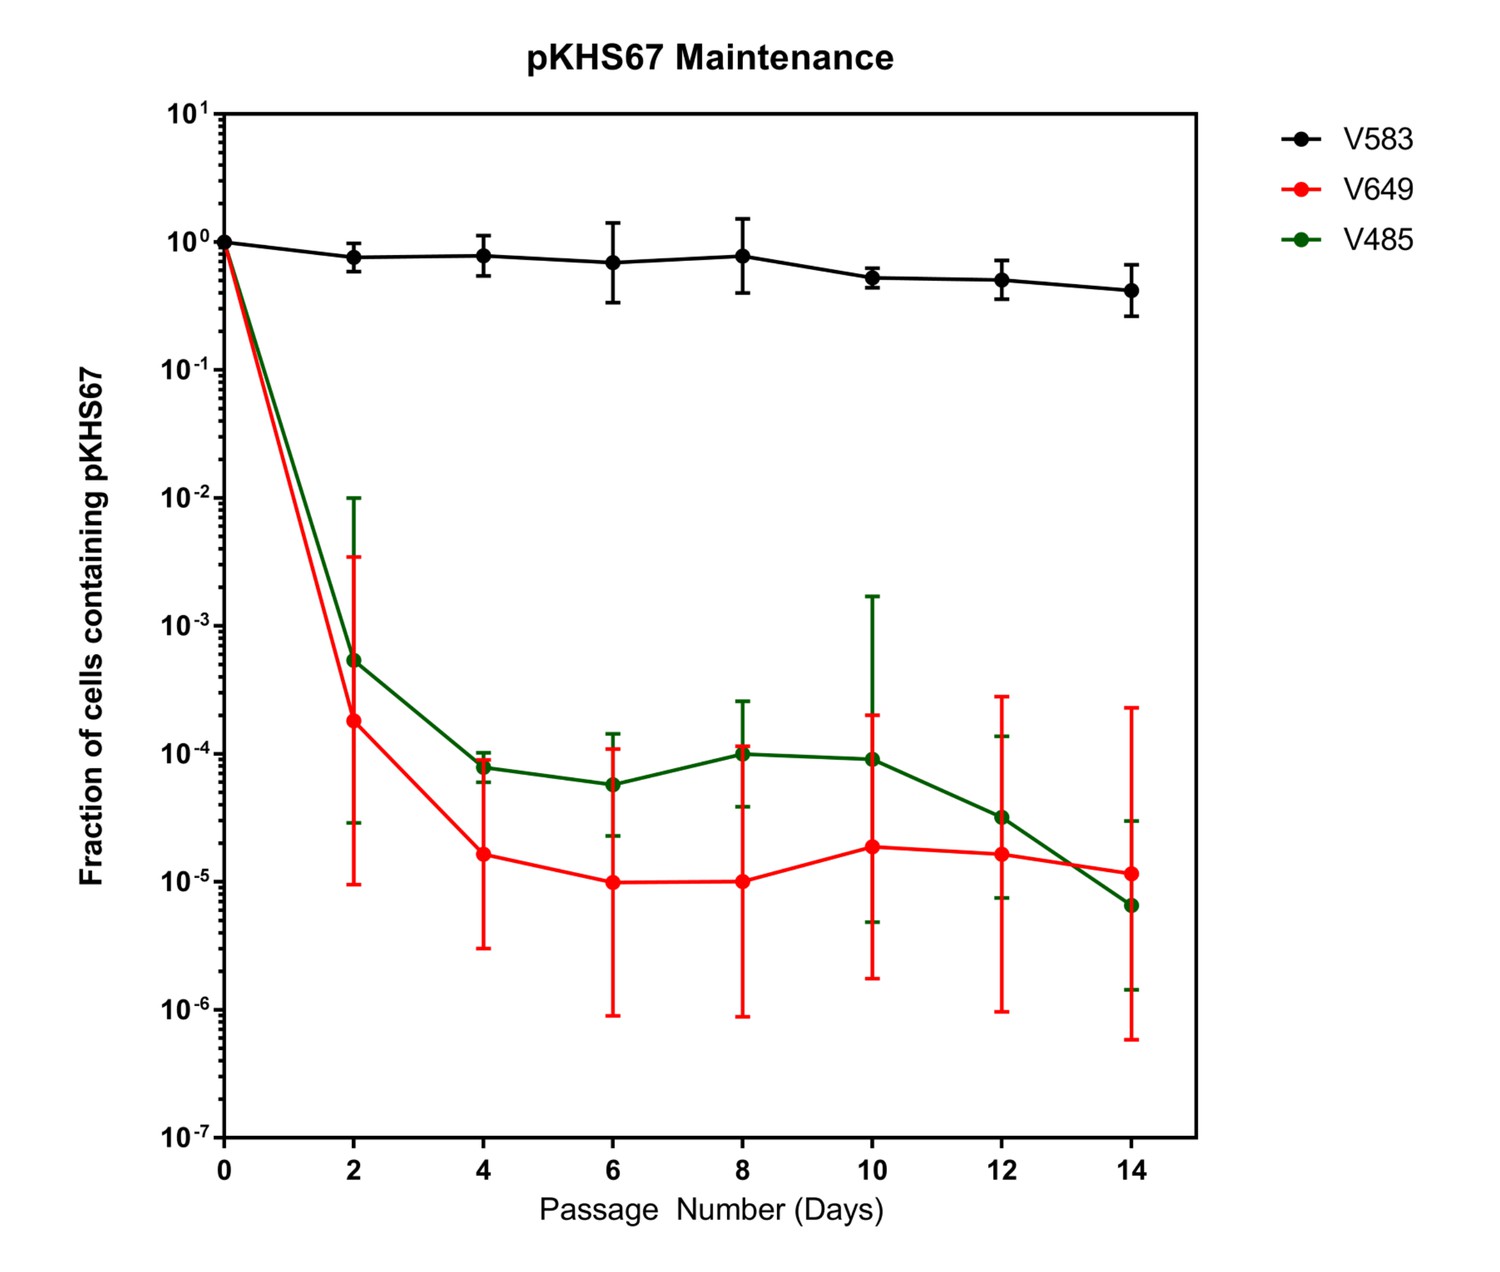
Plasmids are lost in a cas9-dependent manner in the absence of selection.
Fraction of cells containing pKHS67 was determined by CFU-camR/Total CFU. Cultures were passaged for 2 weeks in the absence of chloramphenicol. The geometric mean and geometric standard deviation from two independent biological replicates each from two transconjugants (total 4 unique transconjugants) are shown. Strains are defined in Figure 3.
Figure 4
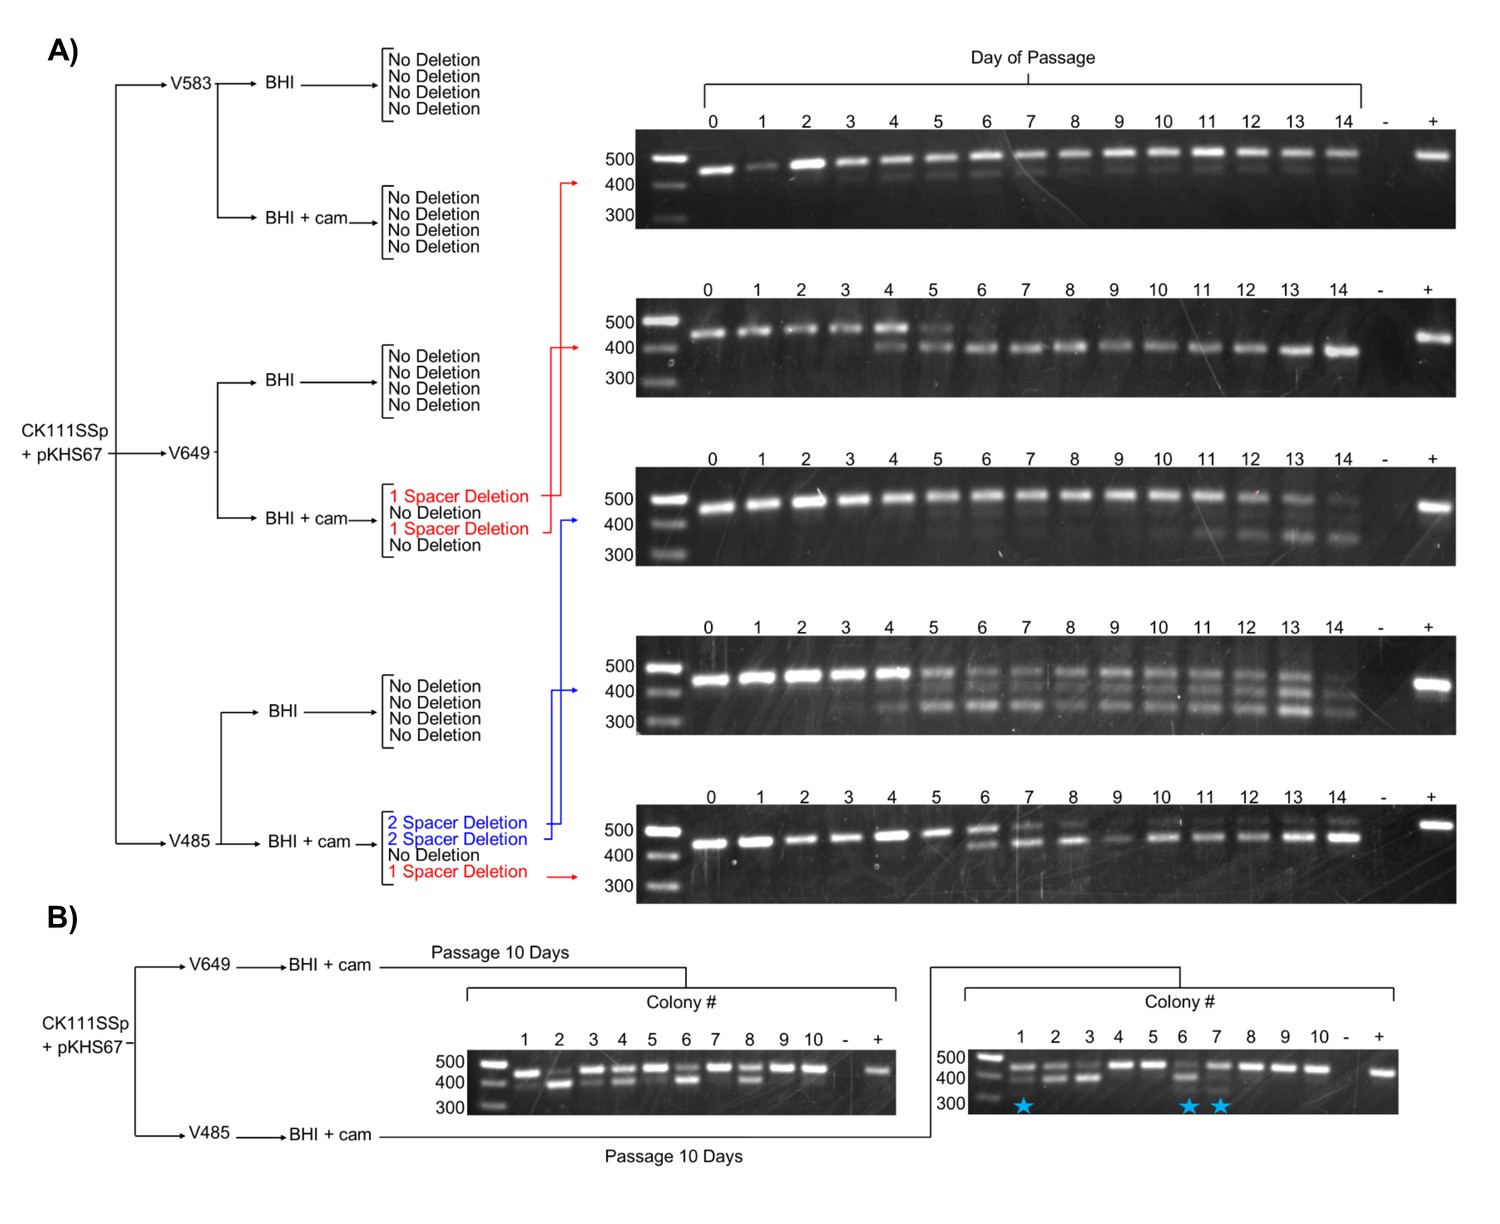
Effects of antibiotic selection on spacer content, and the role of terminal repeats.
(A) Experimental schematic for spacer deletion assay. Transconjugants of V583, V649, and V485 with pKHS67 were passaged in the presence of chloramphenicol selection and CRISPR2 size was monitored across 14 days. Representative gel images are shown for all 14 days. −, negative control (water); +, positive control (V583 gDNA). (B) The experiment from (A) was repeated only for 10 transconjugants each of V649 and V485, and the CRISPR2 sizes from day 10 are shown for all 10 clones. Blue star indicates two-spacer deletions, which were only observable with V485.
Figure 5 with 2 supplements

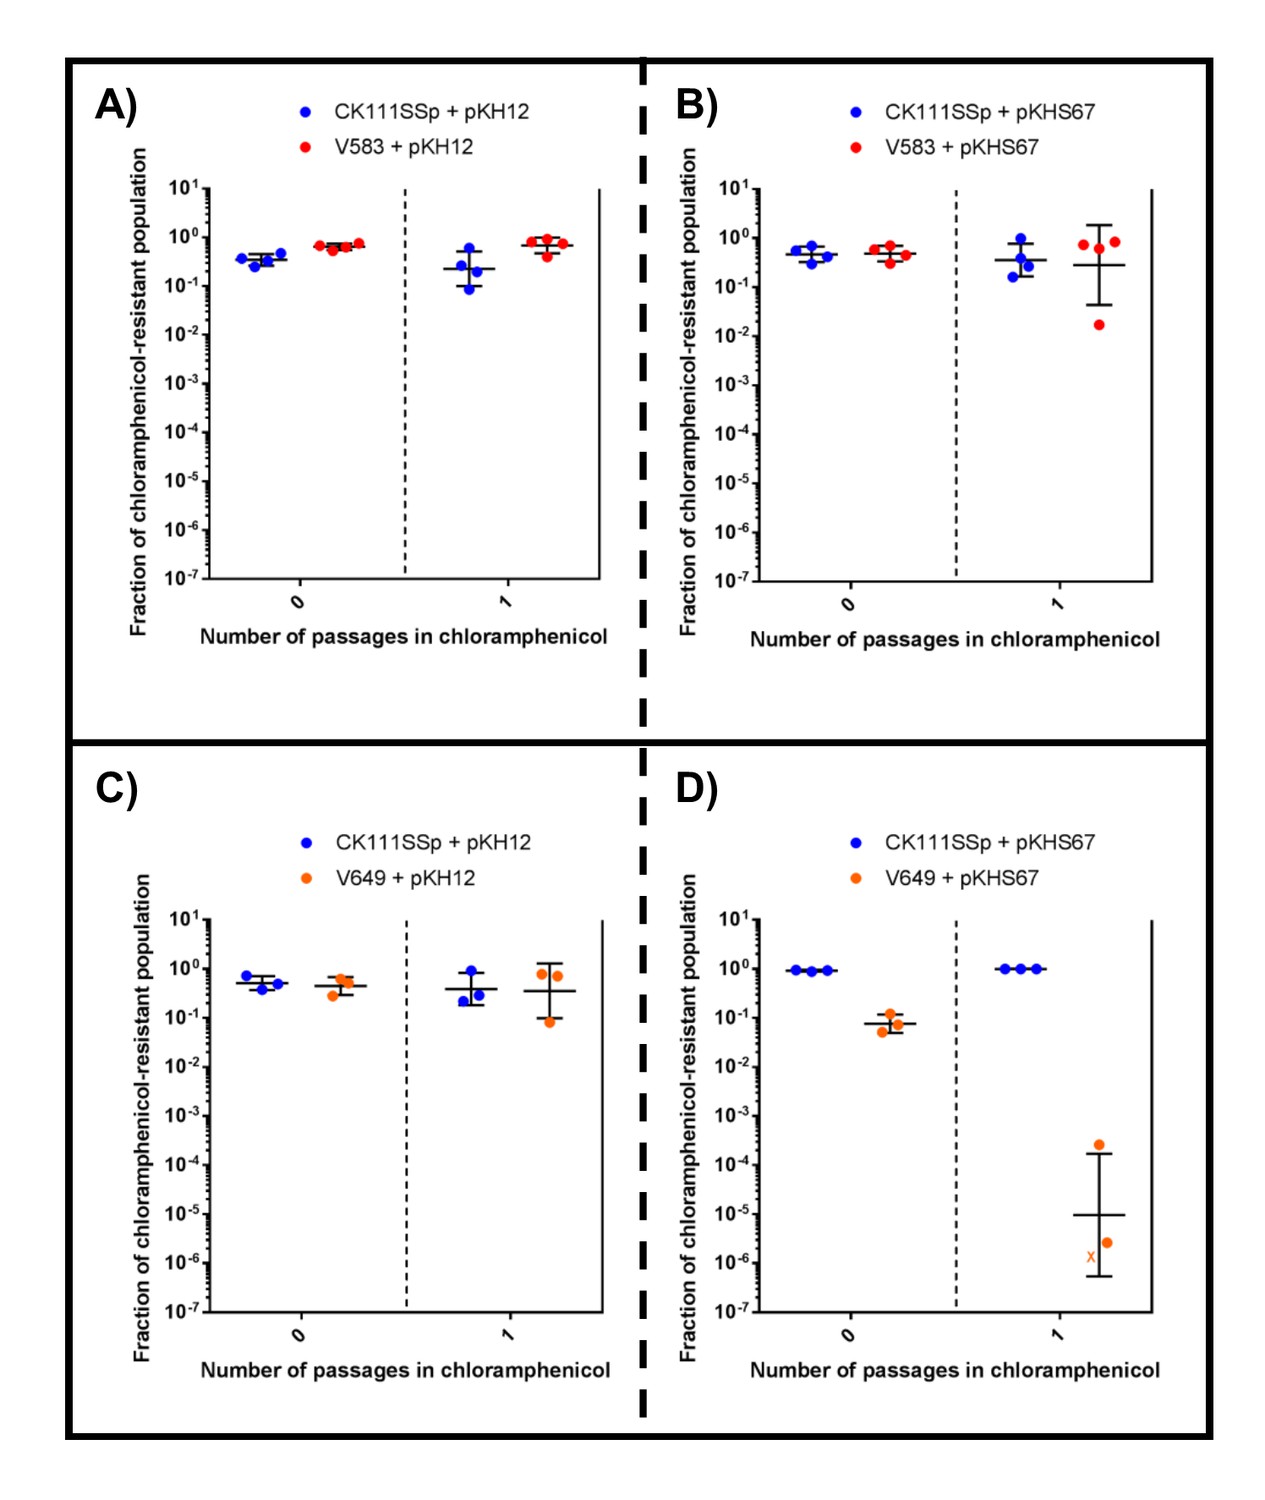
CRISPR alters population structure in vitro in a two-strain competition.
Conjugation competition assays were performed with CK111SSp(pCF10-101) and V583 with (A) pKH12 and (B) pKHS67 using a 1/1000 dilution of the initial mating reaction for the first chloramphenicol passage. Experiments with CK111SSp(pCF10-101) and V649 were simultaneously performed with (C) pKH12 and (D) pKHS67. ‘X’ values indicate those that fell below the threshold of detection. Geometric mean and standard deviation are shown for 3 independent biological replicates. V583 and V649 genotypes have been shown again for clarity.
-
Figure 5—source data 1
Replicate values for growth curves.
OD600nm values for each individual replicate are provided, which are shown in Figure 5—figure supplement 1.
- https://doi.org/10.7554/eLife.26664.013
Figure 5—figure supplement 1
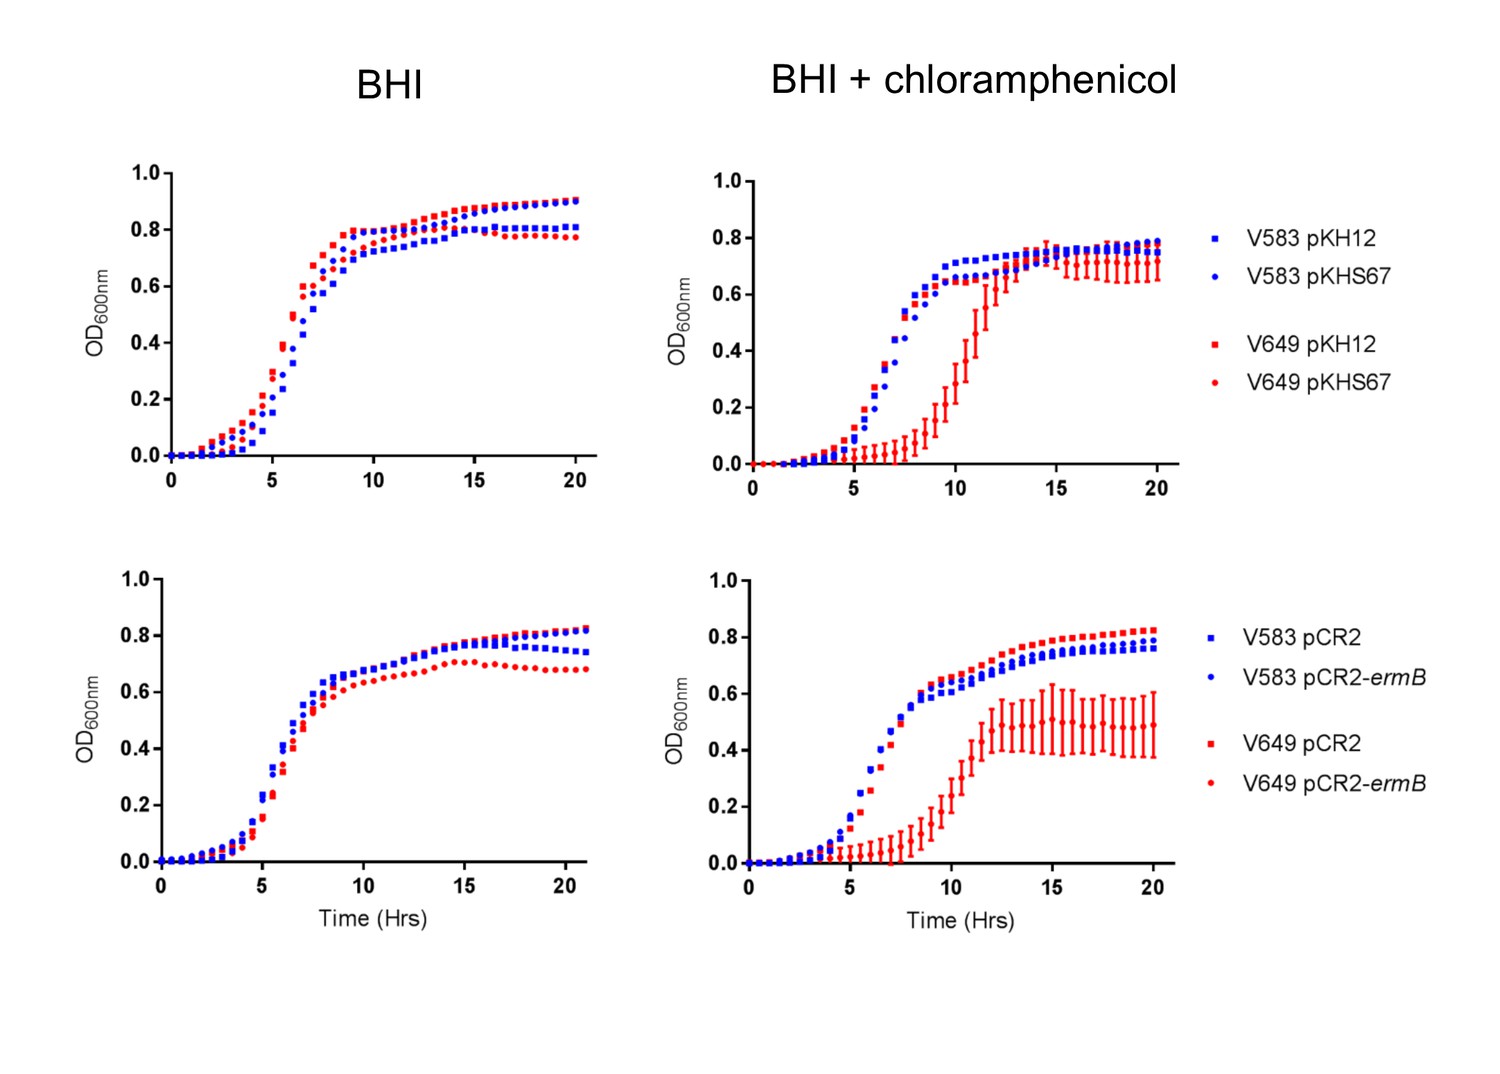
CRISPR targeting results in growth defect in chloramphenicol.
Average growth curves from three colonies in triplicate (for pCR2 experiments) or in duplicate (for pKH12 experiments) are shown. Error bars are omitted for groups that lack CRISPR targeting for clarity.
Figure 5—figure supplement 2
CRISPR alters population structure in vitro in a two-strain competition at higher initial dilutions.
Conjugation competition assays were performed with CK111SSp(pCF10-101) and V583 with (A) pKH12 and (B) pKHS67 with a 1/10,000 dilutions of the mating reaction (as opposed to 1/1000 in Figure 7). Experiments with CK111SSp(pCF10-101) and V649 were simultaneously performed with (C) pKH12 and (D) pKHS67. ‘X’ values indicate those that fell below the threshold of detection. Geometric mean and standard deviation are shown for 4 and 3 independent biological replicates.
Figure 6

CRISPR defense alters population structure.
The relative abundances of V583, V649, CK111SSp(pCF10-101), and ATCC 4200RF carrying a plasmid are plotted against the number of passages in chloramphenicol. Independent replicates are shown along with the geometric mean and geometric standard deviation. CK111SSp(pCF10-101), ATCC 4200RF, and V583 were propagated with (A) pKH12, (B) pKHS11 and (C) pKHS67. CK111SSp(pCF10-101), ATCC 4200RF, and V649 were also propagated with (D) pKH12, (E) pKHS11 and (F) pKHS67. The fraction of chloramphenicol resistant population was determined by strain-specific camR CFU/total camR CFU. ‘X’ indicate values that fell below the threshold of detection. Strain genotypes are shown for clarity.
Figure 7 with 1 supplement
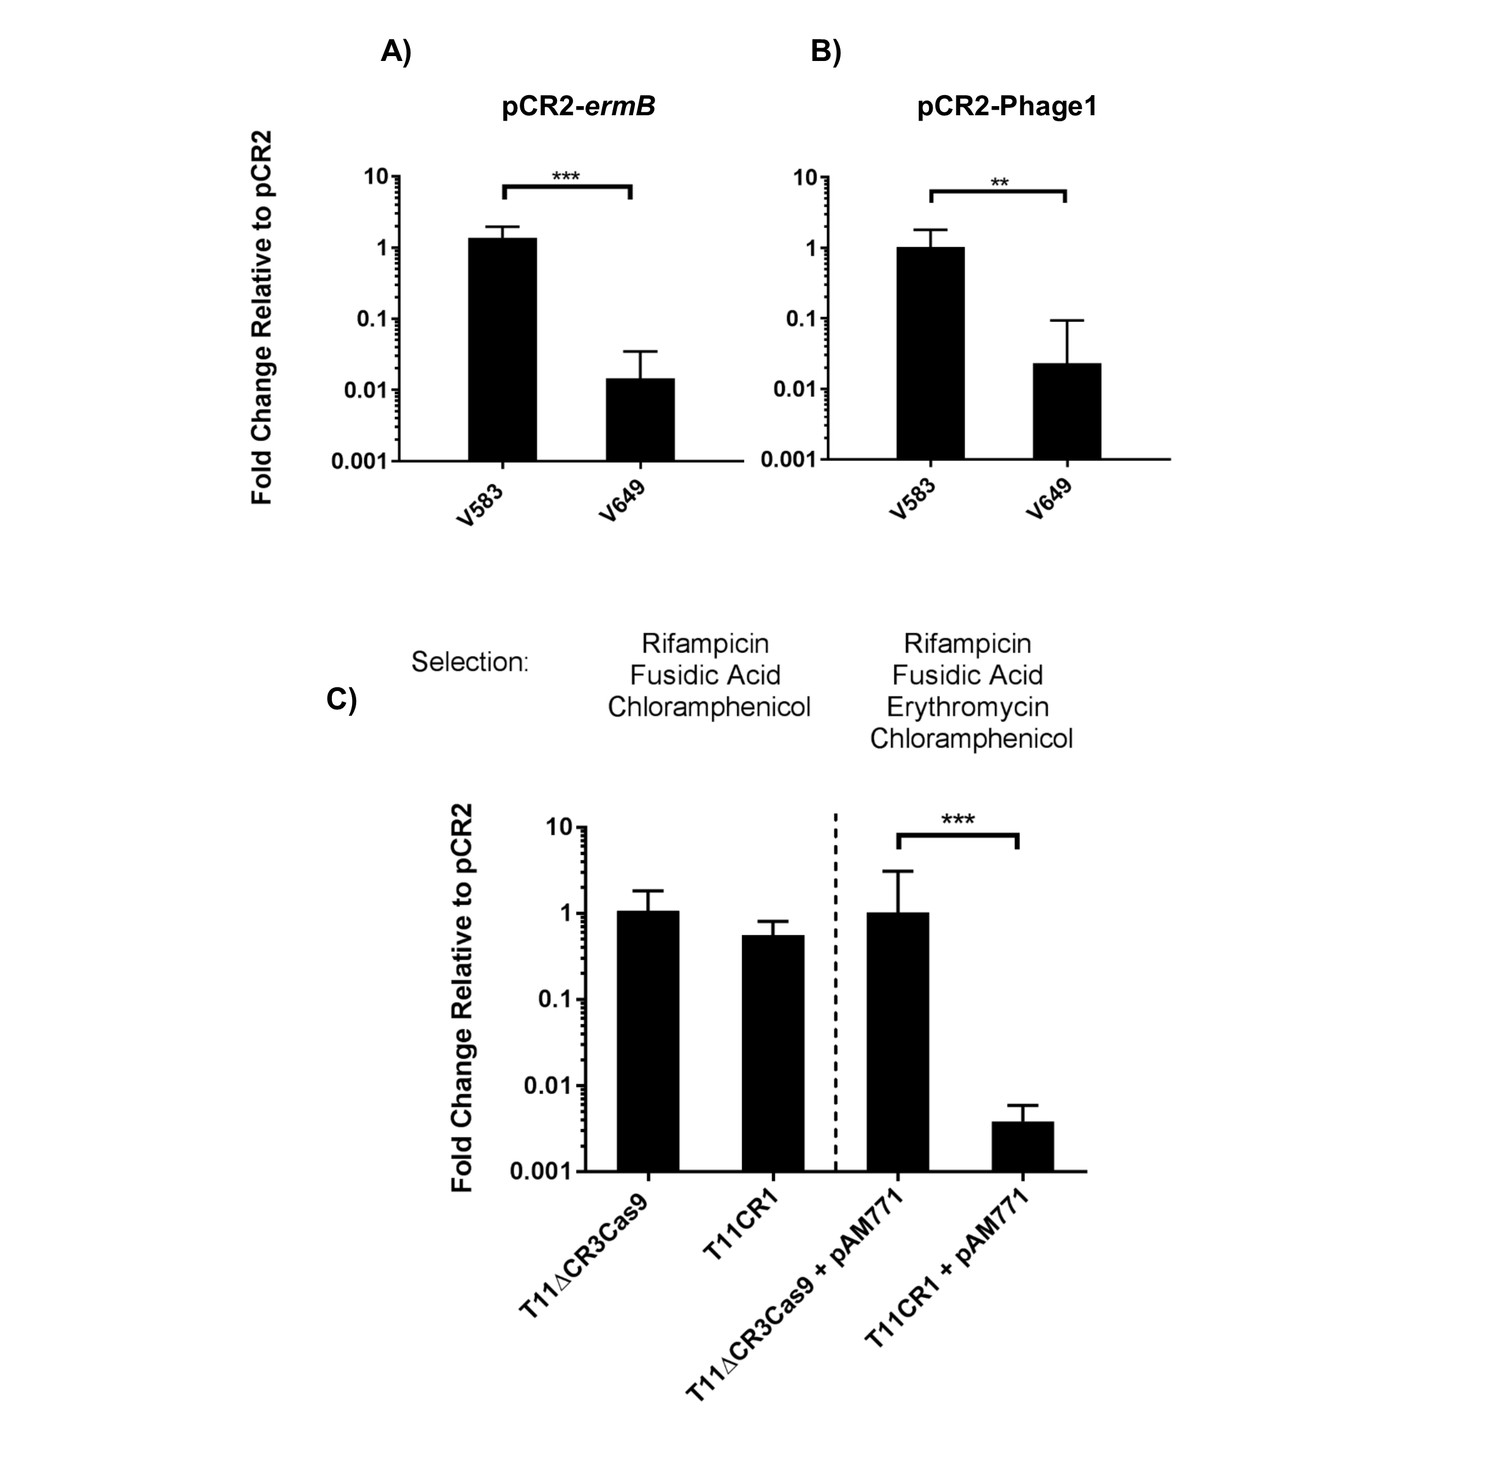
Transfer frequencies of 'self-targeting' plasmid constructs.
(A) Conjugation frequency with pCR2-ermB are shown relative to pCR2 in V583 and V649. Transconjugants were selected on vancomycin and chloramphenicol. (B) Conjugation frequency with pCR2-Phage1 are shown relative to pCR2 in V583 and V649. (C) Conjugation frequency of pCR2-ermB are shown relative to pCR2 with varying transconjugant selection in T11RFΔCR3cas9 and T11CR1. The geometric mean and geometric standard deviation of 3 independent biological replicates are shown. **p<0.01, ***p<0.001.
Figure 7—figure supplement 1
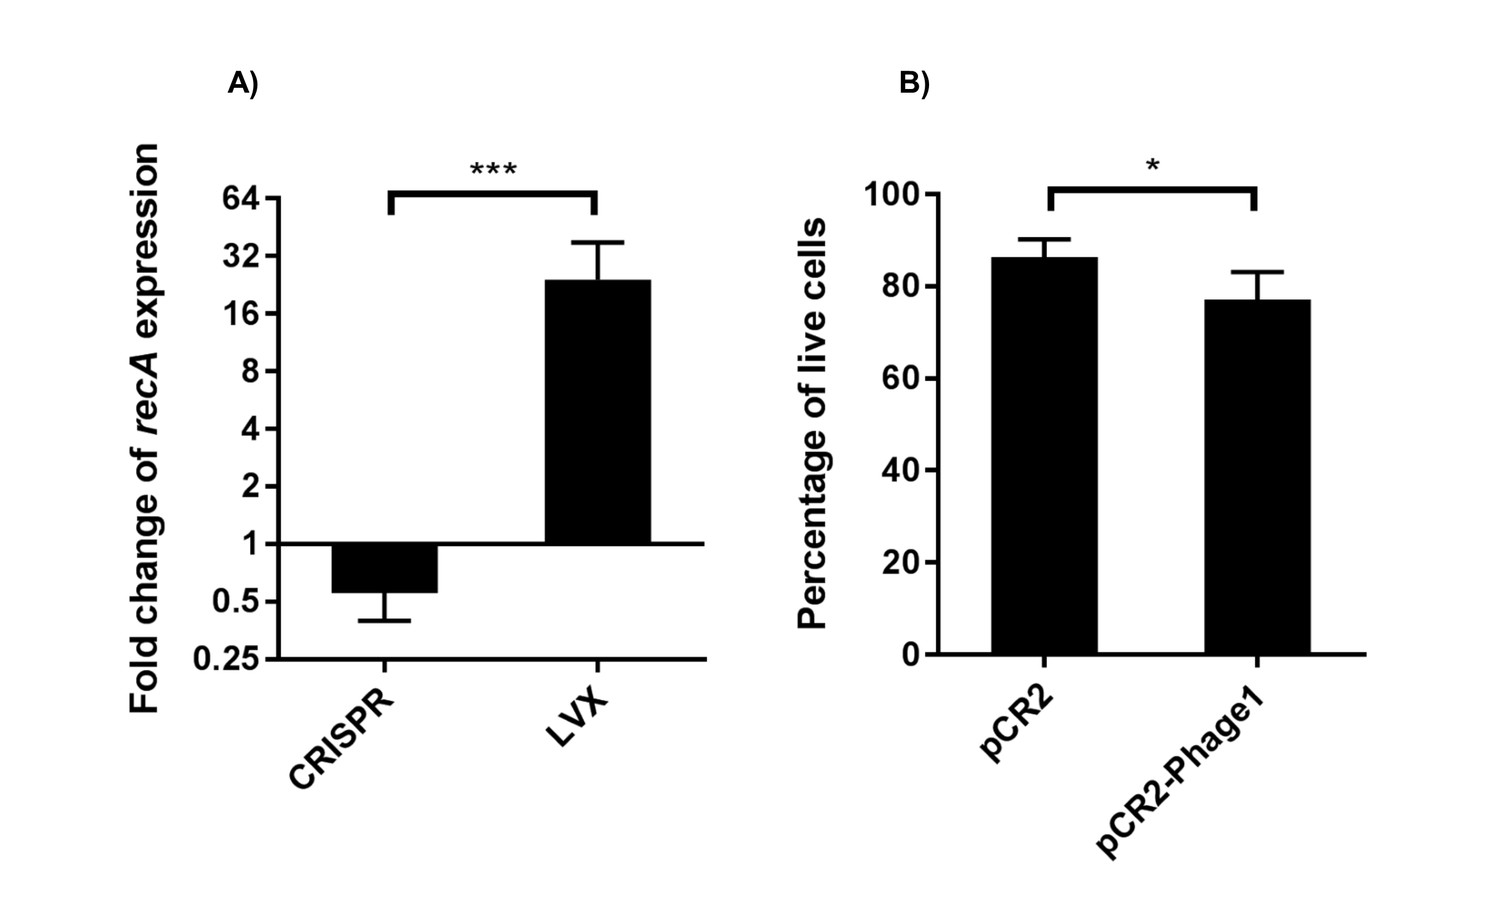
RT-qPCR analysis of recA transcript levels and live cell quantification.
(A) Fold change of recA transcript levels are shown (geometric mean and geometric standard deviation) for CRISPR chromosomal targeting (comparing pCR2-Phage1 with pCR2) and LVX treatment. Normalization of Cq values and sample preparation are described in the materials and methods. Differences in fold changes of recA transcript levels between CRISPR and LVX treatment are statistically significant using a two-tailed student’s T test (p<0.001) assuming log normal distribution. (B) Percentages of live cells (arithmetic mean and standard deviation) between the presence and absence of chromosomal CRISPR targeting using pCR2-Phage1 and pCR2 are shown. Results are statistically significant using a one-tailed student’s T test (p=0.044). Three independent biological experiments were performed in (A) and (B).
Figure 8 with 1 supplement
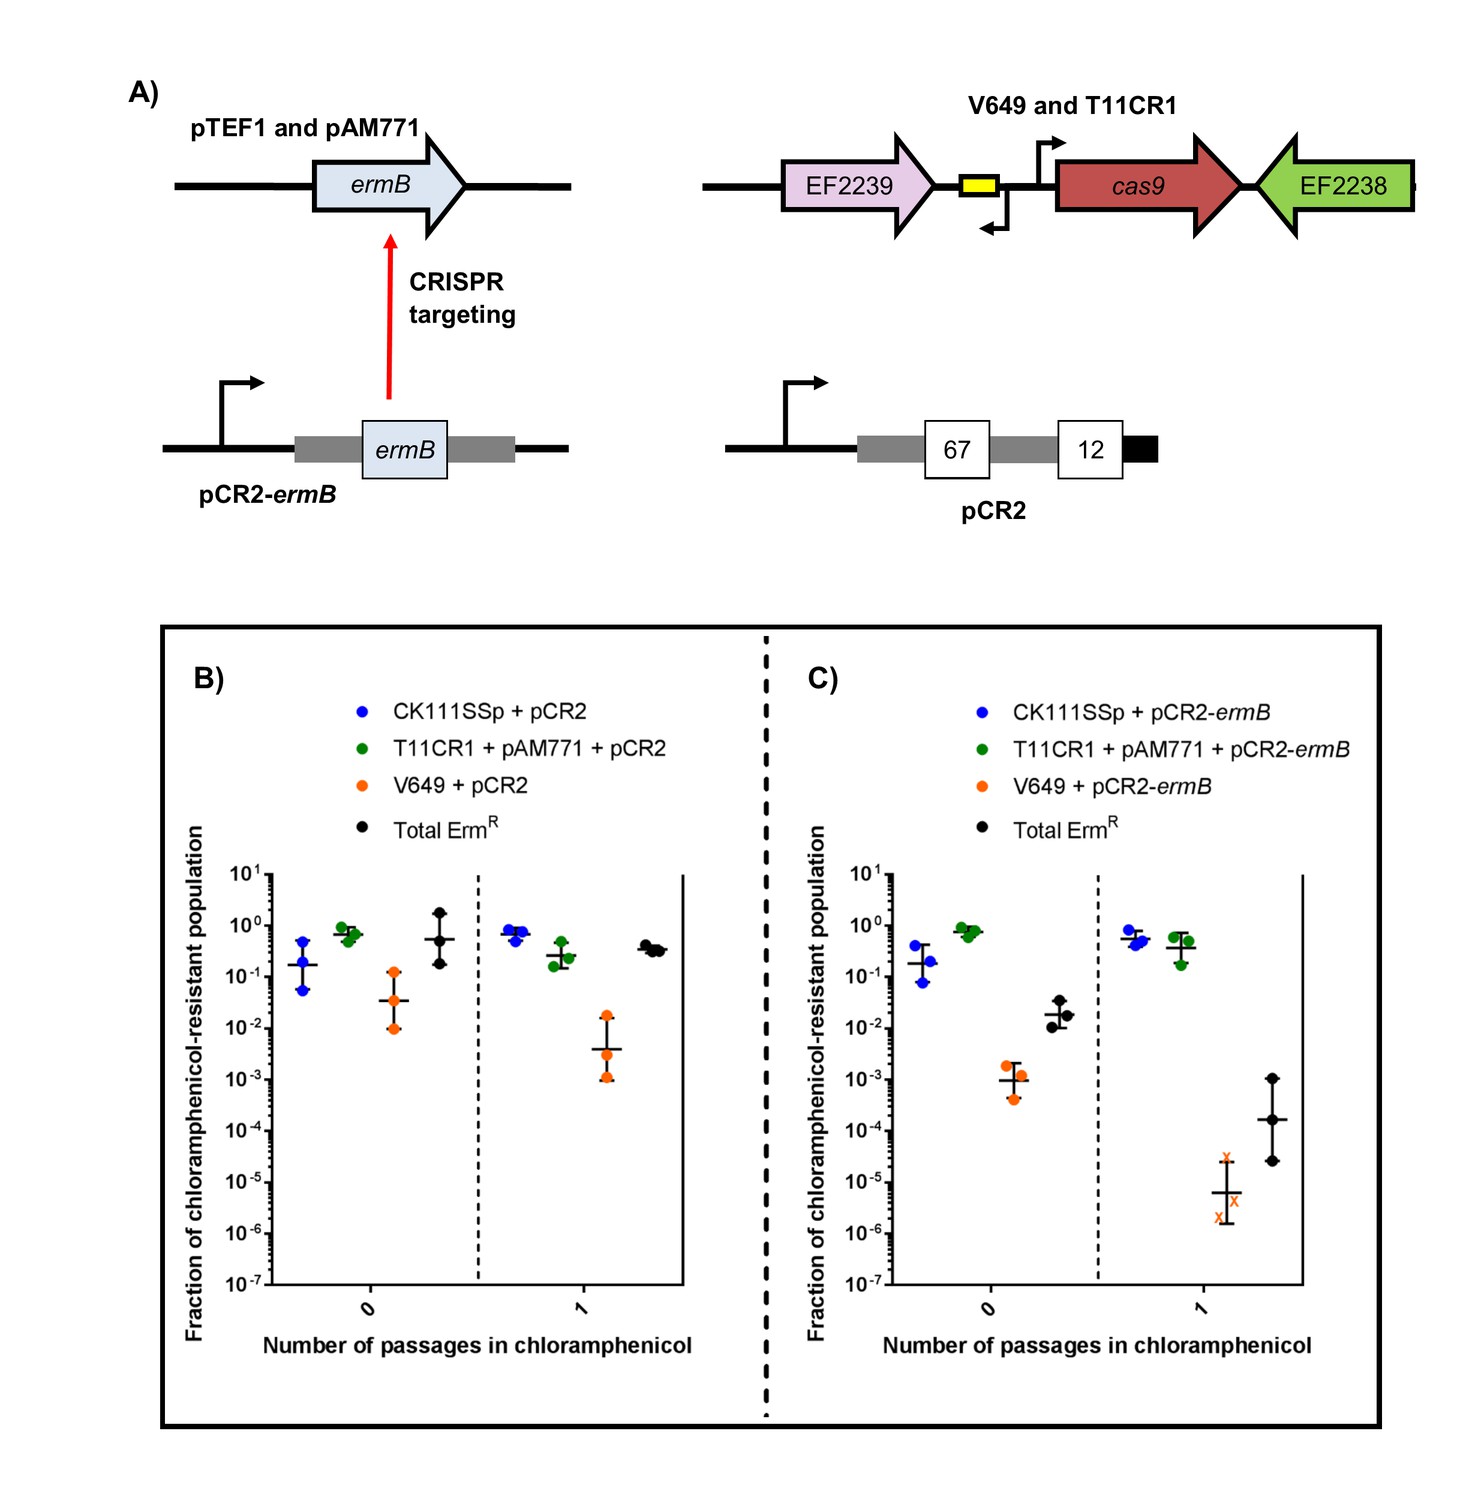
CRISPR targeting removes specific antibiotic resistances from populations in vitro.
(A) Genotypes of select strains and plasmids are shown. (B–C) Conjugation-competition assays are shown, similar to those in Figure 7. T11CR1 carrying pAM771 was used, but transconjugants were selected on only rifampicin, fusidic acid, and chloramphenicol to assess if T11CR1 was able to survive with the loss of pAM771. V649 possesses ermB on pTEF1. Total ermR CFU accounts for both V649 and T11RF+pAM771. ‘X’ indicate values that fell below the threshold of detection.
Figure 8—figure supplement 1
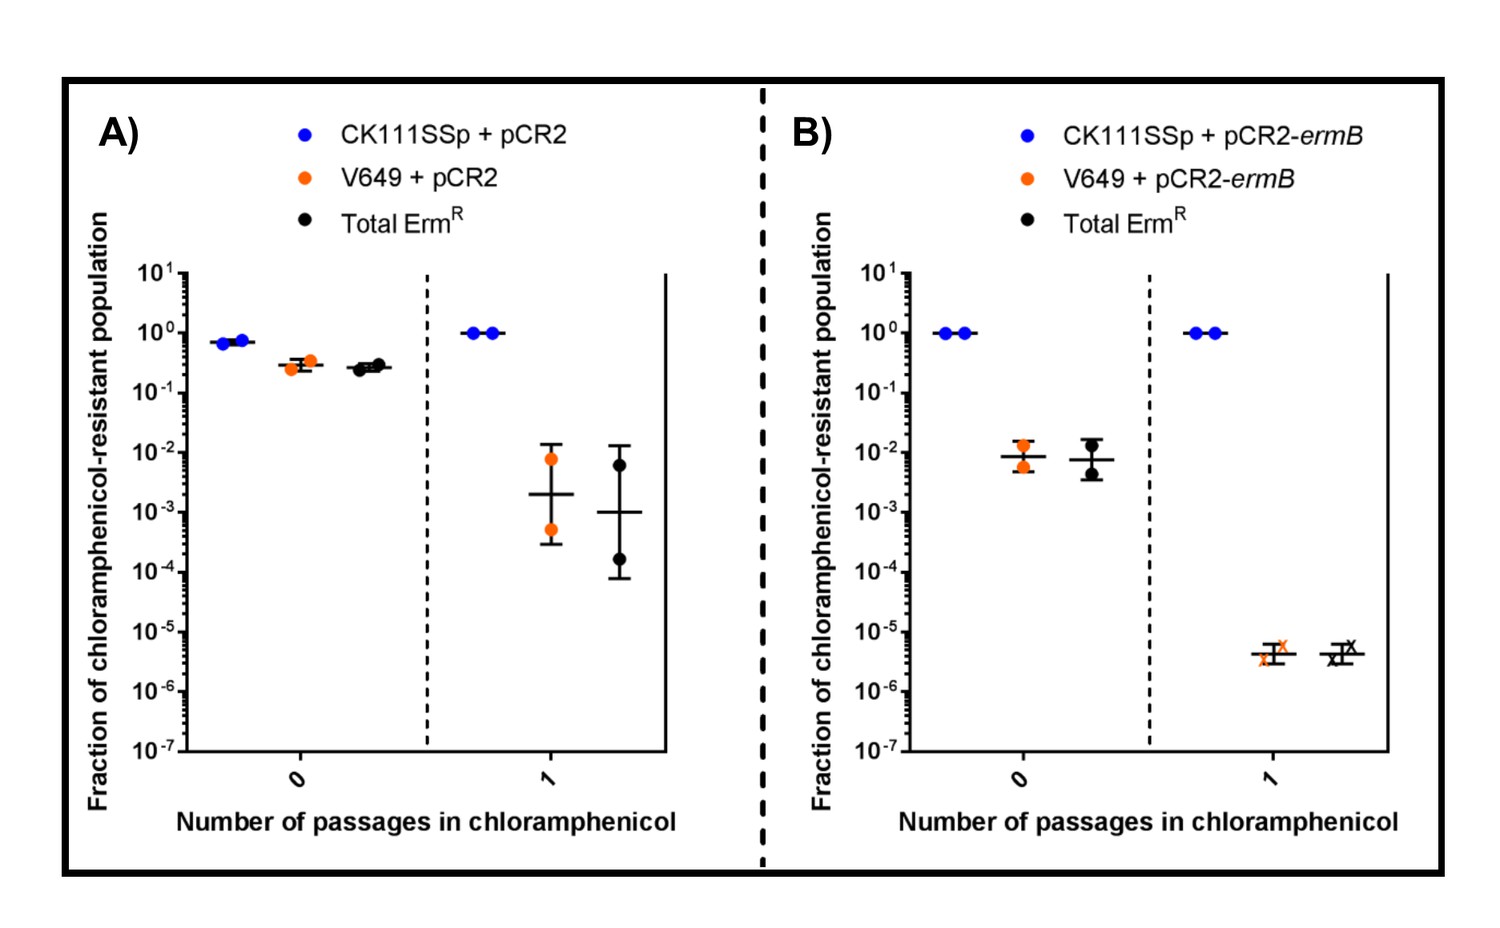
CRISPR targeting and two-strain competition can remove antibiotic resistances in vitro.
CK111SSp(pCF10-101) carrying (A) pCR2 or (B) pCR2-ermB was conjugated into V649 and the reaction was passaged in chloramphenicol overnight. ‘X’ values indicate those that fell below the threshold of detection. The geometric mean and geometric standard deviation are shown for two independent biological replicates.
Additional files
-
Supplementary file 1
Primer extension replicate 1.
Raw data for identification of the CRISPR2 start site is provided.
- https://doi.org/10.7554/eLife.26664.021
-
Supplementary file 2
Primer extension replicate 2.
Raw data for identification of the CRISPR2 start site is provided.
- https://doi.org/10.7554/eLife.26664.022
-
Supplementary file 3
Strains and plasmids used in this study.
- https://doi.org/10.7554/eLife.26664.023
-
Supplementary file 4
Primers used in this study.
- https://doi.org/10.7554/eLife.26664.024
Download links
A two-part list of links to download the article, or parts of the article, in various formats.
Downloads (link to download the article as PDF)
Open citations (links to open the citations from this article in various online reference manager services)
Cite this article (links to download the citations from this article in formats compatible with various reference manager tools)
Exploiting CRISPR-Cas to manipulate Enterococcus faecalis populations
eLife 6:e26664.
https://doi.org/10.7554/eLife.26664


