MELK is not necessary for the proliferation of basal-like breast cancer cells
- Dana-Farber Cancer Institute, United States
- Harvard Medical School, United States
- University of Dundee, United Kingdom
- Novartis Institutes for Biomedical Research, United States
Figures
Figure 1 with 1 supplement
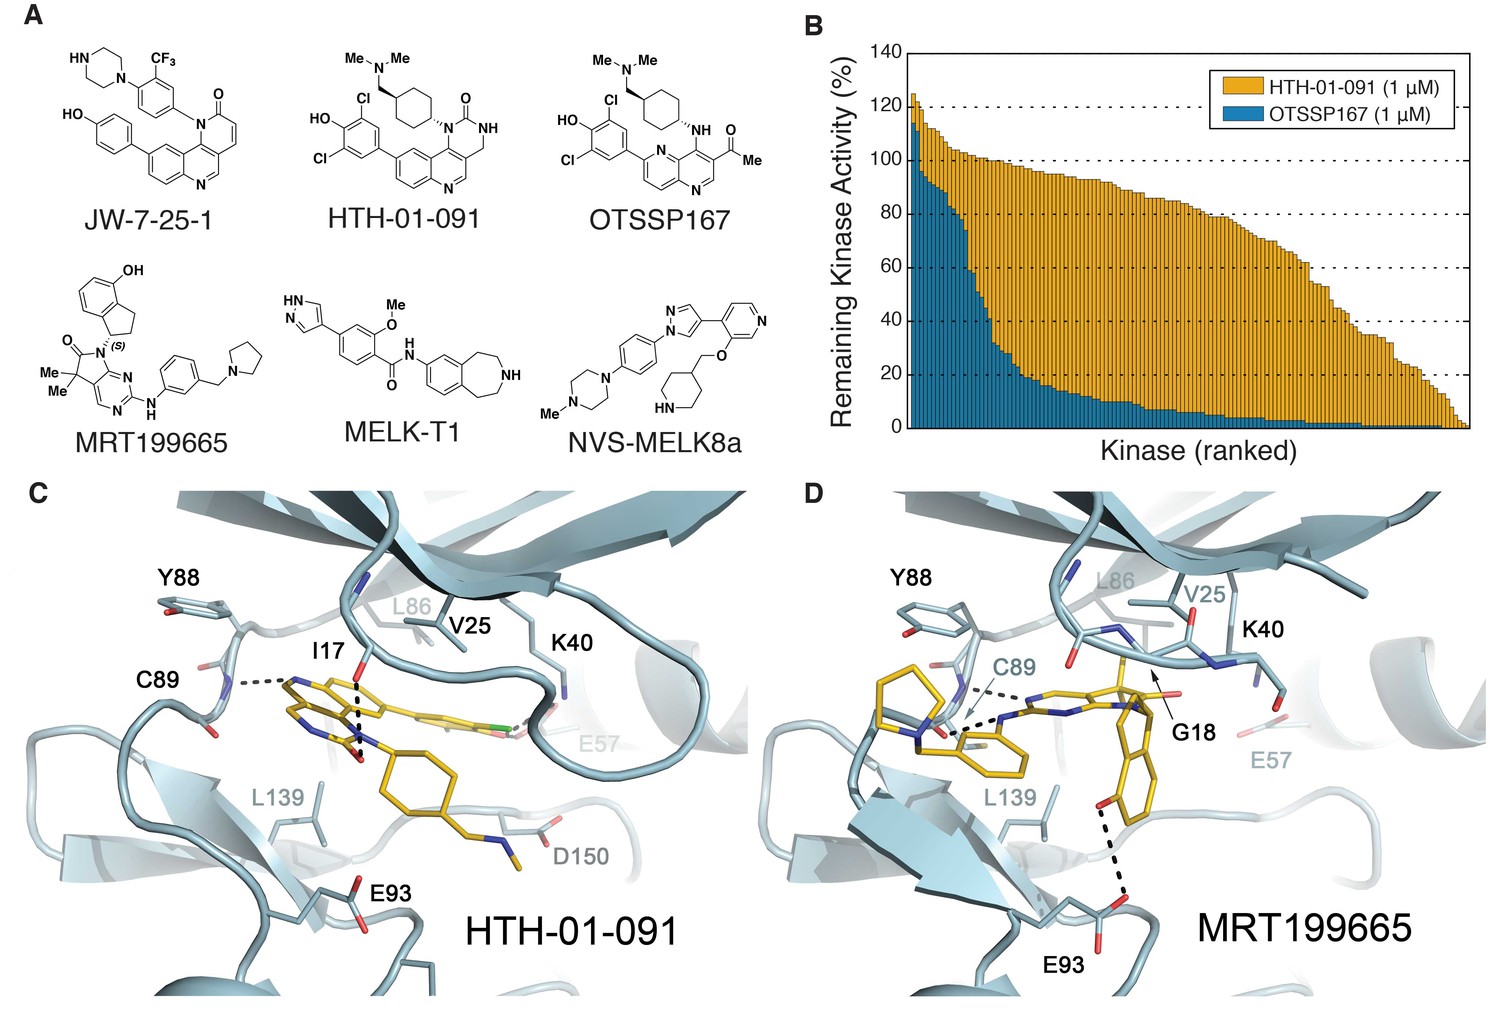
Biochemical characterization of HTH-01-091 and other MELK inhibitors.
(A) The chemical structures of all MELK inhibitors used in this study. (B) Overlaid histograms comparing the percent remaining kinase activities of 140 kinases (ICKP panel) when treated with OTSSP167 (1 μM) versus HTH-01-091 (1 μM). The kinases are ranked and therefore in different orders between the two compounds. See also Figure 1—figure supplement 1, Figure 1—source data 1 and Table 2 for more inhibitor selectivity and potency data. (C) Crystal structure of MELK(2-333) in complex with HTH-01-091. (PDB accession code: 5TWL). (D) Crystal structure of MELK(1-340) in complex with MRT199665. (PDB accession code: 5TX3).
-
Figure 1—source data 1
Kinase profiling of OTSSP167 and HTH-01-091 by the International Center for Kinase Profiling (ICKP).
- https://doi.org/10.7554/eLife.26693.004
Figure 1—figure supplement 1
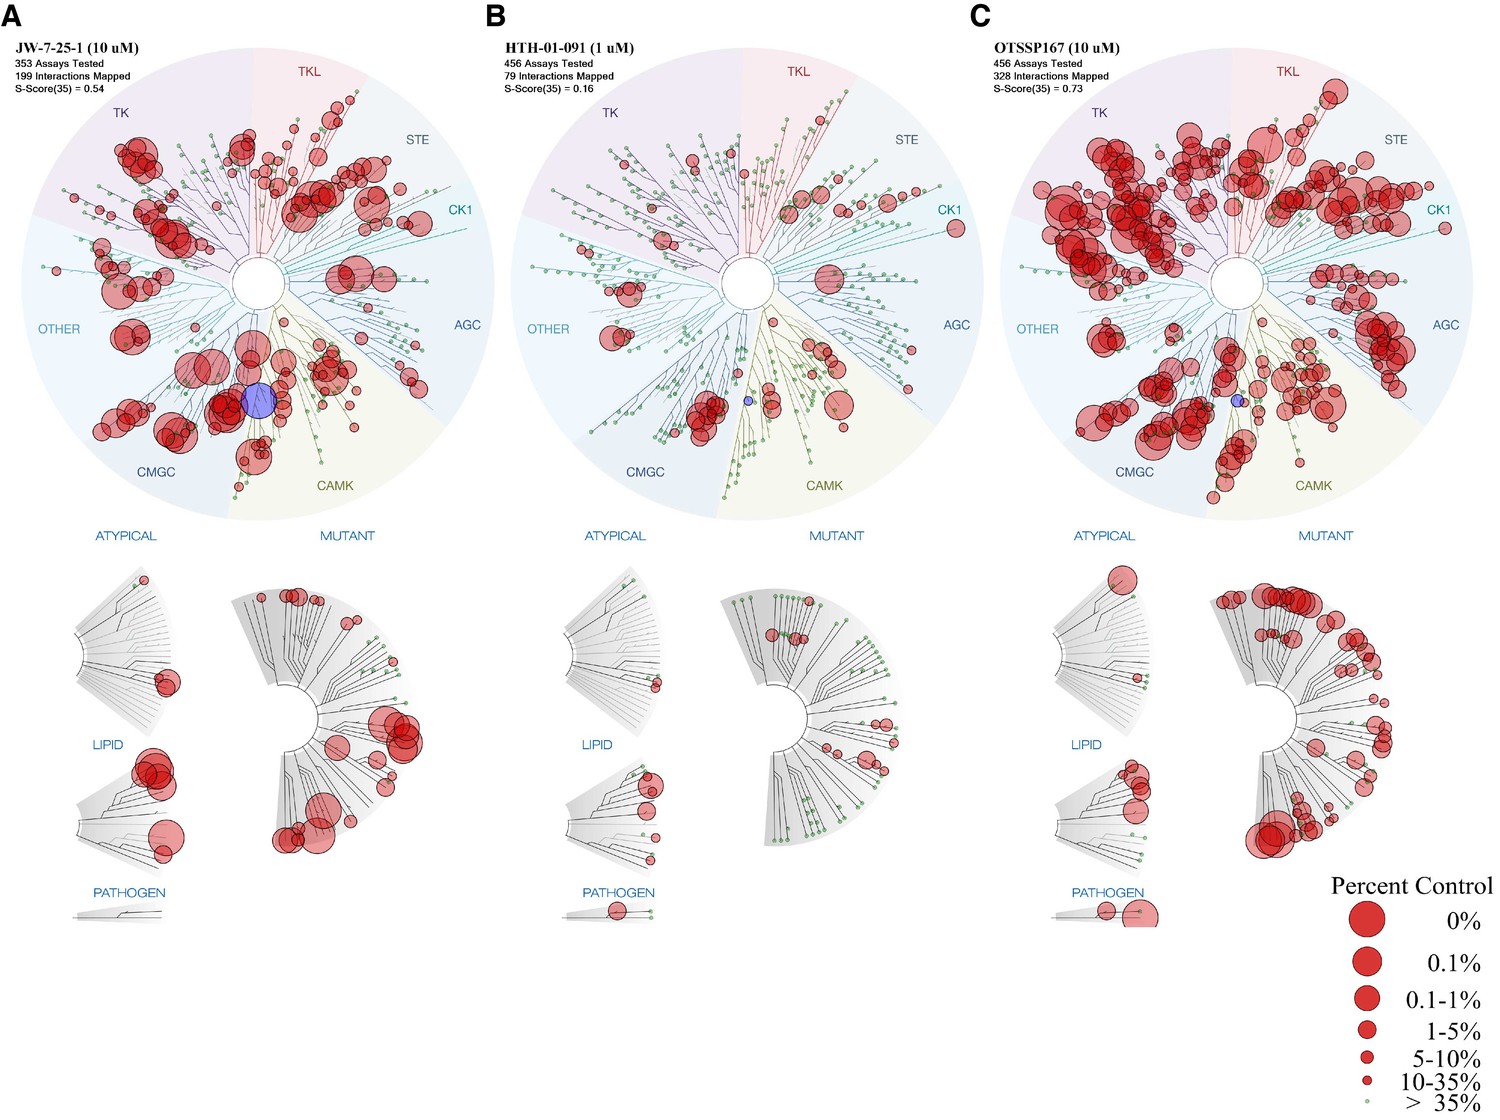
KINOMEscan TREEspot analysis of MELK inhibitors.
(A) Kinase profile of JW-7-25-1 at 10 μM (KINOMEscan, 353 kinases). (B) Kinase profile of HTH-01-091 at 1 μM (KINOMEscan, 456 kinases). (C) Kinase profile of OTSSP167 at 10 μM (KINOMEscan, 456 kinases). The circle that represents MELK is in blue while all other bound kinases are in red. The S(35) score indicates the percentage of kinases within the panel that demonstrate <35% retention on the solid support after inhibitor treatment.
Figure 2 with 1 supplement
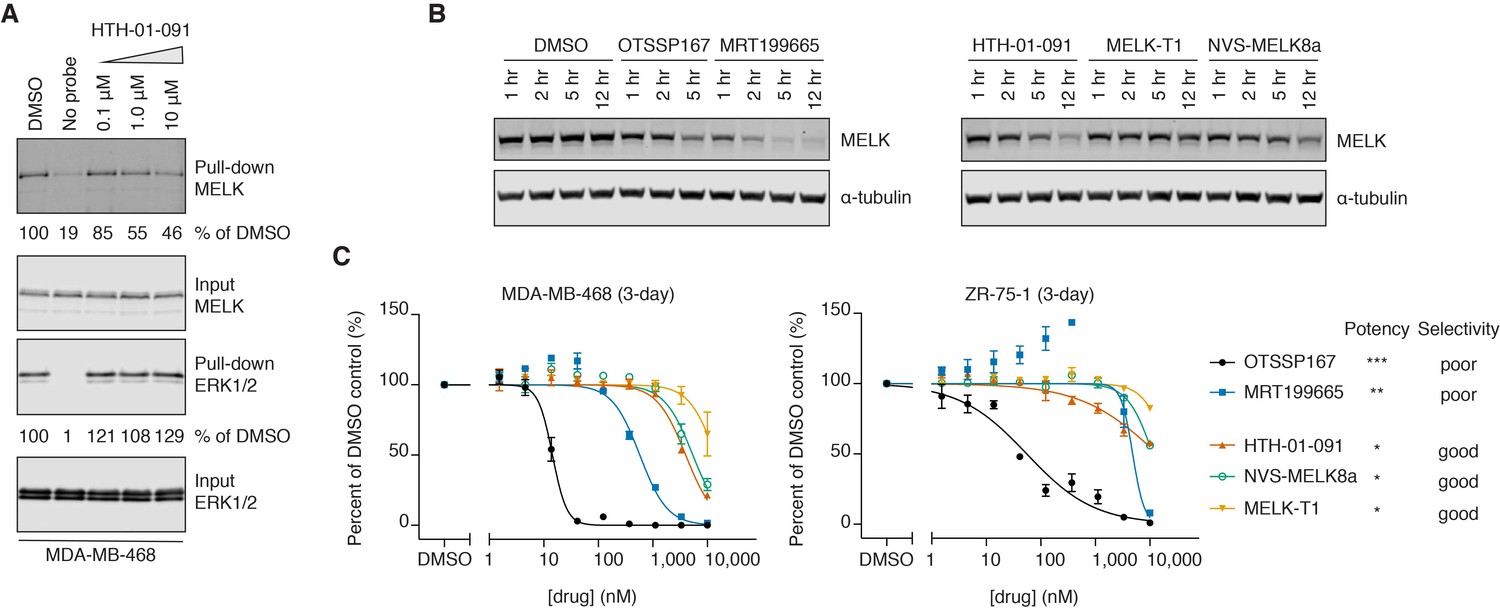
HTH-01-091 is cell permeable, causes MELK degradation, but demonstrates poor antiproliferative effects in basal-like breast cancer cell lines.
(A) Immunoblots analyzing the pull-down levels of MELK and ERK1/2 by ATP-biotin probes and streptavidin beads from MDA-MB-468 cells treated with different doses of HTH-01-091 and 10 mM MG132 for 1 hour. (B) Immunoblots for MELK and α-tubulin after treatment of MDA-MB-468 cells with 1 μM of OTSSP167, MRT199665 or 10 μM of HTH-01-091, MELK-T1 and NVS-MELK8a for specified amount of time. See also Figure 2—figure supplement 1 for rescue experiments using carfilzomib and MLN4924. (C) 3-day antiproliferation assays of HTH-01-091 and other MELK inhibitors tested in MDA-MB-468 (basal) and ZR-75-1 (luminal) cells. Values represent two independent experimental mean ±SD. Error bars shorter than the height of the symbol are not drawn. Potency (MELK): ***IC50 <1 nM, **IC50 <5 nM, *IC50 <20 nM, measured by Z’LYTE biochemical assay. See also Tables 3 and 4 for a summary of antiproliferative IC50 values in a panel of breast cancer cell lines at 3 and 7 days post treatment, respectively.
Figure 2—figure supplement 1
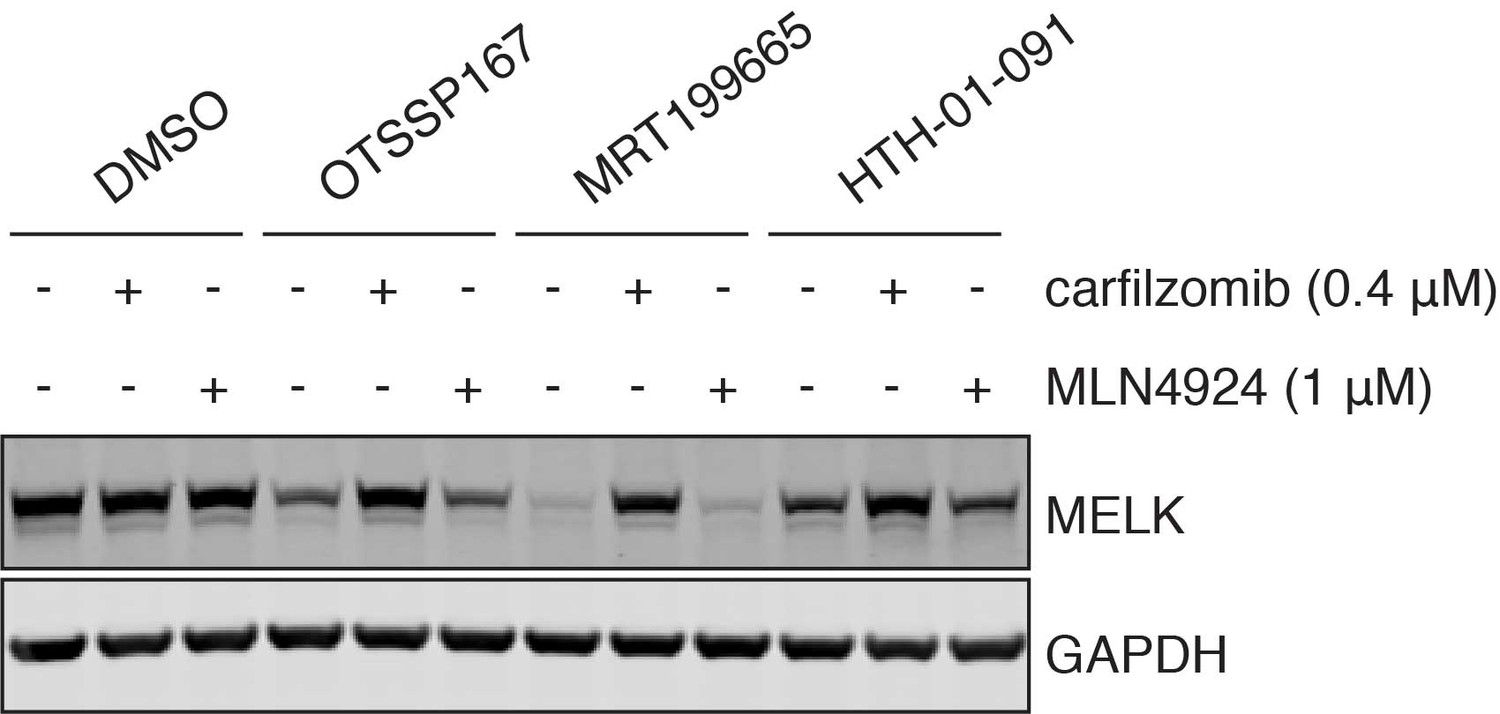
MELK inhibitor-induced MELK degradation is dependent on the proteosome, but not the cullin-RING ubiquitin ligase family.
Immunoblots for MELK and GAPDH after pretreatment of MDA-MB-468 cells with carfilzomib (400 nM) or MLN4924 (1 μM) for 4 hours, followed by treatment of 1 μM of OTSSP167, MRT199665 or 10 μM of HTH-01-091 for 4 hours.
Figure 3 with 2 supplements
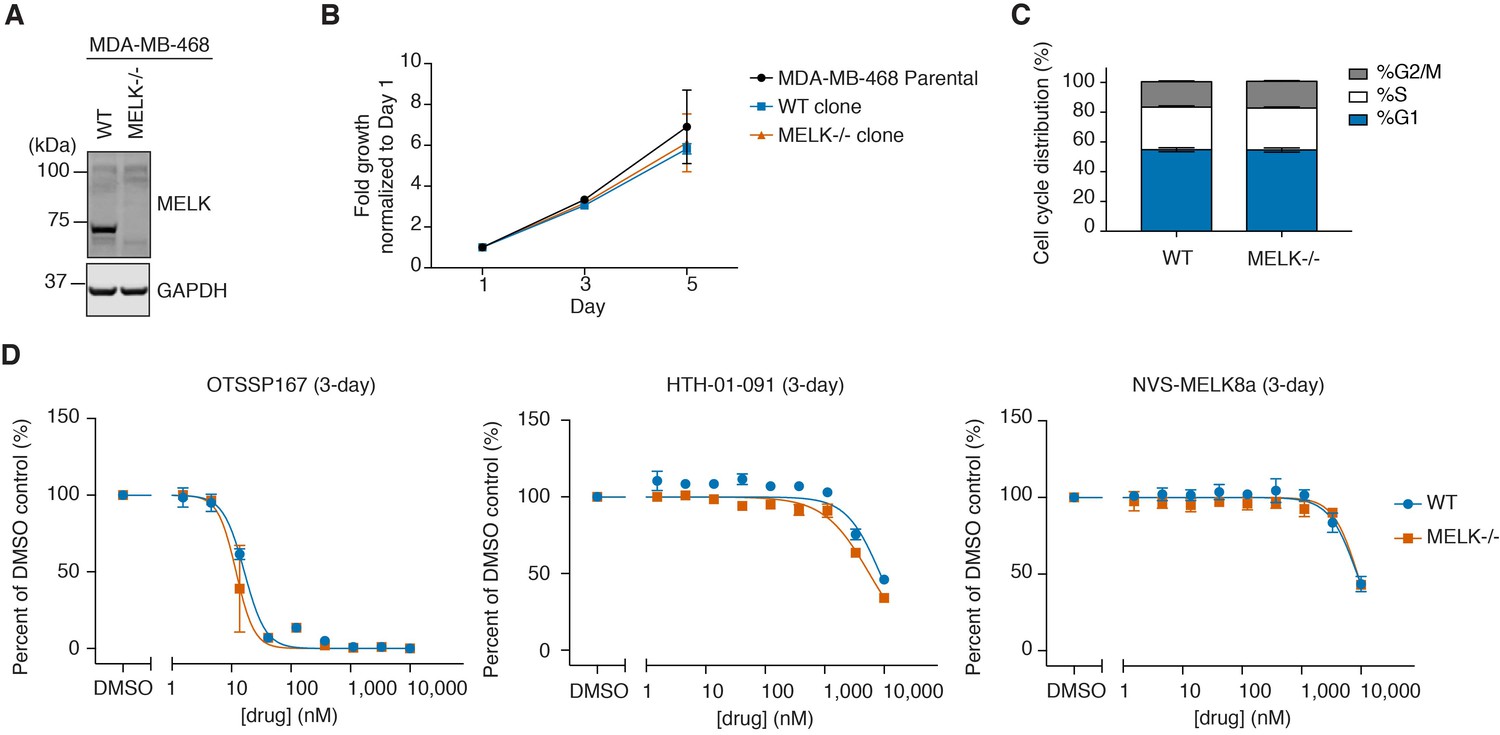
WT and MELK−/− MDA-MB-468 cells have similar growth rates, cell cycle distribution, and sensitivity to MELK inhibitors.
(A) Immunoblots for MELK and GAPDH in WT (clone E9) and MELK−/− (clone C7) clones isolated from MDA-MB-468 cells transfected with sgMELK-3 and Cas9. See also Figure 3—figure supplements 1 and 2, and Figure 3—source data 1 for the details of the generation of MELK−/− clones. (B) 5-day proliferation curves comparing the growth rates of parental, WT, and MELK−/− MDA-MB-468 cells. Values represent two independent experimental mean ±SD. (C) Cell cycle analysis comparing WT and MELK−/− MDA-MB-468 cells. Values represent triplicate mean ±SD. (D) 3-day proliferation assays comparing the sensitivity of WT and MELK−/− MDA-MB-468 cells to OTSSP167, HTH-01-091 and NVS-MELK8a. Values represent duplicate mean ±SD. Error bars shorter than the height of the symbol are not drawn.
-
Figure 3—source data 1
Genotype analysis of single cell clones selected from MDA-MB-468 cells transfected with Cas9/sgMELK-3.
- https://doi.org/10.7554/eLife.26693.014
Figure 3—figure supplement 1
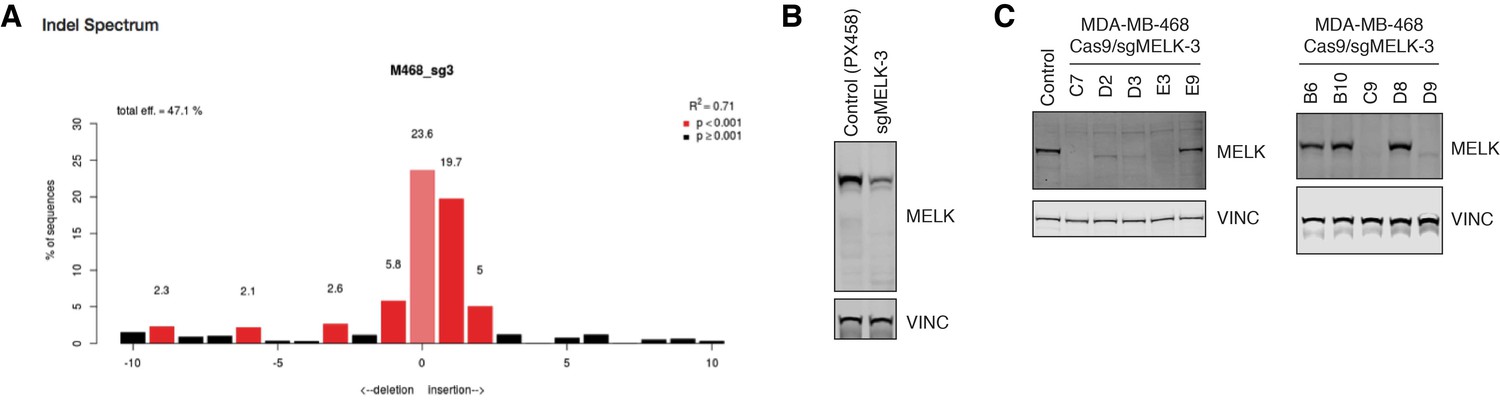
CRISPR/Cas9-mediated knockout of MELK in MDA-MB-468 cells.
(A) Tracking of Indels by Decomposition (TIDE) analysis (Brinkman et al., 2014) of MDA-MB-468 cells transfected with Cas9/sgMELK-3 and enriched by the transfection marker OFP. (B) Immunoblots for MELK and VINC in MDA-MB-468 cells transfected with PX458 or Cas9/sgMELK-3 and enriched by the transfection marker GFP or OFP, respectively. (C) Immunoblots for MELK and VINC in ten MDA-MB-468 clones selected from MDA-MB-468 cells transfected with Cas9/sgMELK-3. Clone E9 is the WT clone, and clone C7 is the MELK−/− clone shown in Figure 3. For the genotyping results, see also Figure 3—source data 1.
Figure 3—figure supplement 2
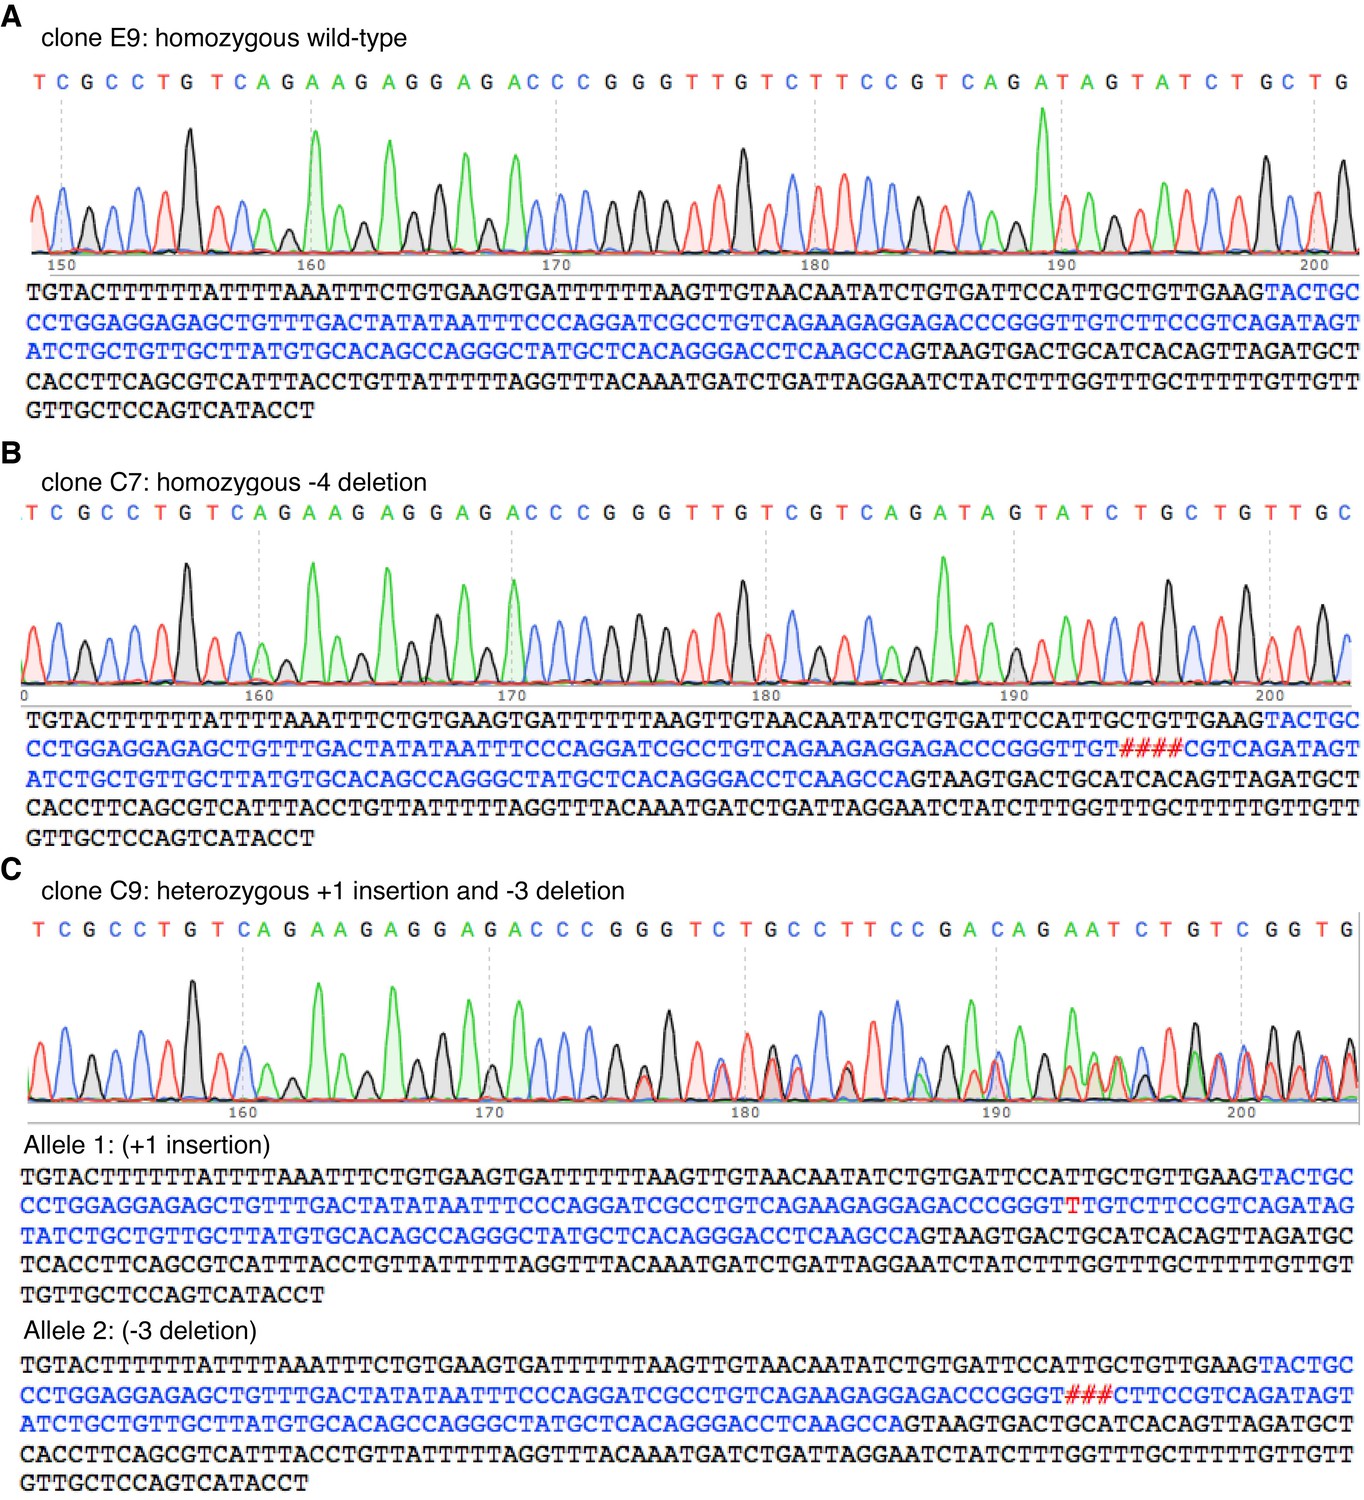
Genotype analysis of cell clones selected from MDA-MB-468 cells transfected with Cas9/sgMELK-3.
Trace images of the sequence around exon 5 of MELK and the actual sequences of the PCR amplicons from three clones isolated from MDA-MB-468 cells transfected with Cas9/sgMELK-3, including clone (A) E9, (B) C7 and (C) C9.
Figure 4 with 3 supplements
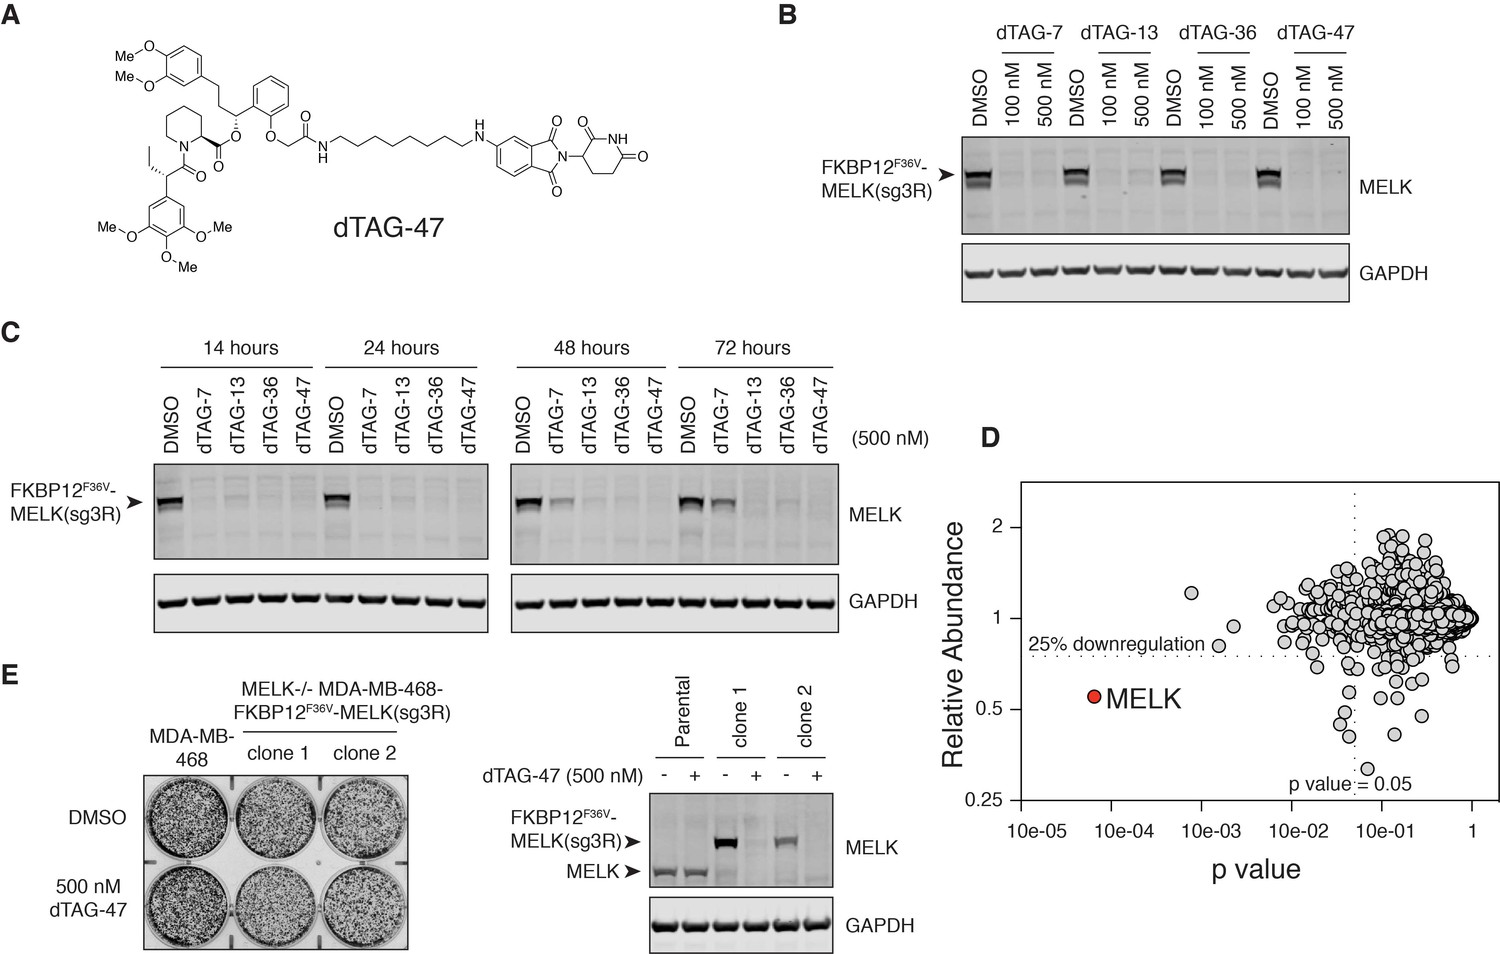
MELK−/− MDA-MB-468-FKBP12F36V-MELK(sg3R) cells grow normally in response to pharmacologically induced FKBP12F36V-MELK degradation.
(A) Chemical structure of heterobifunctional dTAG molecule dTAG-47. See also Figure 4—figure supplement 3 for the chemical structures of dTAG-7, dTAG-13 and dTAG-36. (B) Immunoblots for MELK and GAPDH after treatment of dTAG-7, 13, 36, and 47 at indicated concentrations in MELK−/− MDA-MB-468-FKBP12F36V-MELK(sg3R) cells for 4 hours. See Figure 4—figure supplement 1 for details of the generation of MELK−/− MDA-MB-468-FKBP12F36V-MELK(sg3R) clones. (C) Same as in 4B, but with treatment at 500 nM and extended treatment times for 14, 24, 48, and 72 hours. (D) Changes in abundance of 7270 proteins (peptide count ≥2) comparing MELK−/− MDA-MB-468-FKBP12F36V-MELK cells treated with dTAG-7 (250 nM) or DMSO for 1 hour, versus p-value (dTAG-7: triplicate, DMSO: duplicate, limma moderated t-test). See also Figure 4—source datas 1 and 2 for the original and the processed data. (E) Crystal violet staining image showing parental MDA-MB-468 cells and MELK−/− MDA-MB-468-FKBP12F36V-MELK(sg3R) cells after treatment with DMSO or 500 nM of dTAG-47 for 9 days. Immunoblots showing MELK and GAPDH from a duplicate plate on Day 9 confirmed sustained depletion of FKBP12F36V-MELK(sg3R). These are representative data from one of two independent experiments.
-
Figure 4—source data 1
Raw integrated ion intensities from quantitative multiplexed proteomics.
- https://doi.org/10.7554/eLife.26693.019
-
Figure 4—source data 2
Processed Data and Statistical Analysis by limma (topTable).
- https://doi.org/10.7554/eLife.26693.020
Figure 4—figure supplement 1
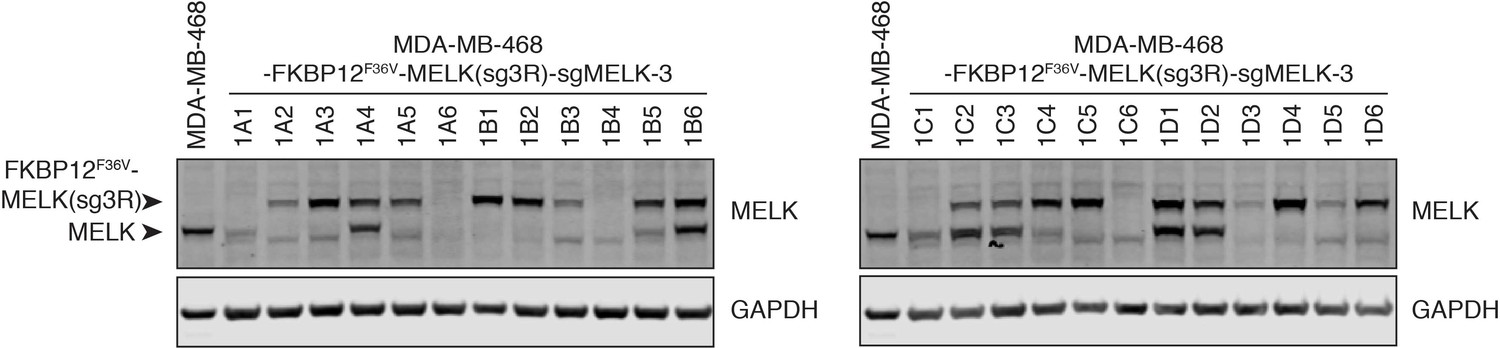
Single clones selected from MDA-MB-468-FKBP12F36V-MELK(sg3R) cells subject to CRISPR/Cas9-mediated knockout of endogenous MELK.
Immunoblots for MELK and GAPDH in single cell clones selected from MDA-MB-468-FKBP12F36V-MELK(sg3R) transfected with Cas9/sgMELK-3 to knockout endogenous MELK. Clone 1D4 is clone 1 and clone 1A3 is clone 2 in Figure 4. Clone 1D4 was confirmed with heterozygous −1 and +1 indels; clone 1A3 was confirmed with homozygous −1 deletions.
Figure 4—figure supplement 2
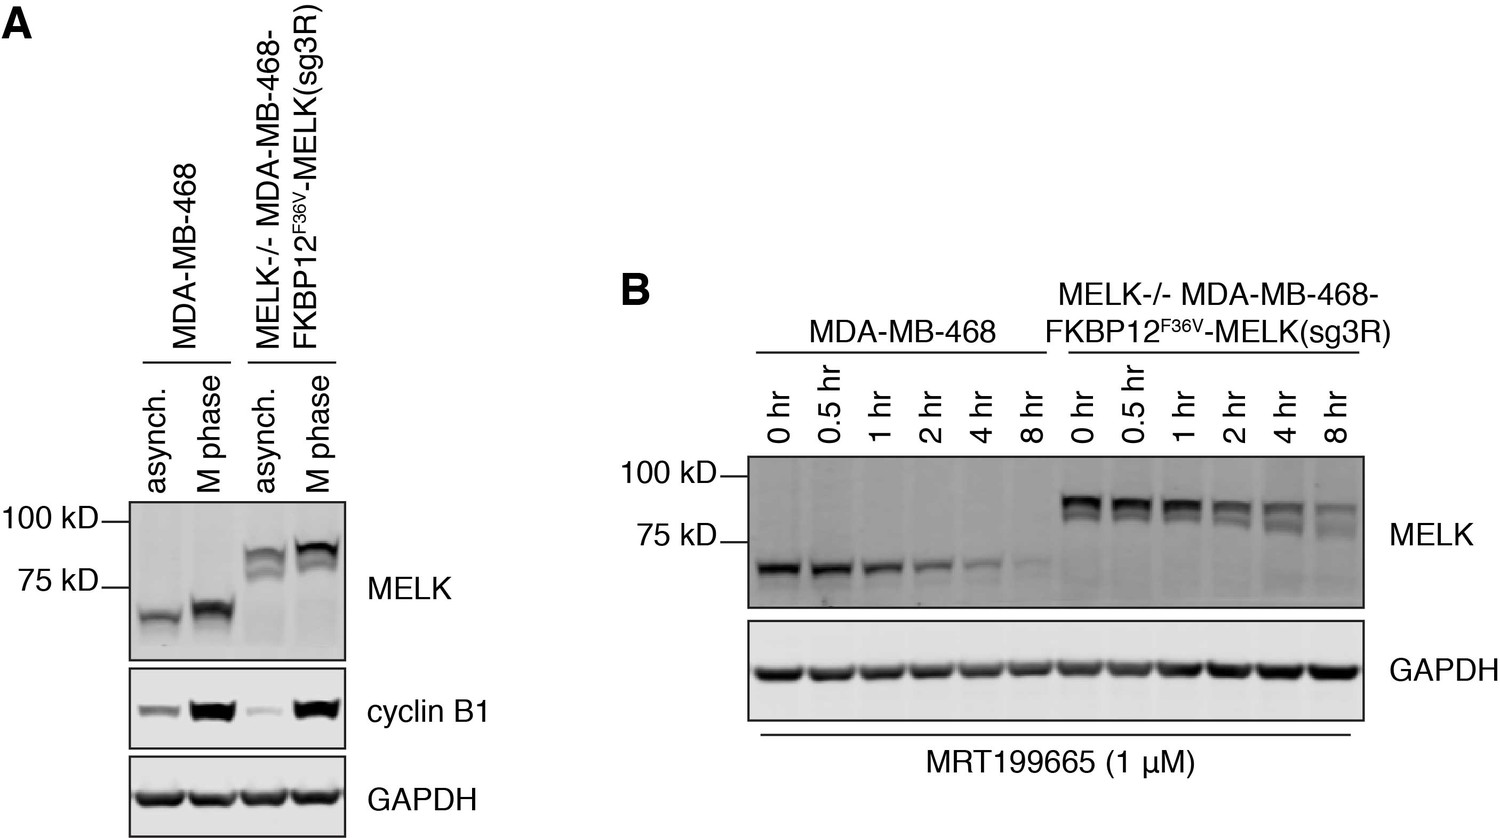
FKBP12F36V-MELK(sg3R) recapitulates two phenotypes of endogenous MELK to suggest preserved functions.
(A) Immunoblots for MELK, cyclin B1 and GAPDH in asynchronous versus M-phase arrested MDA-MB-468 cells and MDA-MB-468-FKBP12F36V-MELK(sg3R) cells (clone 1). (B) Immunoblots for MELK and GAPDH in MDA-MB-468 cells and MDA-MB-468-FKBP12F36V-MELK(sg3R) cells (clone 1) treated with MRT199665 (1 μM) for the indicated amount of time.
Figure 4—figure supplement 3
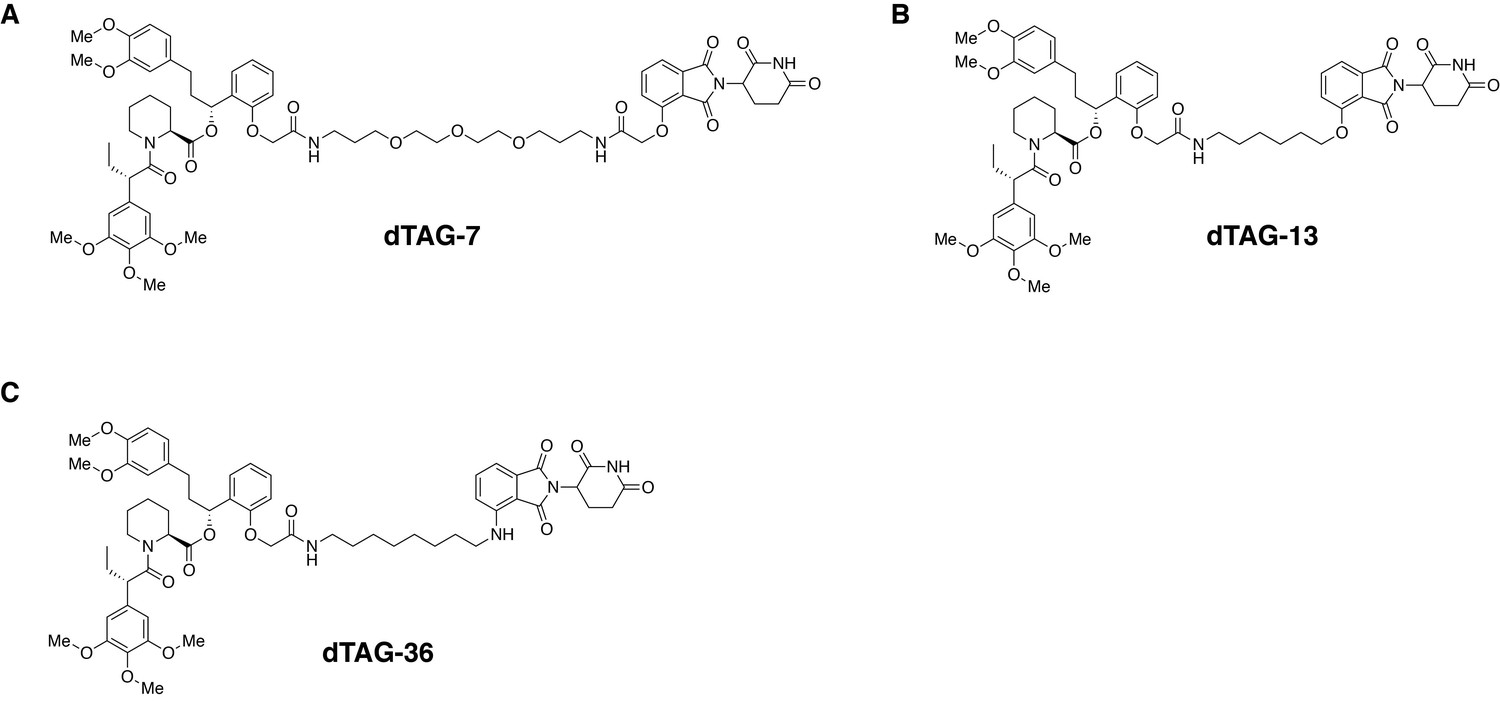
Chemical structures of dTAG molecules.
FKBP12F36V-binding ligands conjugated by variable linkers to thalidomide or pomalidomide, including (A) dTAG-7, (B) dTAG-13 and (C) dTAG-36 are capable of inducing degradation of FKBP12F36V-tagged proteins of interest.
Figure 5 with 2 supplements
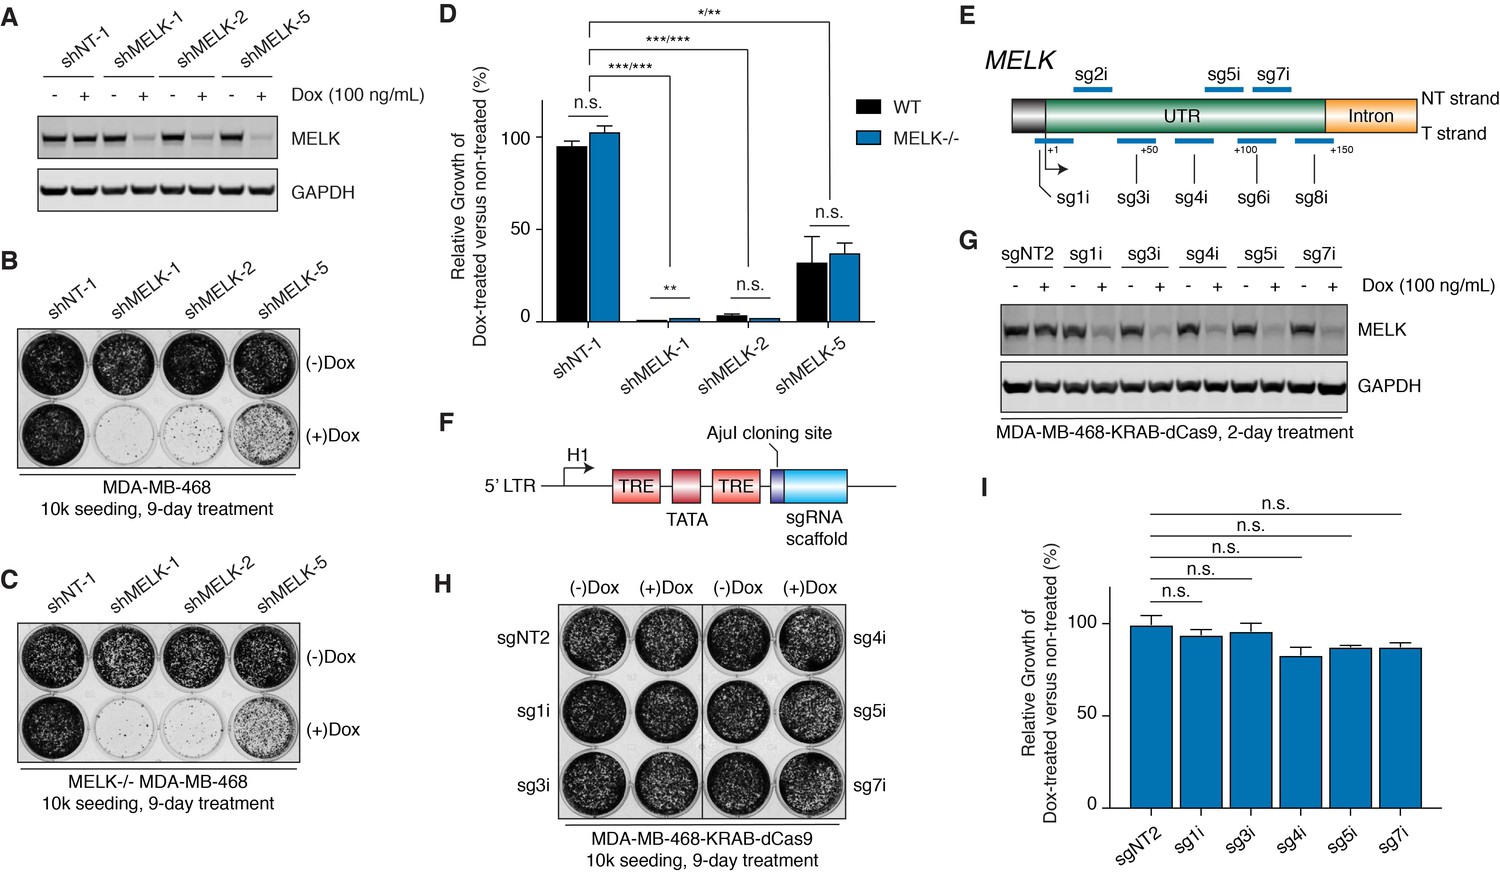
MELK-targeting shRNAs may induce antiproliferation of MDA-MB-468 cells through off-target activities while CRISPRi-mediated MELK knockdown does not affect proliferation.
(A) Immunoblots for MELK and GAPDH after 2-day treatment with or without doxycycline (100 ng/mL) in MDA-MB-468 cells transduced with doxycycline-inducible shRNA constructs. NT-1 represents a non-targeting control. Hairpins shMELK-1, 2, and 5 target three different regions within MELK’s coding region and 3’-UTR. See also Figure 5—figure supplement 1. (B) A crystal violet staining image of MDA-MB-468 cells transduced with doxycycline-inducible shRNA constructs after treatment with or without doxycycline (100 ng/mL) for 9 days with an initial seeding of 10,000 cells in a 12-well plate. (C) A crystal violet staining image of MELK−/− MDA-MB-468 cells (clone C7) transduced with doxycycline-inducible shRNA constructs after treatment with or without doxycycline (100 ng/mL) for 9 days with an initial seeding of 10,000 cells in a 12-well plate. See also Figure 5—figure supplement 1E. (D) A bar graph quantifying the intensity of crystal violet staining of cells treated as described in B and C. Values from the doxycycline treated groups are normalized to the untreated. Values represent mean ±SD from two independent experiments (*p≤0.05; **p≤0.01; ***p≤0.001, two-tailed Student’s t-Test). (E) A scheme that depicts the guide sequences that target the transcription start site of MELK and were tested in our study. See also Figure 5—figure supplement 2A. (F) An H1-based doxycycline-inducible sgRNA construct was modified from tet-pLKO-puro, which constitutively coexpresses tetR (tet repressor protein). TRE, tet response element. (G) Immunoblots for MELK and GAPDH after 2-day treatment with or without doxycycline (100 ng/mL) in MDA-MB-468-KRAB-dCas9 cells transduced with doxycycline-inducible sgRNA constructs. See also Figure 5—figure supplement 2B. (H) A crystal violet staining image of MDA-MB-468-KRAB-dCas9 cells transduced with doxycycline-inducible sgRNA constructs after treatment with or without doxycycline (100 ng/mL) for 9 days with an initial seeding of 10,000 cells in a 12-well plate. See also Figure 5—figure supplement 2C. (I) A bar graph quantifying the intensity of crystal violet staining of cells treated as described in H. Values from the doxycycline treated groups are normalized to the untreated. Values represent mean ±SD from two independent experiments (for n.s., p>0.05, two-tailed Student’s t-Test).
Figure 5—figure supplement 1
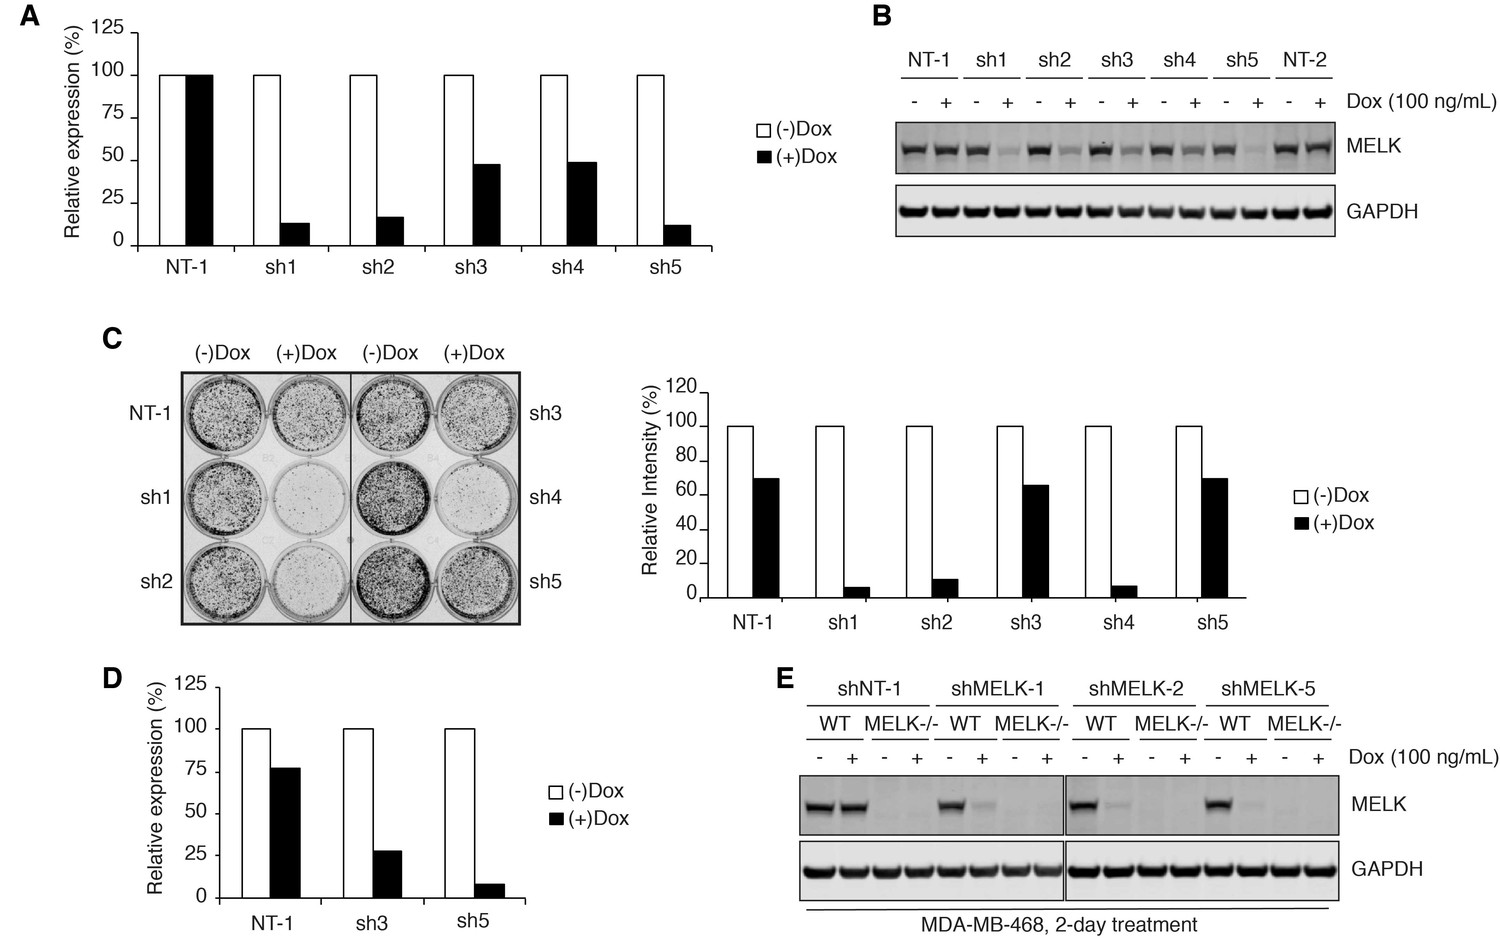
Validating MELK-targeting short hairpins.
(A) Relative expression of MELK mRNA levels quantified by RT-qPCR in MDA-MB-468 cells after 2-day doxycycline-induced (100 ng/mL) shRNA expression. Values represent triplicate means from a single experiment. NT-1 is a non-targeting control. Hairpins shMELK-1, 2, 3, 4, and 5 (abbreviated as sh1, 2, 3, 4, and 5) target five different regions within the coding region and 3’-UTR of MELK. (B) Immunoblots for MELK and GAPDH after 2-day treatment with or without doxycycline (100 ng/mL) in MDA-MB-468 cells transduced with doxycycline-inducible shRNAs. NT-1 and NT-2 represent two non-targeting controls. (C) Crystal violet staining image of MDA-MB-468 cells transduced with doxycycline-inducible shRNA constructs after treatment with or without doxycycline (100 ng/mL) for 8 days. The bar graph represents quantification of the staining intensities in the doxycycline treated groups relative to the untreated groups. Values came from a single experiment. (D) Relative expression of MELK mRNA levels quantified by RT-qPCR in MDA-MB-468 cells after 8-day doxycycline-induced (100 ng/mL) shRNA expression. After 8-day induced expression of shMELK-1, 2 or 4, MDA-MB-468 cells were mostly dead and no data are shown. Values represent triplicate means from a single experiment. (E) Immunoblots for MELK and GAPDH after 2-day treatment with or without doxycycline (100 ng/mL) in WT and MELK−/− MDA-MB-468 cells transduced with doxycycline-inducible shRNAs.
Figure 5—figure supplement 2
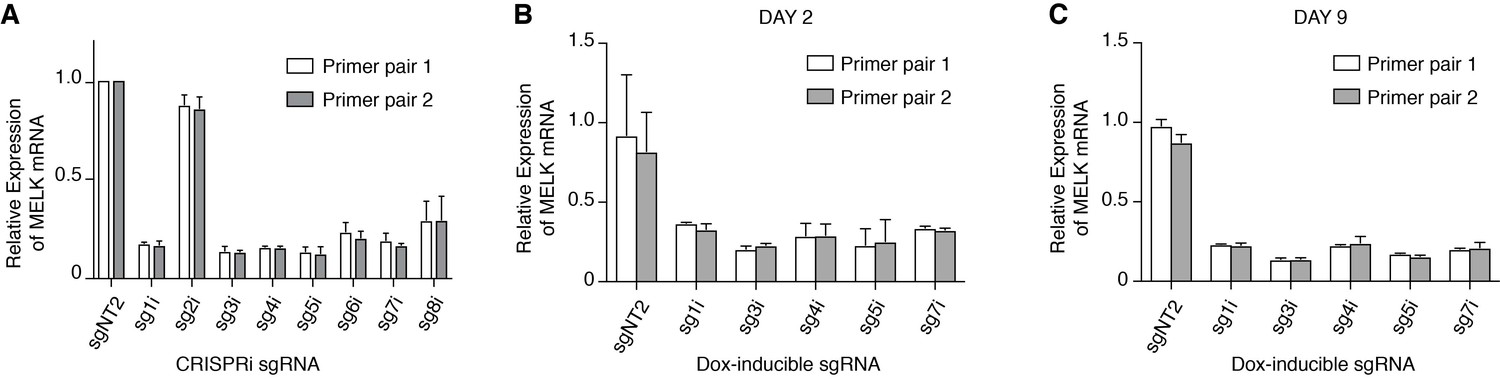
Validating MELK knockdown mediated by CRISPR interference.
(A) Relative expression of MELK mRNA levels quantified by RT-qPCR in MDA-MB-468 cells stably expressing KRAB-dCas9 and MELK transcription start site-targeting sgRNAs. Values represent duplicate means from two independent experiments. Short-guide RNA sgNT2 is a non-targeting control that targets EGFP. Primer pair 1 and 2 for RT-qPCR are listed in Supplementary file 2. (B) Relative expression of MELK mRNA levels quantified by RT-qPCR in MDA-MB-468-KRAB-dCas9 cells after 2-day doxycycline-induced (100 ng/mL) sgRNA expression. Values represent duplicate means from two independent experiments. (C) Relative expression of MELK mRNA levels quantified by RT-qPCR in MDA-MB-468-KRAB-dCas9 cells after 9-day doxycycline-induced (100 ng/mL) sgRNA expression. Values represent duplicate means from two independent experiments.
Chemical structure 1
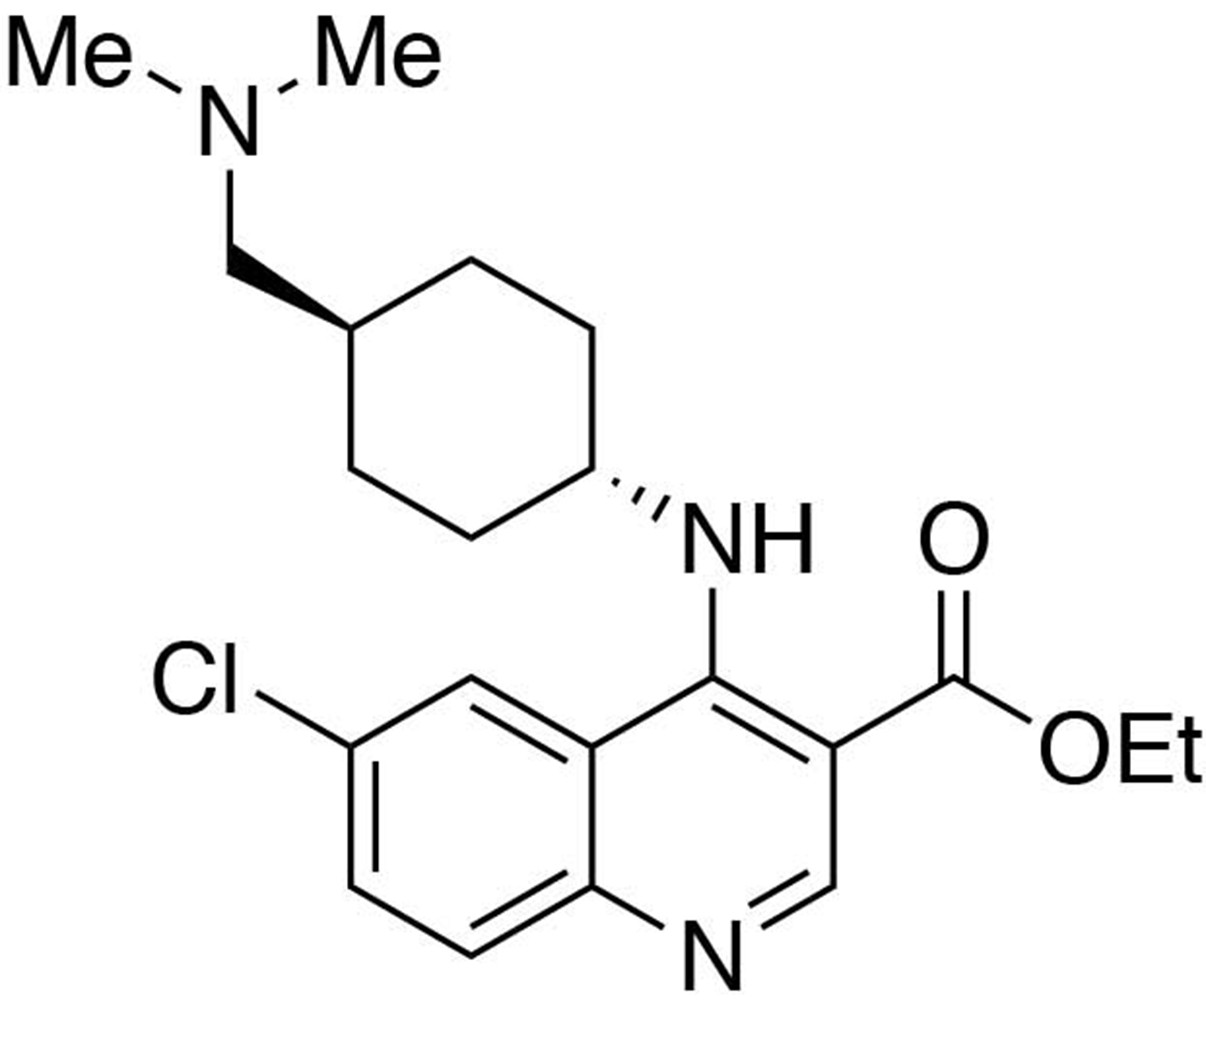
Ethyl 6-chloro-4-((trans-4-((dimethylamino)methyl)cyclohexyl)amino)quinoline-3-carboxylate.
https://doi.org/10.7554/eLife.26693.024
Chemical structure 2
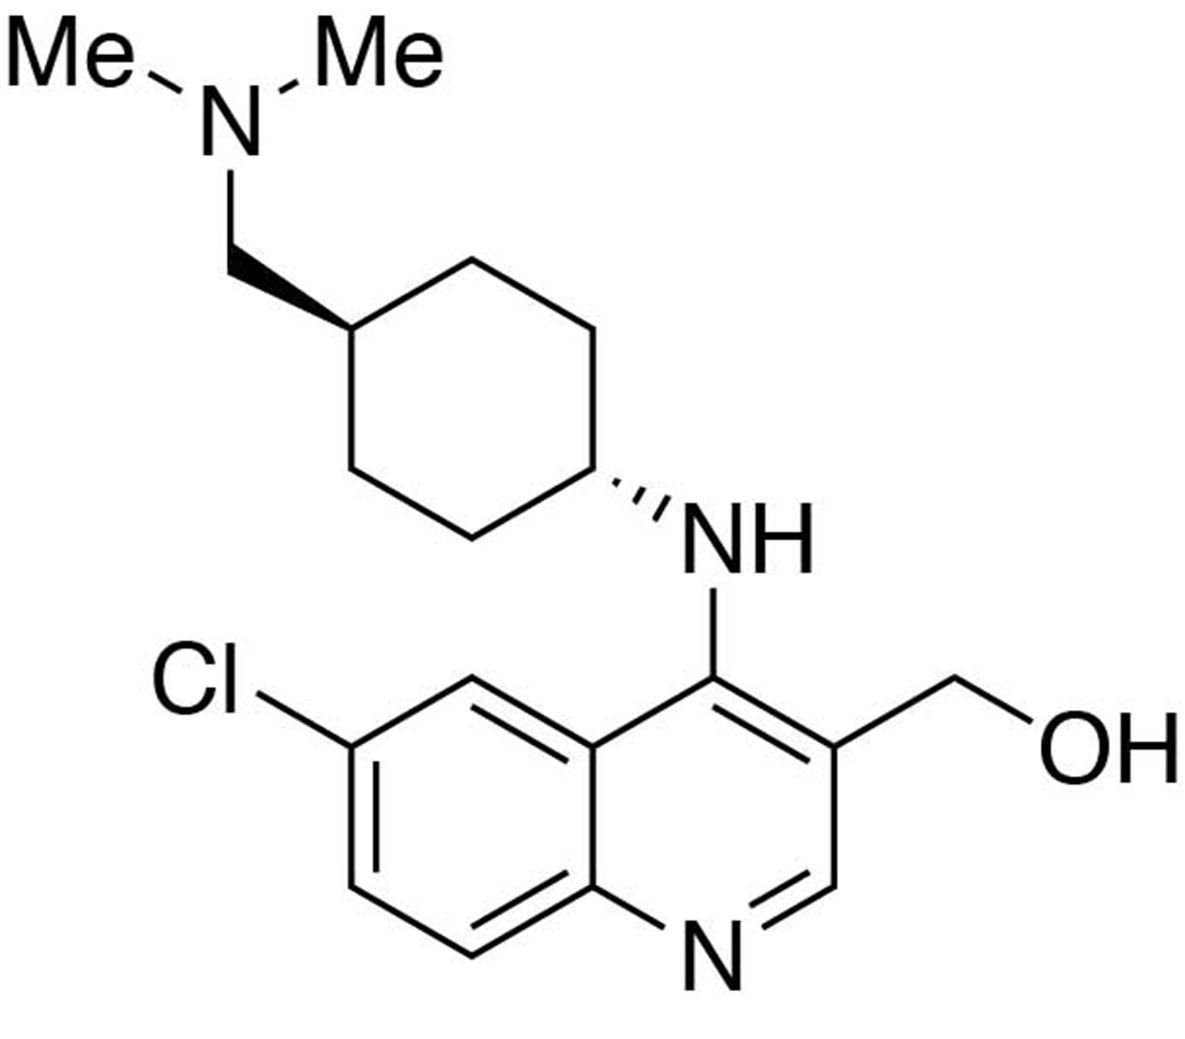
Preparation of (6-chloro-4-((trans-4-((dimethylamino)methyl)cyclohexyl)amino)quinolin-3-yl)methanol.
https://doi.org/10.7554/eLife.26693.025
Chemical structure 3
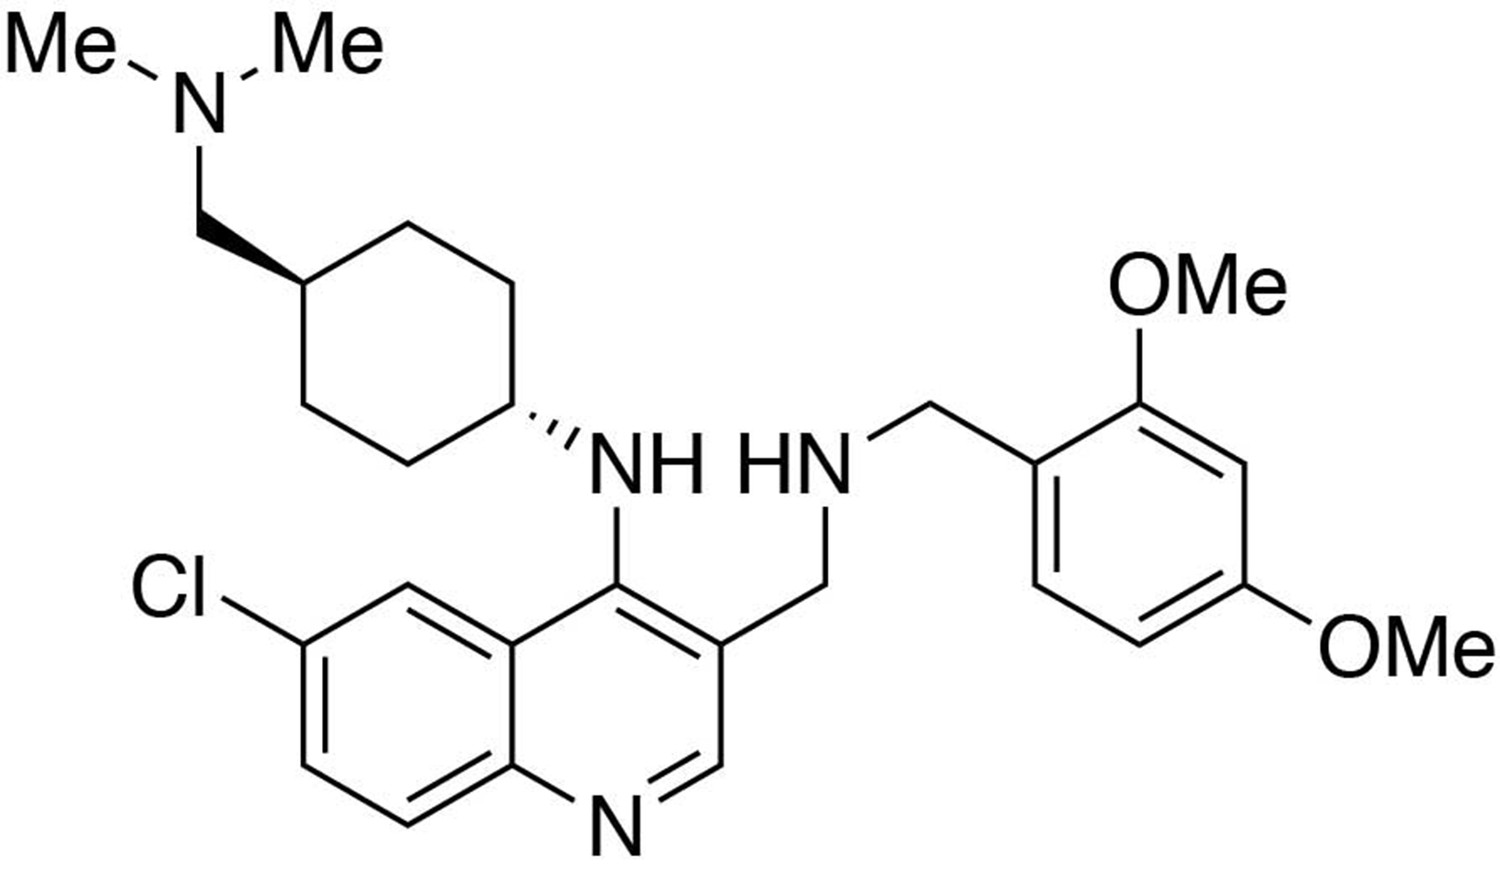
6-chloro-3-(((2,4-dimethoxybenzyl)amino)methyl)-N-(trans-4-((dimethylamino)methyl)cyclohexyl)quinolin-4-amine.
https://doi.org/10.7554/eLife.26693.026
Chemical structure 4
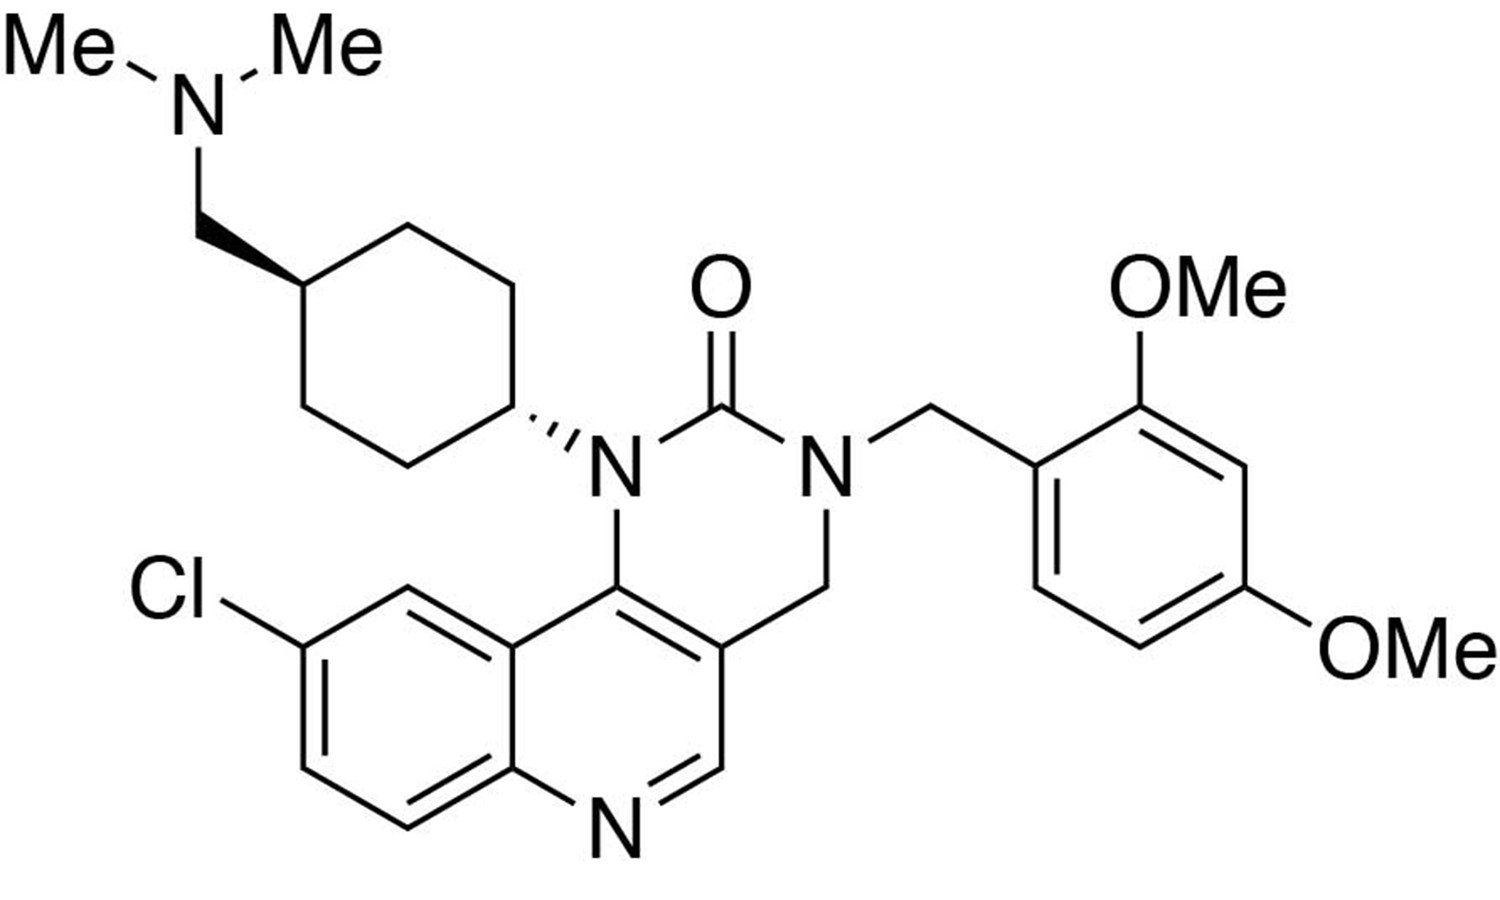
Preparation of 9-chloro-3-(2,4-dimethoxybenzyl)−1-(trans-4-((dimethylamino)methyl)cyclohexyl)−3,4-dihydropyrimido[5,4 c]quinolin-2(1H)-one.
https://doi.org/10.7554/eLife.26693.027
Chemical structure 5
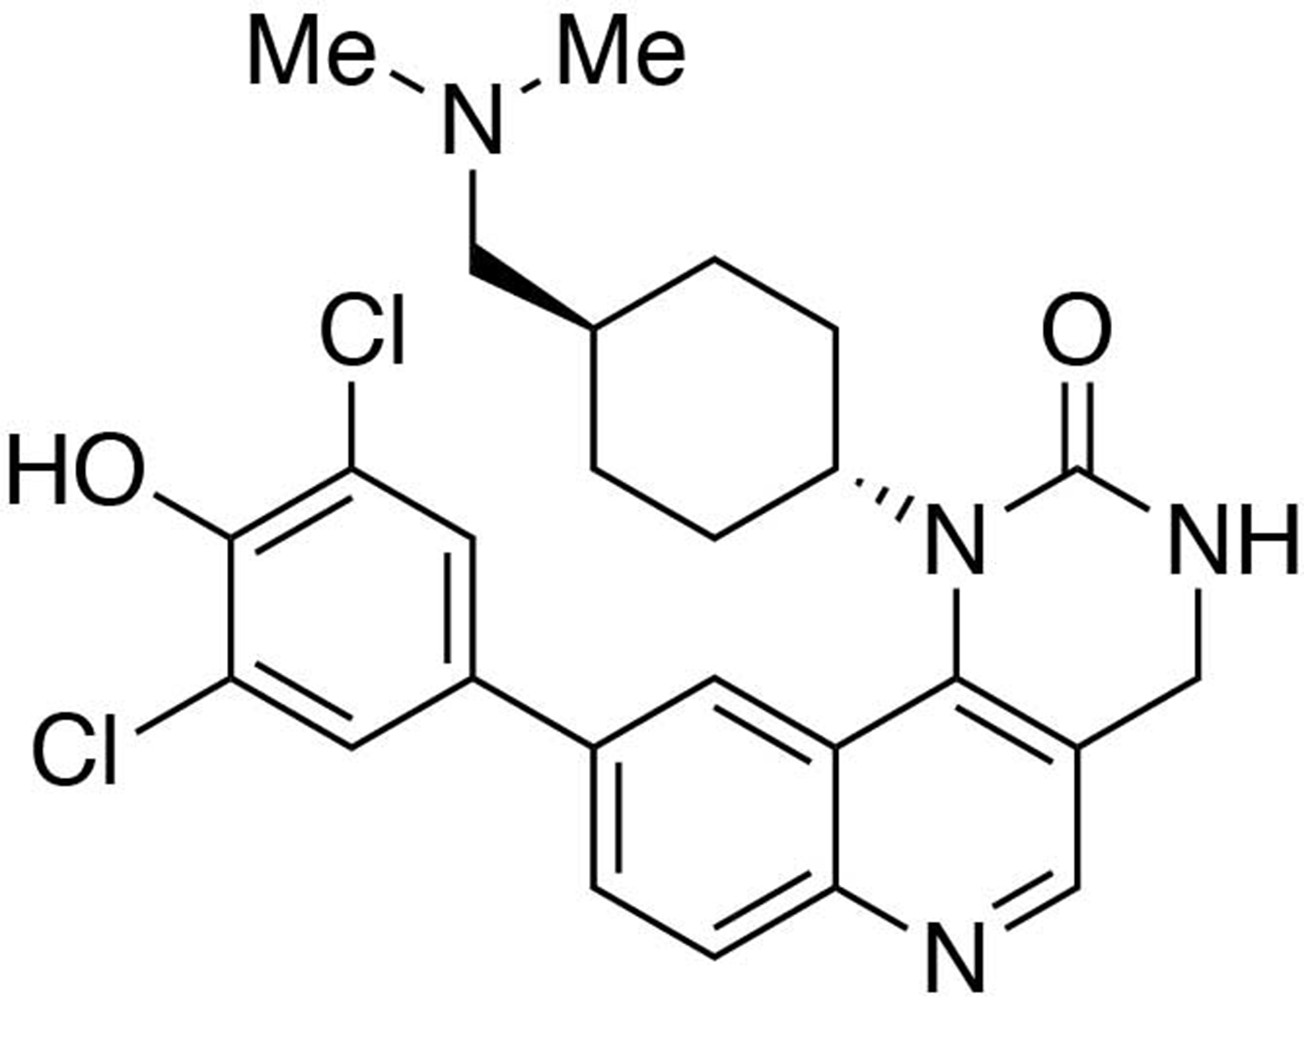
Preparation of 9-(3,5-dichloro-4-hydroxyphenyl)−1-(trans-4-((dimethylamino)methyl)cyclohexyl)−3,4-dihydropyrimido[5,4 c]quinolin-2(1H)-one (HTH-01-091).
https://doi.org/10.7554/eLife.26693.028
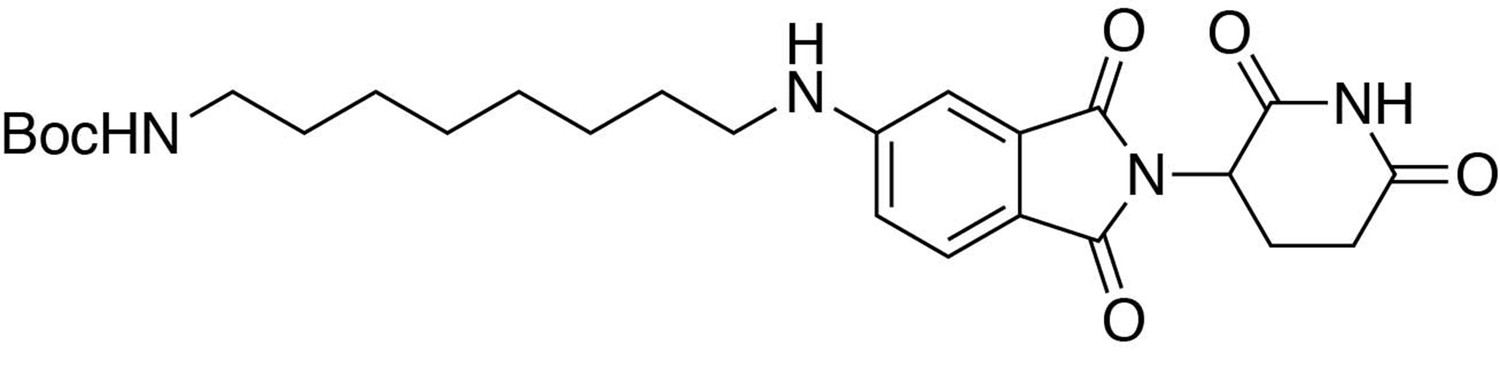
Chemical structure 6

tert-butyl (8-((2-(2,6-dioxopiperidin-3-yl)−1,3-dioxoisoindolin-4-yl)amino)octyl)carbamate.
https://doi.org/10.7554/eLife.26693.029
Chemical structure 7
4-((8-aminooctyl)amino)−2-(2,6-dioxopiperidin-3-yl)isoindoline-1,3-dione.
https://doi.org/10.7554/eLife.26693.030
Chemical structure 8
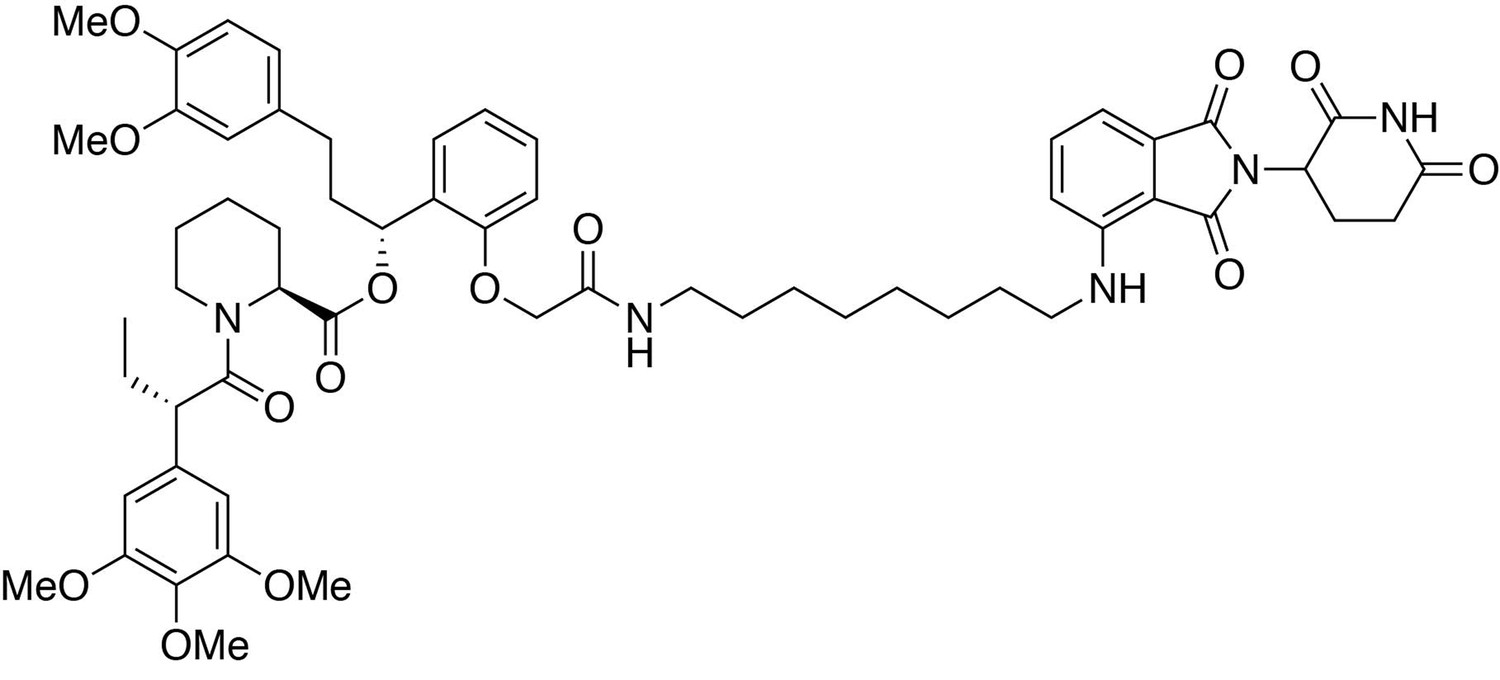
(2S)-(1R)−3-(3,4-dimethoxyphenyl)−1-(2-(2-((8-((2-(2,6-dioxopiperidin-3-yl)−1,3-dioxoisoindolin-4-yl)amino)octyl)amino)−2-oxoethoxy)phenyl)propyl 1-((S)−2-(3,4,5-trimethoxyphenyl)butanoyl)piperidine-2-carboxylate (dTAG-36).
https://doi.org/10.7554/eLife.26693.031
Chemical structure 9
tert-butyl (8-((2-(2,6-dioxopiperidin-3-yl)−1,3-dioxoisoindolin-5-yl)amino)octyl)carbamate.
https://doi.org/10.7554/eLife.26693.032
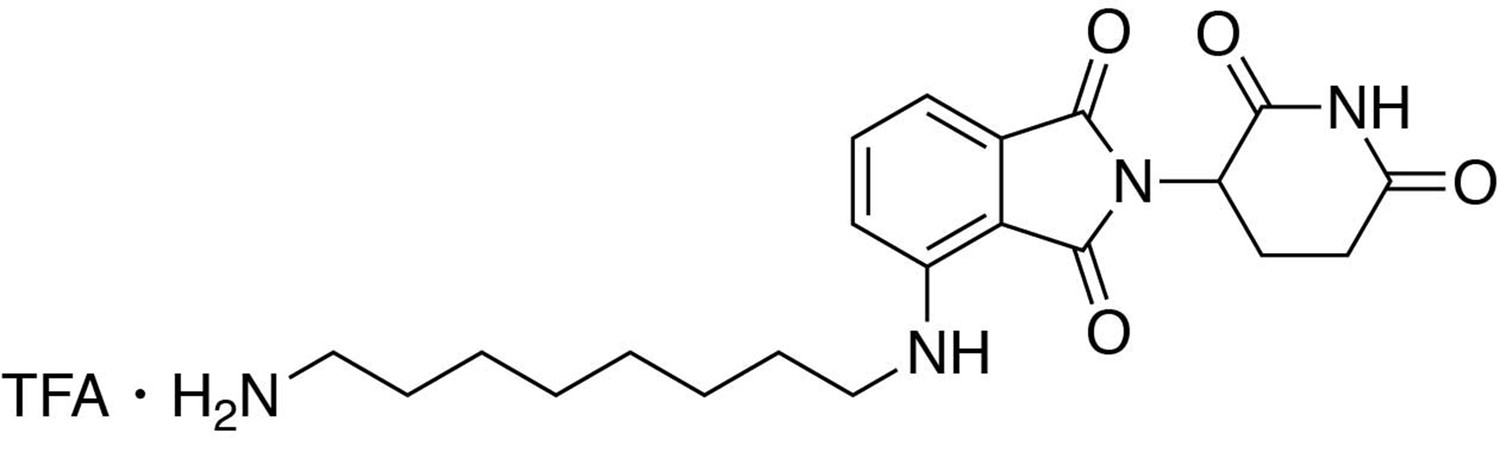
Chemical structure 10
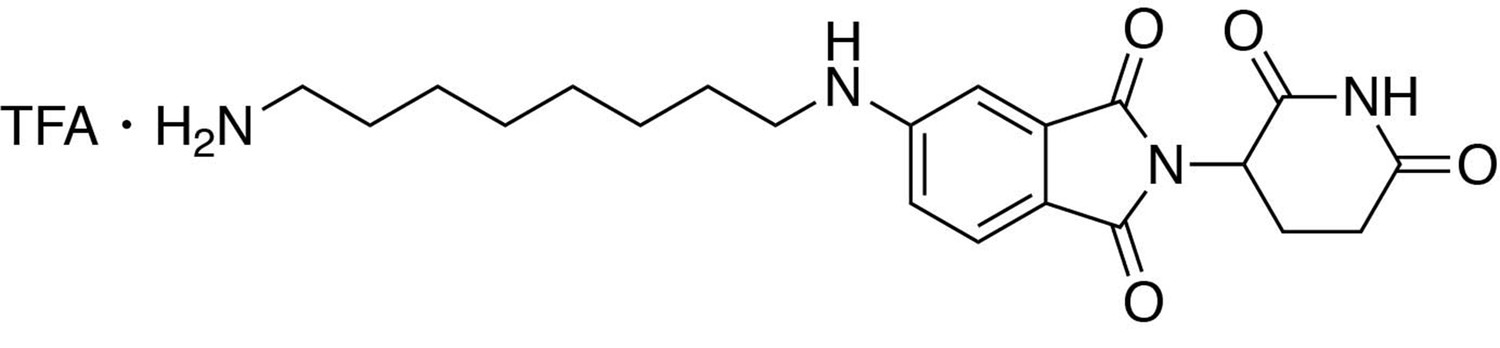
5-((8-aminooctyl)amino)−2-(2,6-dioxopiperidin-3-yl)isoindoline-1,3-dione trifluoroacetate.
https://doi.org/10.7554/eLife.26693.033
Chemical structure 11
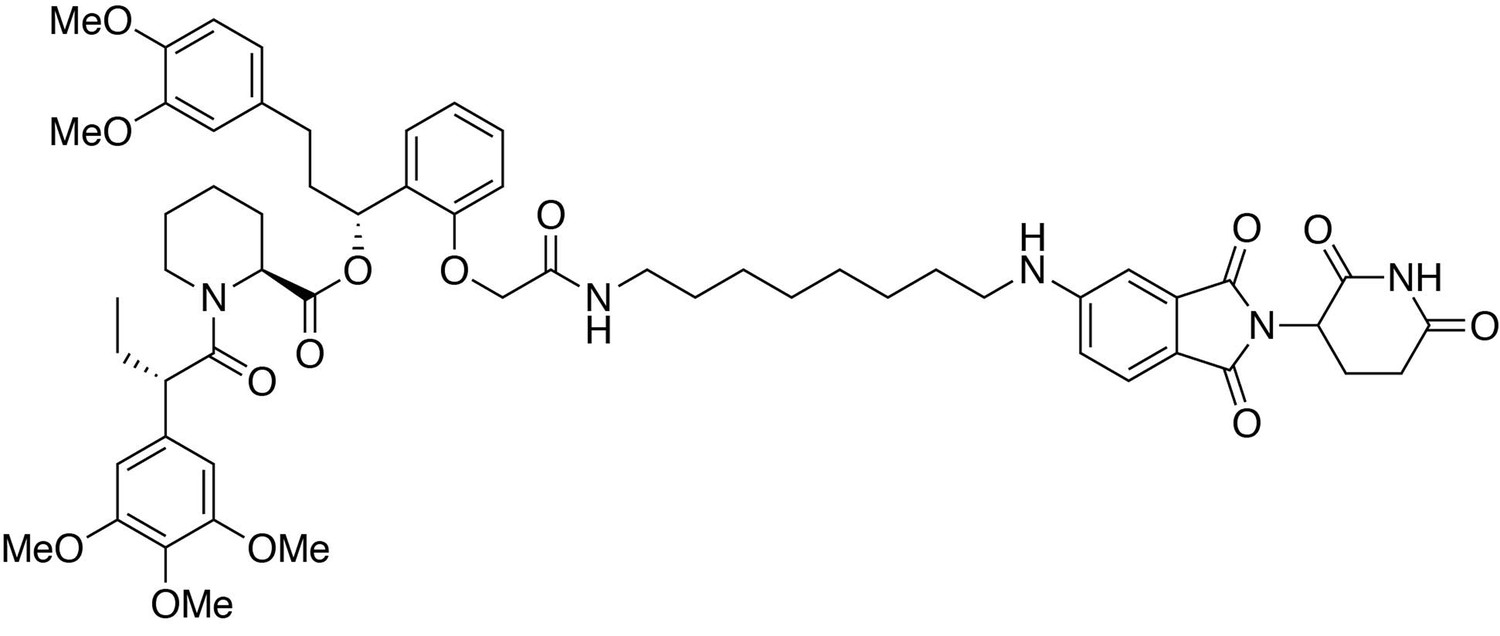
(2S)-(1R)−3-(3,4-dimethoxyphenyl)−1-(2-(2-((8-((2-(2,6-dioxopiperidin-3-yl)−1,3-dioxoisoindolin-5-yl)amino)octyl)amino)−2-oxoethoxy)phenyl)propyl 1-((S)−2-(3,4,5-trimethoxyphenyl)butanoyl)piperidine-2-carboxylate (dTAG-47).
https://doi.org/10.7554/eLife.26693.034Tables
Table 1
Biochemical IC50 values of MELK inhibitors.
https://doi.org/10.7554/eLife.26693.005| Biochemical IC50 (nM) | |||||
|---|---|---|---|---|---|
| MELK* | PIK3CA† | mTOR* | GSK3A* | CDK7† | |
| JW-7-25-1 | 5.0 | 5.5 | 12.3 | 63.4 | |
| HTH-01-091 | 10.5 | 962 | 632 | 1740 | 1230 |
| OTSSP167 | 0.5 | 66.5 | 35.7 | 1.6 | 49.1 |
| MRT199665 | 1.4–3.3 | ||||
| NVS-MELK8a | 11.9 | ||||
| MELK-T1 | 13.5 | ||||
-
*Kinase activity measured by Z’-LYTE assay at [ATP]=apparent Km, in accordance with Z’-LYTE Screening Protocol and Assay Conditions provided by Life Technologies.
†Kinase activity measured by Adapta assay at [ATP]=apparent Km, in accordance with Adapta Screening Protocol and Assay Conditions provided by Life Technologies.
Table 2
Enzymatic IC50 values of the main targets of HTH-01-091 measured by the International Center for Kinase Profiling (ICKP).
https://doi.org/10.7554/eLife.26693.006| Kinase | % activity remaining (1 µM) | Enzymatic IC50* (nM) |
|---|---|---|
| PIM3 | 1 | |
| PIM1 | 1 | 60.6 |
| PIM2 | 2 | |
| RIPK2 | 3 | 42.5 |
| DYRK3 | 5 | 41.8 |
| SmMLCK | 8 | 108.6 |
| CLK2 | 11 | |
| MELK | 13 | 15.3 |
| HIPK2 | 13 | |
| DAPK1 | 15 |
-
*Radioactive filter-binding assay provided by the ICKP.
Table 3
3-day antiproliferative activities of MELK inhibitors in a panel of breast cancer cell lines*.
https://doi.org/10.7554/eLife.26693.009| 3-day antiproliferative IC50 (μM) | Note | |||||||
|---|---|---|---|---|---|---|---|---|
| Subtype | Basal-like | Luminal | ||||||
| Cell line | MDA-MB-468 | BT-549 | HCC70 | ZR-75-1 | MCF7 | T-47D | MELK IC50 (nM) | Selectivity |
| HTH-01-091 | 4.00 | 6.16 | 8.80 | >10 | 8.75 | 3.87 | 10.5 | Good |
| OTSSP167 | 0.014 | 0.021 | 0.034 | 0.055 | 0.035 | 0.106 | 0.5 | Poor |
| MRT199665 | 0.58 | 0.40 | 0.39 | 4.83 | 0.44 | 5.89 | 1.4–3.3 | Poor |
| NVS-MELK8a | 5.41 | 8.05 | 5.99 | >10 | 6.06 | >10 | 11.9 | Good |
| MELK-T1 | >10 | >10 | 13.5 | Good | ||||
-
*IC50 values were estimated based on ‘log(inhibitor) vs. normalized response -- Variable slope’ using GraphPad Prism 7. Experiments were performed in duplicates.
Table 4
7-day antiproliferative activities of MELK inhibitors in a panel of breast cancer cell lines*.
https://doi.org/10.7554/eLife.26693.010| 7-day antiproliferative IC50 (μM) | ||||||
|---|---|---|---|---|---|---|
| Basal-like | Luminal | |||||
| Cell line | MDA-MB-468 | MDA-MB-468 (second source) | BT-549 | HCC70 | MCF7 | T-47D |
| HTH-01-091 | 2.71 | 10.7 | 2.82 | 2.43 | 4.13 | 0.78 |
| OTSSP167 | 0.012 | 0.033 | 0.009 | 0.021 | 0.027 | 0.009 |
| MRT199665 | 0.16 | 0.91 | 0.31 | 0.075 | 0.11 | 0.62 |
| NVS-MELK8a | 2.96 | 8.4 | 4.98 | 4.17 | 2.81 | 4.90 |
-
*IC50 values were estimated based on ‘log(inhibitor) vs. normalized response -- Variable slope’ using GraphPad Prism 7. Experiments were performed in duplicates.
Additional files
-
Supplementary file 1
Crystallization conditions and data collection and refinement statistics for crystal structures.
- https://doi.org/10.7554/eLife.26693.035
-
Supplementary file 2
Oligonucleotides and primers.
The oligos and primers necessary for all cloning, genotyping and RT-qPCR work in this study are listed.
- https://doi.org/10.7554/eLife.26693.036
-
Transparent reporting form
- https://doi.org/10.7554/eLife.26693.037
Download links
A two-part list of links to download the article, or parts of the article, in various formats.
Downloads (link to download the article as PDF)
Open citations (links to open the citations from this article in various online reference manager services)
Cite this article (links to download the citations from this article in formats compatible with various reference manager tools)
MELK is not necessary for the proliferation of basal-like breast cancer cells
eLife 6:e26693.
https://doi.org/10.7554/eLife.26693


