Action history influences subsequent movement via two distinct processes
- Curtin University, Australia
- The University of Queensland, Australia
- Princeton University, United States
- CNRS UMR 5287, Université Bordeaux Segalen, France
Figures
Figure 1
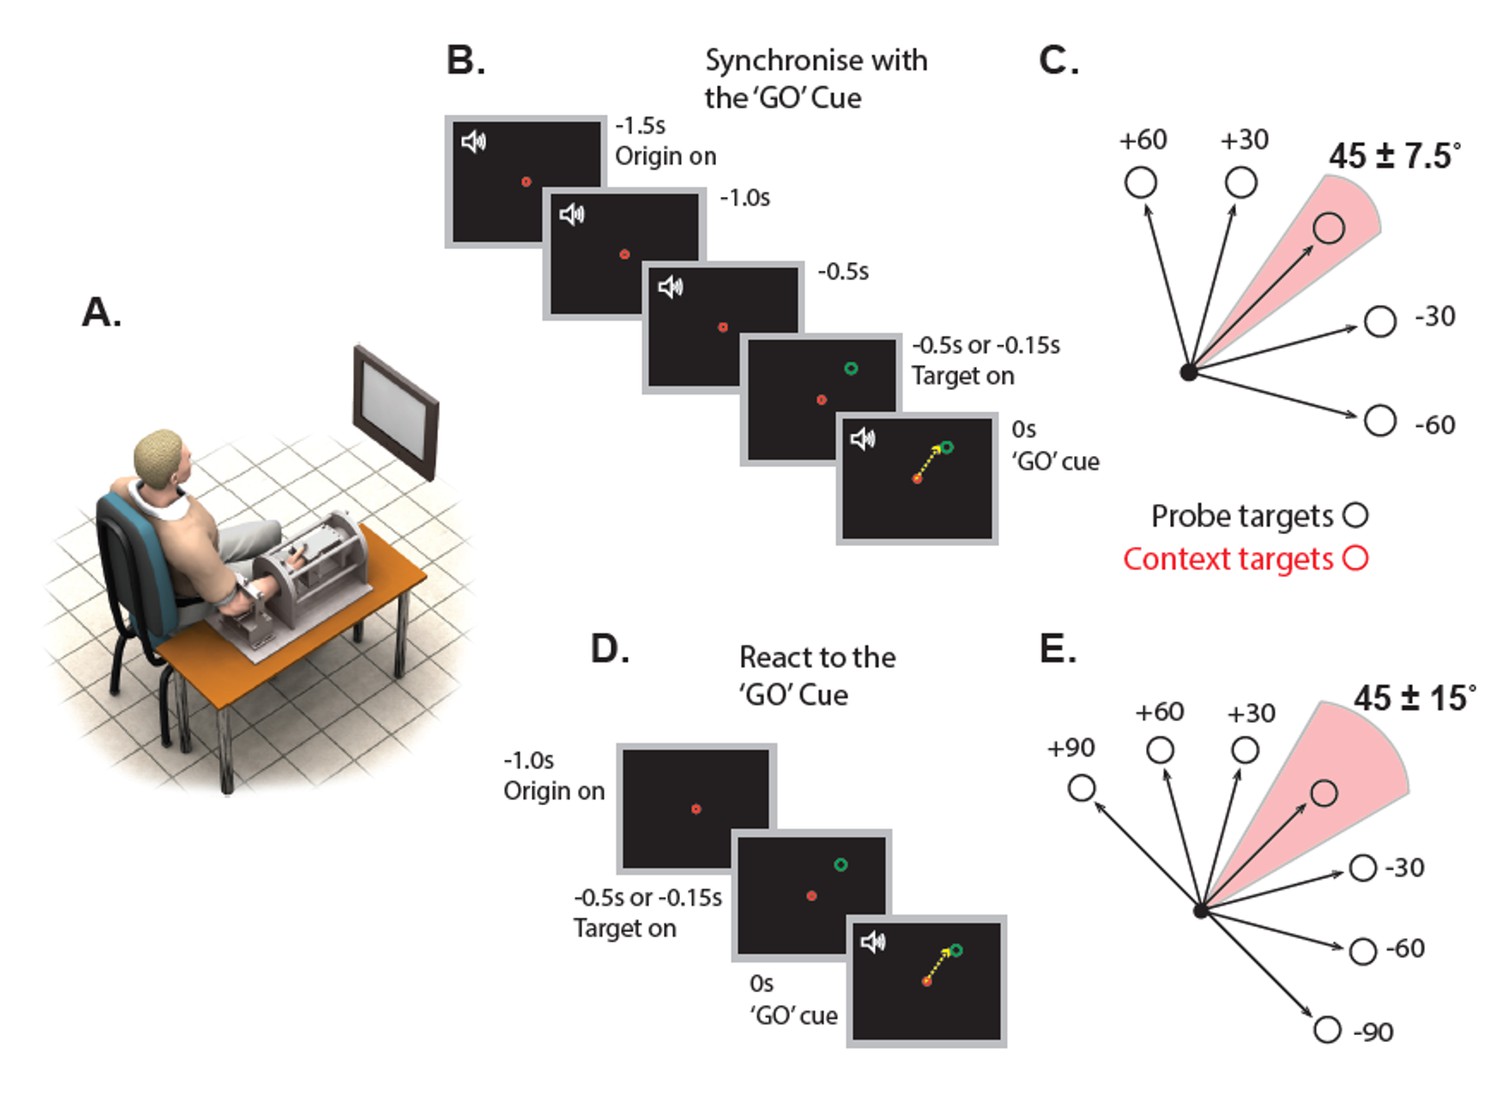
Experimental protocol and setup for experiments 1 and 2.
(A) Illustration of the experimental configuration. (B) A schematic showing the Experiment 1 trial sequence using the timed response paradigm. Participants initiated their movements in synchrony with the final tone in a sequence of four. The probe target did not appear until either 500 (long preparation) or 150 ms (short preparation) before the fourth tone. (C) A schematic representation showing the locations of context (shaded pink area) and probe targets (grey) in Experiment 1. (D) Trial sequence for the reaction time task of Experiment 2. Participants initiated movements as soon as possible after an auditory ‘GO’ cue. The target location was presented either 150 ms (short preparation) or 500 ms (long preparation) prior to the ‘GO’ cue. (E) Same as C but for Experiment 2.
Figure 2
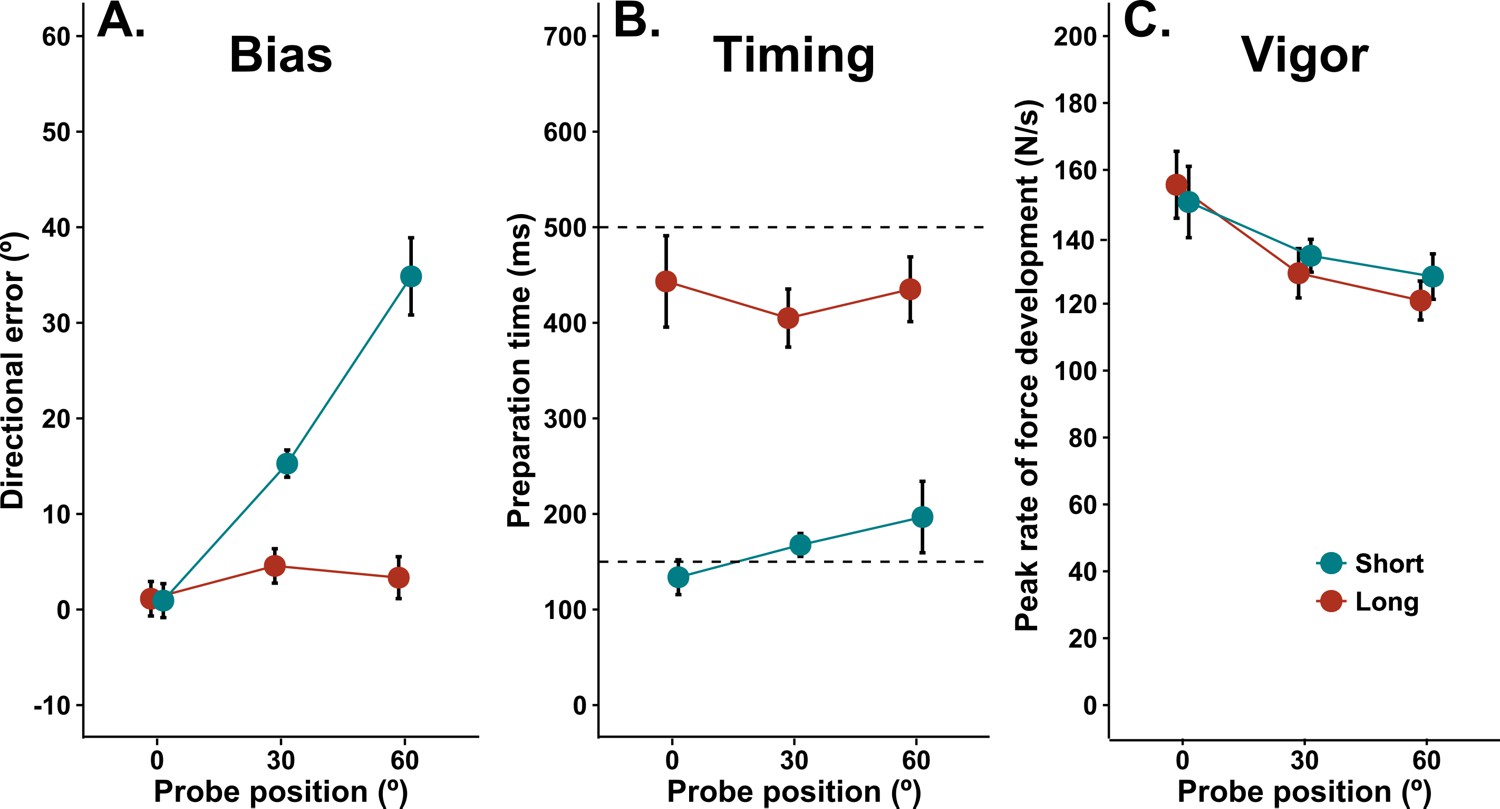
Effects of movement history in a timed response task.
Effects of movement history on aiming bias (A), the time of movement initiation after target presentation (B), and movement vigor (C) for both long and short preparation time conditions in a timed response task. Plots show group mean values (±within subjects SE, see Materials and methods for details) of the median effect for each participant. Dashed lines in B indicate the time at which movement initiation was cued.
-
Figure 2—source data 1
Source data for plots in panels 2a, 2b, 2c.
- https://doi.org/10.7554/eLife.26713.004
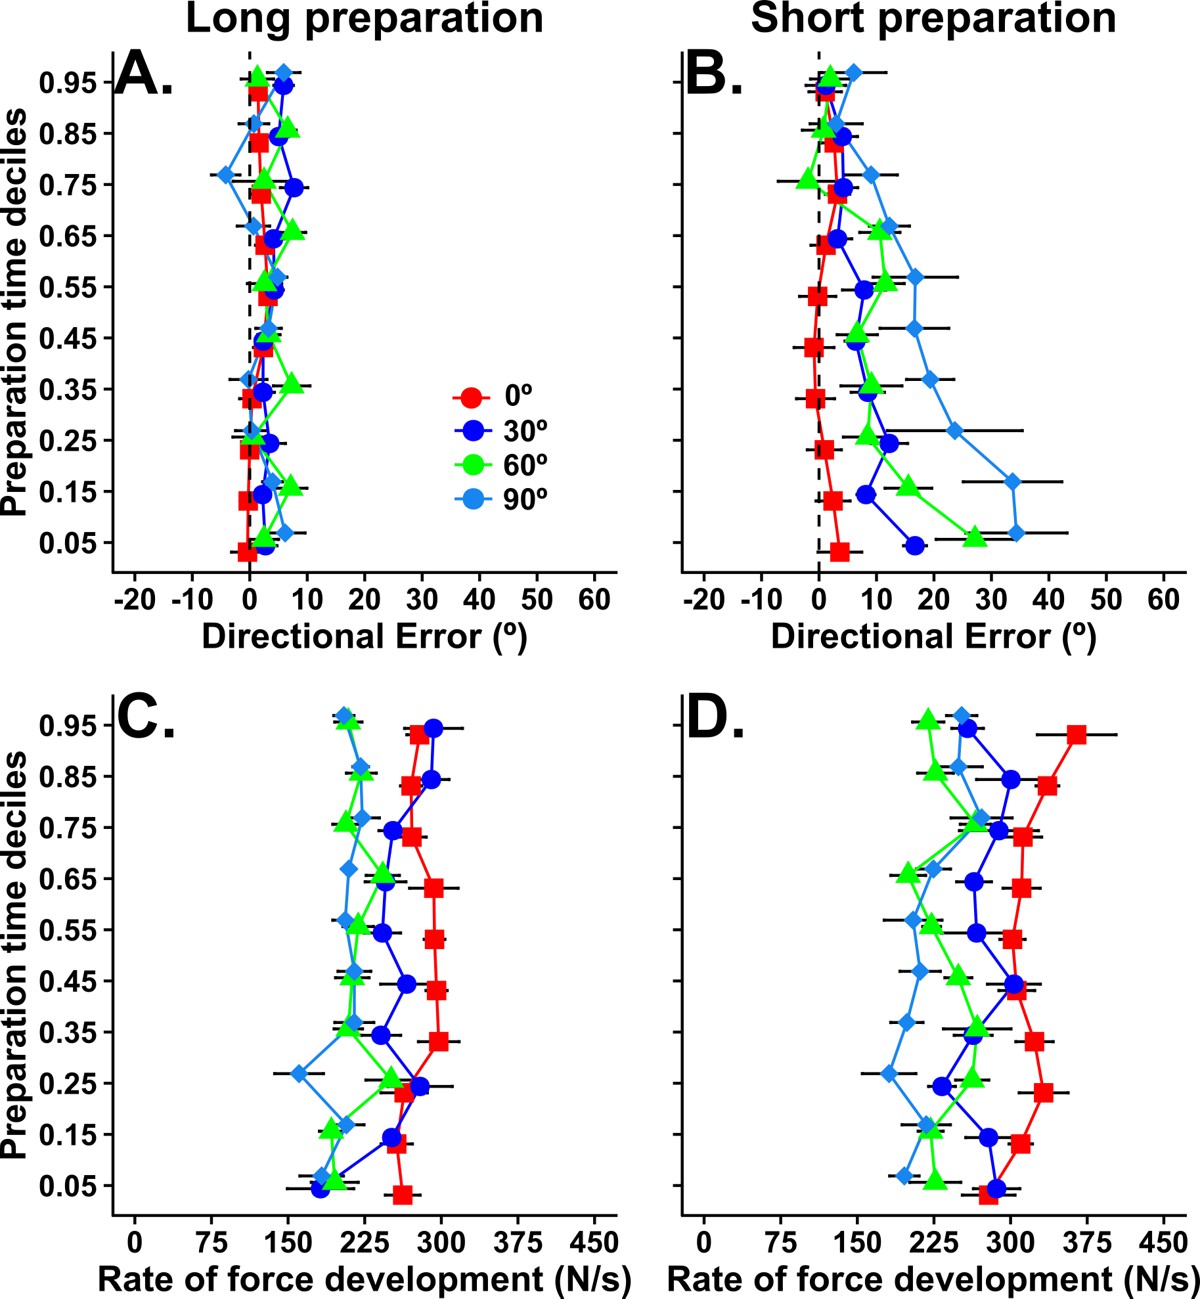
Figure 3
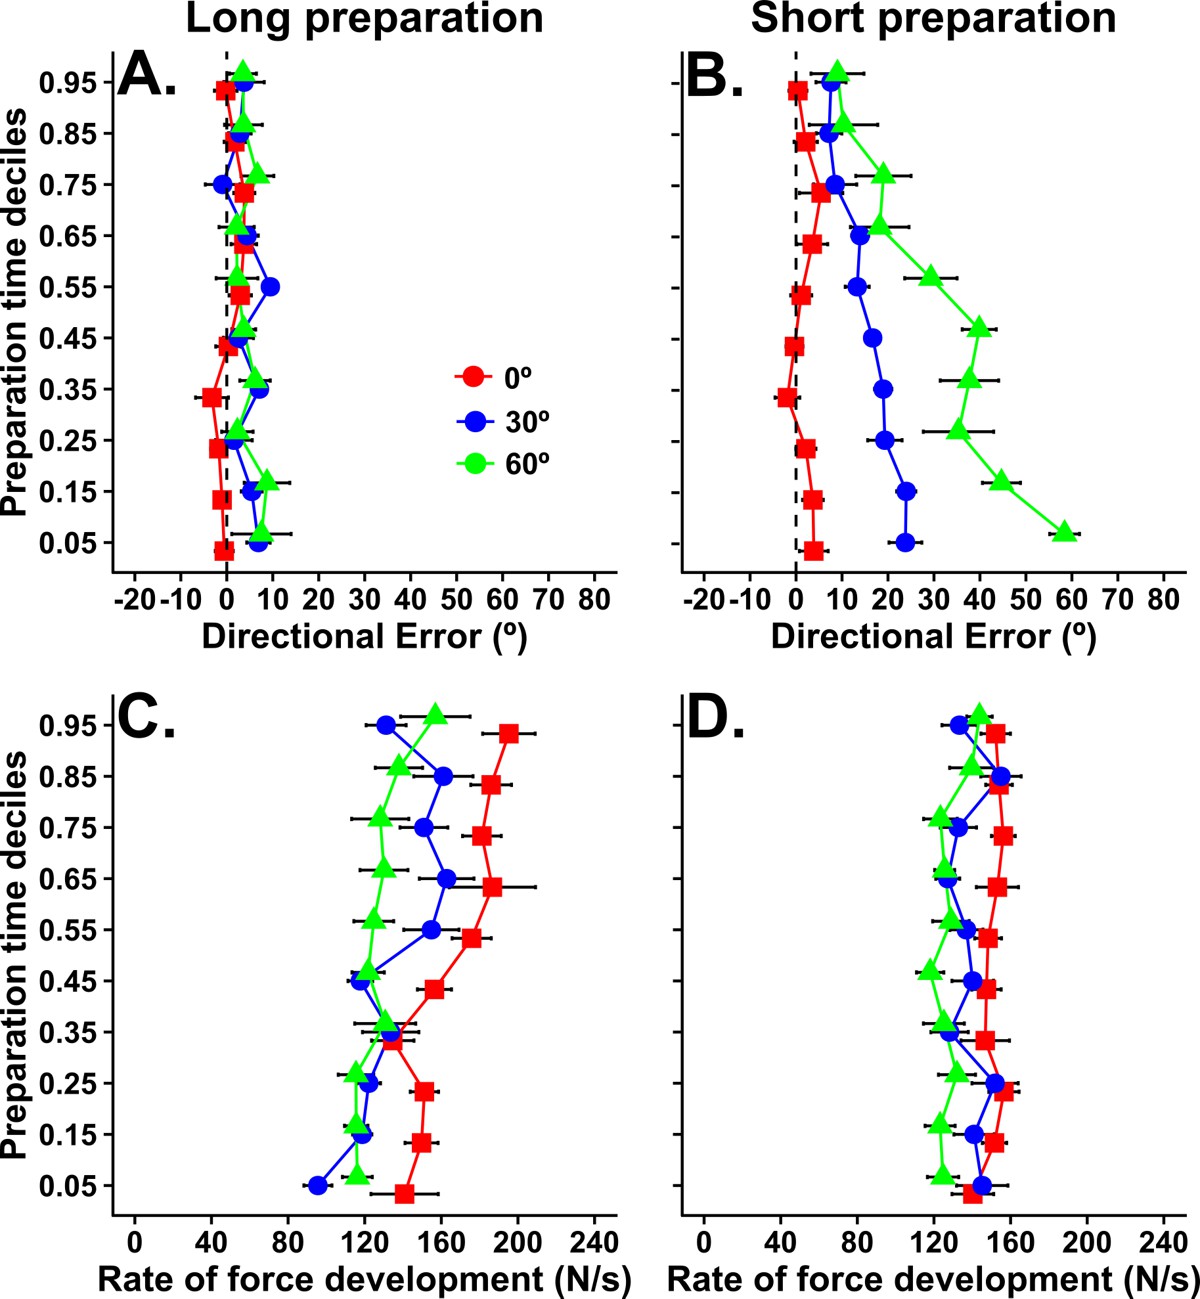
Plots showing how movement bias (top) and vigor (bottom) vary as a function of preparation time and target angle within each preparation time condition in experiment 1.
Group average (and within-subjects SE) values for bias and vigor are plotted for trials corresponding to each preparation time decile. That is, a value at the fifth percentile for preparation time is the bias or vigor measured on the trial in which the available preparation time was at the fifth percentile (i.e. fifth shortest preparation time assuming 100 trials).
-
Figure 3—source data 1
Source data for plots in panels 3a, 3b, 3c, 3d.
- https://doi.org/10.7554/eLife.26713.006
Figure 4
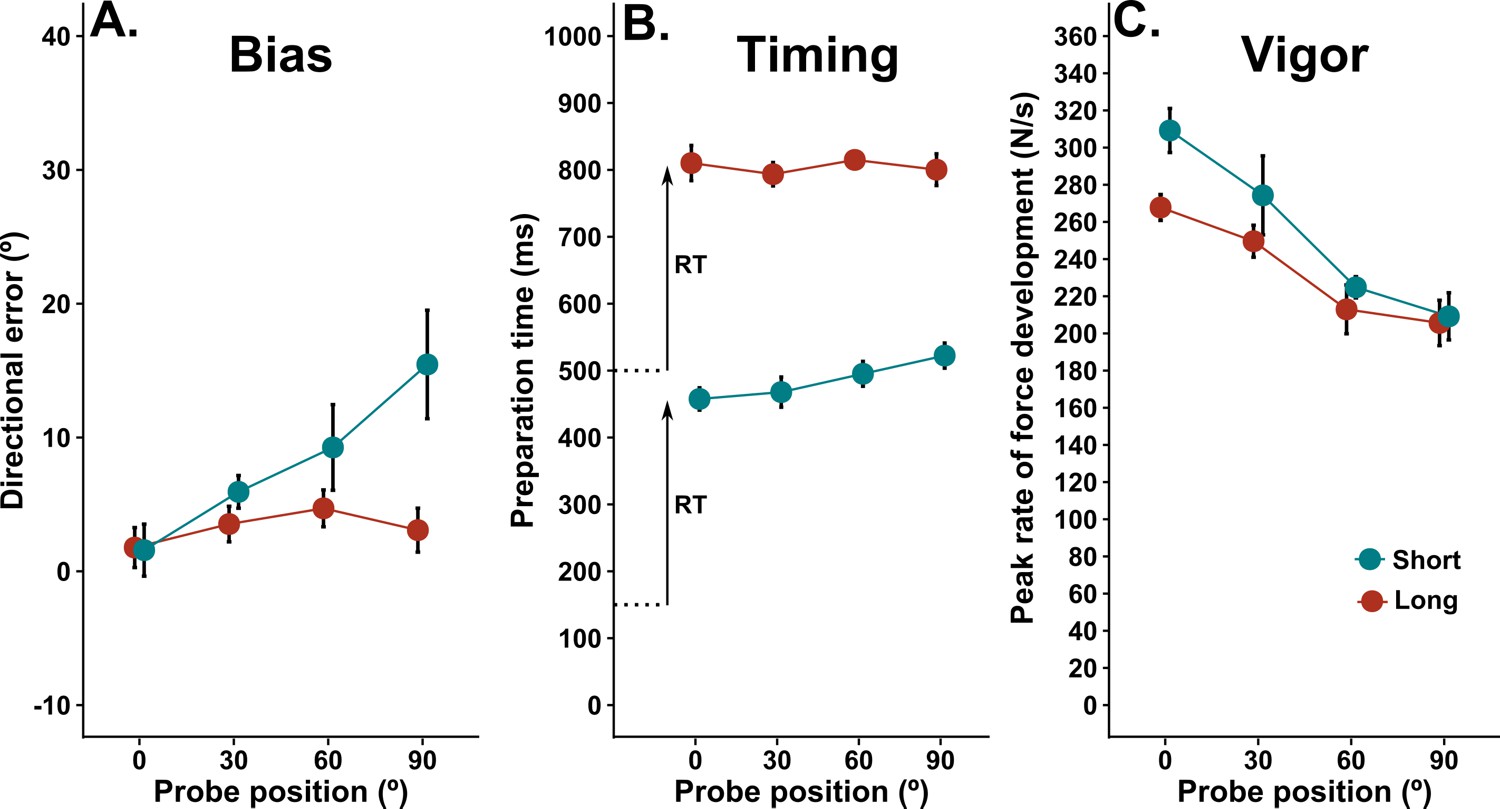
Effects of movement history in a reaction time task.
Effects of movement history on aiming bias (A), the time of movement initiation after target presentation (B), and movement vigor (C) for both long and short preparation time conditions in a reaction time task. Plots show group mean values (±within subjects SE) of the median effect for each participant. Short, dashed lines in B indicate the time of the GO cue to which subjects had to react in each condition. The reaction time (RT) from the GO cue to movement initiation is indicated by the arrowhead lines.
-
Figure 4—source data 1
Source data for plots in panels 4a, 4b, 4c.
- https://doi.org/10.7554/eLife.26713.008
Figure 5
Plots showing how movement bias (top) and vigor (bottom) vary as a function of preparation time and target angle within each preparation time condition in experiment 2 (reaction time task).
Group average (and within-subjects SE) values for bias and vigor are plotted for trials corresponding to each preparation time decile (as explained in Figure 3).
-
Figure 5—source data 1
Source data for plots in panels 5a, 5b, 5c, 5d.
- https://doi.org/10.7554/eLife.26713.010
Figure 6
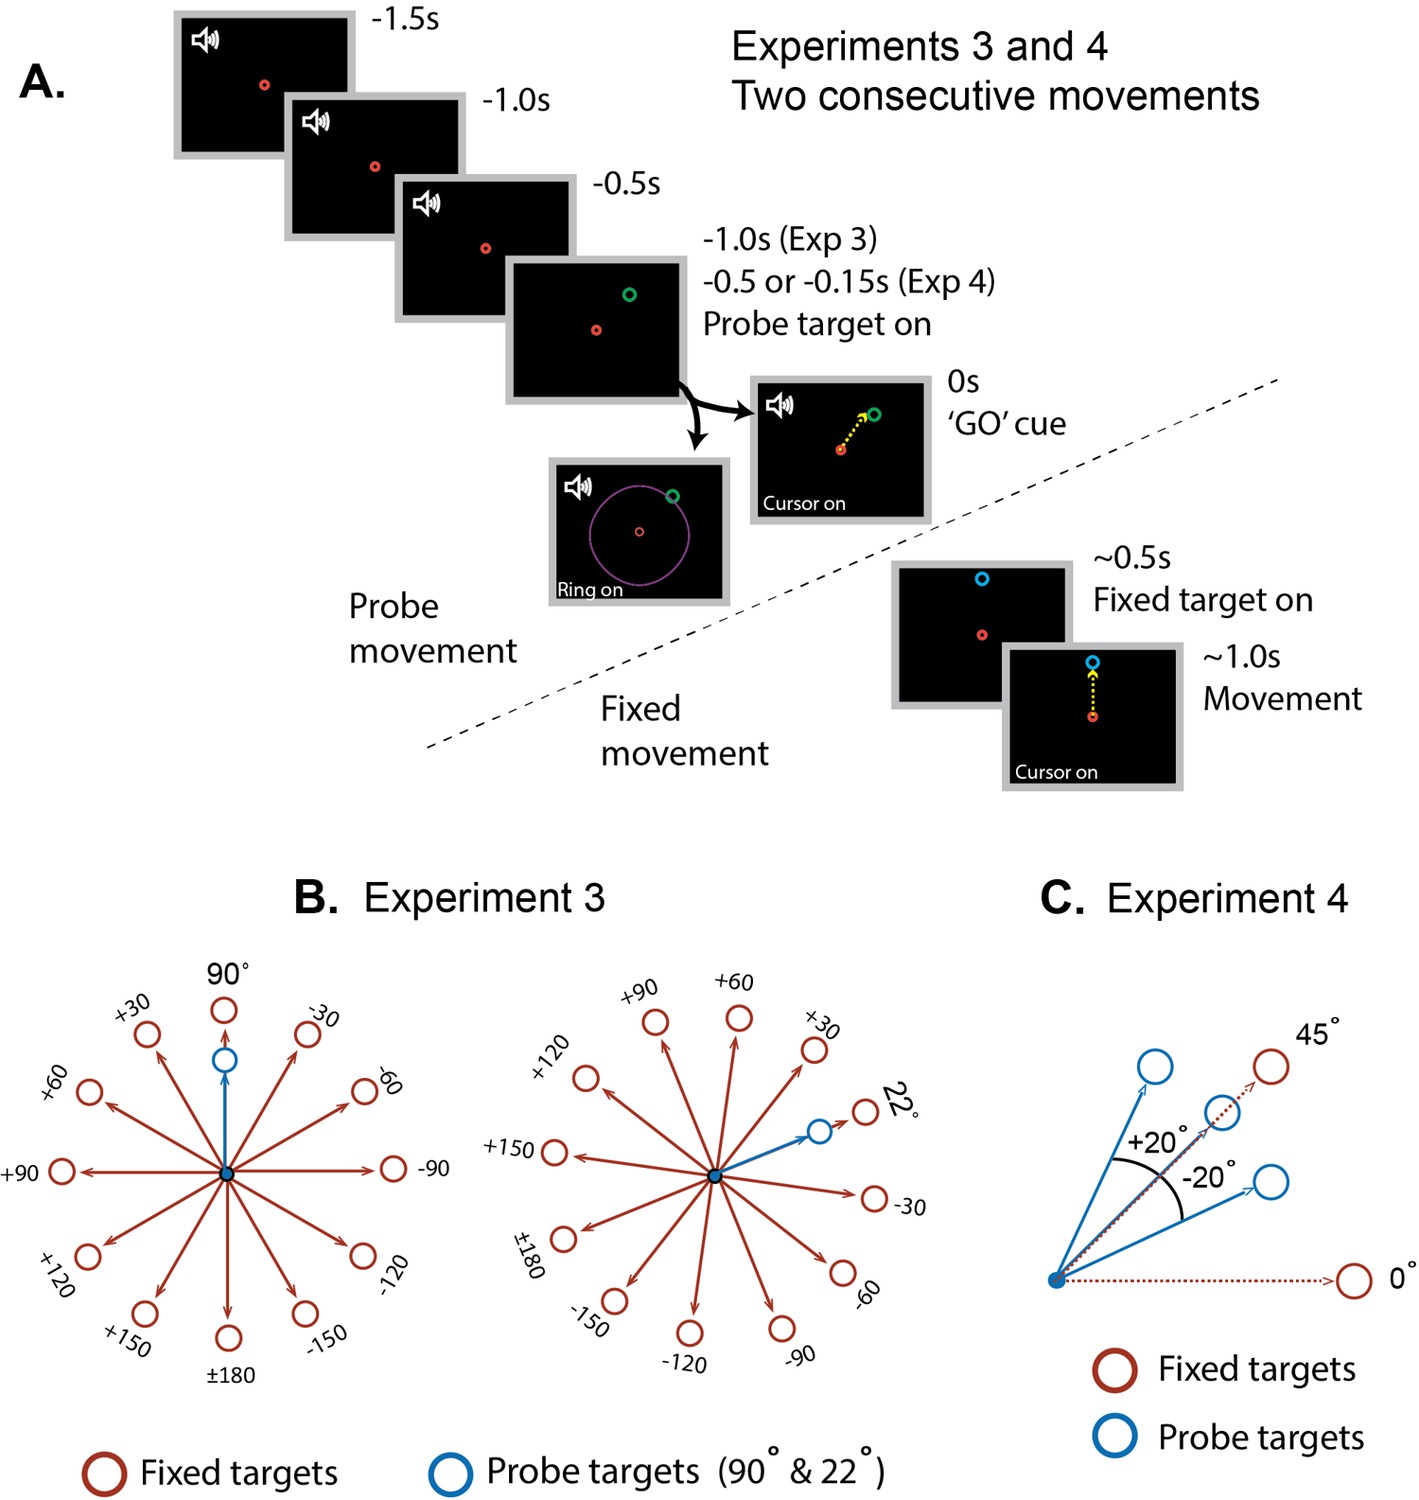
Experimental protocol and setup for experiments 3 and 4.
(A) A schematic of a trial comprising a sequence of two consecutive movements using the timed response paradigm. Participants initiated their movements in synchrony with the final tone in a sequence of four. The probe target did not appear until 1000 ms (Experiment 3), 500 ms (Experiment 4, long preparation) or 150 ms (Experiment 4, short preparation) before the fourth tone. After participants acquired the probe target and returned the cursor to the origin, the fixed target was presented, signalling that the second movement should be made immediately. (B) Schematic representation of Experiment 3. The context targets were placed either at 22° (left) or 90° (right). Fixed targets were positioned at 30° intervals throughout a full 360° range around the context targets (30° steps) and participants performed movement sequences to pairs of targets in blocks of 11. (C) Schematic representation of Experiment 4. The probe target appeared at 45° more often (60% of the trials) than the two flanker locations (20% each). The fixed targets were positioned at 0° and 45° in separate blocks, and required 125% of the force required to reach the probe targets.
Figure 7
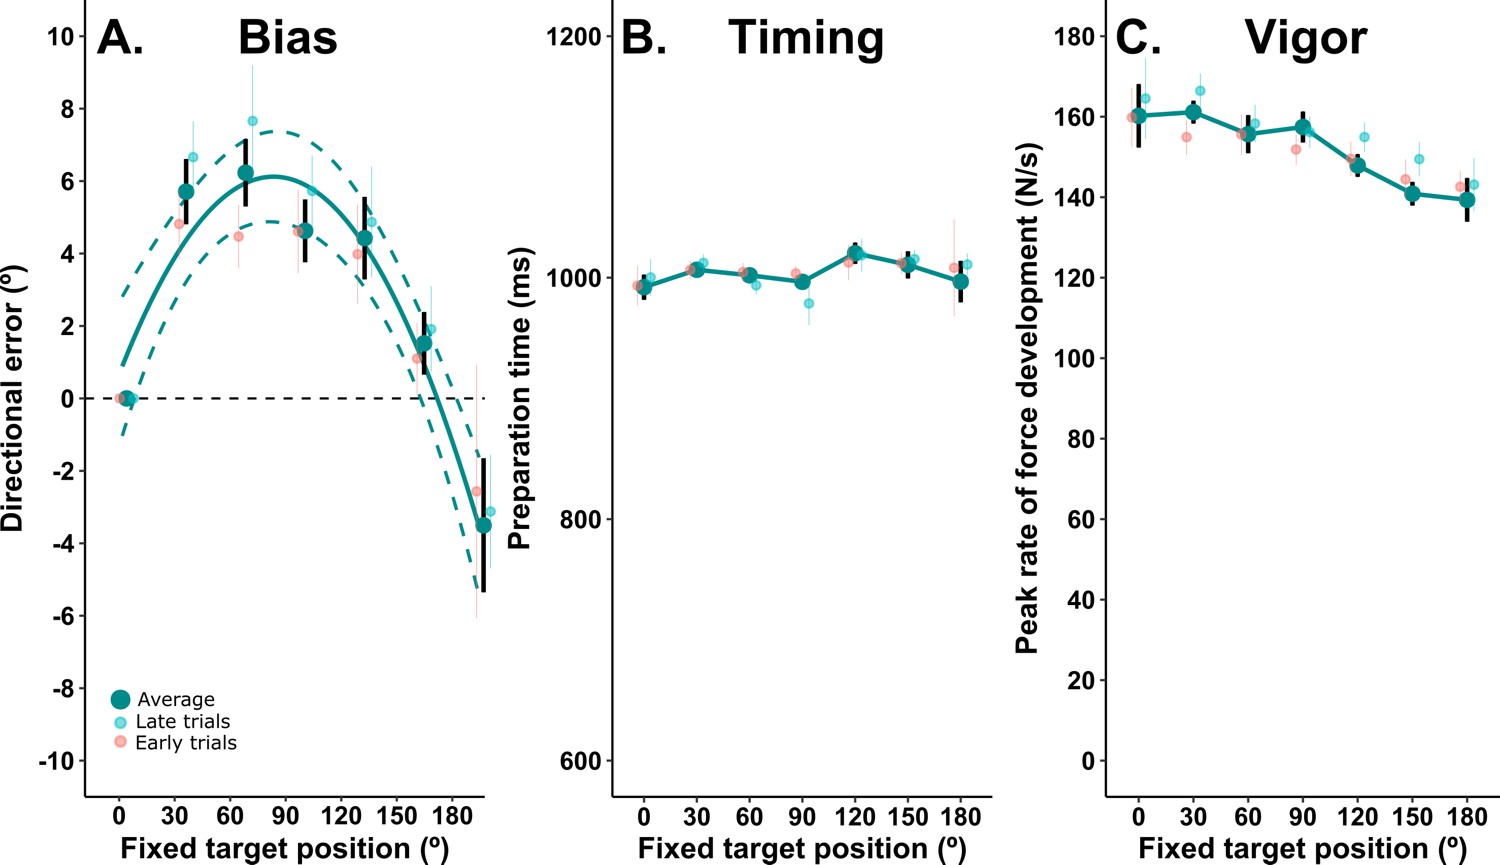
Movement bias as a function of angle from repeated target.
(A) Group mean baseline-subtracted biases (±within subjects SE) as a function of the angular separation between targets. A second order polynomial fit (±95% CI) to the bias is shown to quantify the parameters of the tuning function (adjusted R2 = 0.90). The time of movement initiation with respect to target presentation (initiation was cued at 1 s) is shown in B, and the vigor of movement as a function of the angular separation between targets is shown in C. The smaller circles in all plots show the median values for the first and last two trials that comprise each grand average.
-
Figure 7—source data 1
Source data for plots in panels 7a, 7b, 7c.
- https://doi.org/10.7554/eLife.26713.013
Figure 8

Dissociation between use-dependent and action prediction biases.
(A, B) Group average (±within subjects SE) angular errors from each probe target for the two preparation time conditions and fixed targets. Counter-clockwise errors are depicted as positive, such that the pattern of errors in A represents biases toward the centre of the probe target distribution. The inset schematic plots illustrate the locations of the probe (blue) and fixed (red) targets, and the expected bias effects due to pure ‘use-dependent’ effects (red arrows) and ‘action prediction’ effects (blue arrows). Error distributions were similar for the two fixed target conditions (A and B), but were offset towards the fixed target when it was located at 0° (B). As in experiments 1 and 2, bias was greater for short than long preparation time for both fixed targets. However, the differences in errors between the conditions for which the fixed target was at 0° and for which the fixed target was at 45° (C), were similar for all probe targets and both preparation times. This error difference reveals that pure ‘use-dependent’ bias effects of recent movement history are insensitive to movement preparation time.
-
Figure 8—source data 1
Source data for plots in panels 8a, 8b, 8c.
- https://doi.org/10.7554/eLife.26713.015
Additional files
-
Transparent reporting form
- https://doi.org/10.7554/eLife.26713.016
Download links
A two-part list of links to download the article, or parts of the article, in various formats.
Downloads (link to download the article as PDF)
Open citations (links to open the citations from this article in various online reference manager services)
Cite this article (links to download the citations from this article in formats compatible with various reference manager tools)
Action history influences subsequent movement via two distinct processes
eLife 6:e26713.
https://doi.org/10.7554/eLife.26713


