Systematic integration of biomedical knowledge prioritizes drugs for repurposing
- University of California, San Francisco, United States
- University of Pennsylvania, United States
- University of Nantes, France
- University of Iowa, United States
- Johns Hopkins University, United States
- University of California, San Fransisco, United States
Figures
Figure 1
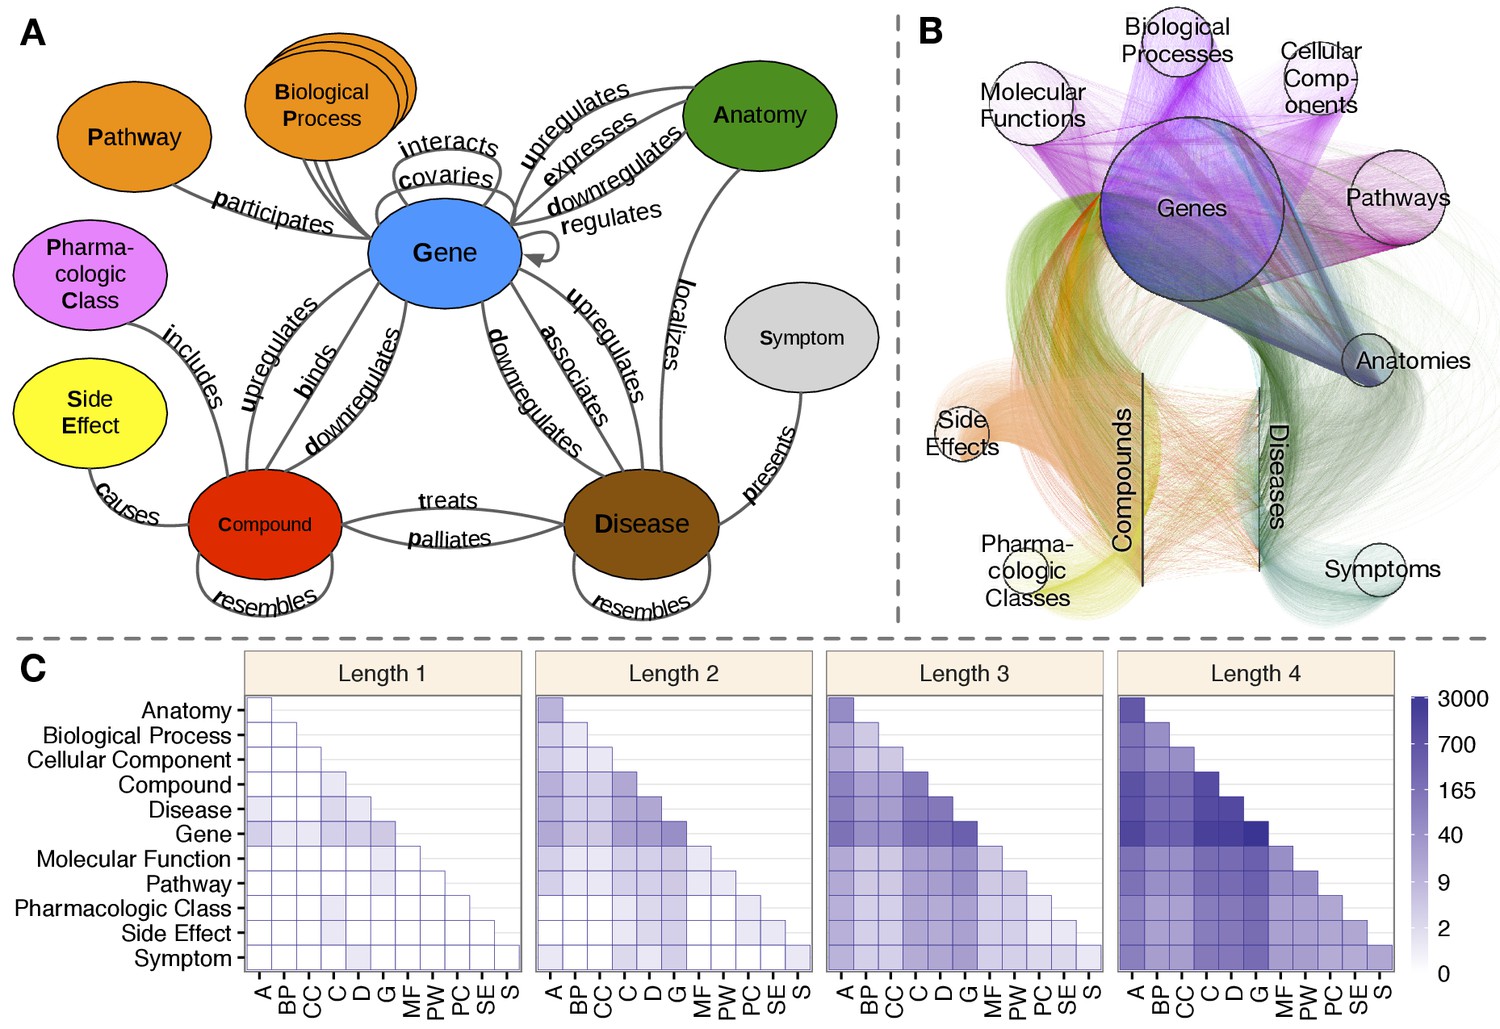
Hetionet v1.0.
(A) The metagraph, a schema of the network types. (B) The hetnet visualized. Nodes are drawn as dots and laid out orbitally, thus forming circles. Edges are colored by type. (C) Metapath counts by path length. The number of different types of paths of a given length that connect two node types is shown. For example, the top-left tile in the Length 1 panel denotes that Anatomy nodes are not connected to themselves (i.e. no edges connect nodes of this type between themselves). However, the bottom-left tile of the Length 4 panel denotes that 88 types of length-four paths connect Symptom to Anatomy nodes.
Figure 2
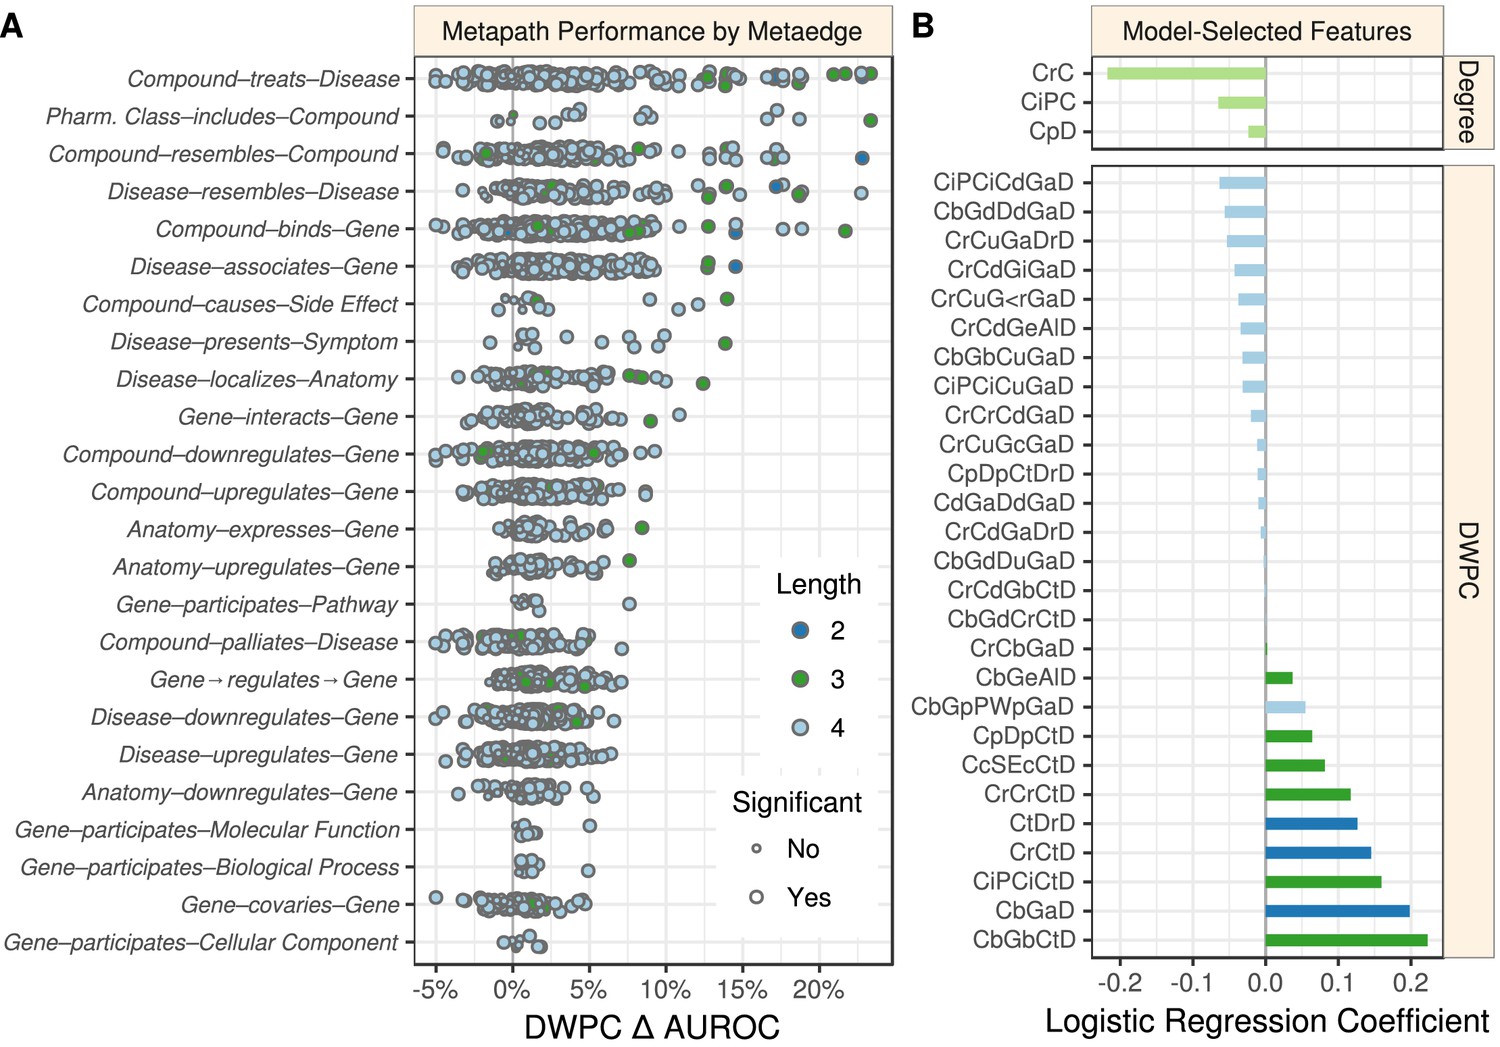
Performance by type and model coefficients.
(A) The performance of the DWPCs for 1206 metapaths, organized by their composing metaedges. The larger dots represent metapaths that were significantly affected by permutation (false discovery rate < 5%). Metaedges are ordered by their best performing metapath. Since a metapath’s performance is limited by its least informative metaedge, the best performing metapath for a metaedge provides a lower bound on the pharmacologic utility of a given domain of information. (B) Barplot of the model coefficients. Features were standardized prior to model fitting to make the coefficients comparable (Himmelstein and Lizee, 2016a).
Figure 3
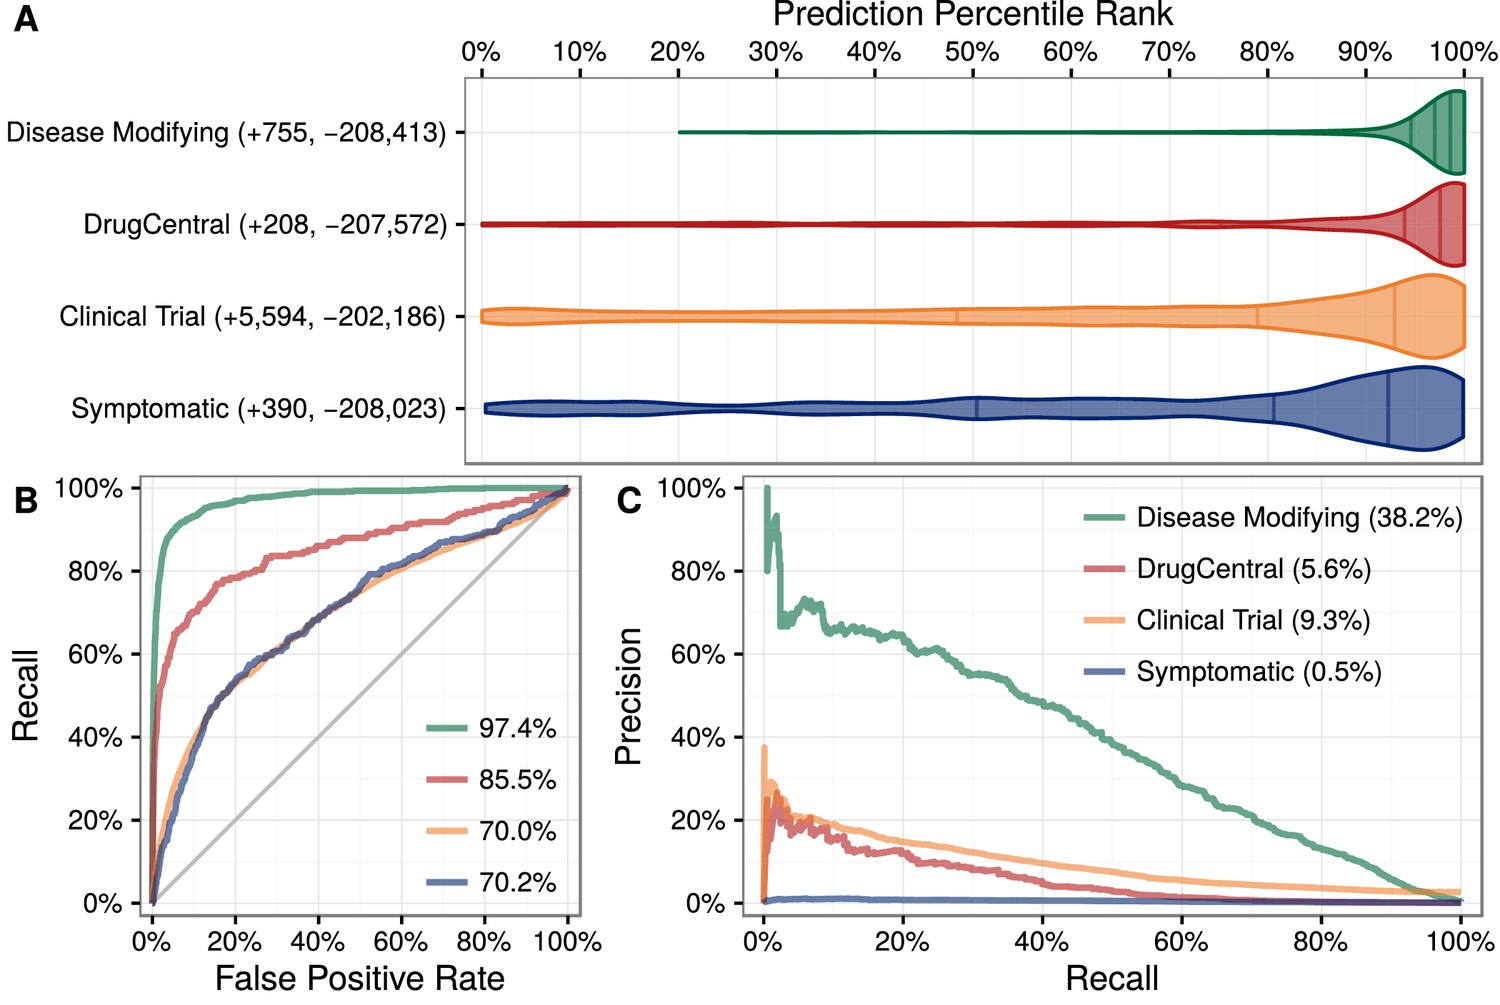
Predictions performance on four indication sets.
We assess how well our predictions prioritize four sets of indications. (A) The y-axis labels denote the number of indications (+) and non-indications (−) composing each set. Violin plots with quartile lines show the distribution of indications when compound–disease pairs are ordered by their prediction. In all four cases, the actual indications were ranked highly by our predictions. (B) ROC Curves with AUROCs in the legend. (C) Precision–Recall Curves with AUPRCs in the legend.
Figure 4

Evidence supporting the repurposing of bupropion for smoking cessation.
This figure shows the 10 most supportive paths (out of 365 total) for treating nicotine dependence with bupropion, as available in this prediction’s Neo4j Browser guide. Our method detected that bupropion targets the CHRNA3 gene, which is also targeted by the known-treatment varenicline (Mihalak et al., 2006). Furthermore, CHRNA3 is associated with nicotine dependence (Thorgeirsson et al., 2008) and participates in several pathways that contain other nicotinic-acetylcholine-receptor (nAChR) genes associated with nicotine dependence. Finally, bupropion causes terminal insomnia (Boshier et al., 2003) as does varenicline (Hays et al., 2008), which could indicate an underlying common mechanism of action.
Figure 5
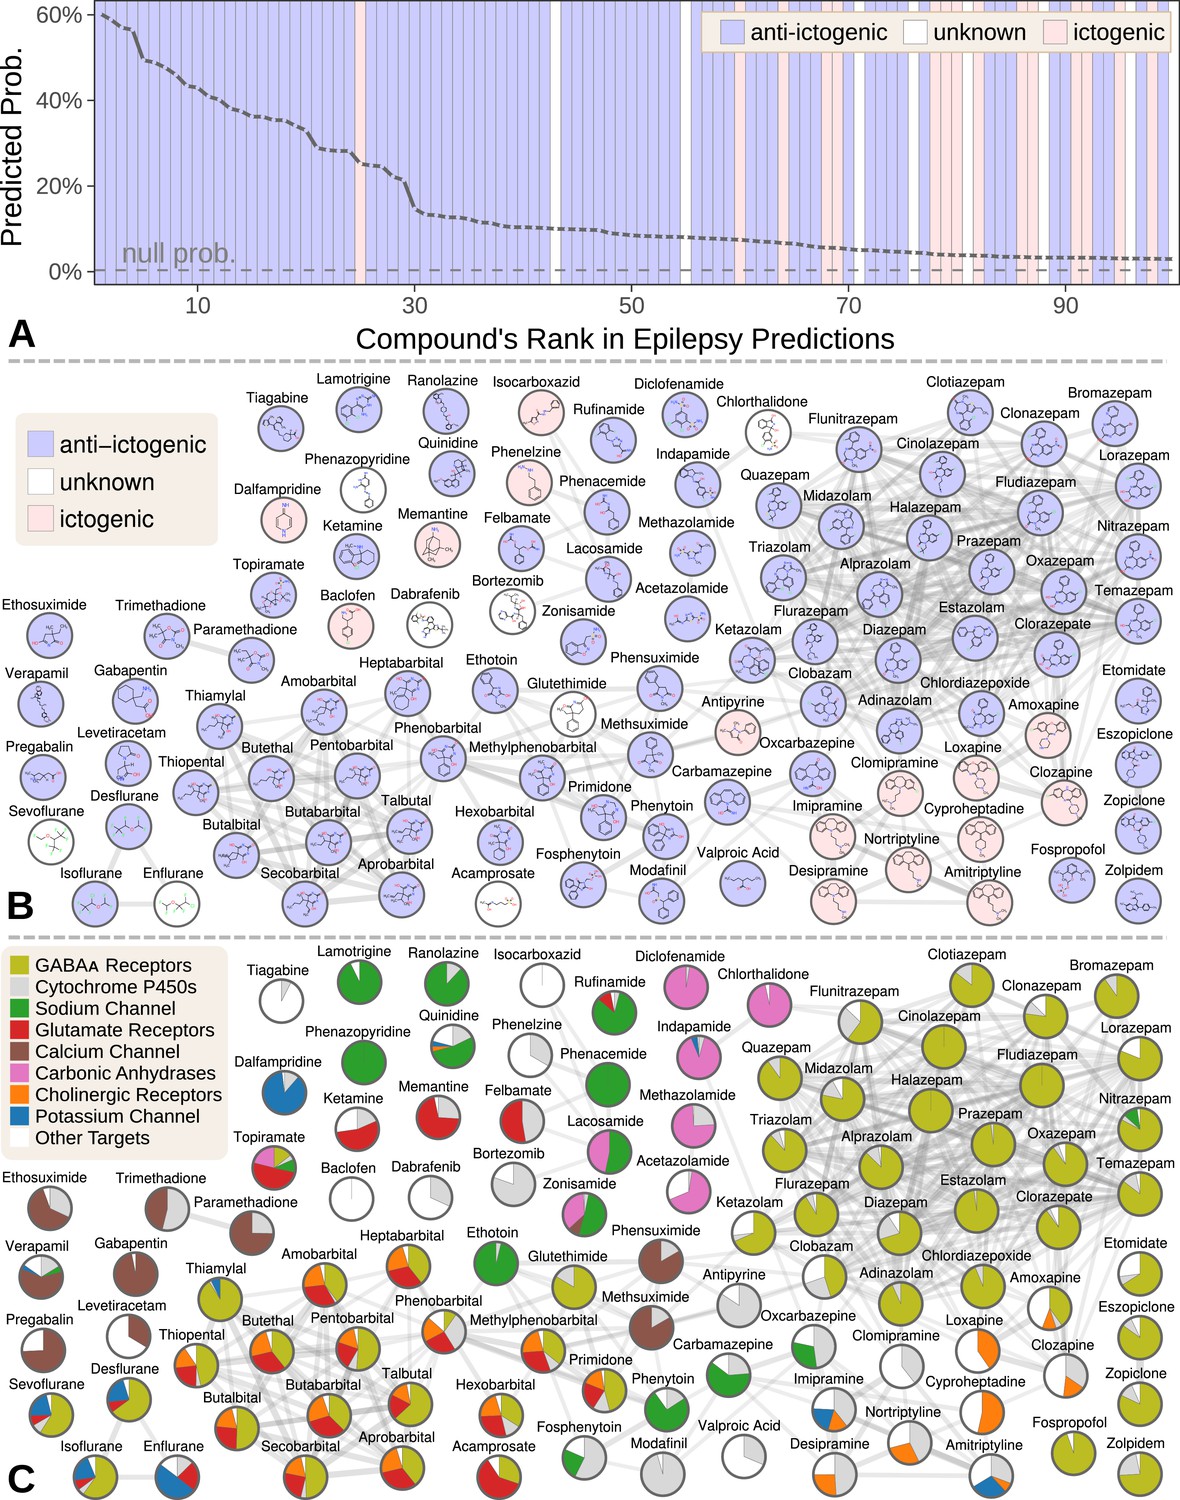
Top 100 epilepsy predictions.
(A) Compounds — ranked from 1 to 100 by their predicted probability of treating epilepsy — are colored by their effect on seizures (Khankhanian and Himmelstein, 2016). The highest predictions are almost exclusively anti-ictogenic. Further down the prediction list, the prevalence of drugs with an ictogenic (contraindication) or unknown (novel repurposing candidate) effect on epilepsy increases. All compounds shown received probabilities far exceeding the null probability of treatment (0.36%). (B) A chemical similarity network of the epilepsy predictions, with each compound’s 2D structure (Himmelstein et al., 2017a). Edges are Compound–resembles–Compound relationships from Hetionet v1.0. Nodes are colored by their effect on seizures. (C) The relative contribution of important drug targets to each epilepsy prediction (Himmelstein et al., 2017a). Specifically, pie charts show how the eight most-supportive drug targets across all 100 epilepsy predictions contribute to individual predictions. Other Targets represents the aggregate contribution of all targets not listed. The network layout is identical to B.
Figure 6
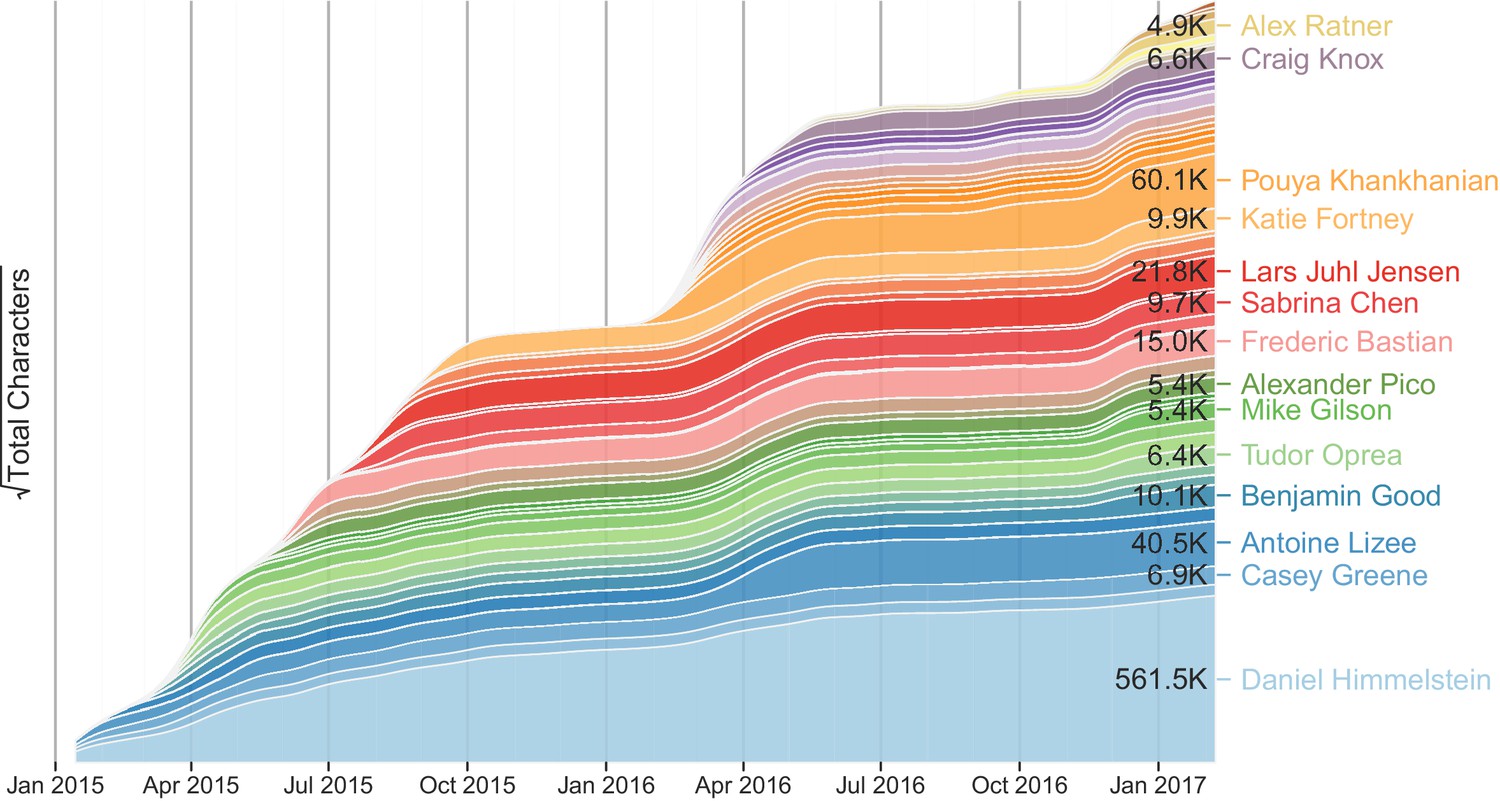
The growth the Project Rephetio corpus on Thinklab over time.
This figure shows Project Rephetio contributions by user over time. Each band represented the cumulative contribution of a Thinklab user to discussions in Project Rephetio (Himmelstein and Lizee, 2016v). Users are ordered by date of first contribution. Users who contributed over 4500 characters are named. The square root transformation of characters written per user accentuates the activity of new contributors, thereby emphasizing collaboration and diverse input.
Tables
Table 1
Metanodes.
Hetionet v1.0 includes 11 node types (metanodes). For each metanode, this table shows the abbreviation, number of nodes, number of nodes without any edges, and the number of metaedges connecting the metanode.
| Metanode | Abbr | Nodes | Disconnected | Metaedges |
|---|---|---|---|---|
| Anatomy | A | 402 | 2 | 4 |
| Biological process | BP | 11,381 | 0 | 1 |
| Cellular component | CC | 1391 | 0 | 1 |
| Compound | C | 1552 | 14 | 8 |
| Disease | D | 137 | 1 | 8 |
| Gene | G | 20,945 | 1800 | 16 |
| Molecular function | MF | 2884 | 0 | 1 |
| Pathway | PW | 1822 | 0 | 1 |
| Pharmacologic class | PC | 345 | 0 | 1 |
| Side effect | SE | 5734 | 33 | 1 |
| Symptom | S | 438 | 23 | 1 |
Table 2
Metaedges.
Hetionet v1.0 contains 24 edge types (metaedges). For each metaedge, the table reports the abbreviation, the number of edges, the number of source nodes connected by the edges, and the number of target nodes connected by the edges. Note that all metaedges besides Gene→regulates→Gene are undirected.
| Metaedge | Abbr | Edges | Sources | Targets |
|---|---|---|---|---|
| Anatomy–downregulates–Gene | AdG | 102,240 | 36 | 15,097 |
| Anatomy–expresses–Gene | AeG | 526,407 | 241 | 18,094 |
| Anatomy–upregulates–Gene | AuG | 97,848 | 36 | 15,929 |
| Compound–binds–Gene | CbG | 11,571 | 1389 | 1689 |
| Compound–causes–Side Effect | CcSE | 138,944 | 1071 | 5701 |
| Compound–downregulates–Gene | CdG | 21,102 | 734 | 2880 |
| Compound–palliates–Disease | CpD | 390 | 221 | 50 |
| Compound–resembles–Compound | CrC | 6486 | 1042 | 1054 |
| Compound–treats–Disease | CtD | 755 | 387 | 77 |
| Compound–upregulates–Gene | CuG | 18,756 | 703 | 3247 |
| Disease–associates–Gene | DaG | 12,623 | 134 | 5392 |
| Disease–downregulates–Gene | DdG | 7623 | 44 | 5745 |
| Disease–localizes–Anatomy | DlA | 3602 | 133 | 398 |
| Disease–presents–Symptom | DpS | 3357 | 133 | 415 |
| Disease–resembles–Disease | DrD | 543 | 112 | 106 |
| Disease–upregulates–Gene | DuG | 7731 | 44 | 5630 |
| Gene–covaries–Gene | GcG | 61,690 | 9043 | 9532 |
| Gene–interacts–Gene | GiG | 147,164 | 9526 | 14,084 |
| Gene–participates–Biological Process | GpBP | 559,504 | 14,772 | 11,381 |
| Gene–participates–Cellular Component | GpCC | 73,566 | 10,580 | 1391 |
| Gene–participates–Molecular Function | GpMF | 97,222 | 13,063 | 2884 |
| Gene–participates–Pathway | GpPW | 84,372 | 8979 | 1822 |
| Gene→regulates→Gene | Gr > G | 265,672 | 4634 | 7048 |
| Pharmacologic Class–includes–Compound | PCiC | 1029 | 345 | 724 |
Table 3
The predictiveness of select metapaths.
A small selection of interesting or influential metapaths is provided (complete table online). Len. refers to number of metaedges composing the metapath. Δ AUROC and −log10(p) assess the performance of a metapath’s DWPC in discriminating treatments from non-treatments (in the all-features stage as described in Materials and methods). p assesses whether permutation affected AUROC. For reference, p=0.05 corresponds to −log10(p) = 1.30. Note that several metapaths shown here provided little evidence that Δ AUROC ≠ 0 underscoring their poor ability to predict whether a compound treated a disease. Coef. reports a metapath’s logistic regression coefficient as seen in Figure 2B. Metapaths removed in feature selection have missing coefficients, whereas metapaths given zero-weight by the elastic net have coef. = 0.0.
| Abbrev. | Len. | Δ auroc | −log₁₀(P) | Coef. | Metapath |
|---|---|---|---|---|---|
| CbGaD | 2 | 14.5% | 6.2 | 0.20 | Compound–binds–Gene–associates–Disease |
| CdGuD | 2 | 1.7% | 4.5 | Compound–downregulates–Gene–upregulates–Disease | |
| CrCtD | 2 | 22.8% | 6.9 | 0.15 | Compound–resembles–Compound–treats–Disease |
| CtDrD | 2 | 17.2% | 5.8 | 0.13 | Compound–treats–Disease–resembles–Disease |
| CuGdD | 2 | 1.1% | 2.6 | Compound–upregulates–Gene–downregulates–Disease | |
| CbGbCtD | 3 | 21.7% | 6.5 | 0.22 | Compound–binds–Gene–binds–Compound–treats–Disease |
| CbGeAlD | 3 | 8.4% | 5.2 | 0.04 | Compound–binds–Gene–expresses–Anatomy–localizes–Disease |
| CbGiGaD | 3 | 9.0% | 4.4 | 0.00 | Compound–binds–Gene–interacts–Gene–associates–Disease |
| CcSEcCtD | 3 | 14.0% | 6.8 | 0.08 | Compound–causes–Side Effect–causes–Compound–treats–Disease |
| CdGdCtD | 3 | 3.8% | 4.6 | 0.00 | Compound–downregulates–Gene–downregulates–Compound–treats–Disease |
| CdGuCtD | 3 | −2.1% | 2.4 | Compound–downregulates–Gene–upregulates–Compound–treats–Disease | |
| CiPCiCtD | 3 | 23.3% | 7.5 | 0.16 | Compound–includes–Pharmacologic Class–includes–Compound–treats–Disease |
| CpDpCtD | 3 | 4.3% | 3.9 | 0.06 | Compound–palliates–Disease–palliates–Compound–treats–Disease |
| CrCrCtD | 3 | 17.0% | 5.0 | 0.12 | Compound–resembles–Compound–resembles–Compound–treats–Disease |
| CrCbGaD | 3 | 8.2% | 6.1 | 0.002 | Compound–resembles–Compound–binds–Gene–associates–Disease |
| CtDdGdD | 3 | 4.2% | 3.9 | Compound–treats–Disease–downregulates–Gene–downregulates–Disease | |
| CtDdGuD | 3 | 0.5% | 1.0 | Compound–treats–Disease–downregulates–Gene–upregulates–Disease | |
| CtDlAlD | 3 | 12.4% | 6.0 | Compound–treats–Disease–localizes–Anatomy–localizes–Disease | |
| CtDpSpD | 3 | 13.9% | 6.1 | Compound–treats–Disease–presents–Symptom–presents–Disease | |
| CtDuGdD | 3 | 0.7% | 1.3 | Compound–treats–Disease–upregulates–Gene–downregulates–Disease | |
| CtDuGuD | 3 | 1.1% | 1.4 | Compound–treats–Disease–upregulates–Gene–upregulates–Disease | |
| CuGdCtD | 3 | −1.6% | 2.9 | Compound–upregulates–Gene–downregulates–Compound–treats–Disease | |
| CuGuCtD | 3 | 4.4% | 3.5 | 0.00 | Compound–upregulates–Gene–upregulates–Compound–treats–Disease |
| CbGiGiGaD | 4 | 7.0% | 5.1 | 0.00 | Compound–binds–Gene–interacts–Gene–interacts–Gene–associates–Disease |
| CbGpBPpGaD | 4 | 4.9% | 3.8 | 0.00 | Compound–binds–Gene–participates–Biological Process–participates–Gene–associates–Disease |
| CbGpPWpGaD | 4 | 7.6% | 7.9 | 0.05 | Compound–binds–Gene–participates–Pathway–participates–Gene–associates–Disease |
Table 4
The 29 public data resources integrated to construct Hetionet v1.0.
Components notes which types of nodes and edges in Hetionet v1.0 derived from the resource (as per the abbreviations in Table 1 and 2). Cat. notes the general category of license (Himmelstein et al., 2015i). Category 1 refers to United States government works that we deemed were not subject to copyright. Category 2 refers to resources with licenses that allow use, redistribution, and modification (although some restrictions may still exist). The subset of category 2 licenses that we deemed to meet the the Open Definition are denoted with OD. Category 4 refers to resources without a license, hence with all rights reserved. References provides Research Resource Identifiers as well as citations to resource publications and related Project Rephetio materials. For information on license provenance, institutional affiliations, and funding for each resource, see the online table.
Additional files
-
Transparent reporting form
- https://doi.org/10.7554/eLife.26726.013
Download links
A two-part list of links to download the article, or parts of the article, in various formats.
Downloads (link to download the article as PDF)
Open citations (links to open the citations from this article in various online reference manager services)
Cite this article (links to download the citations from this article in formats compatible with various reference manager tools)
Systematic integration of biomedical knowledge prioritizes drugs for repurposing
eLife 6:e26726.
https://doi.org/10.7554/eLife.26726


