NFATc2 enhances tumor-initiating phenotypes through the NFATc2/SOX2/ALDH axis in lung adenocarcinoma
- The University of Hong Kong, Hong Kong
- The Chinese University of Hong Kong, Hong Kong
- Mayo Clinic, United States
- Arizona State University, United States
Figures
Figure 1
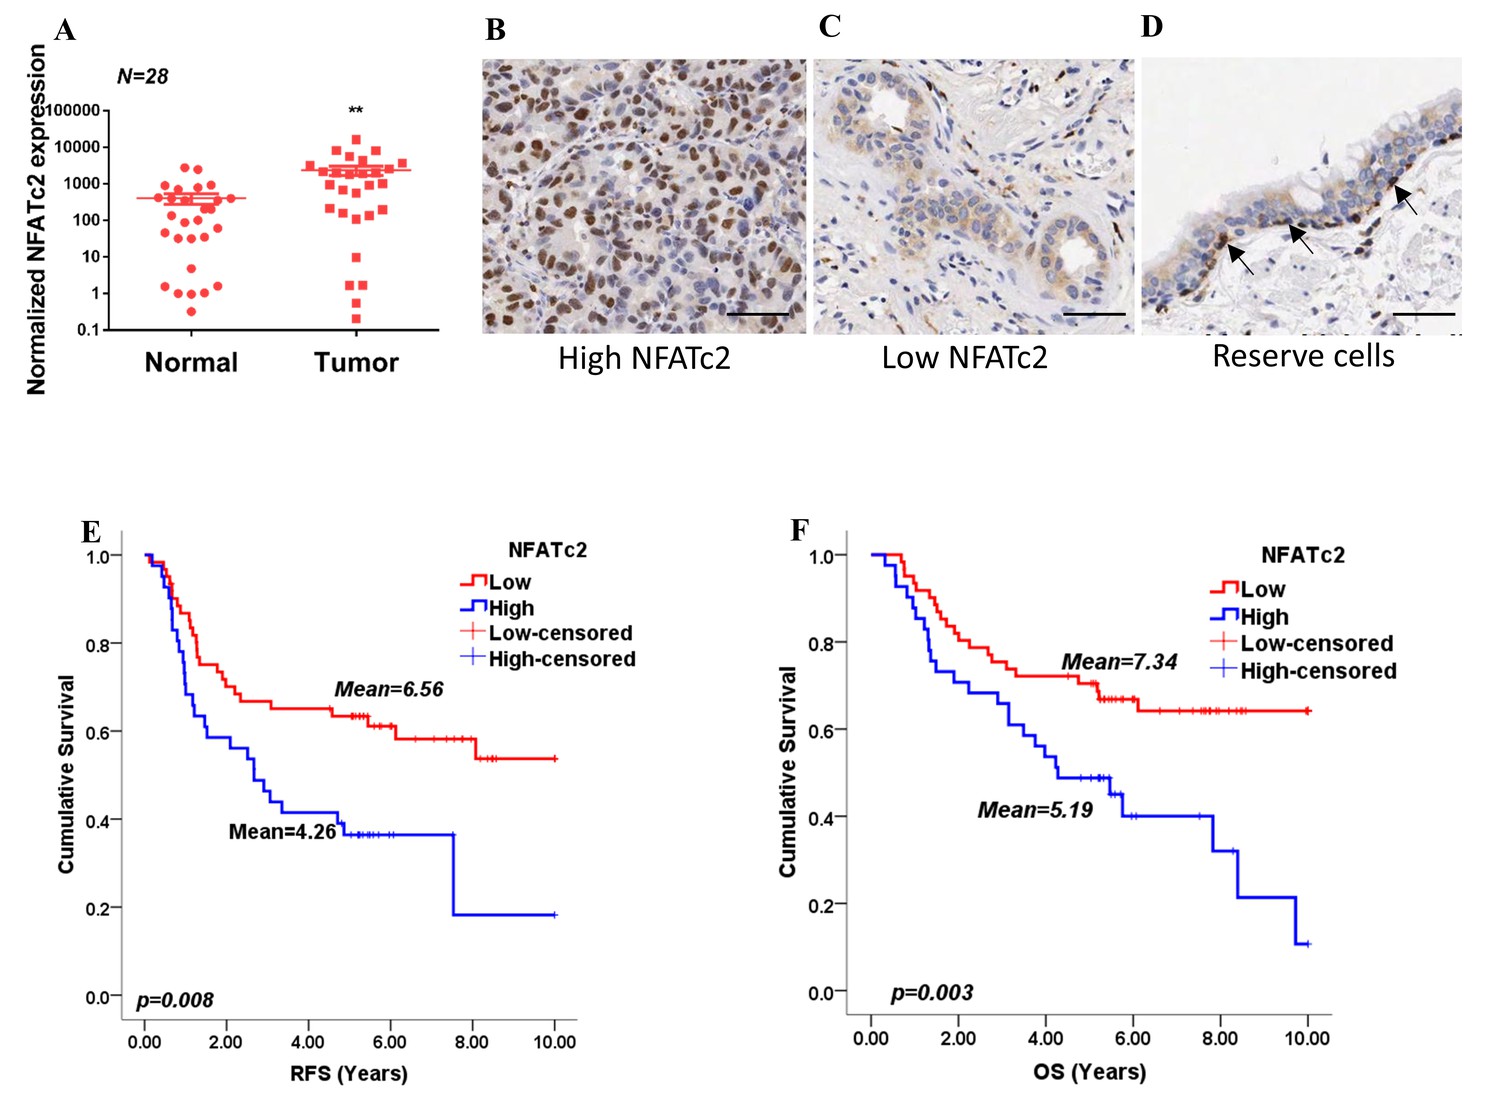
NFATc2 was overexpressed in human NSCLC and predicted poor survivals.
(A) NFATc2 expression analyzed by qPCR in human NSCLC and corresponding normal lung. P: Wilcoxon test. p=0.0003. (B–C) NFATc2 expression analyzed by IHC, showing representative areas of high NFATc2 scores with strong nuclear staining in the majority of cancer cells (B), or low NFATc2 scores with weak nuclear and cytoplasmic staining (C), respectively. (D) NFATc2 expression in normal bronchial epithelium by IHC, showing nuclear NFATc2 staining in scattered bronchiolar reserve/stem cells of the basal layer (arrows). For B-D: Scale bars, 50 µm. (E–F) Kaplan Meier survival curves by log-rank tests on 102 resected primary NSCLC stratified by NFATc2 expression levels for recurrence-free survival (RFS) (E), and overall survival (OS) (F).
-
Figure 1—source data 1
Statistical analyses for Figure 1A.
- https://doi.org/10.7554/eLife.26733.004
Figure 2 with 2 supplements

NFATc2 NFATc2 was overexpressed in lung TIC and mediated TIC properties in vitro.
(A–C) Expression of NFATc2 analyzed by Western blot, in TIC isolated as tumorspheres compared with non-TIC from cells in monolayers (A); TIC isolated as ALDH+/CD44+ subset compared with ALDH-/CD44- subset (B); TIC isolated as CD166high subset compared with the CD166low subset (C). (D) NFATc2 expression by Western blot in cells with stable NFATc2 knockdown, overexpression, or knockout, respectively. (E) BrdU proliferation assay of HCC827 cells with NFATc2 knockdown. (F) Cell cycle analysis of HCC827 cells with NFATc2 knockdown. (G–I) Tumorsphere formation and serial passage assays, in HCC827 cells after stable NFATc2 knockdown (G) or knockout (H), or in PDCL#24 cells with NFATc2 knockdown (I). (J–K) Tumorsphere formation and serial passage assays in cells with stable NFATc2 over-expression, including A549 cells (J) and H1299 cells (K). (L) Tumorsphere formation assay in HCC827 cells with or without treatment with 1 µM of CSA or 5 µM of FK506. (M–P) Cell migration and invasion assays in cells with stable NFATc2 knock down (M and N) or over-expression (O and P). For G-P: *p<0.05 **p<0.01, comparison with control by t-test. Error bar indicates the mean ±SD for at least three independent replicates.
Figure 2—figure supplement 1

NFATc2 was up-regulated in tumorspheres.
(A) Expression of NFATc2 and its target FASL analyzed by qPCR in TIC isolated as tumorspheres compared to the monolayers of non-TIC. (B) NFAT luciferase reporter activity in TIC isolated as tumorspheres compared to non-TIC monolayer controls. *p<0.05 **p<0.01, comparison with control by t-test. Error bar indicates the mean ±SD for three independent replicates.
Figure 2—figure supplement 2
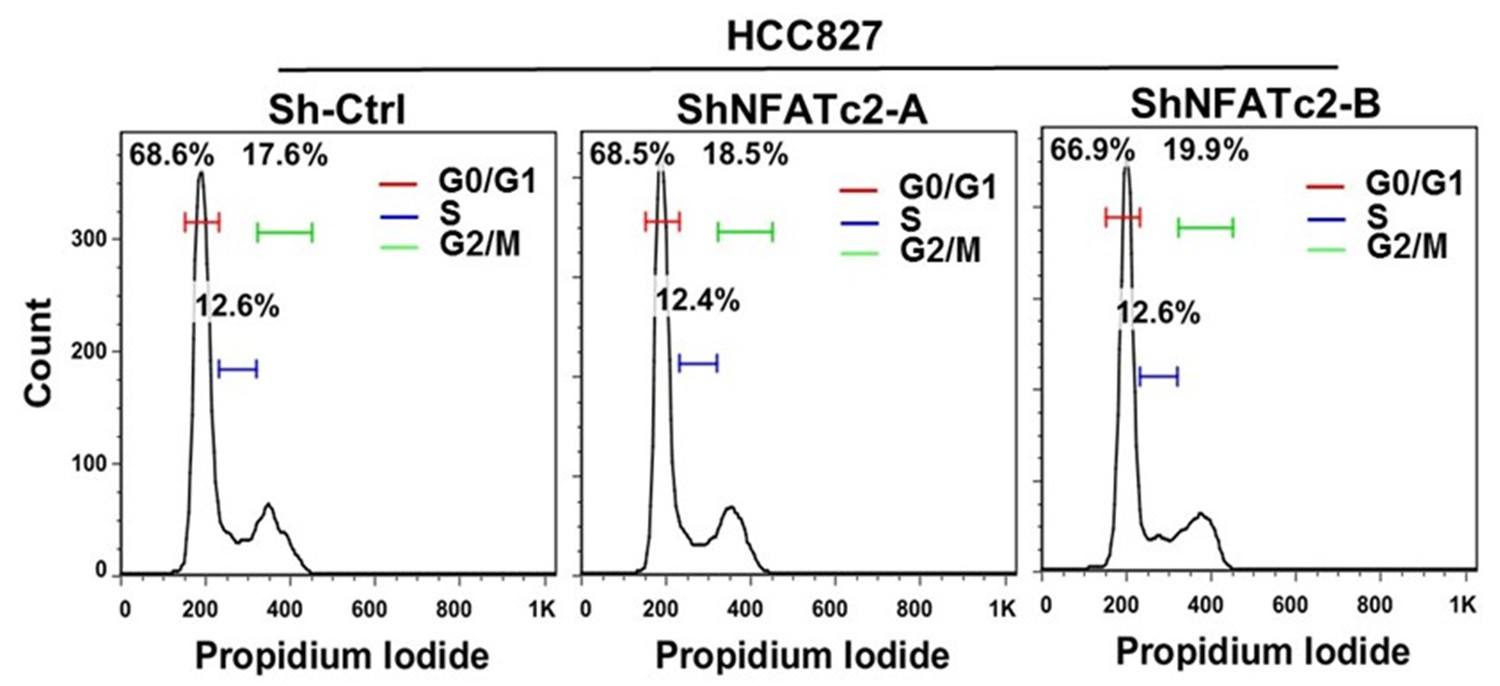
NFATc2 knockdown did not affect cell cycle progression of HCC827 cells.
Representative views of cell cycle distribution of HCC827 cells with or without stable NFATc2 knockdown analyzed by flow cytometry.
Figure 3 with 1 supplement
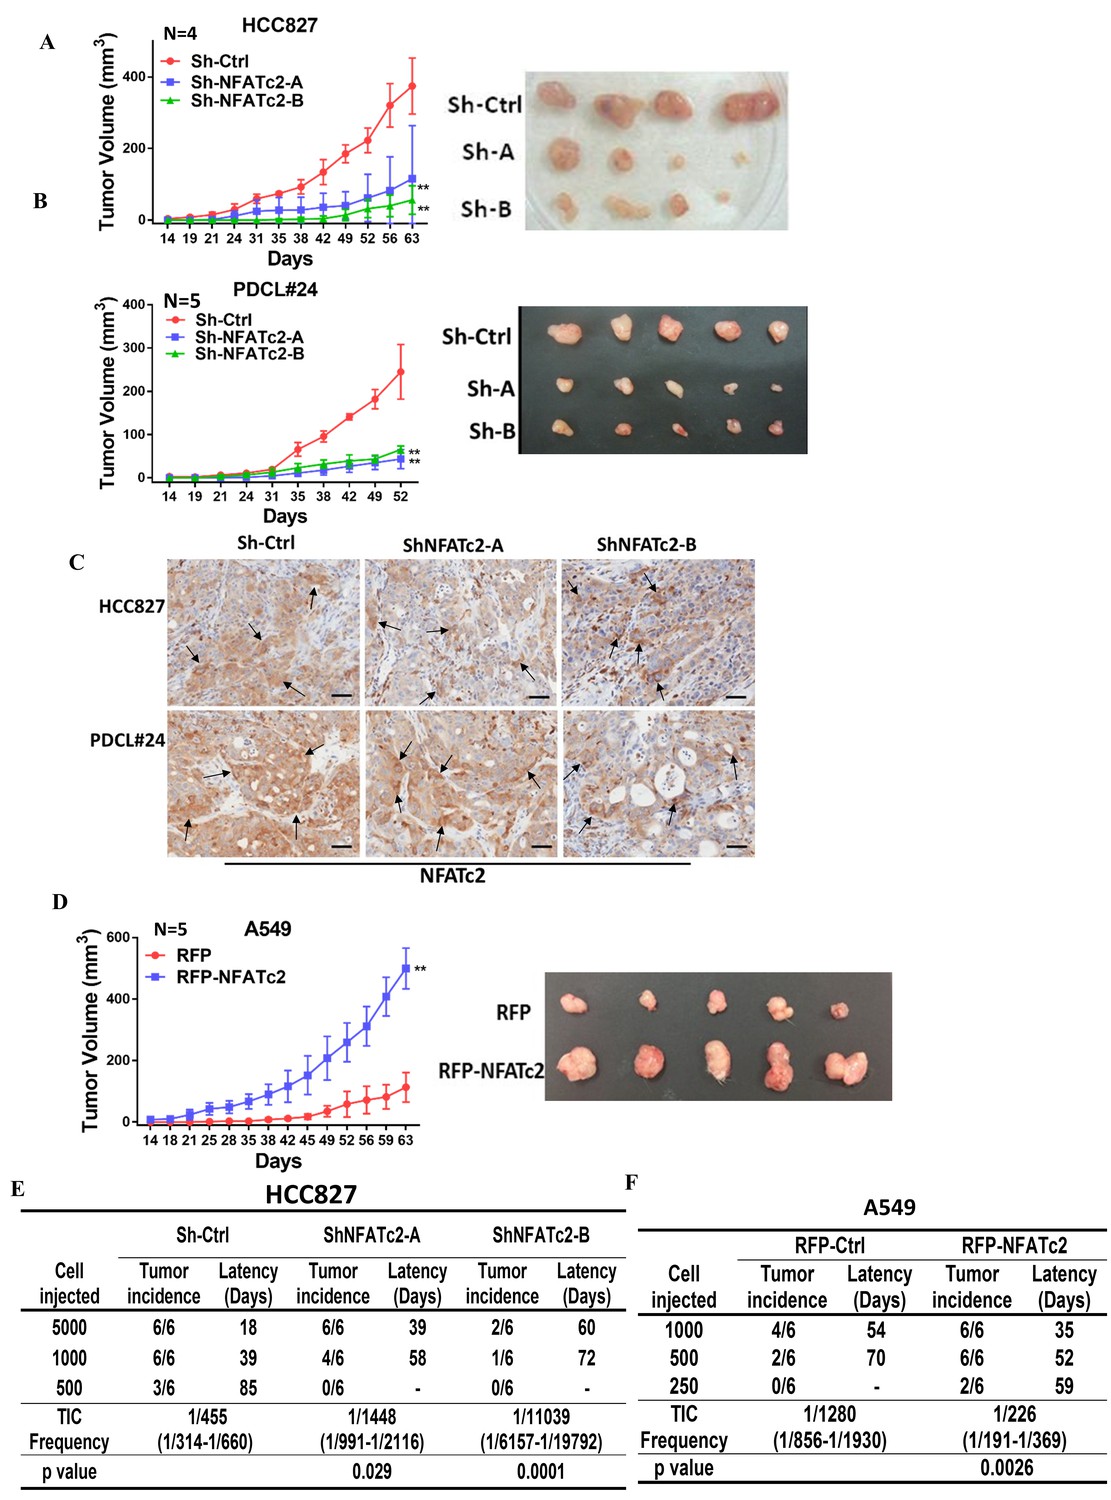
NFATc2 regulated tumorigenesis in vivo.
(A–B) 1 × 10⁴ of HCC827 cells (A), and PDCL#24 cells (B), respectively, were subcutaneously inoculated into the flanks of SCID mice, and tumor volumes were monitored. Representative tumor images and tumor growth curves are shown. **p<0.0001, comparison with respective control by two-way ANOVA. Error bar indicates the mean ±SD of tumor volumes of mice as indicated. (C) NFATc2 expression by IHC in xenografts generated from HCC827 or PDCL#24 cells, respectively, with or without NFATc2 knockdown. Tumor cells at the tumor/stroma interface (arrows) showed stronger NFATc2 expression, possibly due to micro-environmental induction. Scale bars, 50 µm. (D) 1 × 10⁴ of A549 cells with or without NFATc2 overexpression were subcutaneously injected into SCID mice, and tumor volumes were monitored. Representative tumor images and tumor growth curves are shown. **p<0.0001, comparison with control by two-way ANOVA. Error bar indicates the mean ±SD of tumor volumes of mice as indicated. (E–F) Limiting dilution assay in vivo. Indicated numbers of HCC827 cells (E), and A549 cells (F) were subcutaneously inoculated into SCID mice, and the tumor incidence and latency were monitored for 3 months. The TIC frequency and P values were calculated using the L-Calc software (Stemcell Tech, Vancouver, Canada, http://www.stemcell.com).
-
Figure 3—source data 1
Statistical analyses for Figure 3A,B and D.
- https://doi.org/10.7554/eLife.26733.010
Figure 3—figure supplement 1

NFATc2 regulated in vivo tumorigenesis.
(A–B) Xenografts of HCC827 cells with stable NFATc2 knockdown (A), and of A549 cells with NFATc2 over-expression (B) used for limiting dilution assays.
Figure 4 with 3 supplements

NFATc2 promoted resistance to cytotoxic and targeted therapy.
(A) Effect of NFATc2 knockdown on cisplatin response of PDCL#24 cells by MTT assay. (B) Effect of CSA or FK506 treatment on cisplatin response of HCC827 cells by MTT assay. (C) Effect of NFATc2 overexpression on cisplatin response of A549 cells by MTT assay. *p<0.05, **p<0.01 versus control by t-test. (D) In vivo effect of NFATc2 knockdown on cisplatin response of PDCL#24 xenografts. 1 × 10⁶ of PDCL#24 cells were subcutaneously inoculated into the flanks of Nude mice. Nude mice bearing subcutaneous xenografts were randomly separated into two groups and treated with intraperitoneal injections of cisplatin (4 mg/kg every three days) or saline control, respectively. Xenografts were photographed and histograms of tumor volumes were compared to vector and no-treatment controls. *p<0.05, **p<0. 01 by t-test. Error bar indicates the mean ±SD of tumor volumes of five mice. (E) NFATc2 expression by Western blot in A549 and corresponding cells with induced cisplatin-resistance (A549 CR) with or without NFATc2 knockdown. (F) Effects of NFATc2 knockdown on cisplatin sensitivity by MTT assays in A549 and A549 CR cells. ##p<0.01, versus vector control of parental cells, **p<0.01 versus CR Sh-Ctrl by t-test. (G–H) Dose response curves of gefitinib treatment by MTT assays of HCC827 cells with NFATc2 knockdown (G), or knockout (H). (I) Dose response curves of gefitinib treatment by MTT assays of HCC827 cells in the presence of CSA or FK506 for 72 hr. For G-I: **p<0.01 versus control by t-test. (J) Effects of NFATc2 stable knockdown on response of HC827 xenografts to gefitinib. 1 × 10⁶ of HCC827 cells were subcutaneously inoculated into the flanks of Nude mice. Nude mice bearing subcutaneous xenografts were randomly separated into two groups and treated with gefitinib (25 mg/kg/day by oral gavage) or 1% Tween 80 as control. *p<0.05, **p<0. 01 by t-test. Error bar indicates the mean ±SD of tumor volumes of six mice. (K and L) NFATc2 expression with or without NFATc2 knockdown by Western blot (K), and NFAT activity by luciferase reporter assay (L), in HCC827 parental and gefitinib-resistant (GR) cells. (M) Gefitinib sensitivity of HCC827GR cells treated with CSA or with NFATc2 knockdown analyzed by MTT assays. **p<0.01 versus control by Student’s t-test. For all MTT assays, error bar indicates mean ±SD for at least three replicates.
-
Figure 4—source data 1
Statistical analyses for Figure 4D and J, Figure 4—figure supplement 1B and 3A.
- https://doi.org/10.7554/eLife.26733.013
Figure 4—figure supplement 1
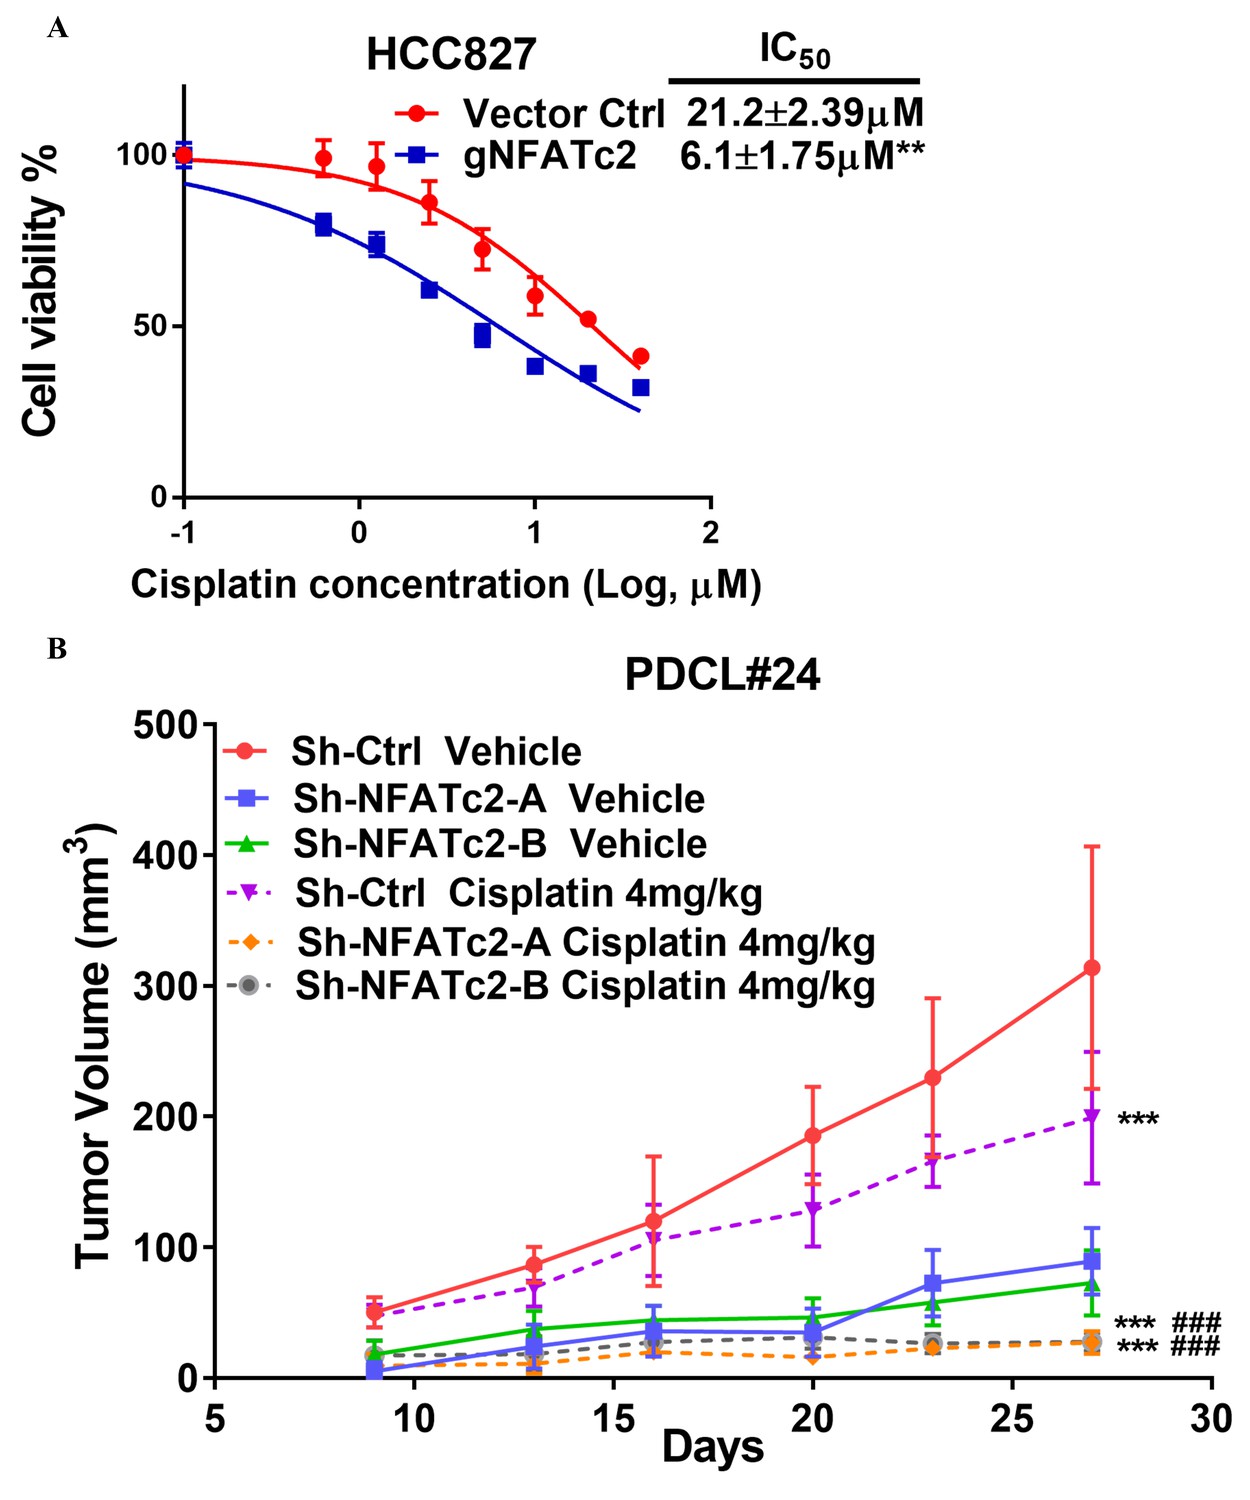
NFATc2 promoted cancer cell resistance to cisplatin treatment.
(A) Cisplatin sensitivity of HCC827 cells with NFATc2 knockout analyzed by MTT assay. **p<0.01, comparison with control by t-test. Error bar indicates the mean ±SD for three independent replicates. (B) Growth curve showing in vivo cisplatin response of PDCL#24 xenografts with or without NFATc2 knockdown. ***p<0.0001 versus respective vehicle groups, ###p<0.0001 versus cisplatin treated Sh-Ctrl group by two-way ANOVA. Error bar indicates the mean ±SD of tumor volumes of five mice.
Figure 4—figure supplement 2
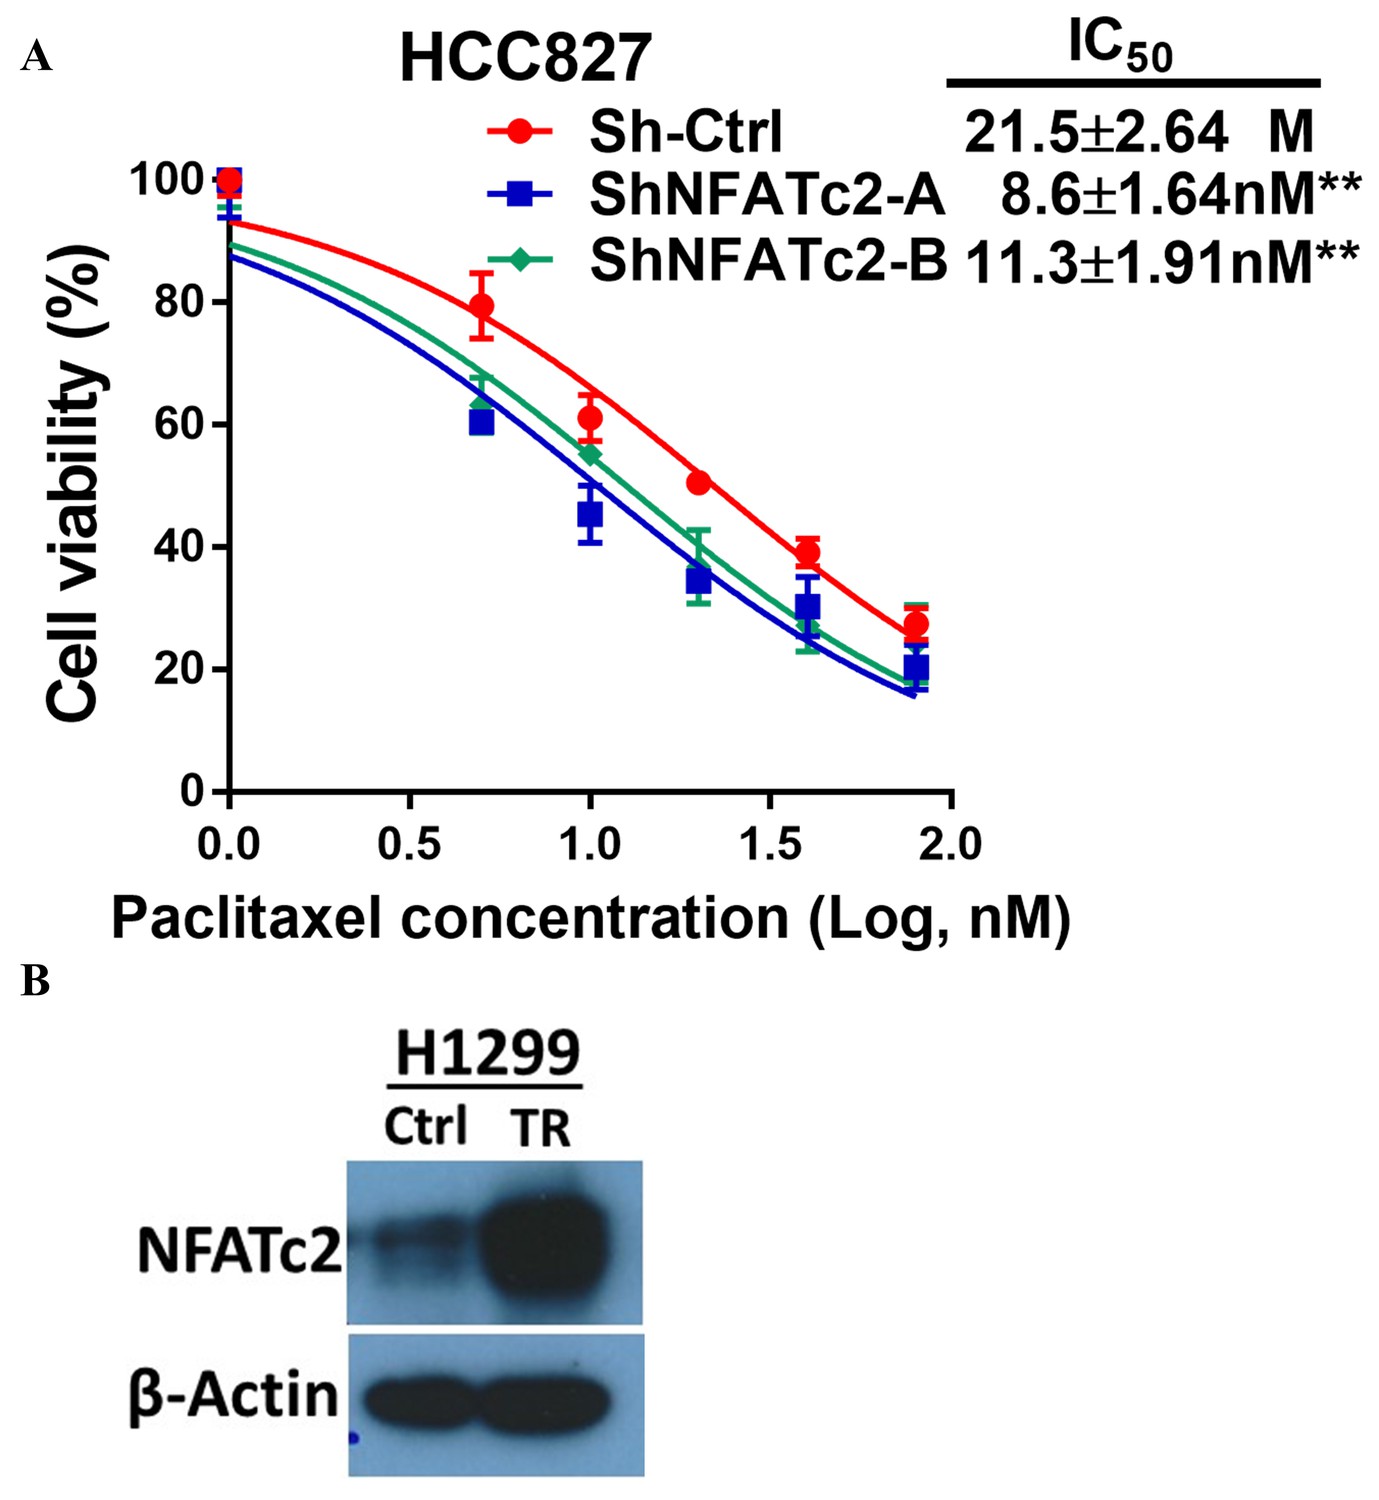
NFATc2 promoted cancer cell resistance to paclitaxel treatment.
(A) Paclitaxel sensitivity analyzed by MTT assay in HCC827 cells with NFATc2 knockdown. **p<0.01, comparison with control by t-test. Error bar indicates the mean ±SD for three independent replicates. (B) NFATc2 expression analyzed by Western blot in H1299 parental and paclitaxel resistant (TR) cells.
Figure 4—figure supplement 3
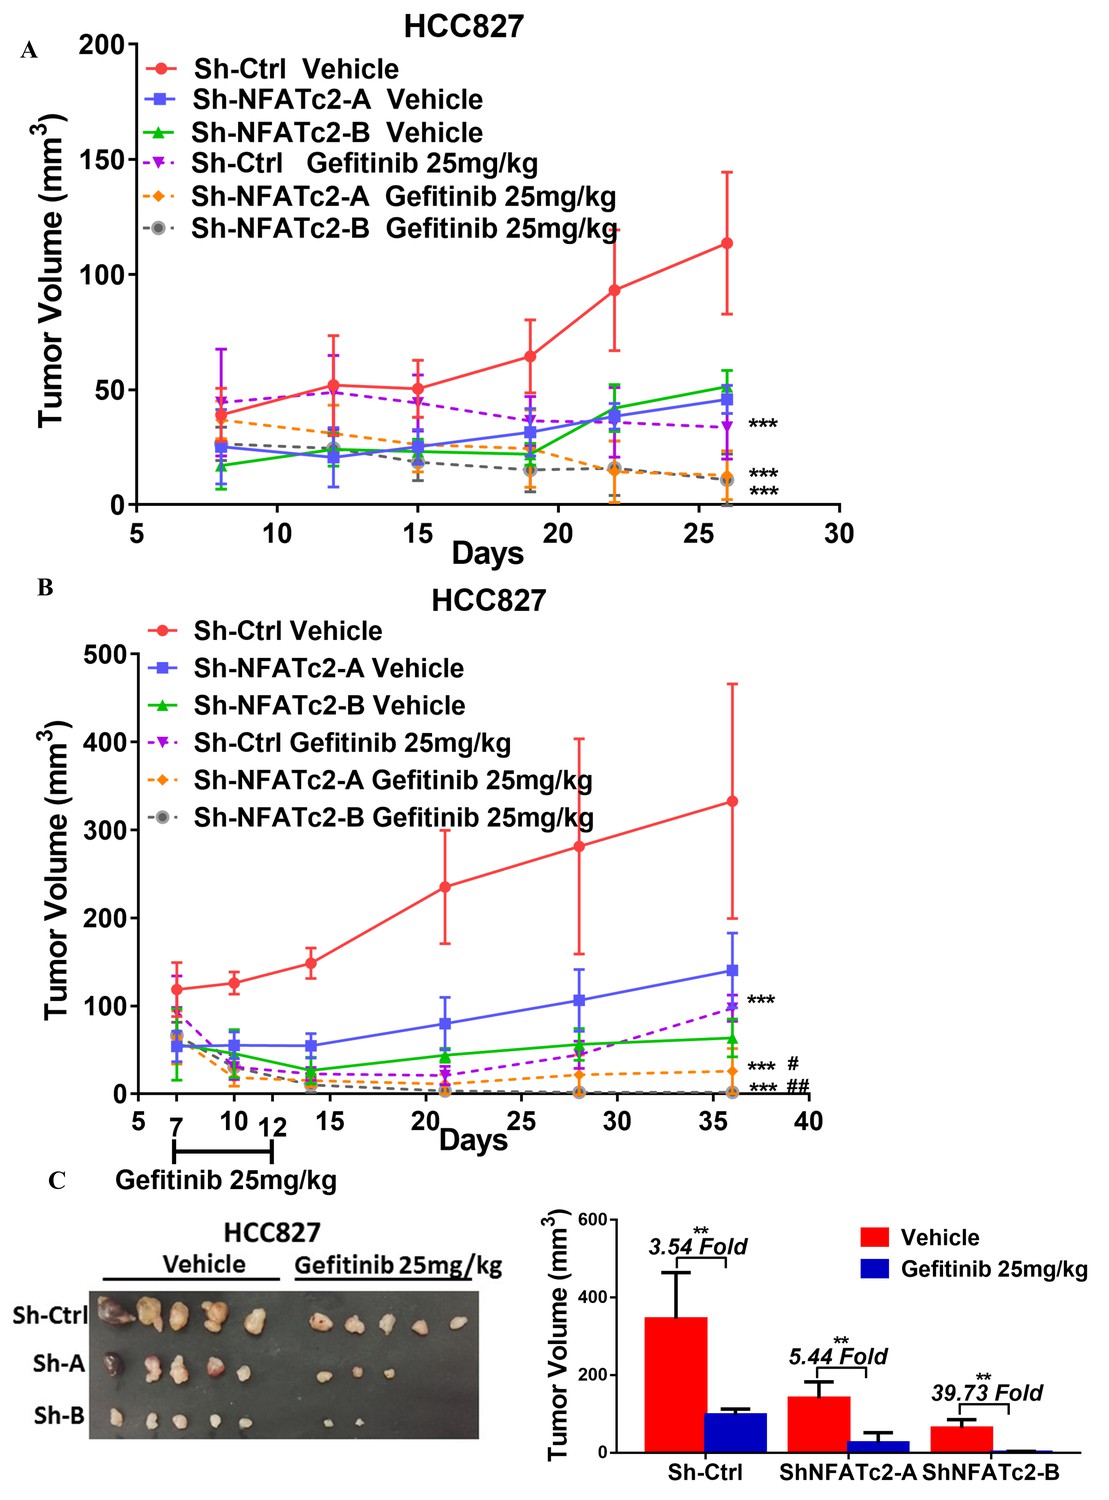
NFATc2 promoted cancer cell resistance to gefitinib treatment.
(A) Growth curve showing in vivo gefitinib response of HCC827 xenografts with or without NFATc2 knockdown. Nude mice bearing subcutaneous xenografts derived from 1 × 10⁶ cells were randomly assigned to two groups and treated with gefitinib or 1% Tween 80 as control. Gefitinib (25 mg/kg/day by oral gavage) was administered for 2 cycles of 5 treatment days followed by 2 rest days per week. (B) Effects of NFATc2 stable knockdown on response of HC827 xenografts to short term gefitinib treatment. Nude mice bearing subcutaneous xenografts derived from 2.5 × 10⁶ cells were randomly assigned to 2 groups and treated with gefitinib (25 mg/kg/day by oral gavage) or 1% Tween 80 as control for 5 consecutive days. Tumors were then allowed to grow for three weeks without treatment. ***p<0.0001 versus respective vehicle control, #p<0.05, ##p<0.01 versus cisplatin treated Sh-Ctrl group by two-way ANOVA. (C) Images of xenografts in (B) and histograms of tumor volumes compared to vector and no-treatment controls. **p<0.01 by t-test. Error bar indicates the mean ±SD of tumor volumes of the mice cohorts.
Figure 5 with 1 supplement
NFATc2 regulated SOX2 expression.
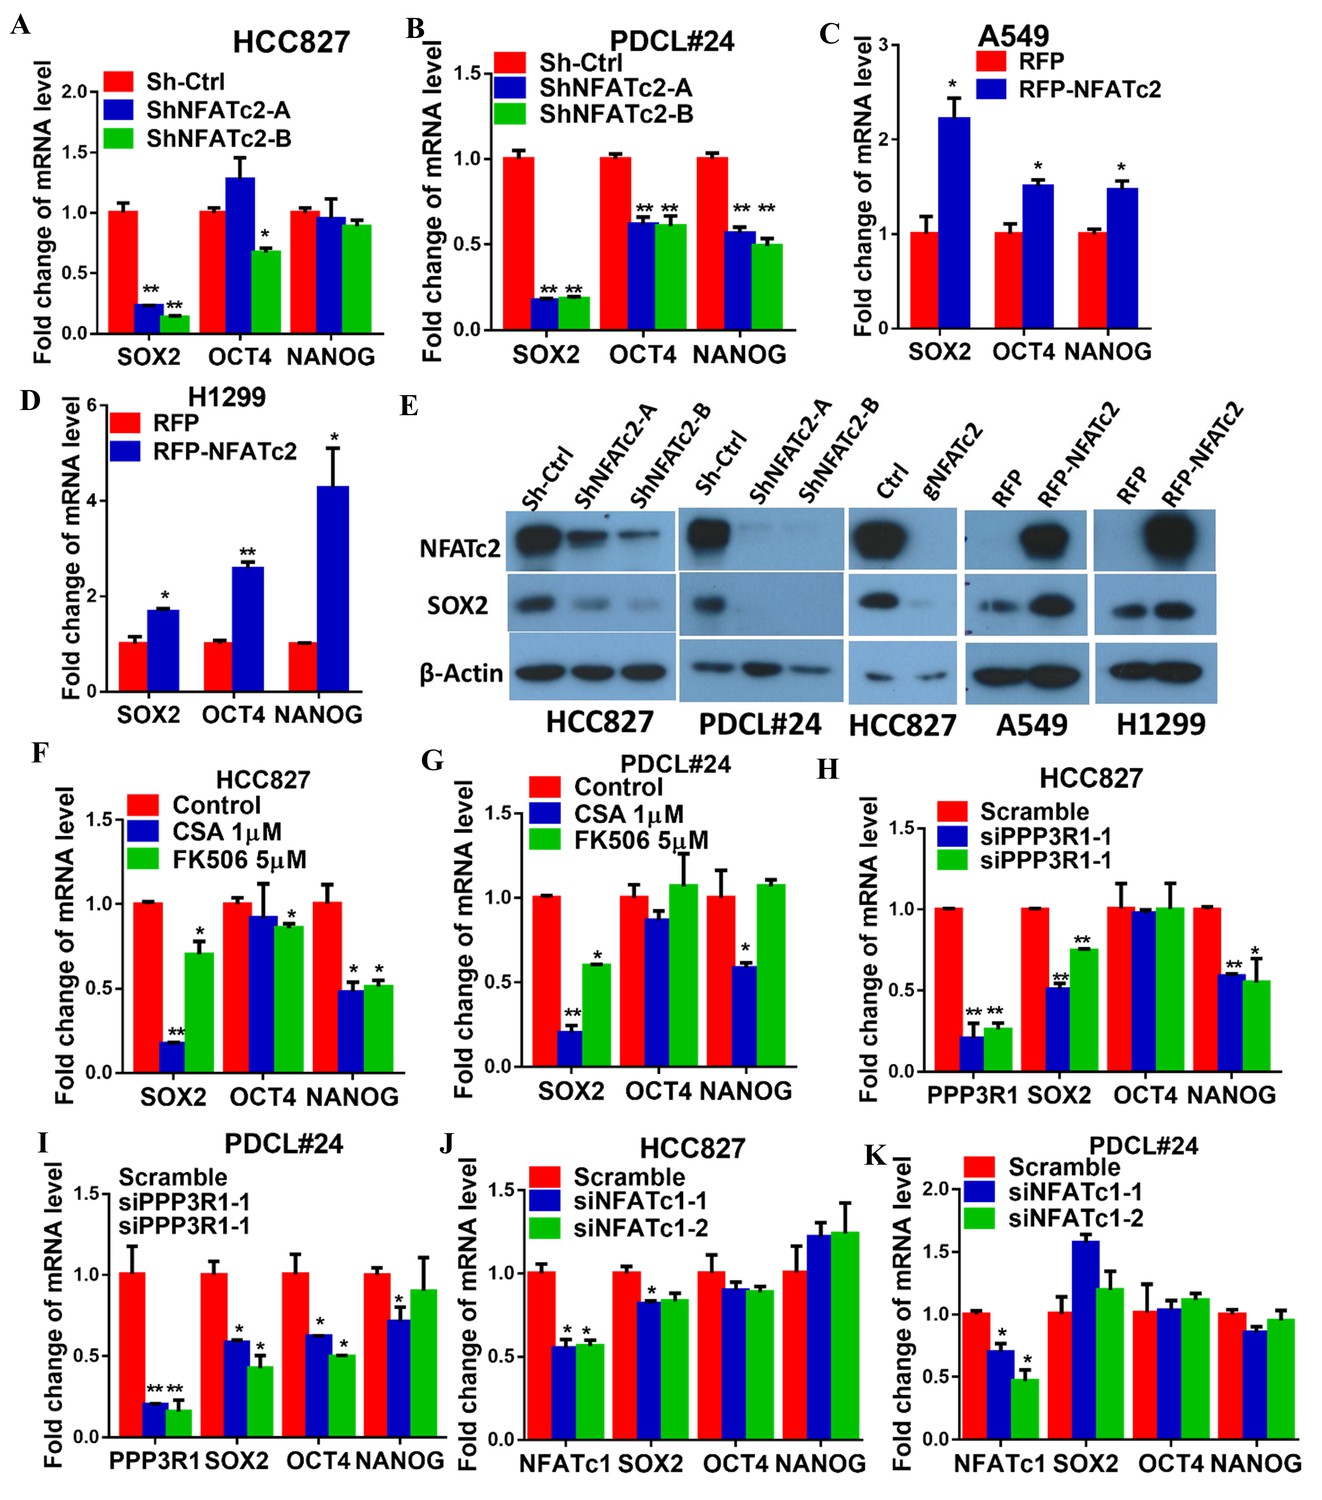
(A–D) Pluripotency genes expressions analyzed by qPCR in HCC827 (A), PDCL#24 (B), A549 (C), and H1299 cells (D) with NFATc2 knockdown or overexpression. (E) Effects of stable NFATc2 knock-down, knockout or overexpression on SOX2 expression in respective lung cancer cells by Western blot analysis. (F–G) Pluripotency genes expression analyzed by qPCR in HCC827 (F), and PDCL#24 cells (G) treated with CSA or FK506, respectively, for 24 hr. (H–I) Effects of transient knockdown of PPP3R1 on pluripotency gene expressions analyzed by qPCR in HCC827 (H) and PDCL#24 cells (I). (J–K) Effects of transient knockdown of NFATc1 on pluripotency gene expressions analyzed by qPCR in HCC827 (J) and PDCL#24 cells (K). *p<0.05, **p<0.01 versus control by t-test. Error bar indicates the mean ±S.D. for at least three independent replicates.
Figure 5—figure supplement 1
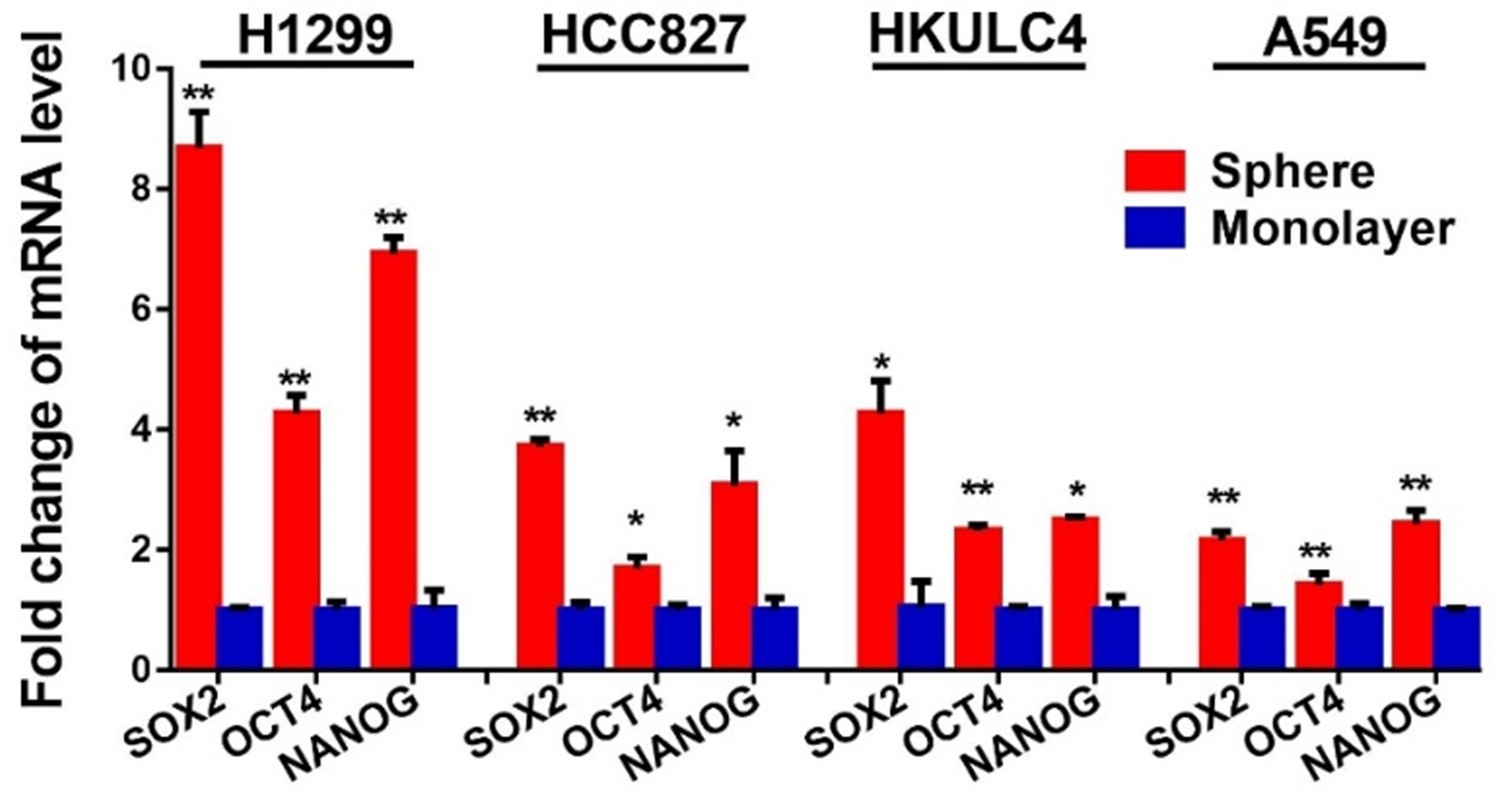
NFATc2 knockdown did not affect cell cycle progression of HCC827 cells.
Expression of pluripotency factors in tumorspheres was analyzed by qPCR and normalized to monolayer non-TIC of indicated cell lines. *p<0.05, **p<0.01 versus control by t-test. Error bar indicates the mean ±S.D. for three replicates.
Figure 6 with 1 supplement
NFATc2 regulated tumor functions through trans-activating SOX2 expression.
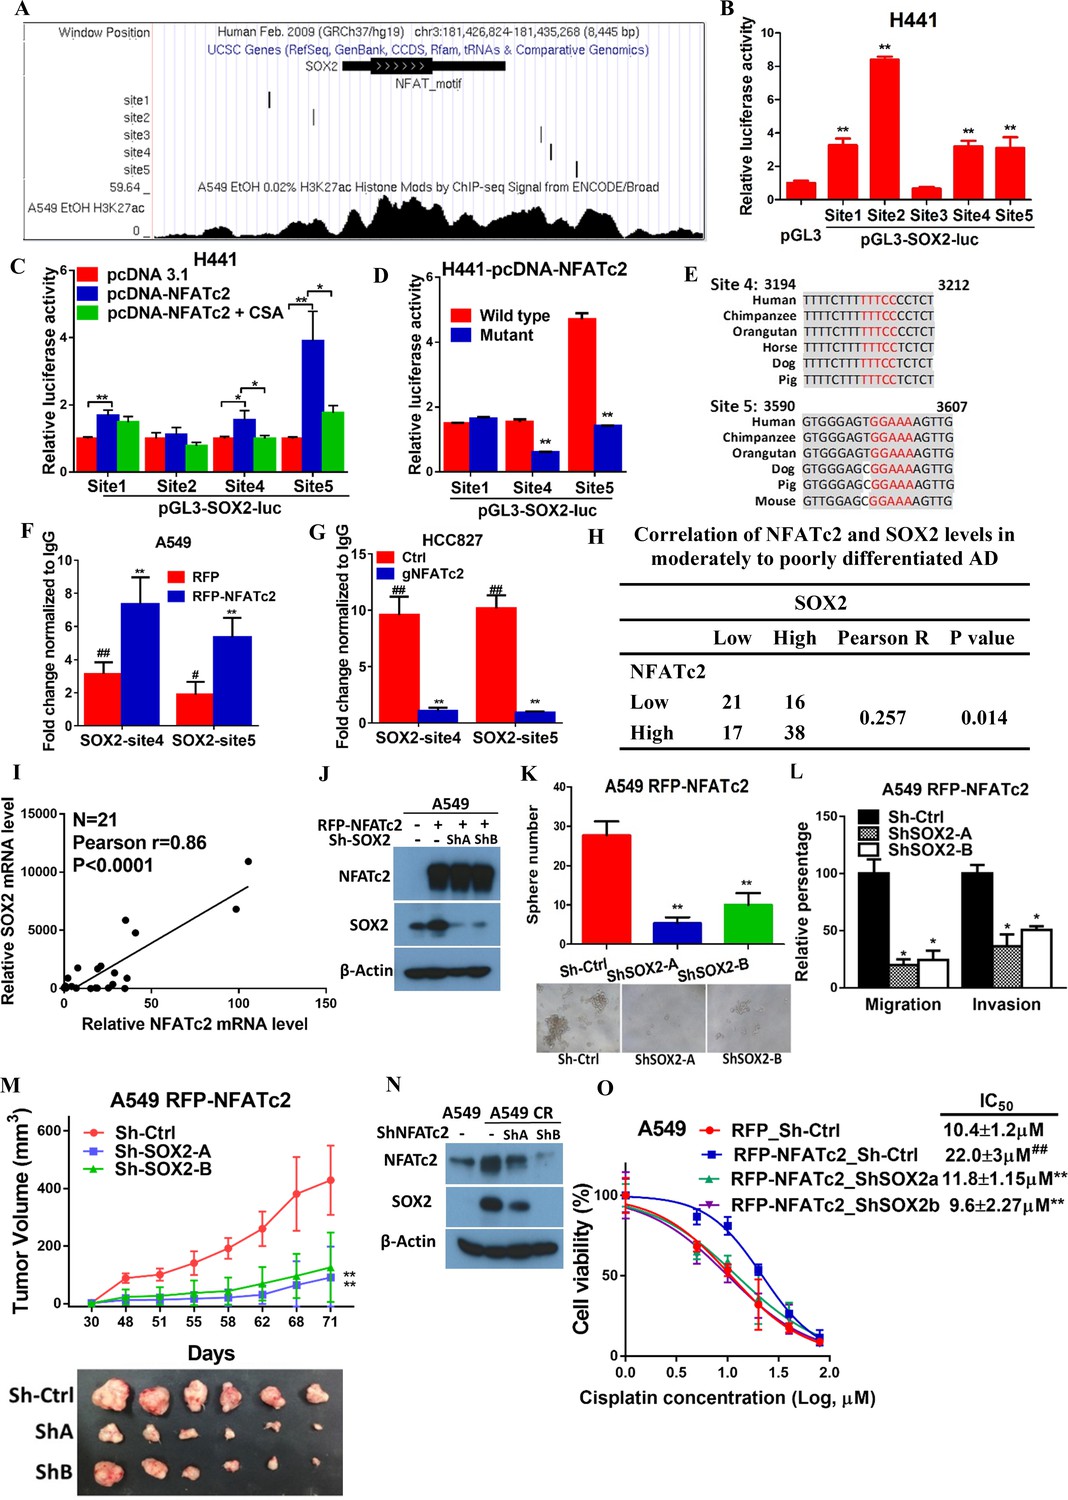
(A) Genome browser view of NFAT binding sites and H3K27Ac marks (lowest panel) on SOX2 regulatory regions (regions 2 and 3 indicated in Figure 6—figure supplement 1) analyzed in A549 cells. (B) Transcriptional activities of sites 1–5 by dual luciferase reporter assays in H441 cells. (C) Transcriptional activities of the indicated putative NFAT binding sites by respective luciferase reporters in H441 cells with transient NFATc2 over-expression, with or without CSA treatment. (D) Effects of site-directed mutagenesis of the indicated putative NFAT binding sequences by respective luciferase reporter assays in H441 cells with transient NFATc2 overexpression. For B-D, *p<0.05, **p<0.01 versus control by t-test. Error bar indicates the mean ±S.D. for at least three independent replicates. (E) Alignment of sites 4 and 5 genomic sequences showing highly homologous regions (gray) in different mammalian species, with putative NFAT binding sites highlighted in red. (F–G) ChIP–qPCR assays of NFATc2 binding to the indicated SOX2 sites in A549 cells with or without stable NFATc2 overexpression (F), or HCC827 cells with or without NFATc2 knockout (G). #p<0.05, ##p<0.01 versus IgG control,m **p<0.01 versus vector control by t-test. Error bar indicates the mean ±S.D. for at least three independent replicates. (H) Correlation of immunohistochemical expressions of NFATc2 and SOX2 in 92 moderately to poorly differentiated human lung adenocarcinoma by χ2-test. Pearson R, Pearson correlation coefficient. (I) Correlation of mRNA levels of SOX2 and NFATc2 in a panel of lung AD cell lines analyzed by q-PCR and Pearson correlation test. (J) Expression of NFATc2 and SOX2 in A549 cells with or without NFATc2 overexpression and SOX2 stable knockdown by Western blot. (K–L) Effect of SOX2 knockdown on tumorsphere formation (K), cell migration and invasion ability (L), of A549 cells with NFATc2 overexpression. *p<0.05, **p<0.01 versus control by t-test. Error bars indicate the mean ±SD for at least three independent replicates. (M) In vivo tumorigenicity of A549 cells with NFATc2 overexpression and SOX2 knockdown by subcutaneous inoculation of 1 × 10⁴ cells in SCID mice. **p<0. 0001 versus control by two-way ANOVA. Error bar indicates the mean ±SD of tumor volumes of six mice. (N) Effect of NFATc2 knockdown on SOX2 expression in A549 CR cells analyzed by immunoblot. (L) Effect of SOX2 knockdown on cisplatin sensitivity by MTT assay of A549 cells with NFATc2 overexpression. ##p<0.01, versus vector control, **p<0.01 versus RFP-NFATc2_Sh-Ctrl by t-test. Error bar indicates the mean ±SD for at least three independent replicates.
-
Figure 6—source data 1
Statistical analyses for Figure 6F and I.
- https://doi.org/10.7554/eLife.26733.020
Figure 6—figure supplement 1

NFATc2 regulated SOX2 expression through binding to 3’ regulatory regions.
(A) Computational prediction of NFAT binding sites (marked in red) on 5’ and 3’ SOX2 regulatory regions (Region 1 to 4). TSS: transcription start site. (B) Transcriptional activities of the respective SOX2 regions 1–4 of H441 cells analyzed by luciferase reporter assays. *p<0.05, **p<0.01 versus control by Student’s t-test. Error bars indicate the mean ±SD for at least three independent replicates. (C–D) Luciferase reporter activities of mutant or wild-type SOX2 reporters of A549 (C), or H1299 cells (D), with or without NFATc2 stable overexpression. *p<0.05, **p<0.01, comparison with RFP; # p<0.05, ##p<0.01, wild type versus mutant in RFP-NFATc2 cells by t-test. Error bars indicate the mean ±SD for at least three independent replicates.
Figure 7 with 4 supplements

ALDH1A1 was a target of NFATc2/SOX2 coupling.
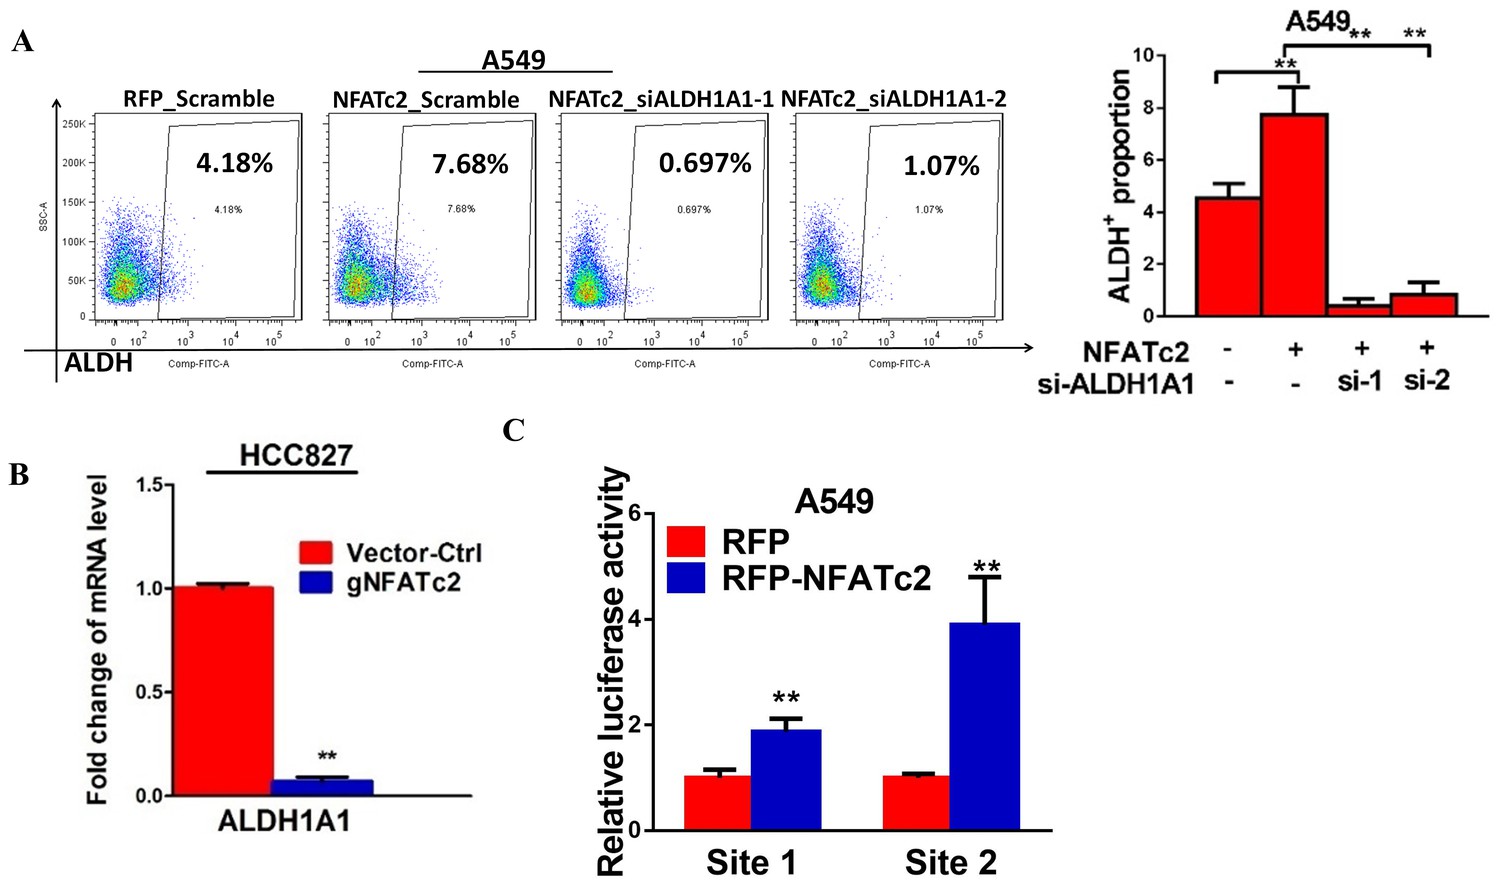
(A–D) Effects on ALDH+, CD44+ and ALDH+/CD44+ cell populations by flow cytometry analysis of HCC827 with NFATc2 knockdown (A), NFATc2 knockout (B), or NFATc2 inhibition by CSA or FK506 (C), and of A549 cells with NFATc2 overexpression (D). (E–H) Effects on ALDH1A1 mRNA expression by qPCR analysis of cancer cells with NFATc2 knockdown (E), NFATc2 inhibition by CSA or FK506 (F), NFATc2 up-regulation (G), or of A549 with induced cisplatin resistance (H). (I) Effects of SOX2 knockdown on ALDH+, CD44+ and ALDH+/CD44+ cell populations by flow cytometry in A549 with NFATc2-overexpression. (J) Expression of SOX2 and ALDH1A1 transcripts in A549 cells with NFATc2 overexpression and SOX2 knockdown. (K) Representative images of A549 xenografts with or without NFATc2 overexpression immunohistochemically stained for NFATc2, SOX2 and ALDH1A1, respectively. Scale bars, 50 µm. (L) Conserved SOX2 binding sequences (ATTCA) at ALDH1A1 enhancer region by ChIP-seq of PDCL#24 cells, aligned with homologous mammalian sequences and H3K27Ac peaks of A549 cells from published databases. (M) Detection of endogenous SOX2 binding to ALDH1A1 sites by ChIP–qPCR analysis in PDCL#24 cells. (N) Luciferase reporter activities at sites 1 and 2 of ALDH1A enhancer region by dual luciferase reporter assay in A549 cells with SOX2 overexpression. (O–P) Effects of transient ALDH1A1 suppression on A549 with upregulated NFATc2 with respect to invasion and migration (O), and cisplatin sensitivity. ##p<0.01, versus RFP_Scramble by t-test. (P). (Q) Correlation between ALDH1A1 and SOX2 expressions by IHC in human lung adenocarcinomas by χ2-test. *p<0.05, **p<0.01 versus control by t-test. Error bar indicates the mean ±S.D. for at least three independent replicates.
-
Figure 7—source data 1
Statistical analyses for Figure 7A,B,I and M.
- https://doi.org/10.7554/eLife.26733.023
Figure 7—figure supplement 1

NFATc2 regulated ALDH activity.
(A–C) Flow cytometry analysis of ALDH/CD44 distribution in PDCL#24 cells with stable NFATc2 knockdown (A), A549 cells with NFATc2 overexpression (B), or A549CR compared to parental cells (C). *p<0.05, **p<0.01 versus control by t-test. Error bars indicate the mean ±SD for at least three independent replicates.
Figure 7—figure supplement 2
NFATc2 regulated ALDH1A1.
(A) ALDH+ proportions analyzed by flow cytometry in A549 cells with NFATc2 overexpression and transient ALDH1A1 knockdown. (B) mRNA level of ALDH1A1 analyzed by qPCR in HCC827 cells with NFATc2 knockout. (C) Luciferase reporter activities for site1 and 2 of A549 cells with or without NFATc2 overexpression. **p<0.01 versus control by t-test. Error bars indicate the mean ±SD for at least three independent replicates.
Figure 7—figure supplement 3
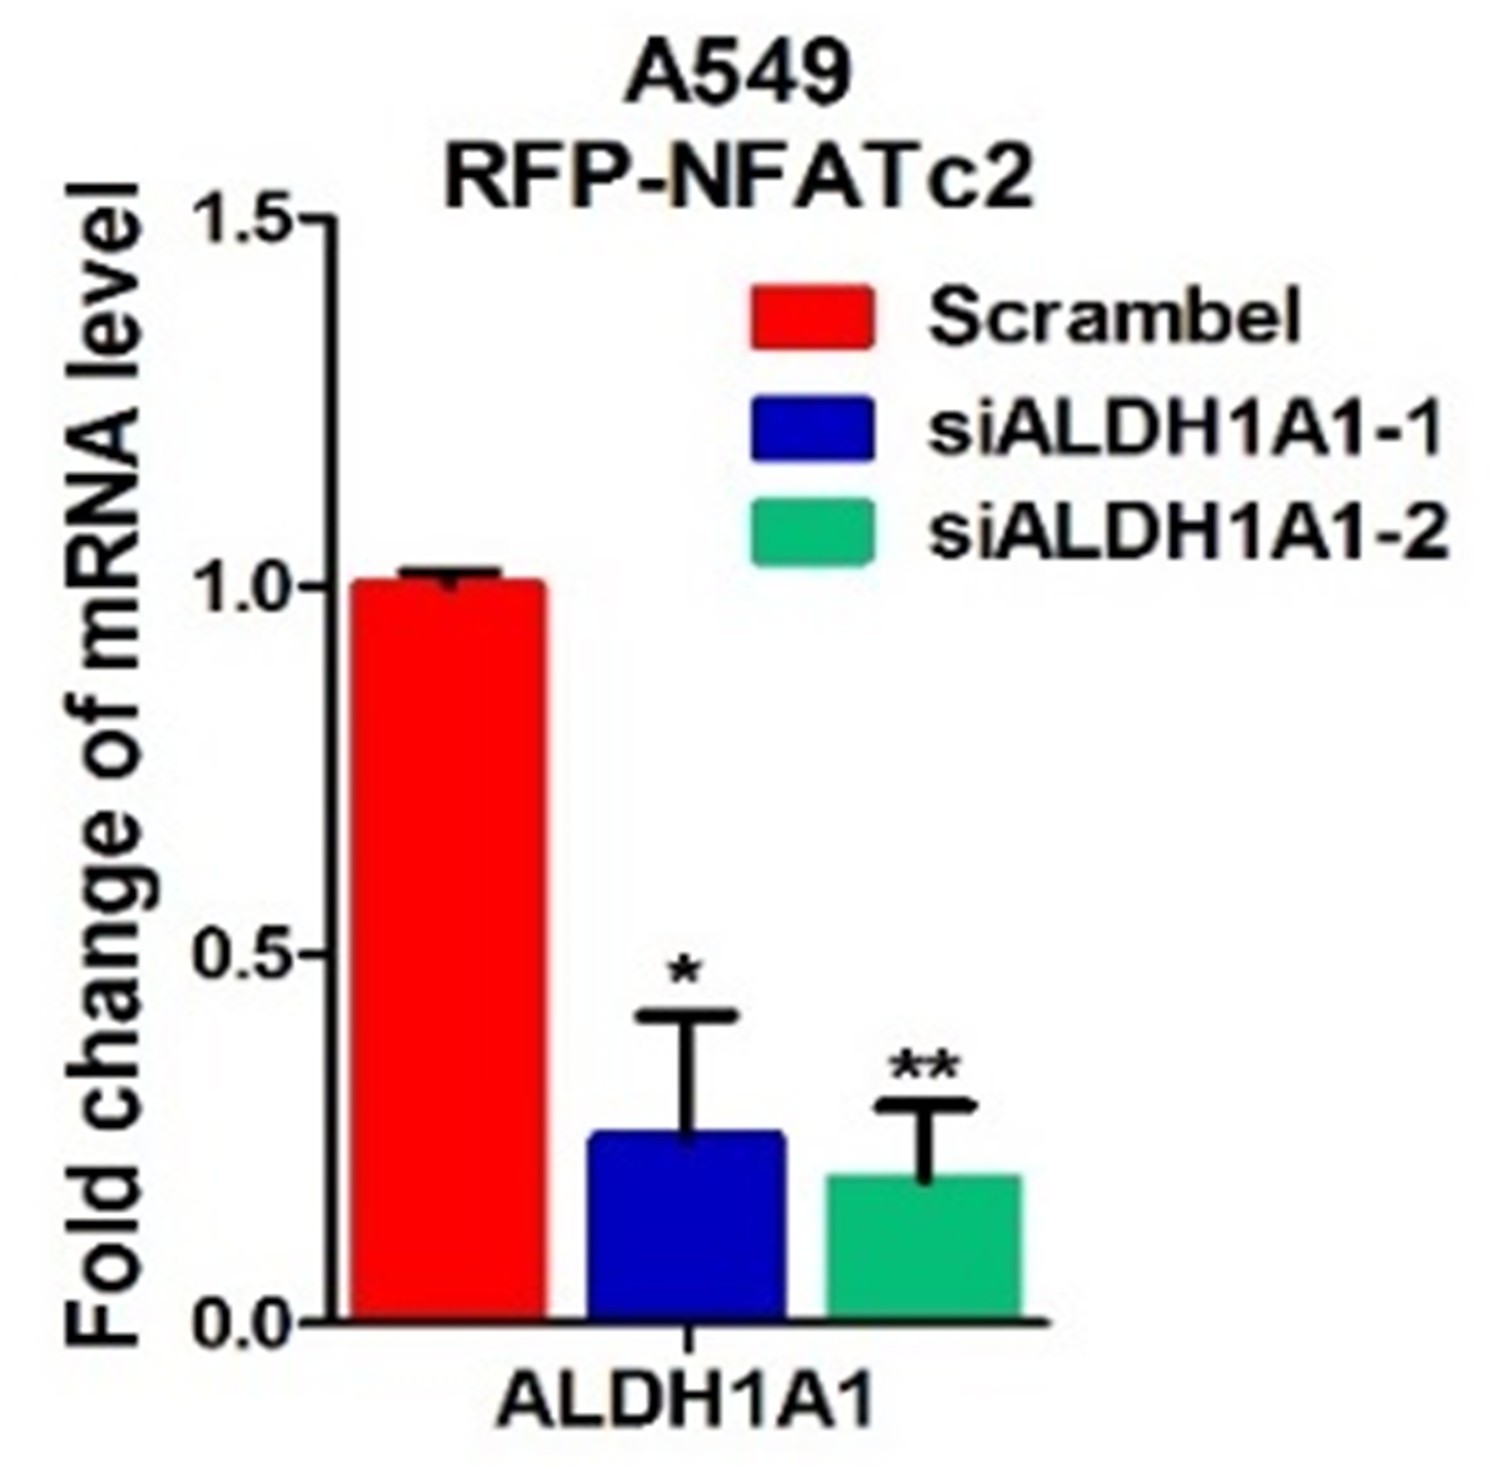
Effect of siALDH1A1 on ALDH1A1 expression.
Analysis of ALDH1A1 expression by qPCR in A549 cells with ectopic NFATc2 expression and ALDH1A1 knockdown. **p<0.01 versus control by t-test. Error bar indicates the mean ±S.D. for 3 replicates.
Figure 7—figure supplement 4
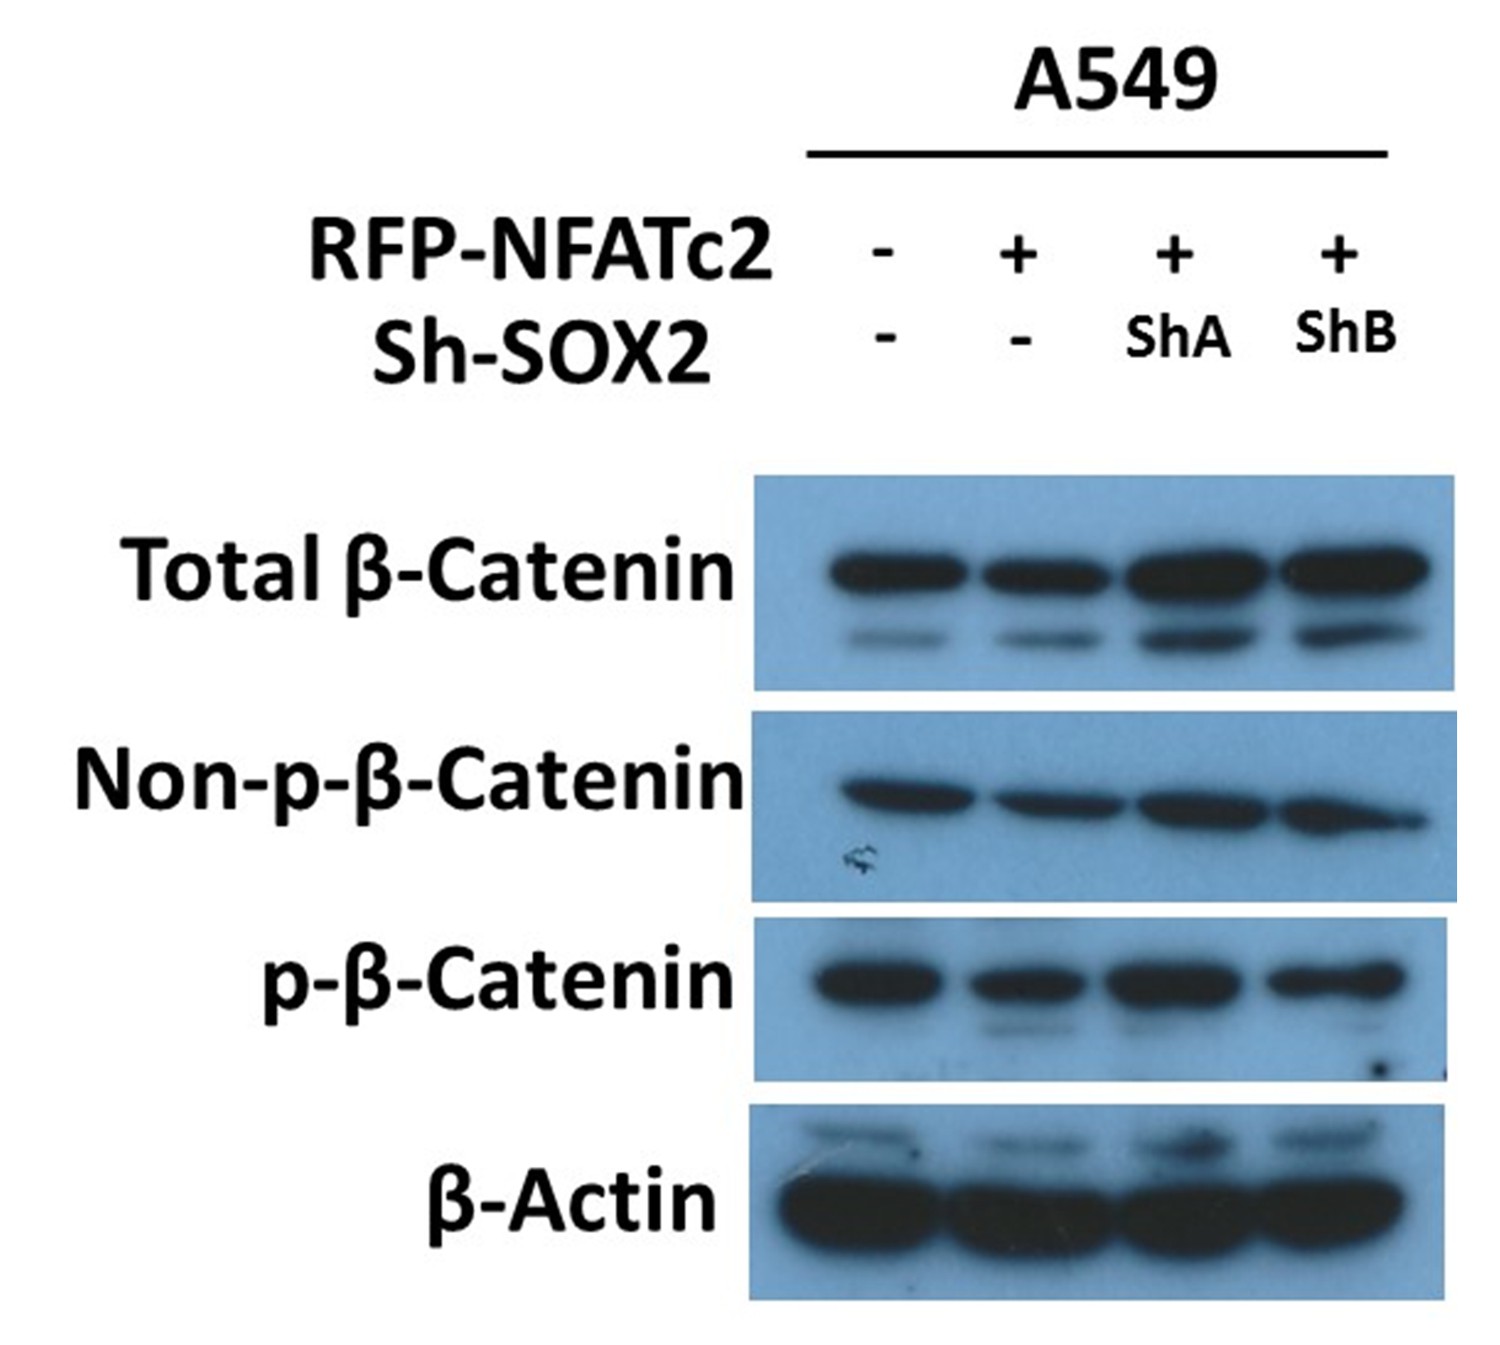
Effect of NFATc2/SOX2 on β-catenin activity.
Expressions of total β-catenin, active β-catenin (non-phosphorylated), and phosphorylated β-catenin (p-β-catenin) analyzed by immunoblot in A549 with or without NFATc2 overexpression and SOX2 knockdown.
Figure 8
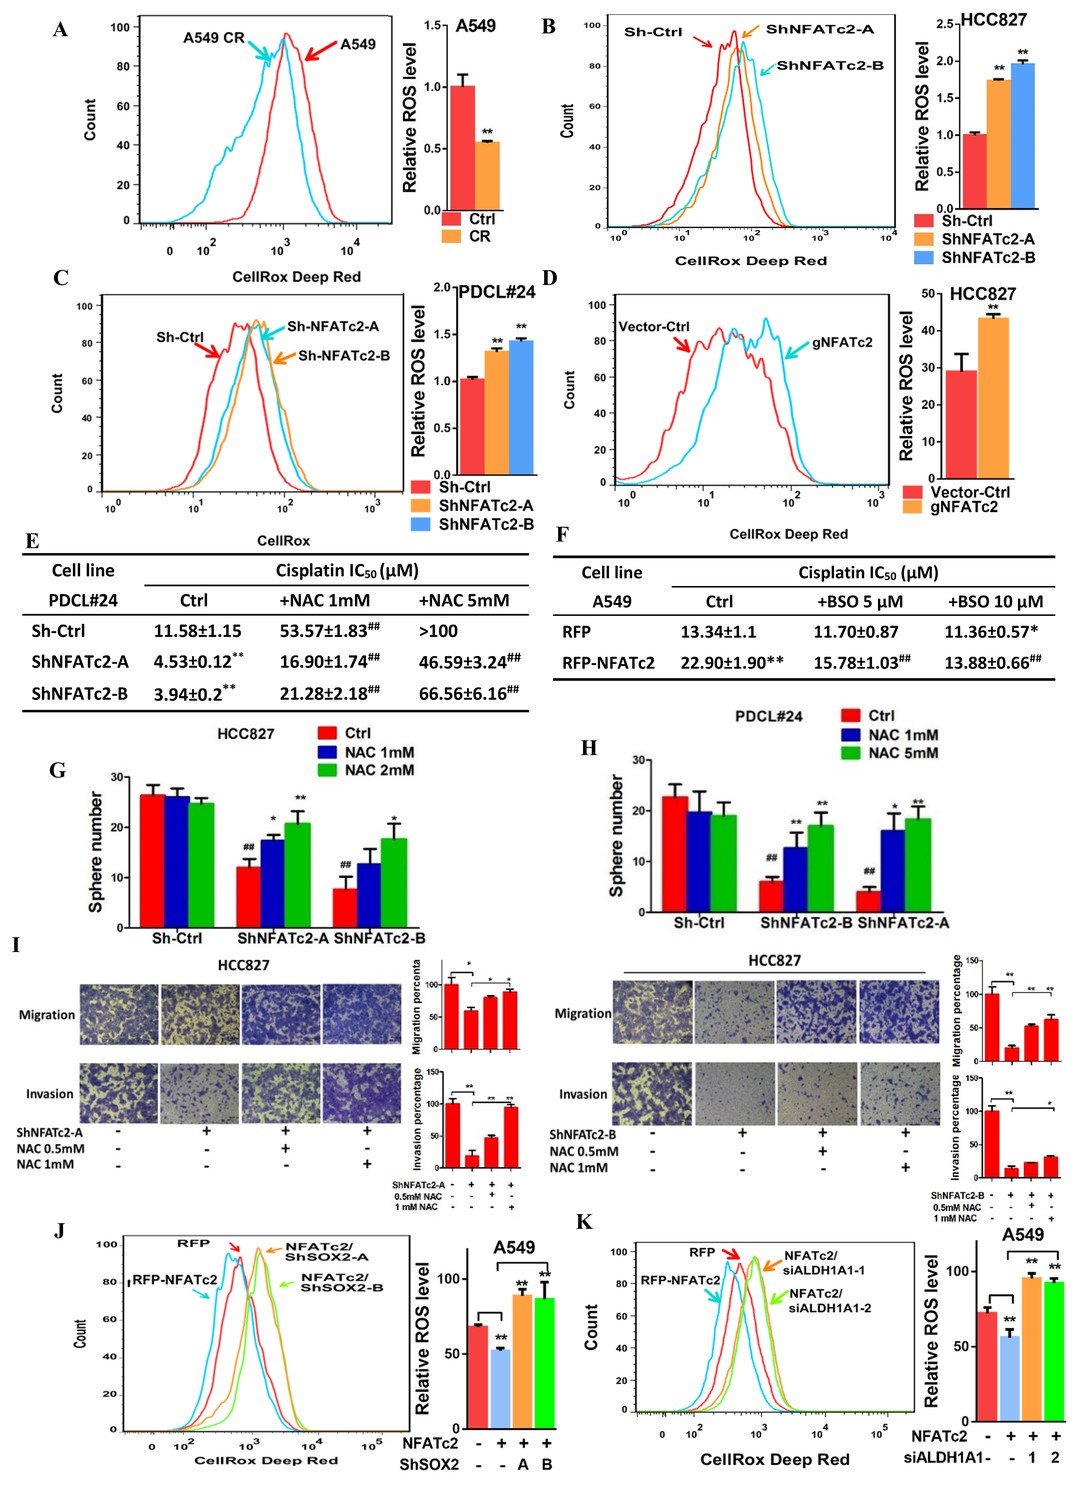
NFATc2 regulated TIC properties through ROS suppression.
(A) ROS levels detected by flow cytometry in A549 and A549 CR cells. (B–C) ROS levels in HCC827 cells (B) and PDCL#24 cells (C) with or without NFATc2 stable knockdown. (D) ROS levels in HCC827 cells with or without NFATc2 knockout. (E–F) Cisplatin sensitivity expressed as IC50 by MTT assays of NFATc2-silenced PDCL#24 cells treated with increasing doses of NAC (E), or NFATc2-overexpressing A549 cells treated with the oxidizing agent BSO (F), respectively. *p<0.05, **p<0.01 versus vector control without REDOX reagents; ##p<0.01 versus the corresponding treatment control by t-tests. Error bar indicates the mean ±S.D. for three independent replicates. (G–H) Effects of increasing doses of NAC on tumorsphere formation ability of HCC827 (G) cells and PDCL#24 cells (H). *p<0.05, **p<0.01 versus corresponding treatment controls, ##p<0.01 versus vector control by t-test. Error bar indicates the mean ±S.D. for three independent replicates. (I) Effects of increasing doses of NAC on cell migration and invasion of HCC827 cells with NFATc2 down-regulation by 2 sh-RNA knockdown sequences. (J–K) ROS levels in NFATc2-overexpressing A549 cells with stable SOX2 (J) or transient ALDH1A1 (K) knockdown. *p<0.05, **p<0.01 versus respective control by t-test. Error bar indicates the mean ±S.D. for at least three independent replicates.
-
Figure 8—source data 1
Statistical analyses for Figure 8A–D,J and K.
- https://doi.org/10.7554/eLife.26733.029
Tables
Table 1
Clinico-pathological correlation of NFATc2 in NSCLC patients.
| A. Clinico-pathological correlation of NFATc2 in NSCLC patients | |||
|---|---|---|---|
| NFATc2 | |||
| Clinico-pathological variables | Low | High | P value |
| Gender | |||
| Female | 22 | 11 | 0.328 |
| Male | 39 | 30 | |
| Age (Years) | |||
| ≤65 | 36 | 24 | 0.961 |
| >65 | 25 | 17 | |
| Smoking history | |||
| Non-smoker | 32 | 24 | 0.545 |
| Smoker | 29 | 17 | |
| Differentiation | |||
| Well to moderate | 45 | 21 | 0.019* |
| Poor | 16 | 20 | |
| Histologic type | |||
| Adenocarcinoma | 42 | 24 | 0.357 |
| Squamous cell carcinoma | 11 | 10 | |
| Others | 8 | 7 | |
| Tumor Stage | |||
| T1-T2 | 53 | 24 | 0.001* |
| T3-T4 | 8 | 17 | |
| Lymph node metastasis | |||
| Absent | 43 | 25 | 0.318 |
| Present | 18 | 16 | |
| Pathological (TNM) stage | |||
| Stage I | 36 | 14 | 0.014* |
| Stage II-IV | 25 | 27 | |
| B. Multivariate COX regression analysis for RFS | |||
| Variables | P value | Hazard Ratio (HR) | 95.0% CI† of HR |
| NFATc2 | 0.037 | 1.905 | 1.039–3.494 |
| TNM stage | 0.001 | 2.035 | 1.347–3.075 |
| C. Multivariate COX regression analysis for OS | |||
| Variables | P value | Hazard ratio (HR) | 95.0% CI† of HR |
| NFATc2 | 0.002 | 2.824 | 1.462–5.457 |
| TNM stage | 0.012 | 1.827 | 1.140–2.927 |
| Age | 0.01 | 2.33 | 1.224–4.432 |
| Smoking history | 0.009 | 2.416 | 1.251–4.665 |
-
Statistical tests: c2; *: P<0.05
-
†: Confidence Interval.
-
Statistics: COX regression analysis.
Additional files
-
Supplementary file 1
- https://doi.org/10.7554/eLife.26733.030
Download links
A two-part list of links to download the article, or parts of the article, in various formats.
Downloads (link to download the article as PDF)
Open citations (links to open the citations from this article in various online reference manager services)
Cite this article (links to download the citations from this article in formats compatible with various reference manager tools)
NFATc2 enhances tumor-initiating phenotypes through the NFATc2/SOX2/ALDH axis in lung adenocarcinoma
eLife 6:e26733.
https://doi.org/10.7554/eLife.26733


