Tumor-promoting function of apoptotic caspases by an amplification loop involving ROS, macrophages and JNK in Drosophila
- University of Massachusetts Medical School, United States
Figures
Figure 1 with 2 supplements
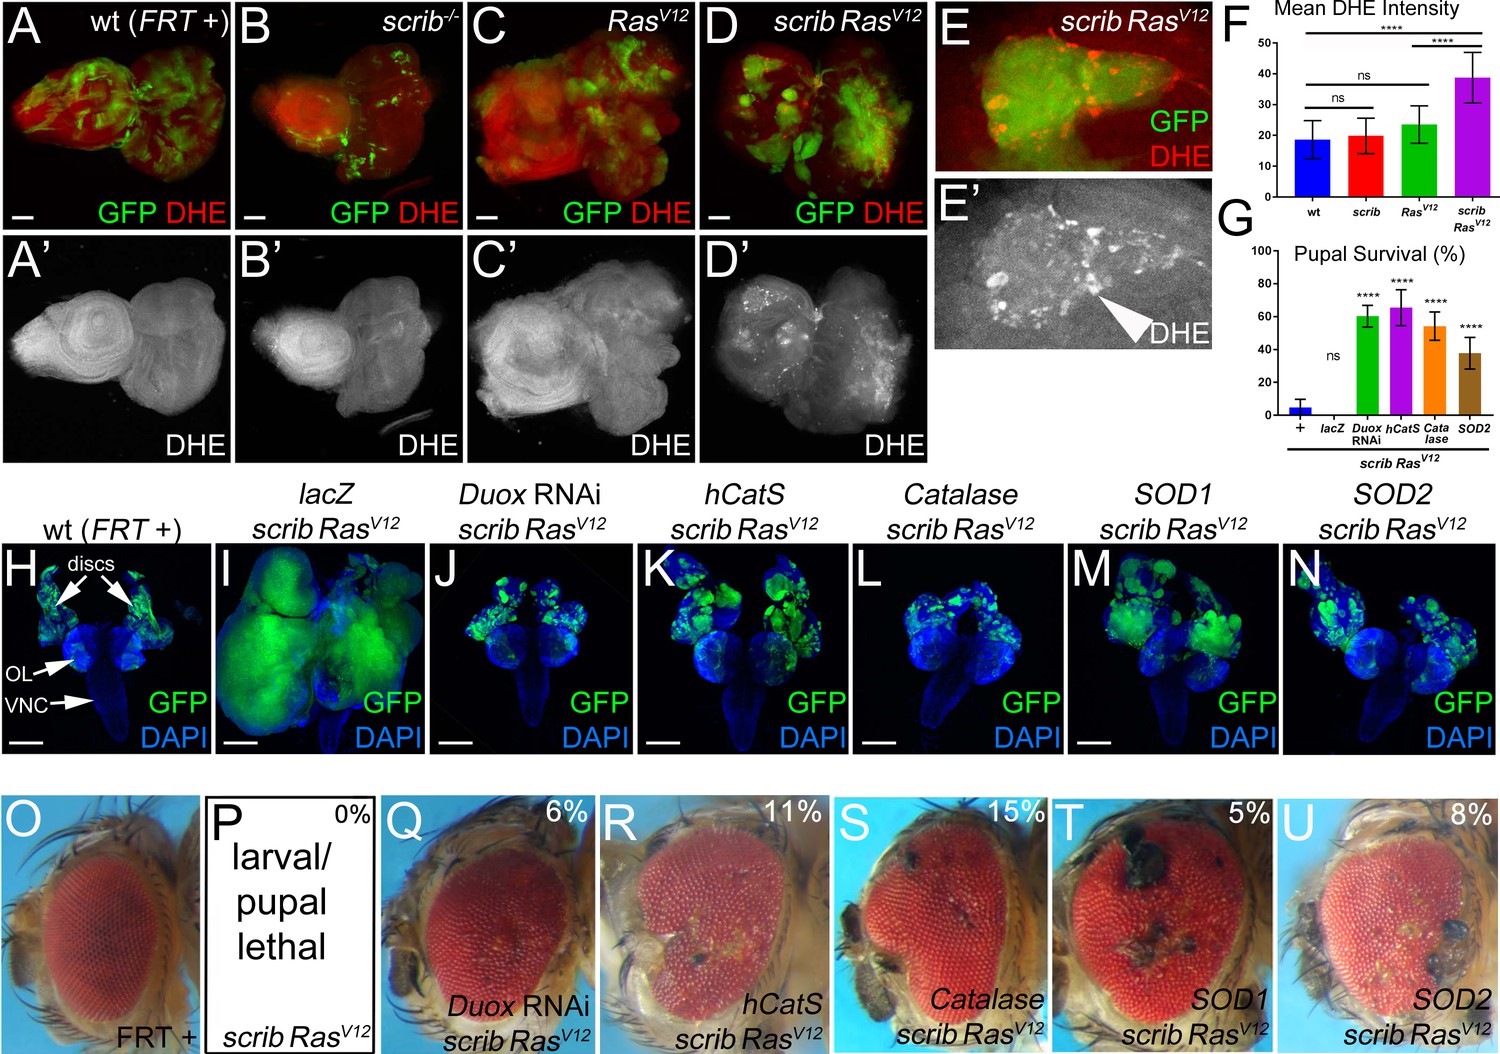
Both intra- and extracellular ROS contribute to the strong neoplastic phenotype of scrib−/− RasV12.
Mosaic animals in this and subsequent figures were obtained using the MARCM technique (Lee and Luo, 1999) with ey-FLP (Newsome et al., 2000) to induce mitotic recombination in eye imaginal discs. GFP depicts MARCM clones. Posterior is to the right. (A–D’) Wild-type (wt, FRT +) (A), scribble (scrib−/−) (B), RasV12–expressing (C) and scrib−/− RasV12 (D) eye/antennal mosaic imaginal discs from third instar larvae labeled with the ROS indicator Dihydroethidium (DHE). Scale bars: 50 μm. (E) Enlarged scrib−/− RasV12 clones labeled for DHE. Arrowhead in (E’) marks a cell of high DHE labeling. (F) DHE quantification reveals that ROS levels are significantly higher in scrib−/− RasV12 mutant clones compared to wt (FRT +), scrib−/− or RasV12-expressing clones. Plotted is the mean signal intensity ±SD of DHE labelings in clones, analyzed by one-way ANOVA with Holm-Sidak test for multiple comparisons. ****p<0.0001; ns – not significant. Multiple clones from five to ten discs of each genotype were analyzed. (G) Reduction of extra- and intracellular ROS levels in scrib−/− RasV12 mutant clones significantly improves the pupariation rates of animals bearing scrib RasV12 mosaic eye imaginal discs. Expression of UAS-lacZ in scrib−/− RasV12 clones as control has no effect on the pupariation rate. Pupariation rates were determined as the ratio of late stage mutant pupae vs total pupae and were analyzed by one-way ANOVA with Holm-Sidak test for multiple comparisons. Error bars are SD. P values are relative to scrib−/− RasV12 results (left column) and are indicated above the experimental columns. ****p<0.0001; ns – not significant. At least 100 pupae were counted per genotype. Experiments were performed three times. (H–N) Cephalic complexes composed of eye/antennal discs, optic lobes (OL) and ventral nerve cord (VNC) from day 11 old third instar larvae. The genotype is indicated on top of each panel. Expression of UAS-lacZ served as negative control (I). Depletion of ROS strongly reduces clone size (green) and normalizes growth in (J–N). DAPI (blue) labels the outline of the tissue. Scale bars: 200 μm. (O–U) Adult eyes of control (O) and scrib−/− RasV12 mosaics expressing the indicated antioxidant transgenes (Q–U). The percentage number in the top right of each panel indicates the adult survival rate relative to pupal survival. Note that ey-FLP-induced scrib−/− RasV12 MARCM mosaics are 100% lethal (0% adult survival) (P). Genotypes: (A,H,O) yw ey-FLP/+; act>y+>Gal4, UAS-GFP56ST/+; FRT82B tub-Gal80/. FRT82B w+; (B) yw ey-FLP/+; act>y+>Gal4, UAS-GFP56ST/+; FRT82B tub-Gal80/. FRT82B scrib2; (C) yw ey-FLP/+; act>y+>Gal4, UAS-GFP56ST/UAS-RasV12; FRT82B tub-Gal80/FRT82B w+; (D,E,P) yw ey-FLP/+; act>y+>Gal4, UAS-GFP56ST/+; FRT82B tub-Gal80/UAS-RasV12 FRT82B scrib2; (I–N,Q–U) yw ey-FLP/+; act>y+>Gal4, UAS-GFP56ST/UAS-X; FRT82B tub-Gal80/UAS-RasV12 FRT82B scrib2 with UAS-X being UAS-lacZ (I), UAS-DuoxRNAi (J,Q), UAS-hCatS (K,R), UAS-Catalase (L,S), UAS-SOD1 (M,T) and UAS-SOD2 (N,U).
Figure 1—figure supplement 1
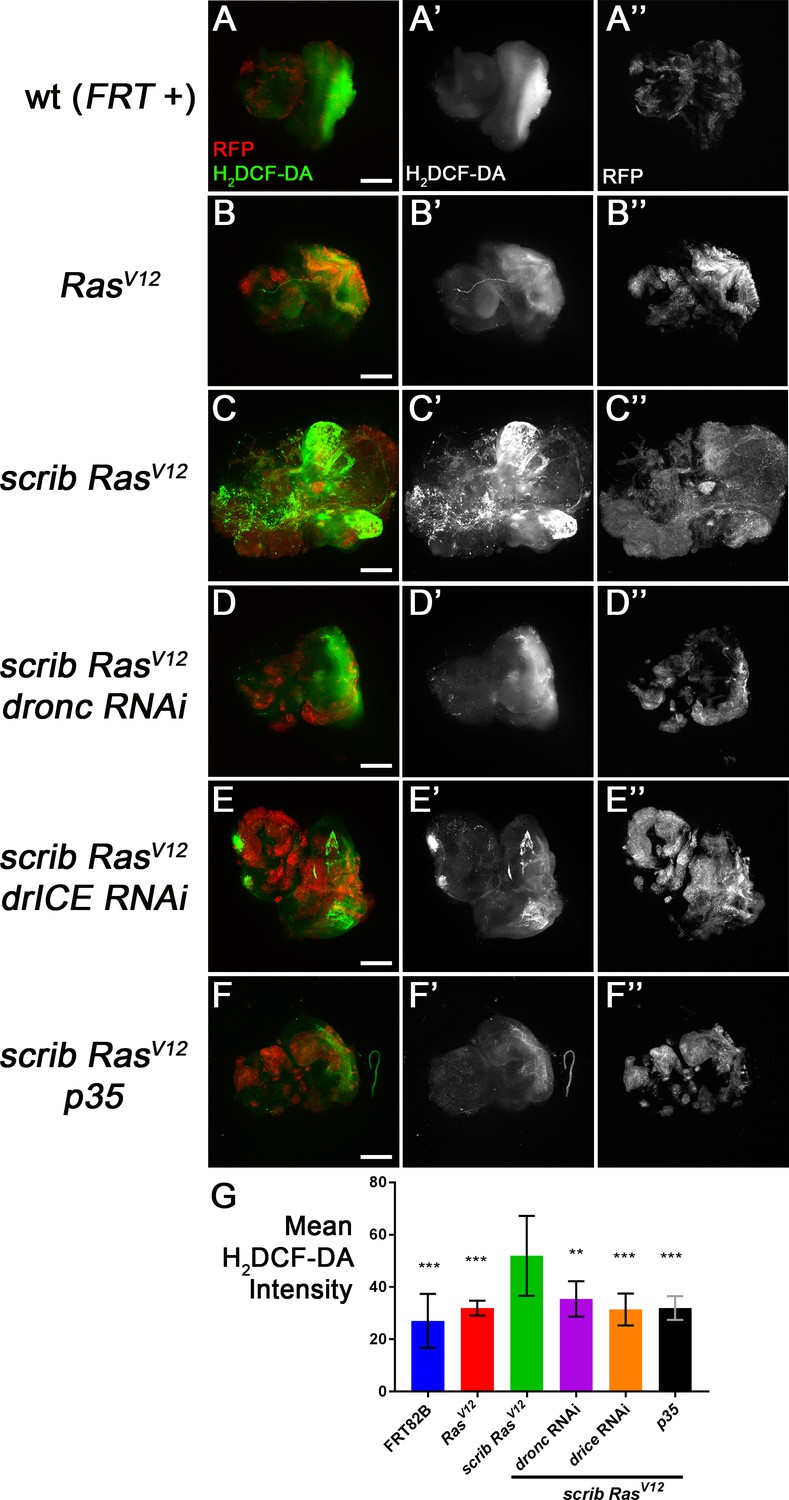
Caspase-dependent generation of ROS as revealed by H2DCF-DA labelings.
Mosaic eye-antennal imaginal discs in this figure were obtained using a modified MARCM technique with ey-FLP in which clones are marked by myrRFP (red) (Chabu and Xu, 2014). Posterior is to the right. Scale bars: 50 μm. (A–F’’) Wild-type (wt, FRT +) (A), RasV12–expressing (B), scrib−/− RasV12 (C) and scrib−/− RasV12 eye/antennal mosaic imaginal discs expressing dronc RNAi (D), drICE RNAi (E) and p35 (F) from third instar larvae were labeled with the ROS indicator H2DCF-CA (green). The (‘) panels show the H2DCF-CA-only channel, the (‘‘) show RFP-only. There is strong increase of H2DCF-CA labeling in scrib−/− RasV12 mutant clones in a caspase-dependent manner. (G) Quantification of H2DCF-CA labelings revealed that ROS levels are significantly higher in scrib−/− RasV12 mutant clones (C) compared to wt (FRT +) (A) and RasV12 (B) clones. Loss of caspase activity also significantly reduces H2DCF-CA labelings (D–F). Shown is the mean signal intensity ±SD of H2DCF-CA labelings, analyzed by one-way ANOVA with Holm-Sidak test for multiple comparisons. P values are relative to scrib−/− RasV12 results (third column) and are indicated above the experimental columns. ***p<0.001; **p<0.01. Ten discs of each genotype were analyzed. Genotypes: (A) yw ey-FLP/+; act>y+>Gal4, UAS-myrRFP/+; FRT82B tub-Gal80/. FRT82B w+; (B) yw ey-FLP/+; act>y+>Gal4, UAS-myrRFP/UAS-RasV12; FRT82B tub-Gal80/FRT82B w+; (C) yw ey-FLP/+; act>y+>Gal4, UAS-myrRFP/+; FRT82B tub-Gal80/UAS-RasV12 FRT82B scrib2; (D–F) yw ey-FLP/+; act>y+>Gal4, UAS-myrRFP/UAS-X; FRT82B tub-Gal80/UAS-RasV12 FRT82B scrib2 with UAS-X being UAS-droncRNAi (D), UAS-drICERNAi (E) and UAS-p35 (F).
Figure 1—figure supplement 2
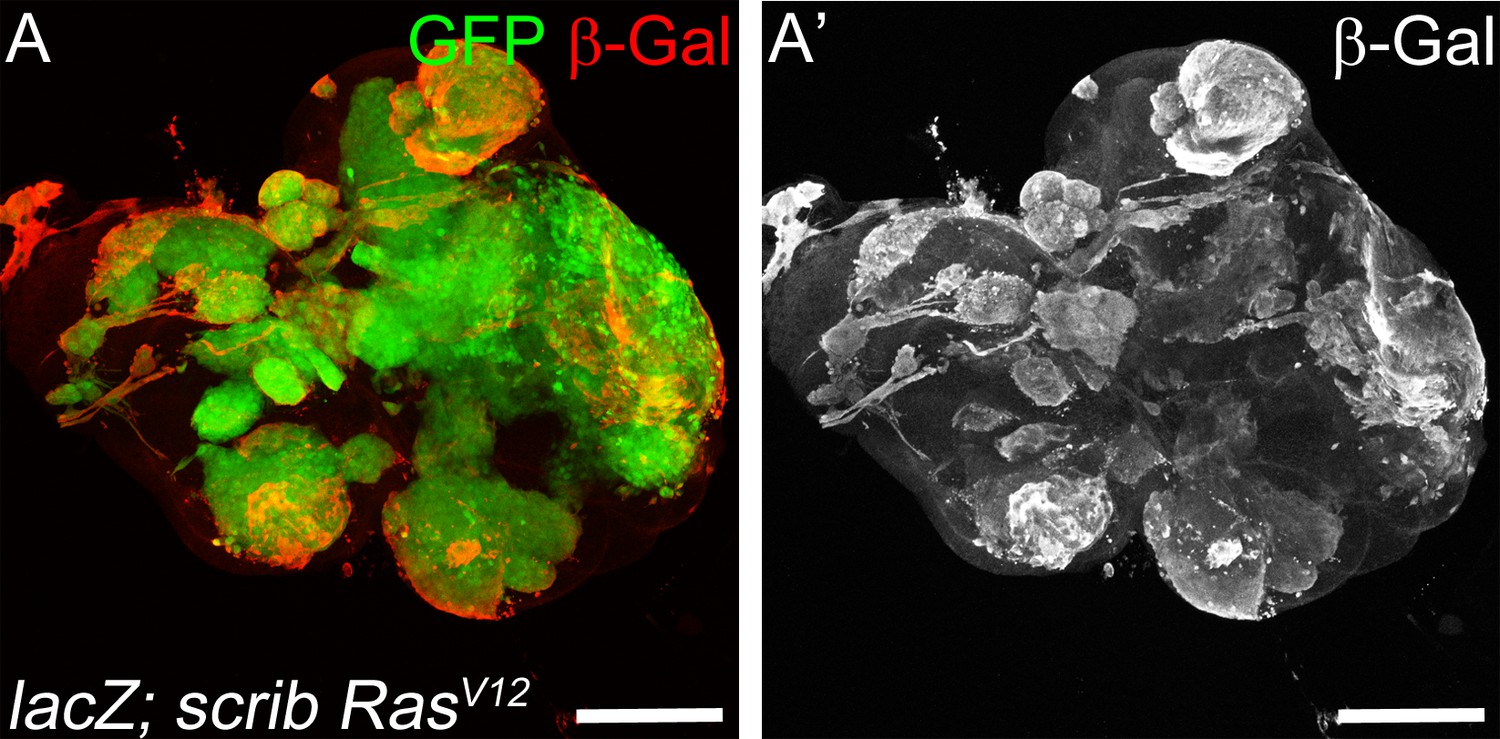
Strong induction of β-Gal by expression of UAS-lacZ in scrib−/− RasV12 clones.
(A,A’) Strong expression of a UAS-lacZ transgene in mosaic scrib RasV12 eye imaginal discs as revealed by anti β-Gal labeling (red in (A); grey in (A’)). Scale bar: 100 μm. Genotype: (A) yw ey-FLP/+; act>y+>Gal4, UAS-GFP56ST/UAS-lacZ; FRT82B tub-Gal80/UAS-RasV12 FRT82B scrib2.
Figure 2

Caspases are required for ROS generation and neoplastic overgrowth in scrib−/− RasV12.
(A–D’) Expression of the effector caspase inhibitor p35 (B), drICE RNAi (C) and dronc RNAi (D) suppresses scrib−/− RasV12 clone size (green) and ROS generation in scrib−/− RasV12 clones. The (‘) panels indicate the labeling of the ROS indicator DHE (grey). Scale bars: 50 μm. (E) DHE quantification reveals that ROS levels are significantly reduced in scrib−/− RasV12 mutant clones with reduced or inhibited caspase activity. Shown is the mean signal intensity ±SD of DHE labelings in clones, analyzed by one-way ANOVA with Holm-Sidak test for multiple comparisons. ****p<0.0001. Multiple clones from five to ten discs of each genotype were analyzed. (F–I) The growth and invasion of cephalic complexes of 11 day old scrib−/− RasV12 larvae (F) is strongly suppressed by p35 (G), drICE RNAi (H) and dronc RNAi (I). Clone size (green) in (F–I) is strongly reduced. DAPI labels the outline of the tissue. Scale bars: 200 μm. (J–M) Adult eyes of surviving scrib−/− RasV12 animals expressing p35 (K), drICE RNAi (L) and dronc RNAi (M). The percentage number in the top right of each panel indicates the adult survival rate relative to pupal survival. (N) Reduction or inhibition of caspase activity in scrib−/− RasV12 mutant clones significantly improves the pupariation rates of animals bearing scrib−/− RasV12 mosaic eye imaginal discs. Pupariation rates were determined as the ratio of late stage mutant pupae vs total pupae and were analyzed by one-way ANOVA with Holm-Sidak test for multiple comparisons. Error bars are SD. P values are relative to scrib−/− RasV12 results (left column) and are indicated above the experimental columns. ****p<0.0001. At least 100 pupae were counted per genotype. Experiments were performed three times. Genotypes: (A,F,J) yw ey-FLP/+; act>y+>Gal4, UAS-GFP56ST/+; FRT82B tub-Gal80/UAS-RasV12 FRT82B scrib2; (B–D,G–I,K–M) yw ey-FLP/+; act>y+>Gal4, UAS-GFP56ST/UAS-X; FRT82B tub-Gal80/UAS-RasV12 FRT82B scrib2 with UAS-X being UAS-p35 (B,G,K), UAS-drICERNAi (C,H,L) and UAS-droncRNAi (D,I,M).
Figure 3 with 1 supplement
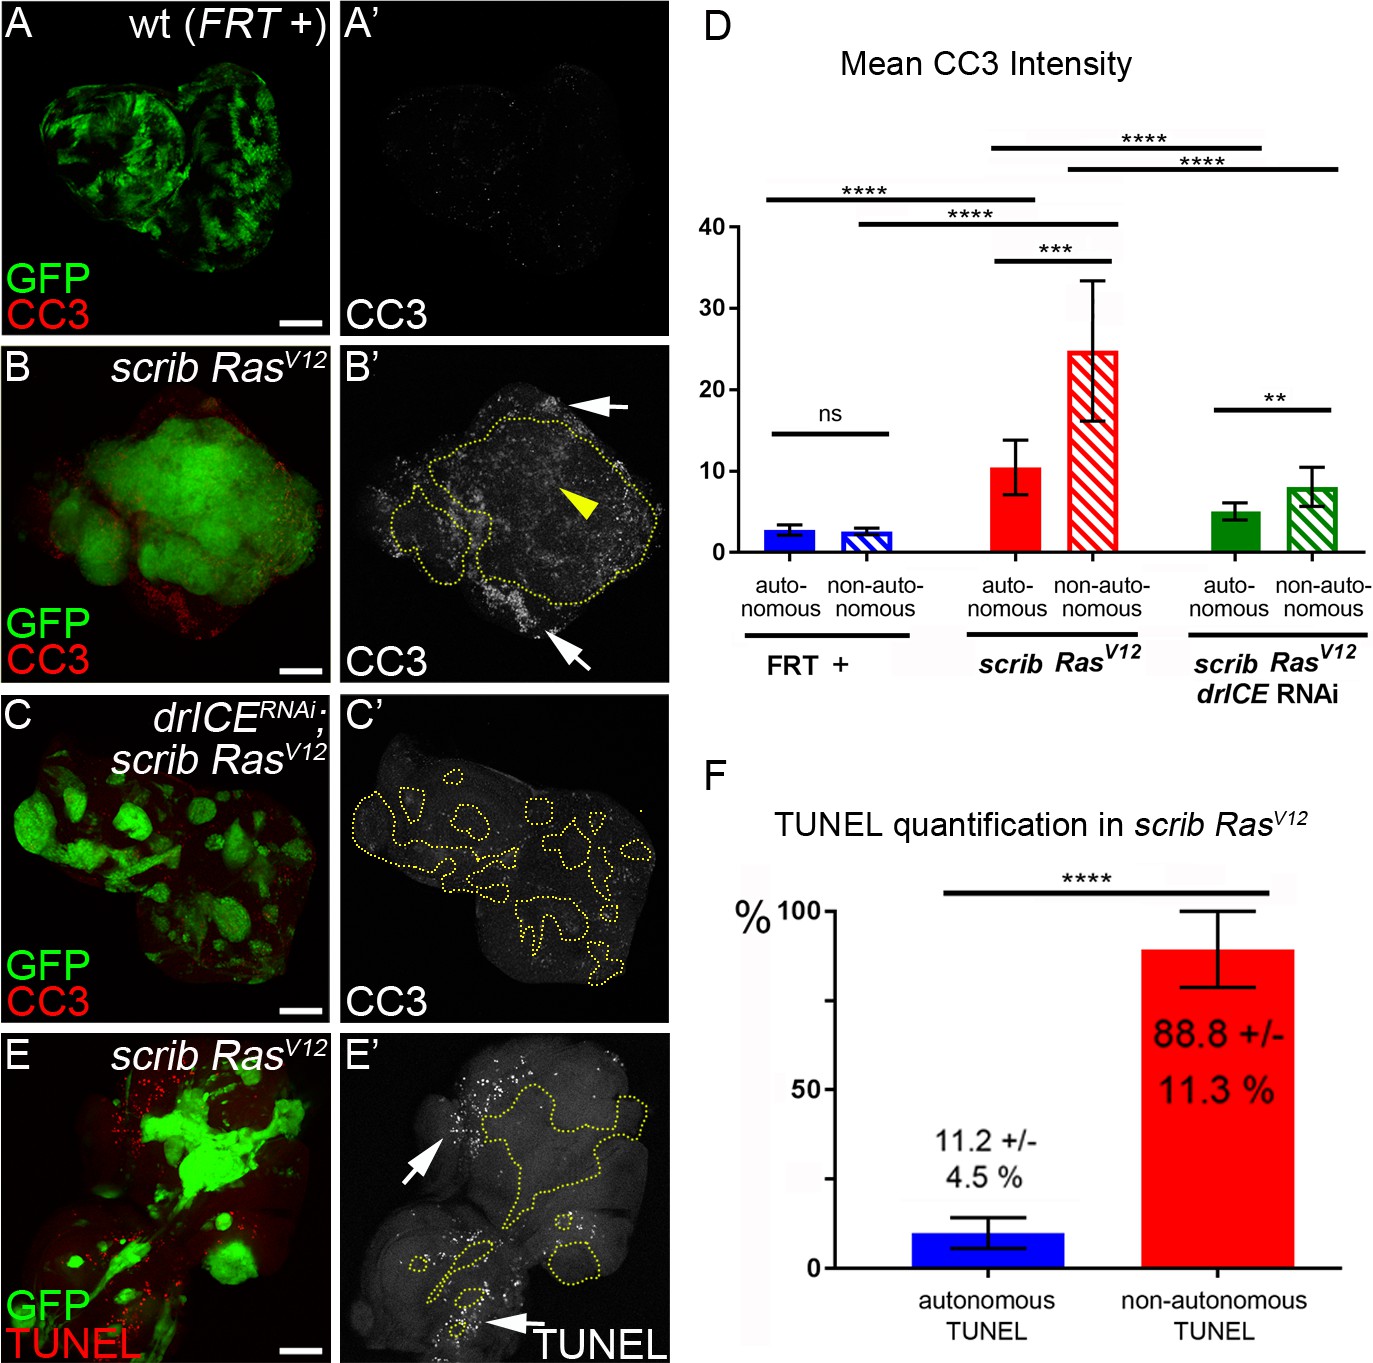
Analysis of caspase activity and apoptosis in scrib−/− RasV12 mosaic eye discs.
(A–C’) Cleaved caspase 3 (CC3) (red in (A–C); grey in (A’–C’)) analysis of control (wt, FRT +) (A), scrib−/− RasV12 (B) and scrib−/− RasV12 expressing drICE RNAi (C) mosaic eye imaginal discs. CC3 labeling is detectable autonomously (yellow arrowhead) and non-autonomously (white arrows) of scrib−/− RasV12 mutant clones (B’). Clones in (B’) and (C’) are outlined by yellow, dotted lines. Scale bars: 50 μm. (D) CC3 quantification of mosaic FRT + (control), scrib−/− RasV12 and drICERNAi;scrib−/− RasV12 eye-antennal imaginal discs reveals significant increase of caspase activity both inside (autonomously) and outside (non-autonomously) of scrib−/− RasV12 clones. Plotted is the mean signal intensity ±SD of autonomous and non-autonomous CC3 labelings, immediately adjacent to the clones. Analysis was performed by one-way ANOVA with Holm-Sidak test for multiple comparisons. ****p<0.0001; **p<0.01; ns – not significant. Ten discs per genotype were analyzed. (E) TUNEL assay as an apoptotic marker of scrib−/− RasV12 mosaic eye discs. White arrows mark TUNEL-positive cells outside scrib−/− RasV12 clones, outlined by yellow dotted lines. (F) TUNEL quantification reveals that almost 90% of apoptotic cells in scrib−/− RasV12 mosaic discs are outside of mutant clones. Autonomous and non-autonomous counts of TUNEL-positive cells were analyzed by paired student’s t-test. ****p<0.0001. The distribution of TUNEL-positive cells in seven discs is plotted. Genotypes: (A) yw ey-FLP/+; act>y+>Gal4, UAS-GFP56ST/+; FRT82B tub-Gal80/. FRT82B w+; (B,E) yw ey-FLP/+; act>y+>Gal4, UAS-GFP56ST/+; FRT82B tub-Gal80/UAS-RasV12 FRT82B scrib2; (C) yw ey-FLP/+; act>y+>Gal4, UAS-GFP56ST/UAS-drICERNAi; FRT82B tub-Gal80/UAS-RasV12 FRT82B scrib2.
Figure 3—figure supplement 1
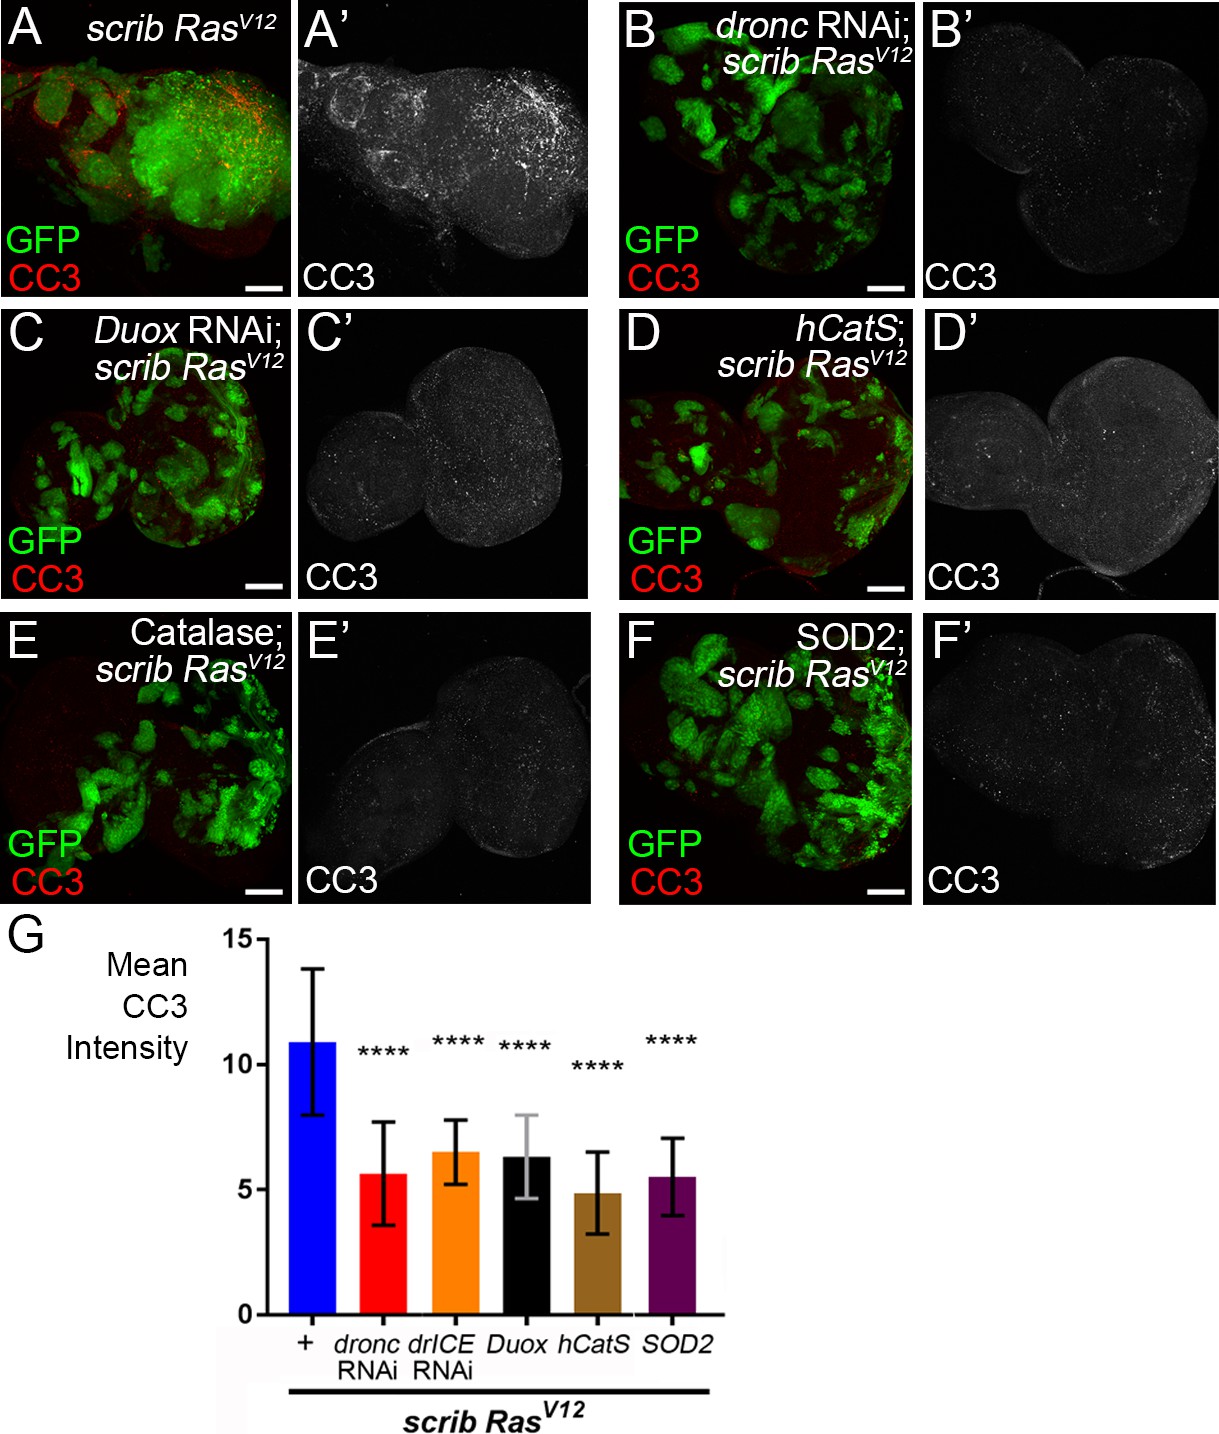
Reduction of ROS results in loss of caspase activity in scrib−/− RasV12 mosaic discs.
(A–F’) Cleaved caspase 3 (CC3) (red in (A–F); grey in (A’–F’) analysis of scrib−/− RasV12 (A) and scrib−/− RasV12 mosaic eye imaginal discs with reduced dronc activity (B) and depleted ROS (C–F). Overall caspase activity is significantly reduced in panels (B–F). Scale bars: 50 μm. (G) CC3 quantification of the imaginal discs in (B’–F’) reveals significant reduction of caspase activity compared to scrib−/− RasV12 discs (A’). + indicates scrib−/− RasV12 in otherwise wt background. Plotted is the mean signal intensity ±SD of CC3 labelings across the discs. Analysis was performed by one-way ANOVA with Holm-Sidak test for multiple comparisons. ****p<0,0001; ***p<0.001; ns – not significant. Ten discs per genotype were analyzed.
Figure 4

Caspase-generated ROS are required of recruitment and activation of hemocytes to scrib−/− RasV12 mosaic eye/antennal imaginal discs.
Hemocytes were labeled with the NimC antibody (Kurucz et al., 2007) (red in top panels; grey in (‘) panels and in (L–R)). Scale bars in (A–J’): 50 μm; in (L–R): 100 μm. (A,A’) Control mosaic discs (FRT +) carry small hemocyte clusters mostly at the antennal portion of the disc. (B,B’) scrib−/− RasV12 mosaic discs are covered by large quantities of hemocytes. + indicates scrib−/− RasV12 in otherwise wt background. (C–I) Hemocyte recruitment to scrib−/− RasV12 eye/antennal imaginal discs is strongly impaired upon loss of ROS (C–F’) and caspase activity (G–I'). (J,J’) Expression of a dominant negative JNK transgene (JNKDN) in scrib−/− RasV12 mutant clones blocks hemocyte recruitment. (K) Quantification of NimC labelings reveals that the number of hemocytes attached to scrib−/− RasV12 mosaic discs is significantly lower when ROS levels or caspase activity are reduced in scrib−/− RasV12 clones. To facilitate the quantification, the mean intensity of NimC labelings across the entire disc was determined, normalized to GFP (to account for the reduced size of ROS-depleted or caspase-inhibited scrib−/− RasV12 clones) and analyzed by one-way ANOVA with Holm-Sidak test for multiple comparisons. Error bars are SD. P values are referenced to scrib−/− RasV12 and are indicated by asterisks above each column. ****p<0.0001. Ten discs per genotype were analyzed. + indicates scrib−/− RasV12 in otherwise wt background. (L–R) High magnification images of hemocytes attached to the discs of indicated genotype. Note that in (M) hemocytes attached to scrib−/− RasV12 discs extend cellular protrusions (arrows), similar to cytonemes. These protrusions are absent in hemocytes attached to control (L) and caspase-inhibited or ROS-depleted discs (N–R). + in (M) indicates scrib−/− RasV12 in otherwise wt background. Genotypes: (A,L) yw ey-FLP/+; act>y+>Gal4, UAS-GFP56ST/+; FRT82B tub-Gal80/. FRT82B w+; (B,M) yw ey-FLP/+; act>y+>Gal4, UAS-GFP56ST/+; FRT82B tub-Gal80/UAS-RasV12 FRT82B scrib2; (C–I, N–R) yw ey-FLP/+; act>y+>Gal4, UAS-GFP56ST/UAS-X; FRT82B tub-Gal80/UAS-RasV12 FRT82B scrib2 with UAS-X being UAS-DuoxRNAi (C), UAS-hCatS (D,N), UAS-SOD1 (E), UAS-Catalase (F,O), UAS-SOD2 (P), UAS-droncRNAi (G,Q), UAS-drICERNAi (H,R) and UAS-p35 (I). (J) yw ey-FLP/UAS-JNKDN; act>y+>Gal4, UAS-GFP56ST/+; FRT82B tub-Gal80/UAS-RasV12 FRT82B scrib2.
Figure 5 with 1 supplement
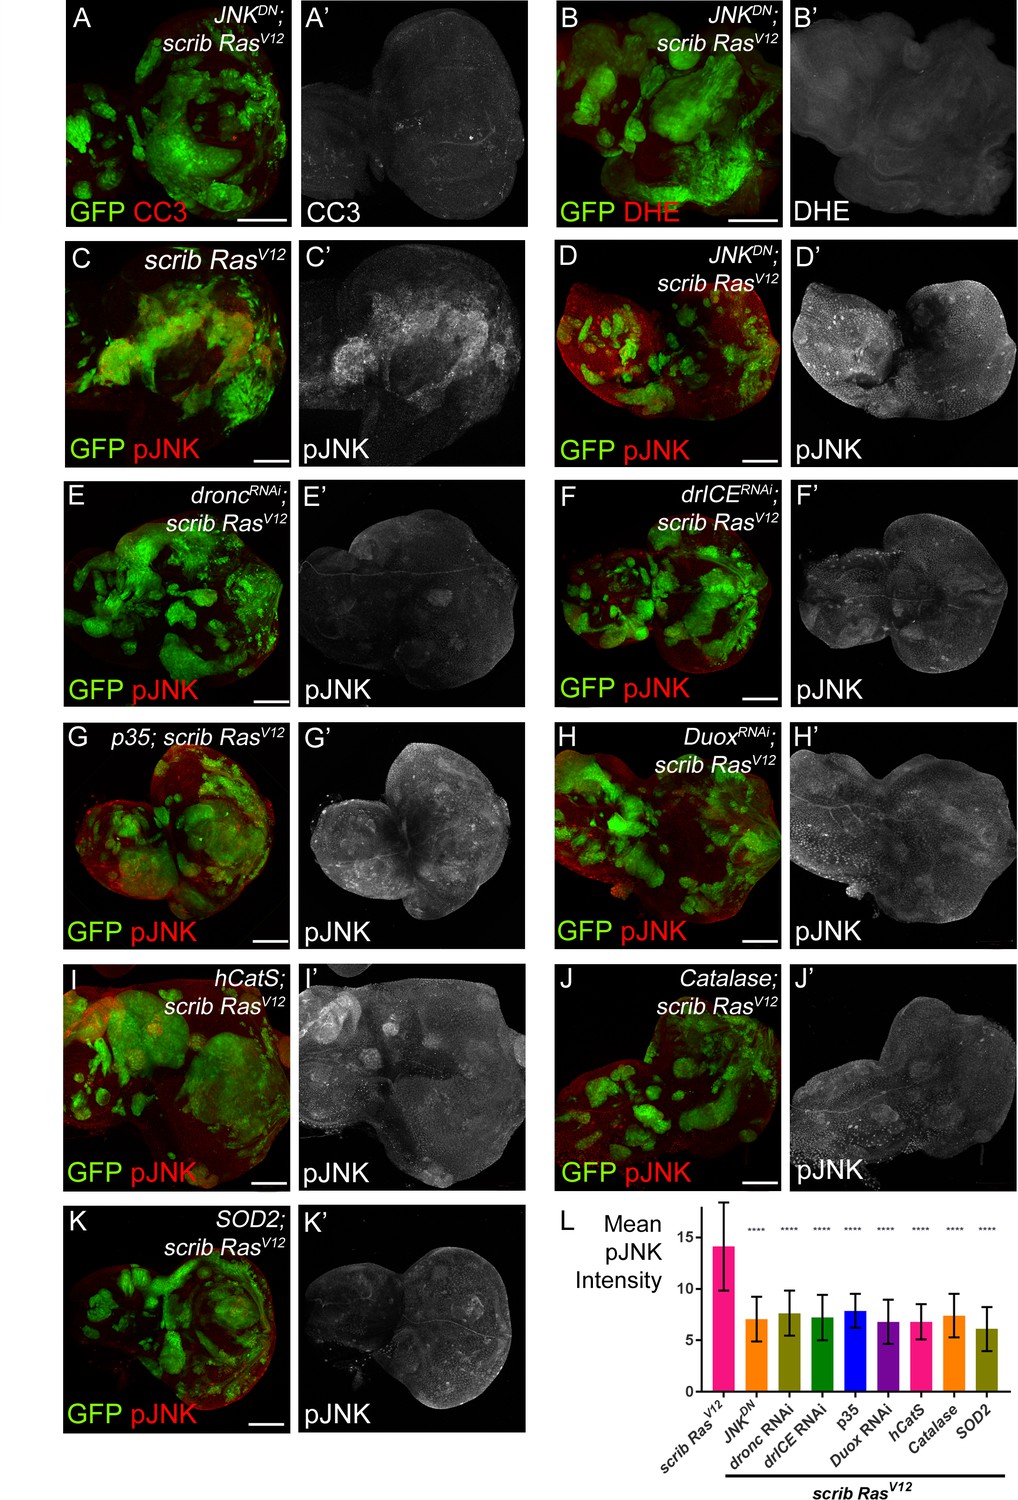
JNK acts upstream and downstream of caspase activation and ROS generation.
(A–B’) Expression of JNKDN in scrib−/− RasV12 clones inhibits caspase activity (A,A’; CC3) and ROS generation (B,B’; DHE). Scale bars: 50 μm. (C–K’) pJNK labeling (red in (C–K); grey in (C’–K’)) as JNK marker in scrib−/− RasV12 (C,C’), JNKDN-expressing scrib−/− RasV12 (D,D’) and ROS-depleted or caspase-inhibited scrib−/− RasV12 mosaic discs (E–K’). The strong pJNK labeling in (C,C’) is significantly reduced in (D–K’). Scale bars: 50 μm. (L) The mean intensity of pJNK labelings in scrib−/− RasV12 clones in panels (C’–K’) is significantly reduced upon ROS-depletion or reduction of caspase activity. Analysis of JNK labelings was done by one-way ANOVA with Holm-Sidak test for multiple comparisons. Error bars are SD. P values are referenced to scrib−/− RasV12 and are indicated by asterisks above each column. ****p<0.0001. At least ten discs per genotype were analyzed. Genotypes: (A,B,D) yw ey-FLP/UAS-JNKDN; act>y+>Gal4, UAS-GFP56ST/+; FRT82B tub-Gal80/UAS-RasV12 FRT82B scrib2; (C) yw ey-FLP/+; act>y+>Gal4, UAS-GFP56ST/+; FRT82B tub-Gal80/UAS-RasV12 FRT82B scrib2; (E–K) yw ey-FLP/+; act>y+>Gal4, UAS-GFP56ST/UAS-X; FRT82B tub-Gal80/UAS-RasV12 FRT82B scrib2 with UAS-X being UAS-droncRNAi (E), UAS-drICERNAi (F), UAS-p35 (G), UAS-DuoxRNAi (H), UAS-hCatS (I), UAS-Catalase (J) and UAS-SOD2 (K).
Figure 5—figure supplement 1

MMP1 labeling is reduced in scrib−/− RasV12 clones with reduced ROS or caspase activity.
(A–H’) MMP1 labeling (red in (A–H); grey in (A’–H’)) as JNK marker in control discs (FRT +) (A,A’), scrib−/− RasV12 mosaic discs (B,B’) and ROS-depleted or caspase-inhibited scrib−/− RasV12 mosaic discs (C–H’). The strong MMP1 labeling in (B,B’) is significantly reduced in (C–H’). Arrowheads in (C,C’) highlight representative examples of clones with low (white) or no (yellow) MMP1 labeling. Scale bars: 50 μm. (I) The mean intensity of MMP1 labelings in scrib−/− RasV12 clones in panels (C’–H’) is significantly reduced upon ROS-depletion or reduction of caspase activity compared to scrib−/− RasV12 mutant clones (B’). Analysis of MMP1 labelings was done by one-way ANOVA with Holm-Sidak test for multiple comparisons. Error bars are SD. P values are referenced to scrib−/− RasV12 and are indicated by asterisks above each column. ****p<0.0001, ns – not significant. At least ten discs per genotype were analyzed. Genotypes: (A) yw ey-FLP/+; act>y+>Gal4, UAS-GFP56ST/+; FRT82B tub-Gal80/FRT82B w+; (B) yw ey-FLP/+; act>y+>Gal4, UAS-GFP56ST/+; FRT82B tub-Gal80/UAS-RasV12 FRT82B scrib2; (C–H) yw ey-FLP/+; act>y+>Gal4, UAS-GFP56ST/UAS-X; FRT82B tub-Gal80/UAS-RasV12 FRT82B scrib2 with UAS-X being UAS-Catalase (C), UAS-SOD1 (D), UAS-SOD2 (E), UAS-droncRNAi (F), UAS-drICERNAi (G) and UAS-p35 (H).
Figure 6
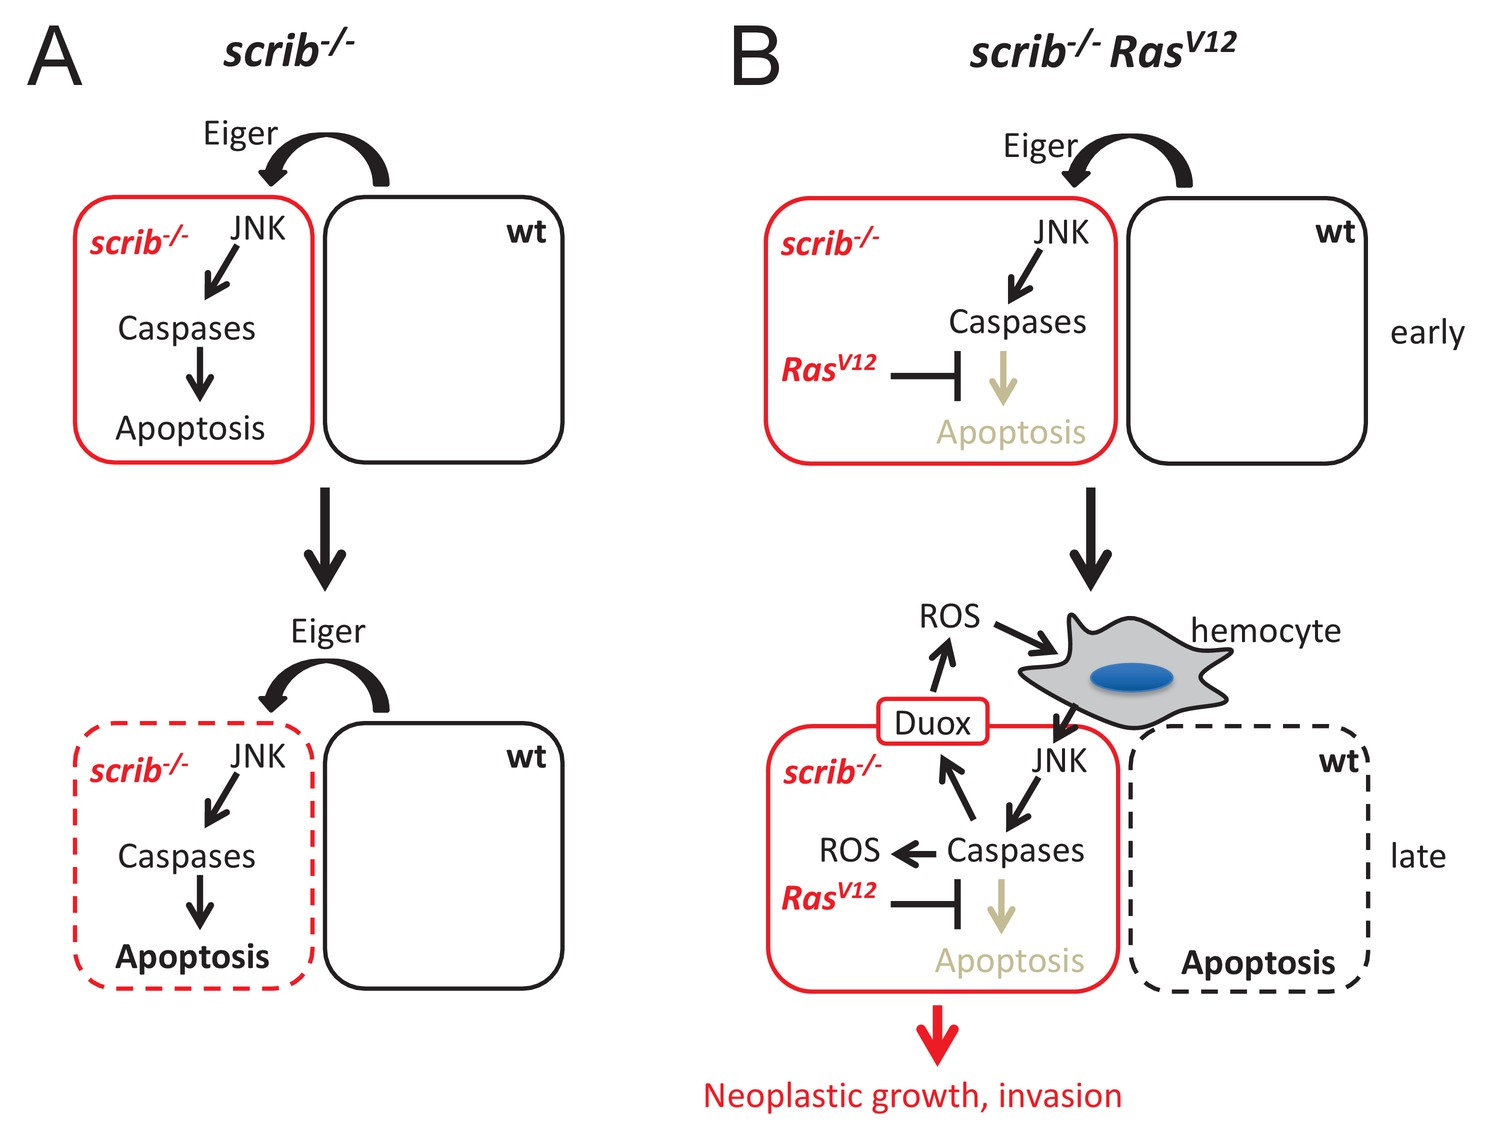
Mechanistic view about the conversion of caspases from tumor suppressors to tumors promoters in scrib RasV12 mutant cells.
(A) After scrib−/− mutant cells have formed in mosaic discs, a cell competition signal mediated by Eiger triggers JNK and caspase activity which induces apoptosis of scrib mutant cells (dashed outline of the cell). (B) After scrib−/− RasV12 cells have formed, JNK activity may be induced by the same cell competition signal as in scrib−/− mutant cells (early). However, despite activation of JNK and caspases in scrib RasV12 cells, RasV12 keeps these cells in an ‘undead’-like condition and enables caspases to initiate a feedback amplification loop involving ROS generation and recruitment of hemocytes which amplifies JNK and caspase activity (late). This amplification loop is necessary for malignant growth and invasion. Neighboring wild-type cells undergo apoptosis (dashed outline of the cell). The mechanism of non-autonomous apoptosis is not clear.
Additional files
-
Transparent reporting form
- https://doi.org/10.7554/eLife.26747.013
Download links
A two-part list of links to download the article, or parts of the article, in various formats.
Downloads (link to download the article as PDF)
Open citations (links to open the citations from this article in various online reference manager services)
Cite this article (links to download the citations from this article in formats compatible with various reference manager tools)
Tumor-promoting function of apoptotic caspases by an amplification loop involving ROS, macrophages and JNK in Drosophila
eLife 6:e26747.
https://doi.org/10.7554/eLife.26747


