Multiple sources of slow activity fluctuations in a bacterial chemosensory network
- Max Planck Institute for Terrestrial Microbiology, Germany
- LOEWE Center for Synthetic Microbiology (SYNMIKRO), Germany
- The Hebrew University, Israel
Figures
Figure 1 with 5 supplements
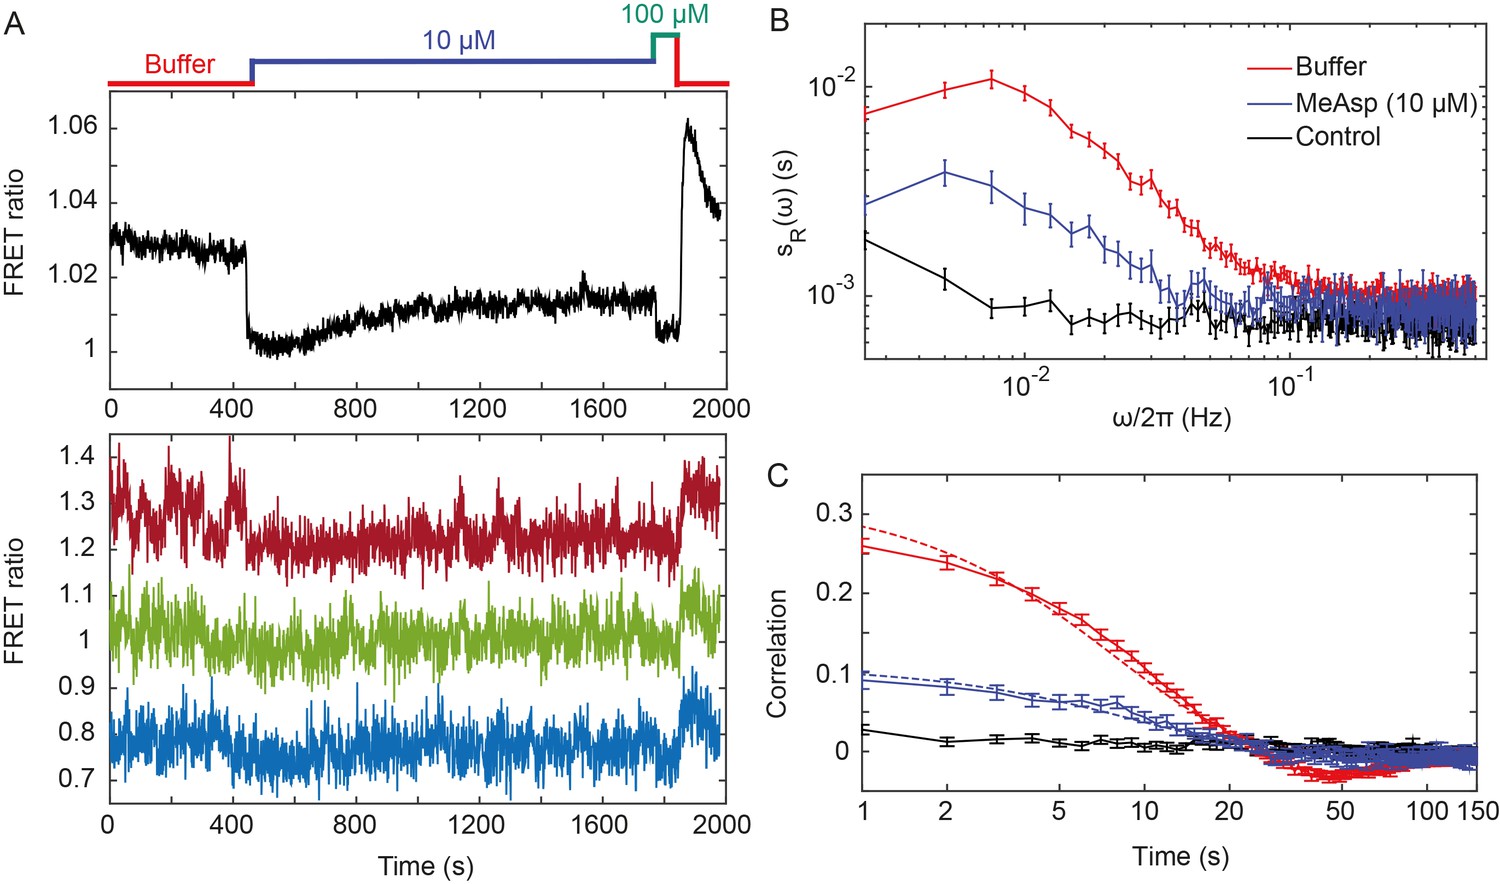
Fluctuations of the chemotaxis pathway activity in individual CheR+CheB+ cells.
(A) Time course of the FRET measurements for the CheR+ CheB+ strain expressing the FRET pair CheY-YFP and CheZ-CFP and Tar as the sole receptor (see Materials and methods for details of expression), for cell population (upper panel) and for representative single cells (lower panel). Cells immobilized in a flow chamber under steady flow (see Materials and methods and Figure 1—figure supplement 1B) were initially adapted in buffer (red) and subsequently stimulated by addition and subsequent removal of indicated concentrations of a non-metabolizable chemoattractant MeAsp (blue and green). The measurement traces for single cells have been shifted along the y-axis to facilitate visualization. (B) Power spectral density (PSD) of the FRET ratio for single cells adapted in buffer (red curve) or in 10 µM MeAsp (blue curve), as well as for the control receptorless strain in buffer (black curve). (C) The corresponding time autocorrelation functions of the single-cell FRET ratio. Dashed lines show fits by exponential decay (see Materials and methods). The error bars represent standard errors of the mean (SEM), and the sample sizes are 265 (buffer), 69 (10 µM) and 103 (receptorless control) single cells coming from at least three independent experiments in each case.
Figure 1—figure supplement 1
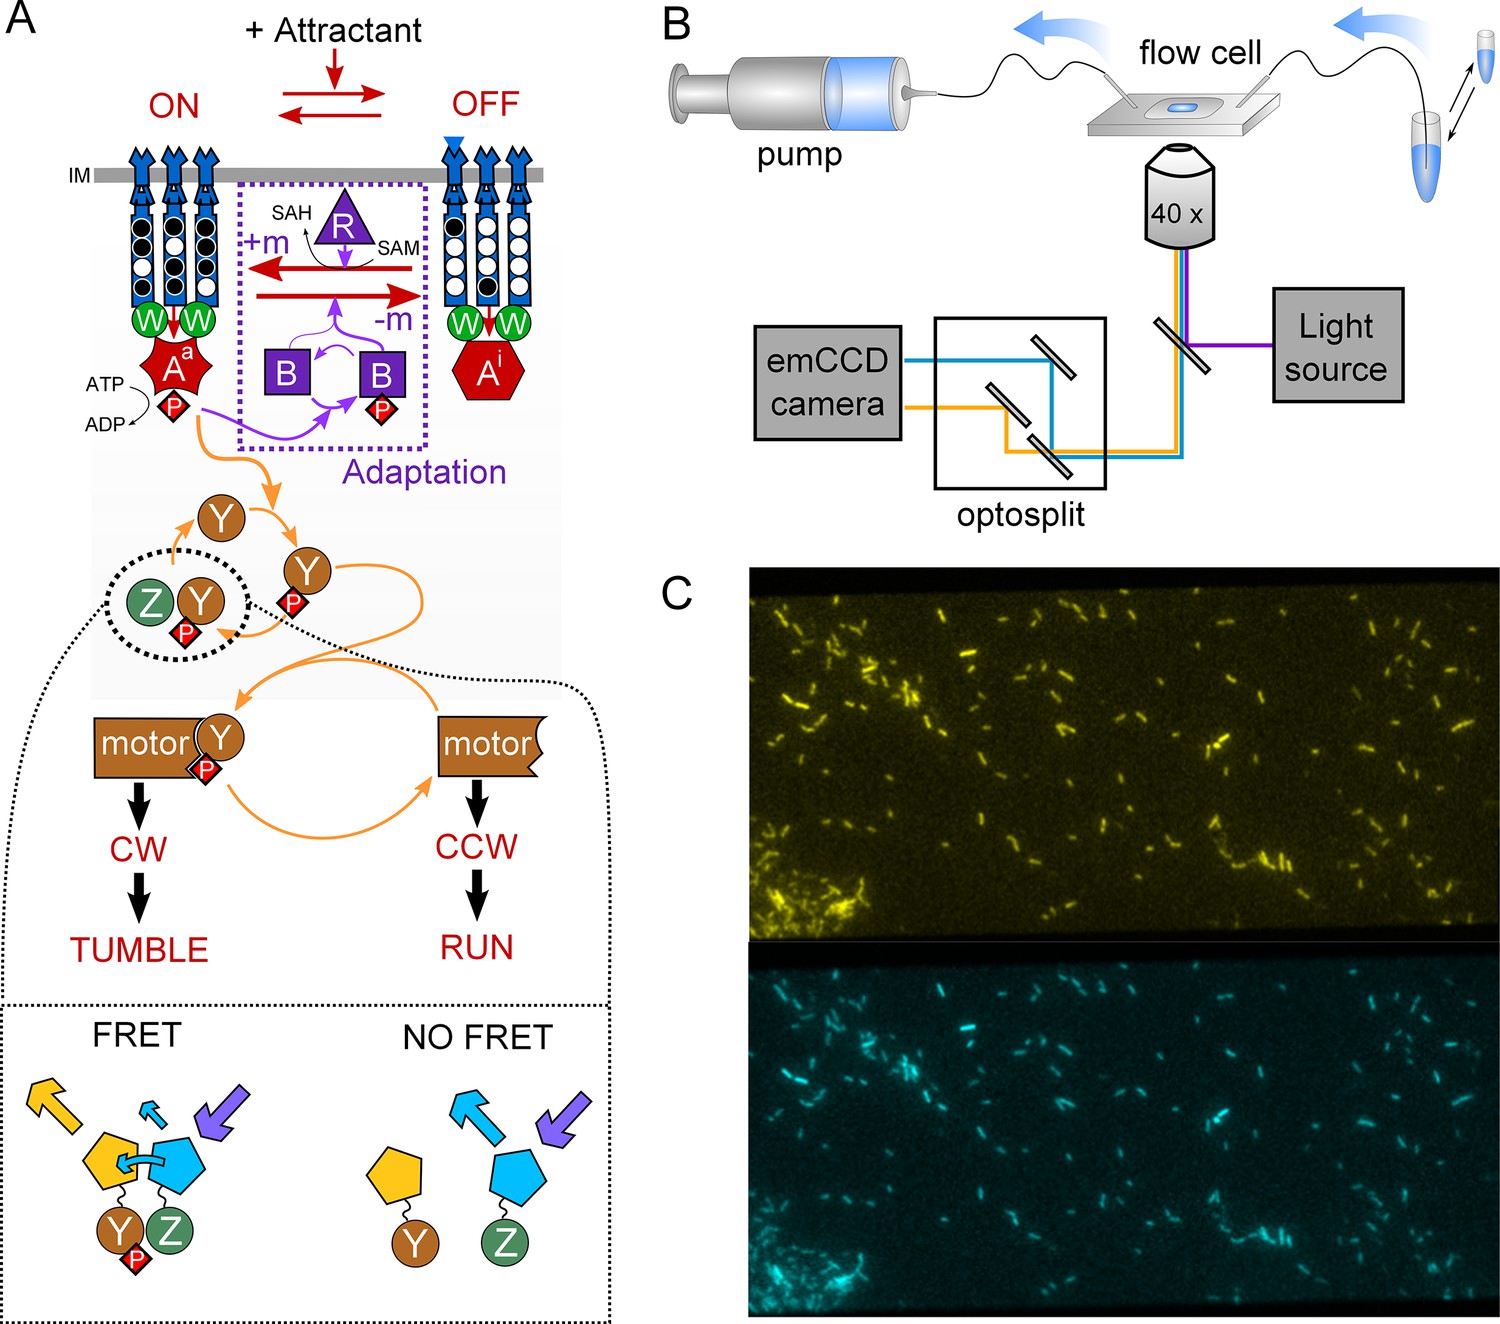
Schematic representation of the FRET experiment.
(A) The phosphorylation-dependent monitoring of the chemotaxis pathway activity via FRET. CheY and CheZ are tagged with the two components of a FRET pair of fluorophores, so that the level of energy transfer represents the amount of CheY-CheZ interaction. This quantity reflects then the fraction of phosphorylated CheY-P, which represents the average fraction of active CheA (Aa) on the second time scale, because of the rapid cycle of (de)phosphorylation of CheY by CheAa and CheZ. See text for further explanations. (B) Schematic of the experimental device. Media containing chemoeffectors are flown over the cells attached to a coverslip. Cell fluorescence is observed simultaneously in two spectral channels separated by an optosplit and an EM-CCD camera. (C) Typical recorded image, showing in the order of a hundred single cells and a small group of cells, the FRET measurement of which is used as a reference during the experiment.
Figure 1—figure supplement 2
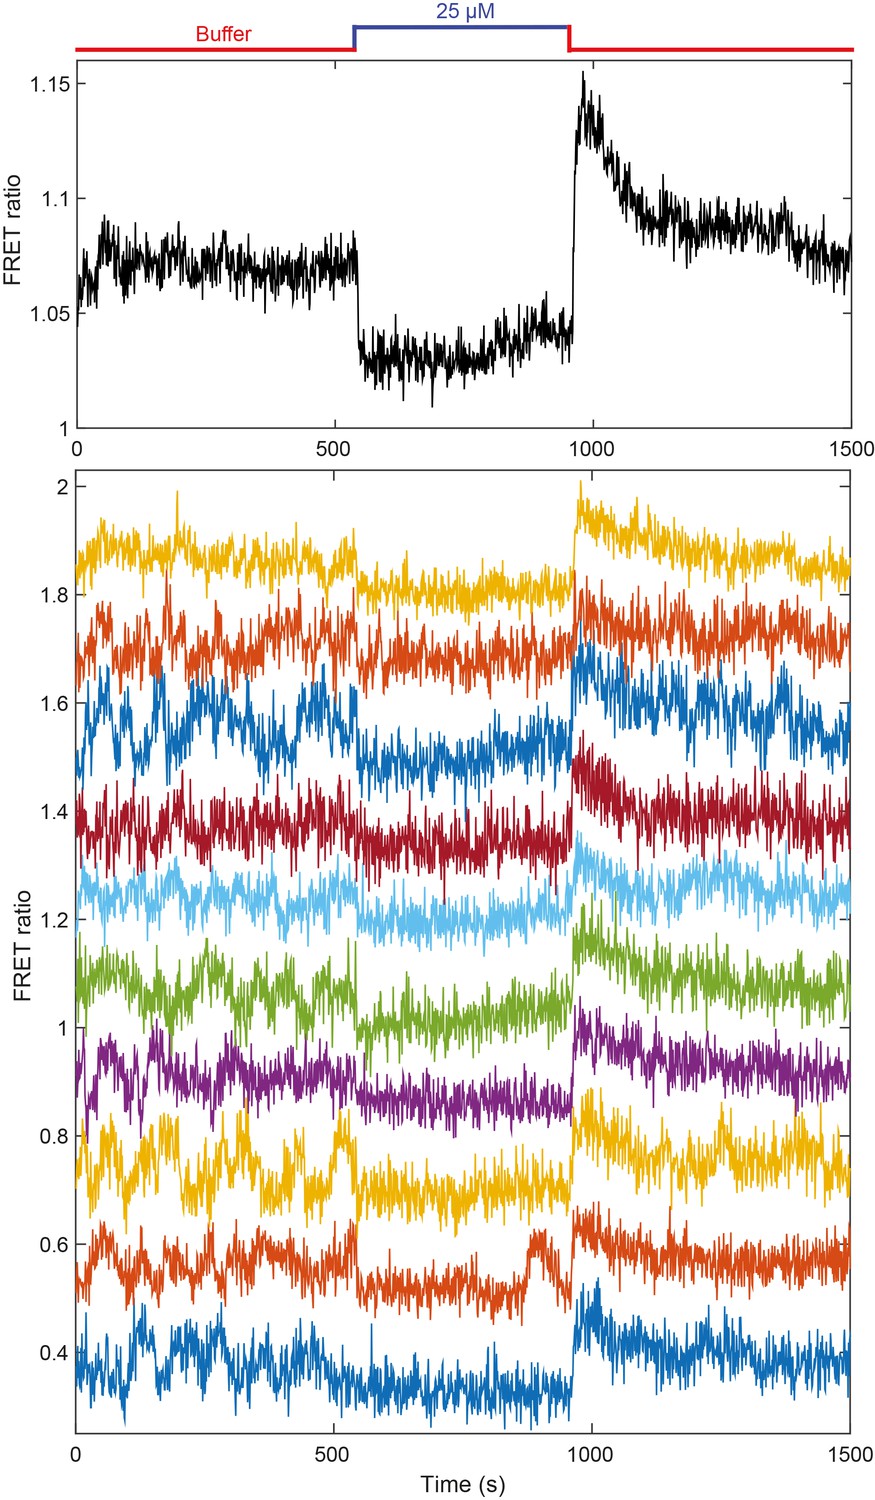
Additional FRET measurement for CheR+CheB+ cells.
Population averaged FRET ratio (top) and corresponding single cell FRET ratios (bottom), for a typical FRET experiment, with adaptation-proficient strain expressing TarQEQE as the sole receptor. Cells initially adapted in buffer were stimulated with 25 µM MeAsp, before returning to buffer. FRET ratios for individual cells have been shifted to facilitate visualization.
Figure 1—figure supplement 3
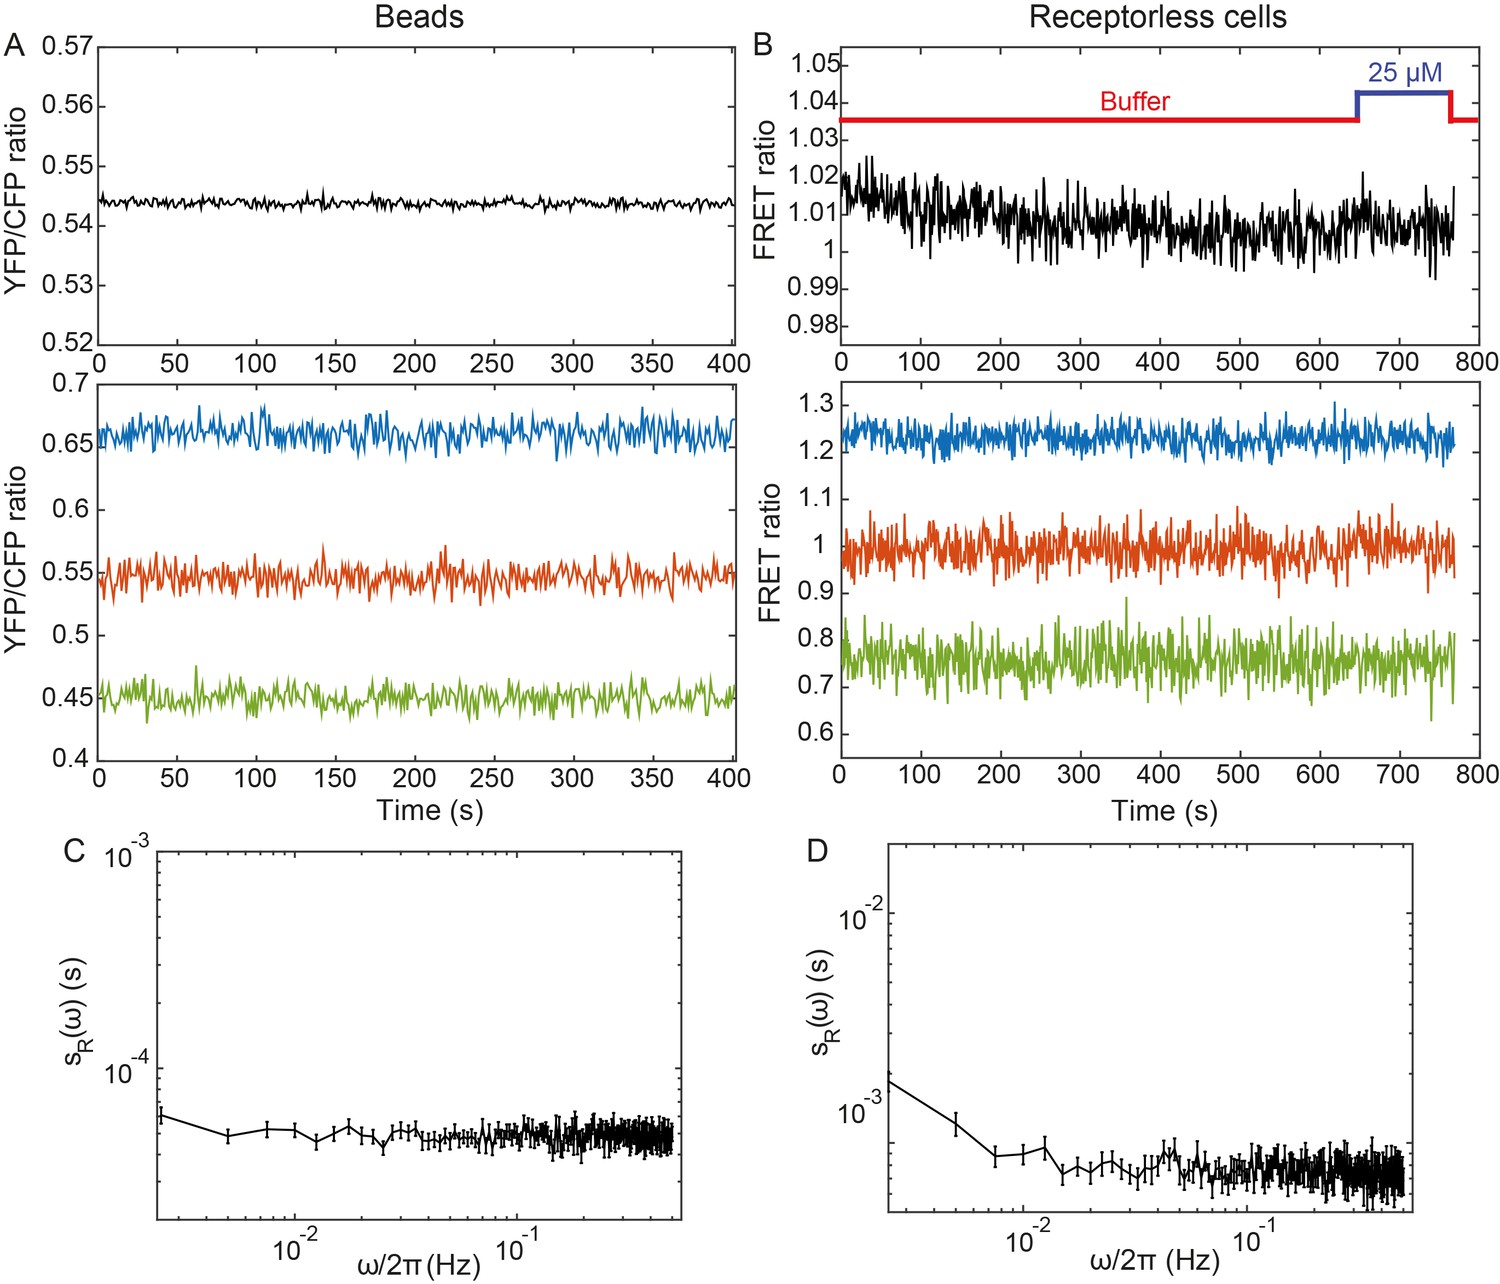
Negative controls.
(A,B) Average (top) and individual (bottom) measurements of the YFP/CFP ratio for fluorescent beads emitting both in CFP and YFP channels (A) and for receptorless cells expressing FRET pair (B). (C,D) The corresponding PSDs of the fluorescent beads and of the receptorless cells. Error bars represent standard errors of the mean (SEM) and sample sizes are 189 (beads) and 103 (receptorless strain) single objects.
Figure 1—figure supplement 4
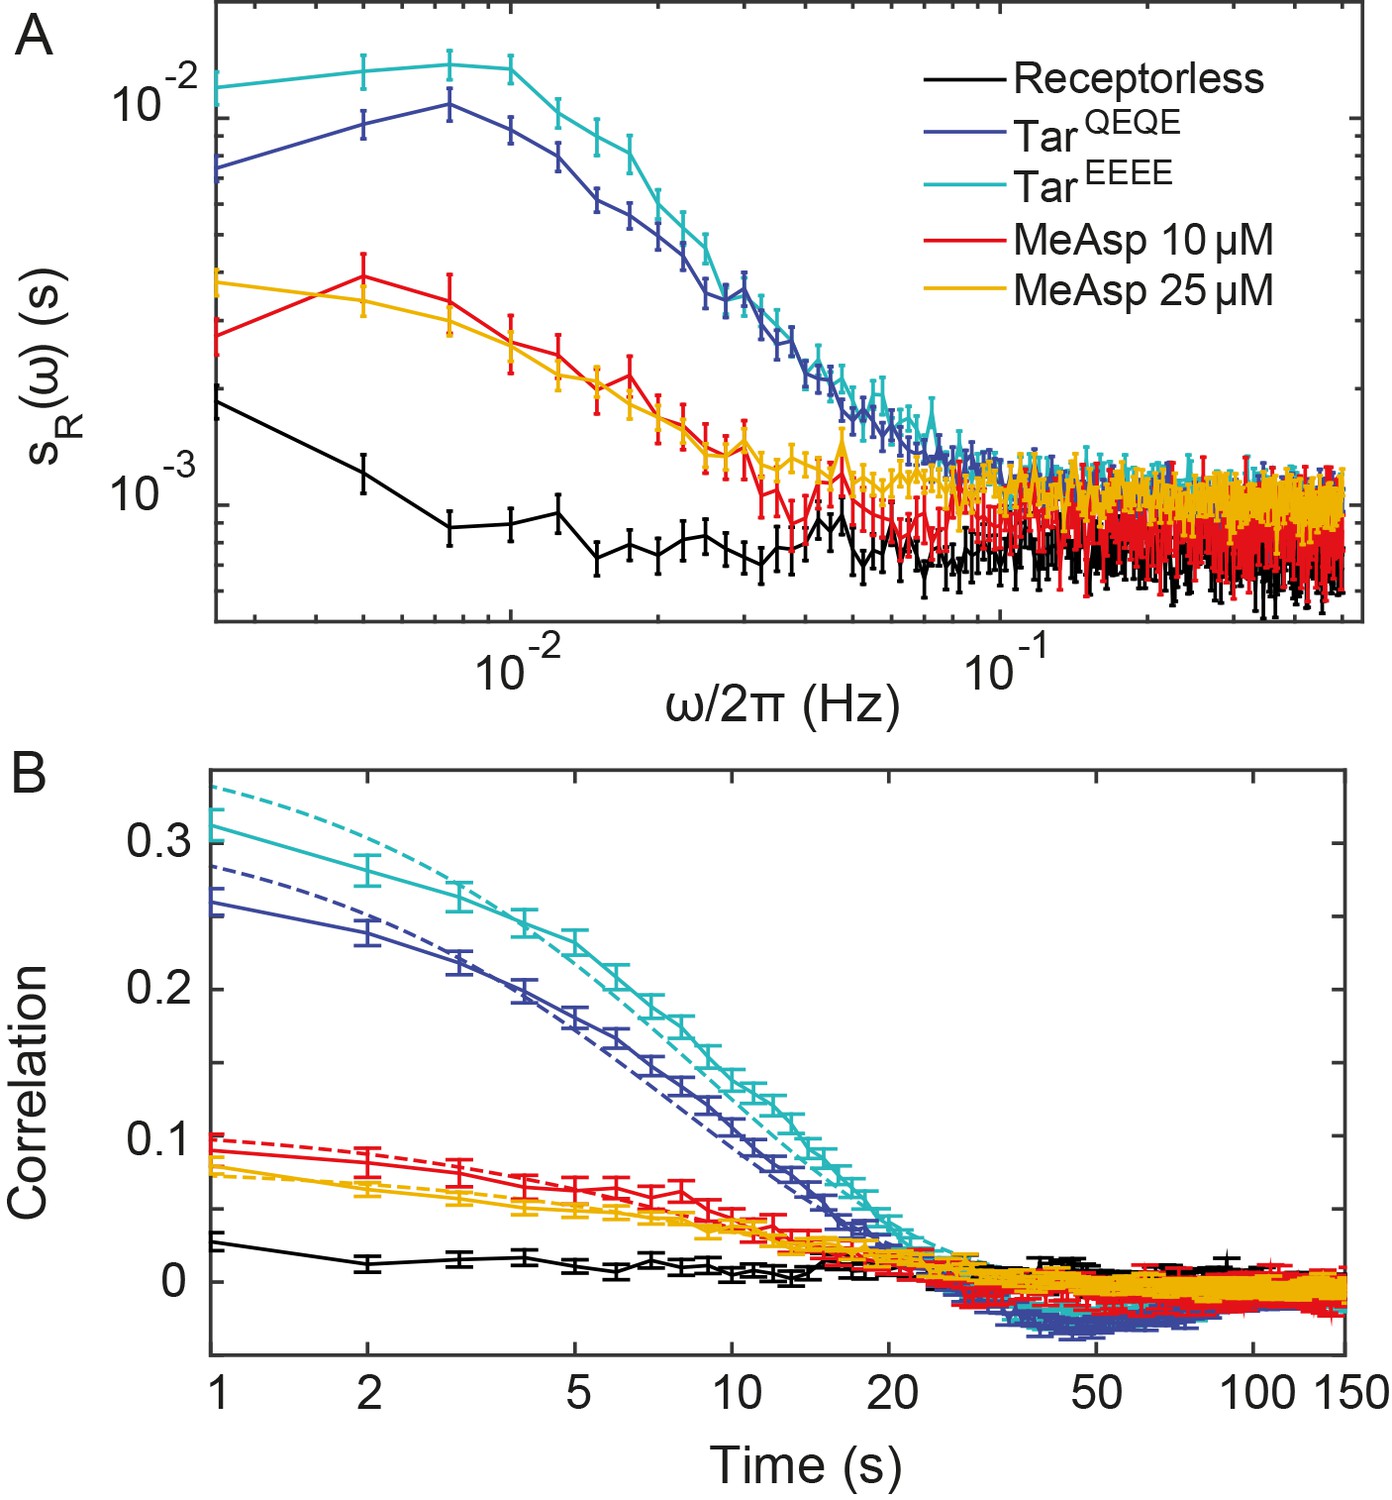
Additional analyses for CheR+CheB+ cells.
Same as Figure 1B,C but also including the PSDs (A) and time autocorrelation functions (B) of the FRET ratio measured for CheR+ CheB+ cells expressing TarEEEE and adapted in buffer or expressing TarQEQE and adapted to 25 µM MeAsp. The error bars represent SEM, and the sample sizes are 103 (receptorless strain), 203 (TarEEEE in buffer), 265 (TarQEQE in buffer), 69 (10 µM) and 219 (25 µM) single cells coming from at least three independent experiments in each case.
Figure 1—figure supplement 5
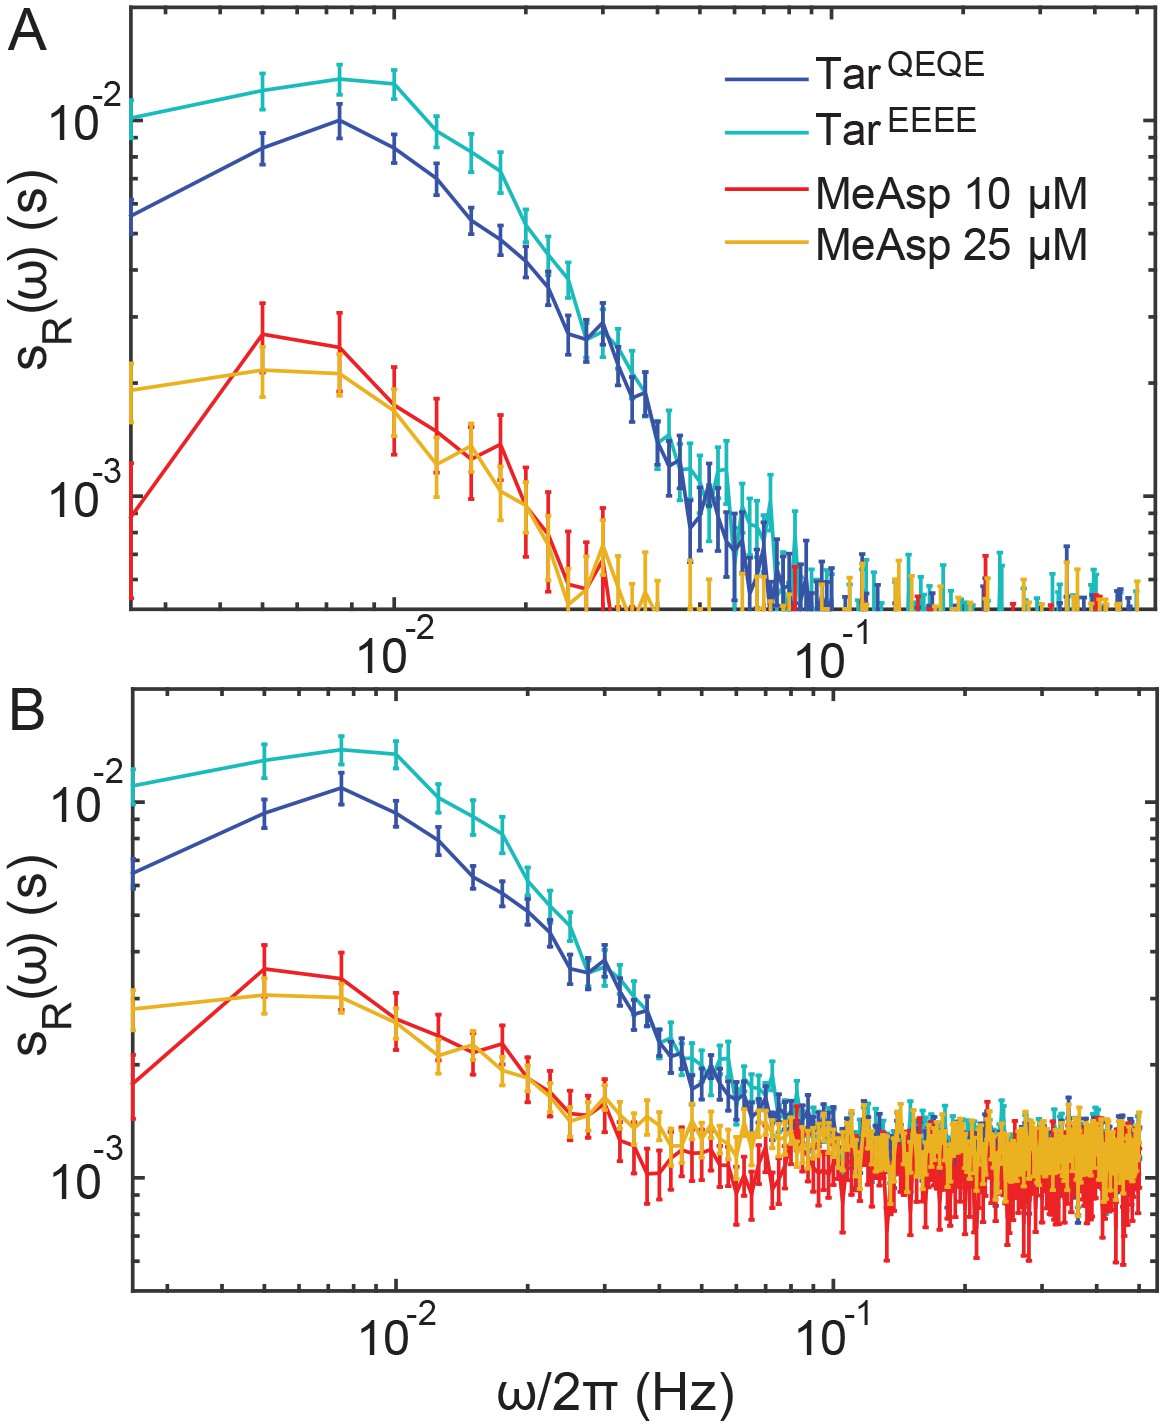
Correction of the PSDs for CheR+CheB+ cells for measurement noise.
(A) The PSDs for the different conditions (colors as in Figure 1—figure supplement 4) from which the PSD of the receptorless strain (representing measurement noise) was subtracted. (B) Same curves as (A) but with added constant value (9 × 10⁻⁴ s), in order to compare with Figure 1B. Statistics is as in Figure 1—figure supplement 4.
Figure 2 with 2 supplements
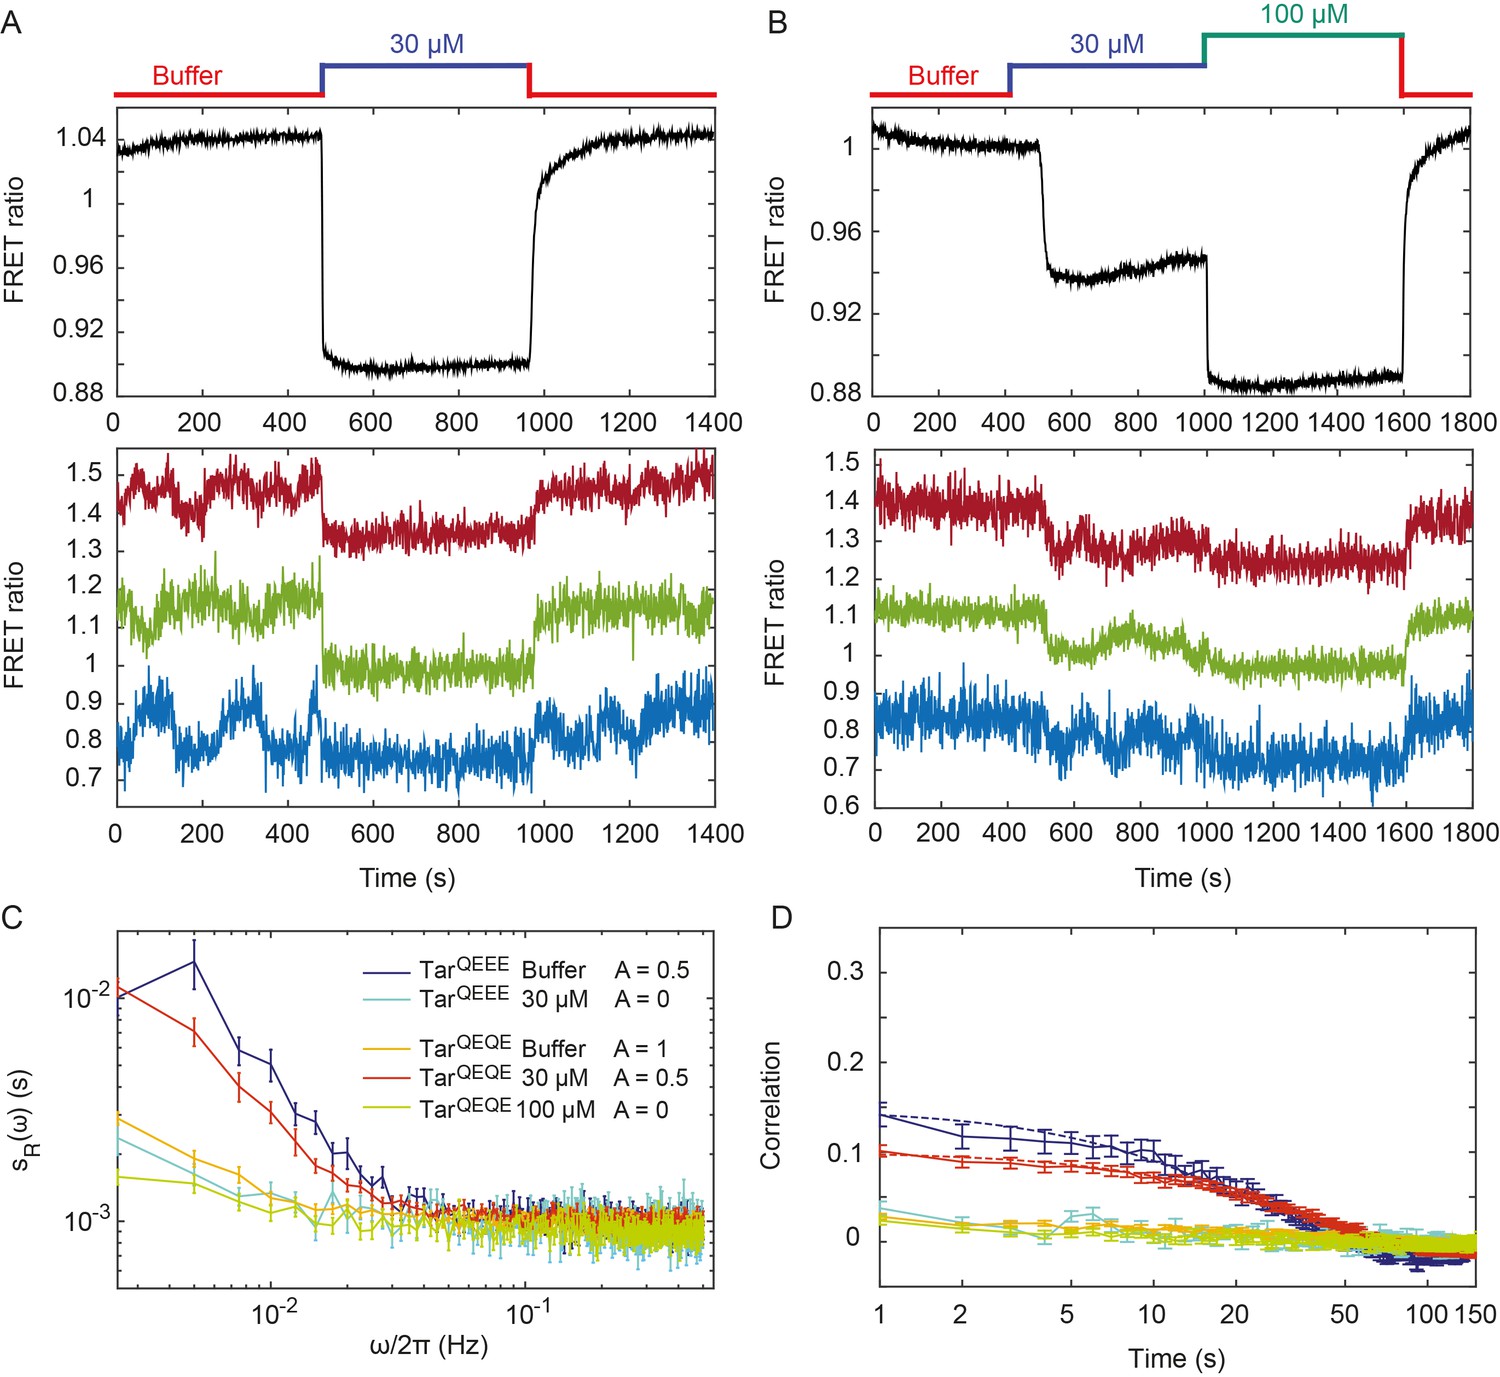
Pathway activity fluctuations in ΔcheRΔcheB cells.
(A) Time course of population-averaged (black; upper panel) and typical single-cell (colors; lower panel) measurements of the FRET ratio for ΔcheRΔcheB strain expressing TarQEEE as the sole receptor. Measurements were performed as in Figure 1. Cells were first equilibrated in buffer (red) and subsequently stimulated by addition (blue) and subsequent removal of 30 µM MeAsp, saturating stimulus for this receptor. (B) Same as (A) but for ΔcheRΔcheB strain expressing TarQEQE as the sole receptor and upon stimulation with 30 µM (blue) and then 100 µM (green) MeAsp. Note that for this receptor, 30 µM MeAsp is the sub-saturating stimulus whereas 100 µM MeAsp is the saturating stimulus. The measurement traces for single cells in (A) and (B) have been shifted along the y-axis to facilitate visualization. (C) PSD of the single-cell FRET ratio for TarQEEE in buffer (blue) or in 30 µM MeAsp (cyan), TarQEQE in buffer (orange), in 30 µM MeAsp (red) or in 100 µM MeAsp (green). (D) Corresponding time autocorrelation functions of the single-cell FRET ratio for indicated strains/conditions. Dashed lines show fits by single exponential decay. Error bars represent standard errors of the mean (SEM), and the sample sizes are 153 (TarQEEE, buffer), 65 (TarQEEE, 30 µM), 471 (TarQEQE, buffer), 404 (TarQEQE, 30 µM) and 136 (TarQEQE, 100 µM) single cells coming from at least three independent experiments in each case.
Figure 2—figure supplement 1

Correction of the PSDs for ΔcheRΔcheB cells for measurement noise.
Same as Figure 1—figure supplement 5 but for ΔcheRΔcheB cells. Statistics is as in the main Figure 2.
Figure 2—figure supplement 2
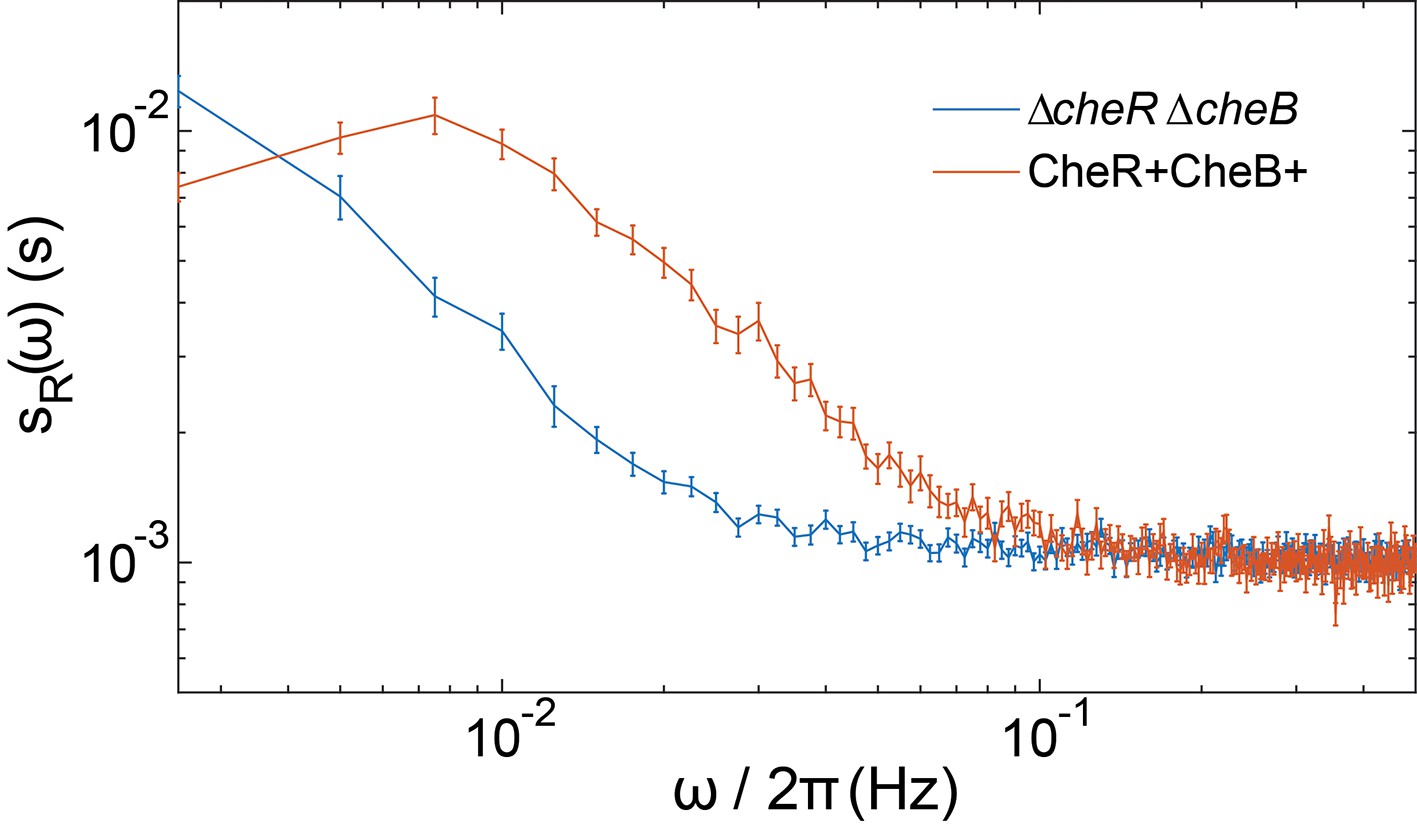
Comparison of ΔcheRΔcheB and CheR+CheB+ power spectra.
The PSDs of the FRET ratio are plotted for the ΔcheRΔcheB strain expressing TarQEQE as sole receptor and stimulated with 30 µM MeAsp (blue) and the CheR+ CheB+ strain expressing TarQEQE as sole receptor and adapted in buffer (red). The error bars represent standard errors of the mean (SEM), and the sample sizes are 265 (CheR+ CheB+) and 540 (ΔcheRΔcheB) single cells coming from at least three independent experiments in each case.
Figure 3 with 3 supplements
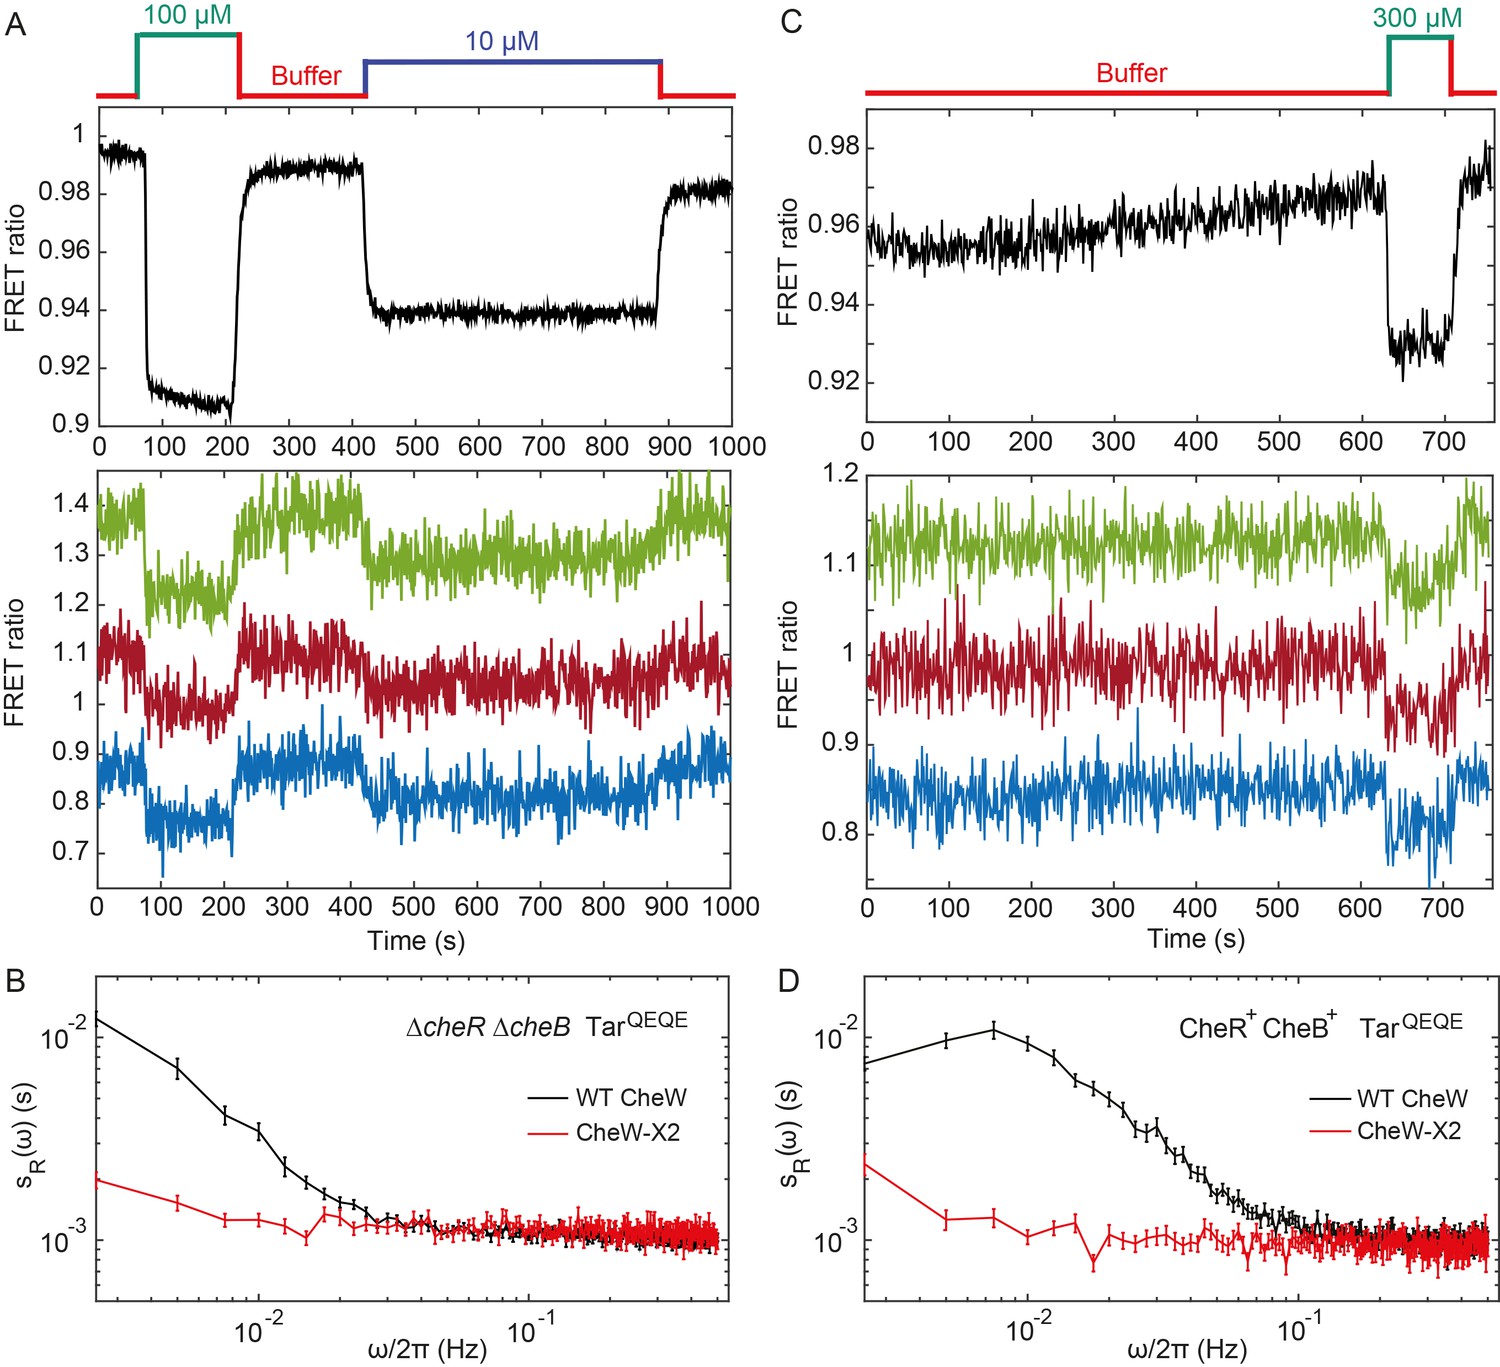
Fluctuation analysis in CheW-X2 cells.
(A) Population-averaged (upper panel) and typical single-cell (lower panel) measurements of the FRET ratio for ΔcheRΔcheB strain carrying CheW-X2 and TarQEQE as the sole receptor. Cells, which have a high activity in buffer, were first exposed to 100 µM MeAsp (saturating stimulus), and then to 10 µM MeAsp (sub-saturating stimulus), as indicated. The single-cell measurement traces have been shifted along the y-axis to facilitate visualization. (B) Power spectral density of the FRET ratio fluctuations in CheW-X2 ΔcheRΔcheB TarQEQE cells at intermediate activity (i.e., with 10 µM MeAsp) (red) compared to the equivalent strain carrying native (wild-type; WT) CheW and at 30 µM MeAsp (black – same data as Figure 2C). Error bars represent SEM, with sample sizes 404 (WT CheW; black) and 208 (CheW-X2; red) cells. (C) Same as (A) but for CheR+ CheB+ strain. The activity in buffer is at intermediate level (Figure 3—figure supplement 2), with 300 µM MeAsp completely inhibiting the kinase activity. (D) Power spectral density of the FRET ratio fluctuations in CheR+ CheB+ CheW-X2 strain in buffer (red) compared to the native WT CheW (black – same data as Figure 1C). Error bars represent SEM, with sample sizes 265 (WT CheW; black) and 191 (CheW-X2; red) cells.
Figure 3—figure supplement 1
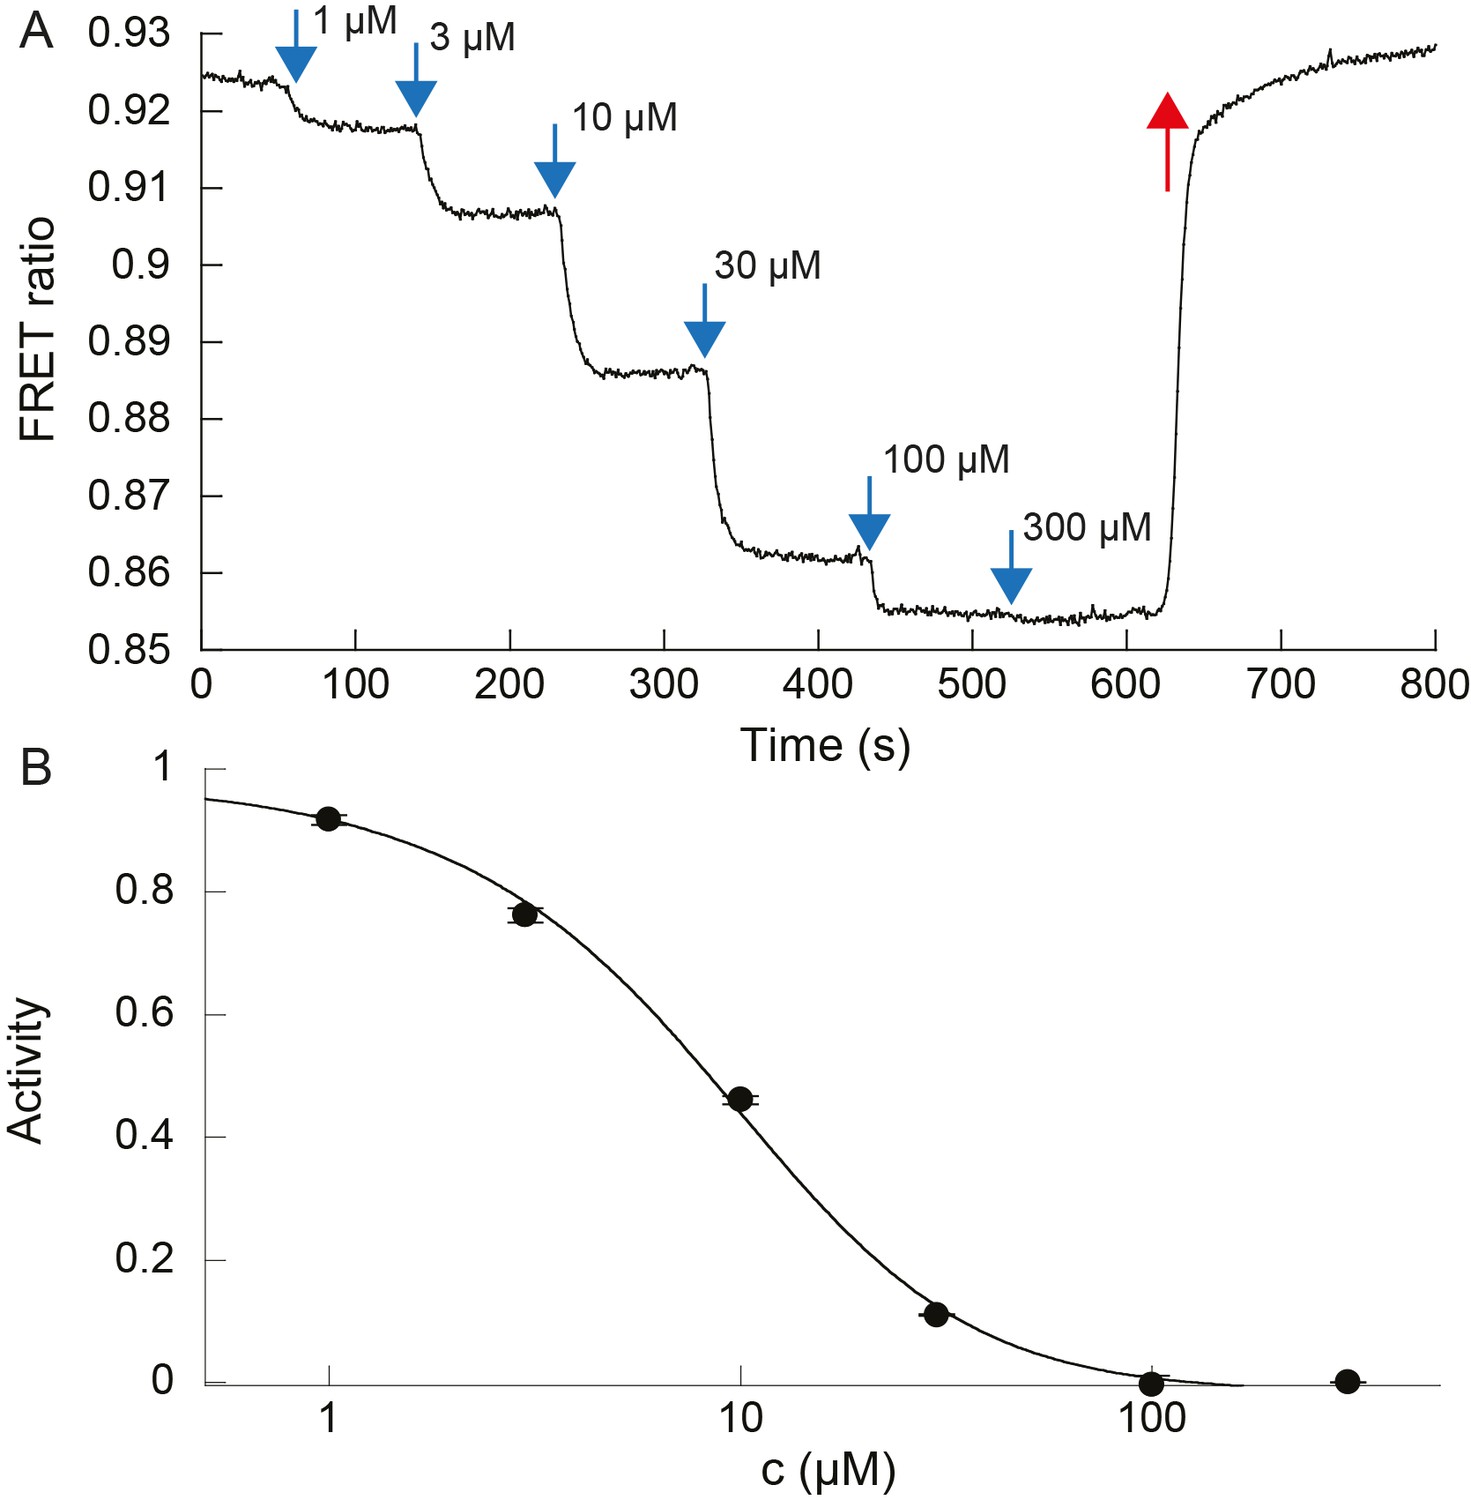
Dose response to MeAsp of ΔcheRΔcheB CheW-X2 cells expressing TarQEQE.
(A) Example of the FRET ratio (R) decreasing as increasing amounts of MeAsp were delivered to the cells. (B) The activity averaged over two biological replicates was estimated as , plotted as a function of MeAsp concentration c, and fitted using the Monod-Wyman-Changeux model, assuming a free energy difference in absence of ligand , yielding a cooperativity number N = 1.73 and a binding constant to inactive receptors KOFF = 3.92 µM. Fitting with a Hill function yields a Hill exponent H = 1.4 and a concentration of half-maximal response EC50 = 8.3 µM. Error bars indicate SEM. Measurements were carried out on confluent populations of cells.
Figure 3—figure supplement 2

Response of CheR+CheB+ strain expressing CheW-X2 and TarQEQE to attractant MeAsp and repellent Ni2+.
The activity dropped in response to MeAsp and increased in response to Ni2+, added at indicated concentrations, demonstrating that the cells have indeed an intermediate level of adapted kinase activity. The buffer for this experiment did not contain EDTA, an ion chelator for Ni2+.
Figure 3—figure supplement 3
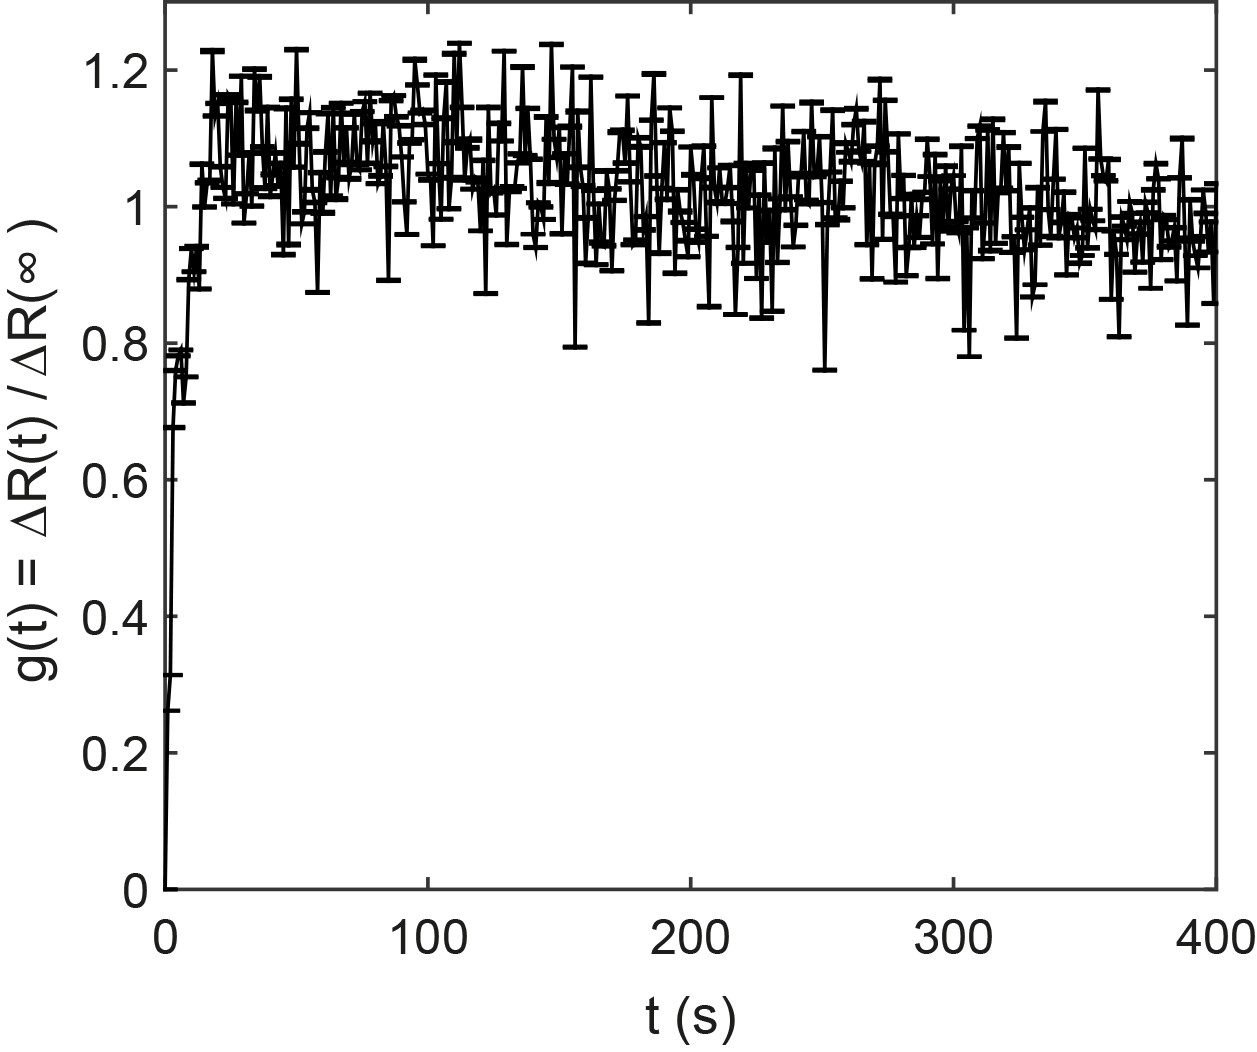
Response function for ΔcheRΔcheB CheW-X2 cells expressing TarQEQE as sole receptor.
The strain was subjected to 10 µM MeAsp to measure the response. Error bars indicate SEM and sample size is 120 single cells, in three biological replicates.
Figure 4 with 9 supplements
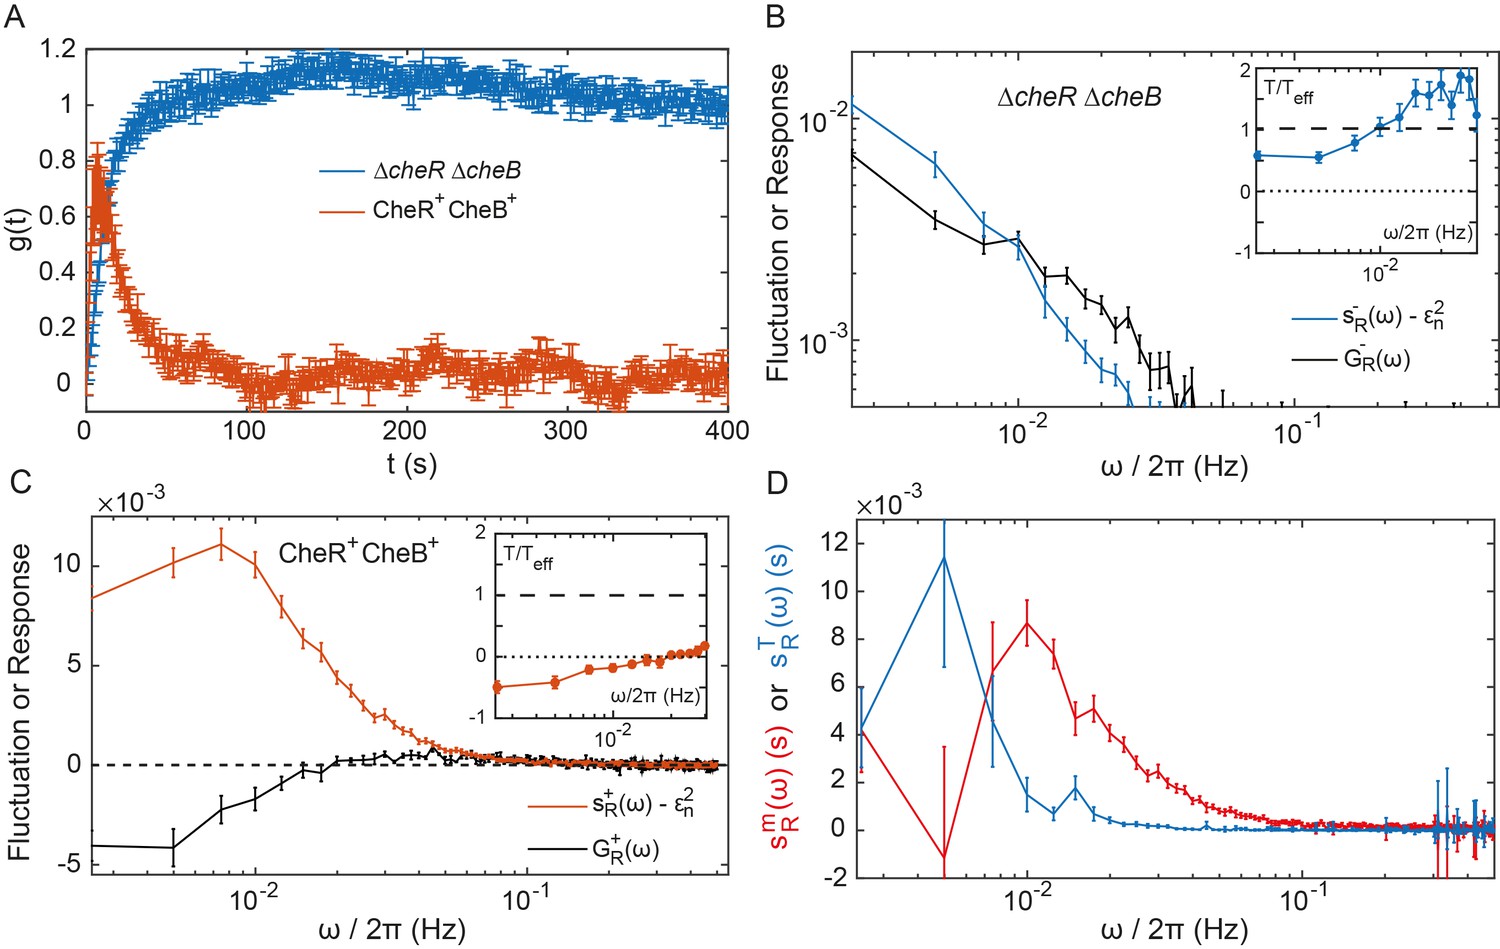
Fluctuation-dissipation analysis of the pathway activity.
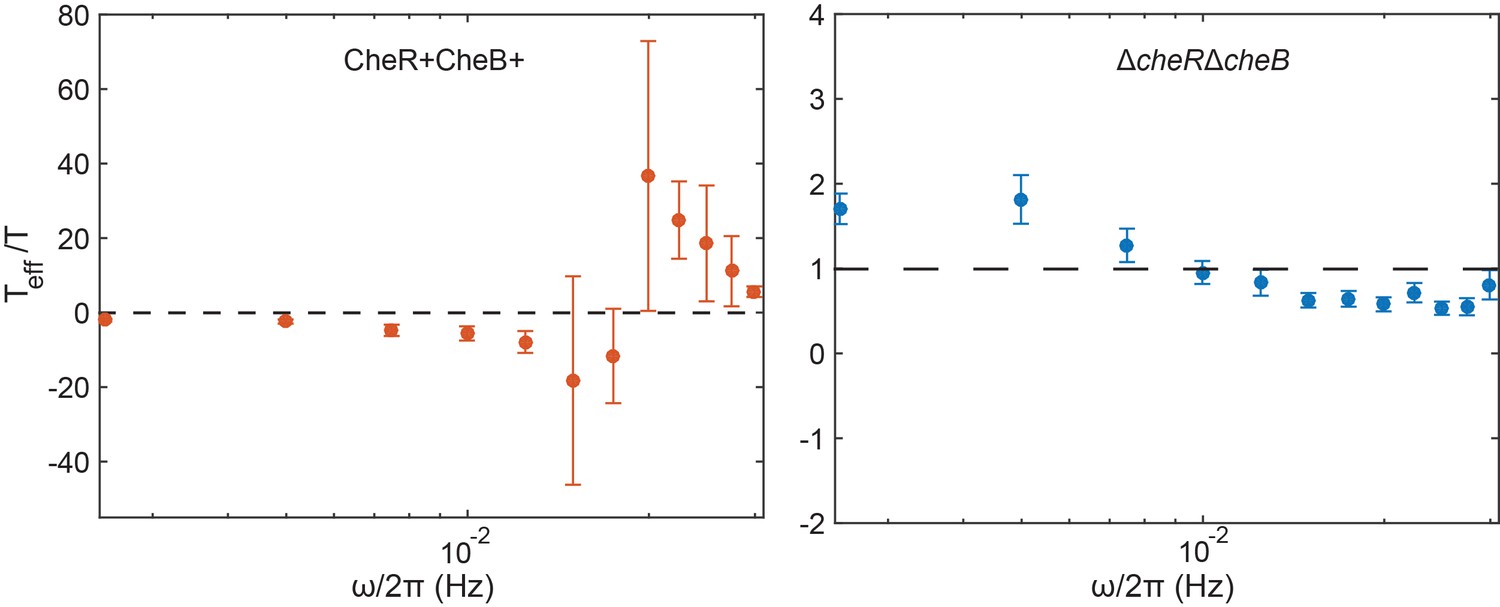
(A) Step response function both in presence (red) and in absence (blue) of the adaptation enzymes, evaluated in cells expressing TarQEQE that respond to a step change from buffer to 0.3 µM MeAsp (CheR+ CheB+) or 30 µM MeAsp (ΔcheRΔcheB). The step response function was calculated from the measurements shown in Figure 4—figure supplement 5 and in Figure 2B as described in text and in Appendix 1, 'Phenomenological step response function'. (B,C) The PSD of the FRET ratio fluctuations at (blue in B and red in C), and the corresponding dissipation (black) calculated using Equation (2), for ΔcheRΔcheB (B) and CheR+CheB+ (C) cells. The measurement shot noise , determined as the PSD of the receptorless cells (Figure 1B), was subtracted from . Insets show the ratio between the physical and effective temperatures, calculated using Equation (1). Dashed and dotted lines in B and C indicate and , respectively. (D) Contribution of thermal noise (blue) and the adaptation enzyme dynamics (red) to the PSD in CheR+ CheB+ cells, calculated from Equation (3) as explained in Appendix 1, 'Separating the contribution of methylation enzymes dynamics to the PSD in CheR+ CheB+ cells'. In all panels, error bars represent SEM, with sample sizes for the power spectra calculations being 540 (ΔcheRΔcheB) and 468 (CheR+ CheB+; aggregating data from cells expressing TarQEQE and TarEEEE as sole receptor) single cells from at least five biological replicates.
Figure 4—figure supplement 1
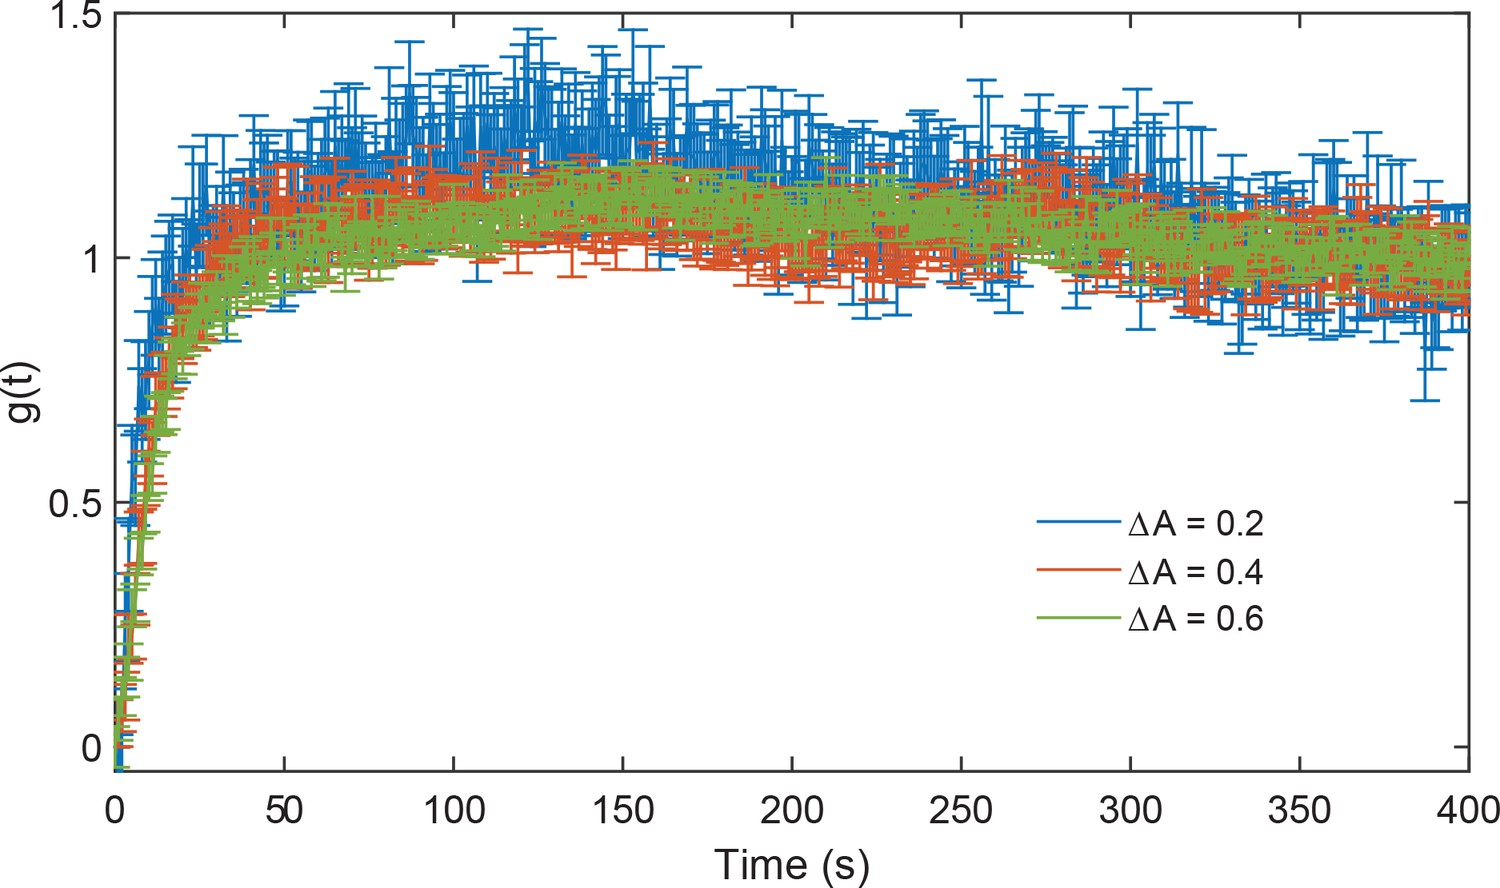
Validation of the linear response regime in ΔcheRΔcheB cells.
Response functions measured for stimulations by increasing MeAsp concentration from 25 to 30 µM, corresponding to an average activity change of 0.2 (blue), from 0 to 25 µM, corresponding to an average activity change of 0.4 (red), and from 0 to 30 µM corresponding to an average activity change of 0.6 (green; data from the main figure). Error bars represent SEM and sample sizes are 339 ( and ) and 540 () single cells in at least three biological replicates.
Figure 4—figure supplement 2
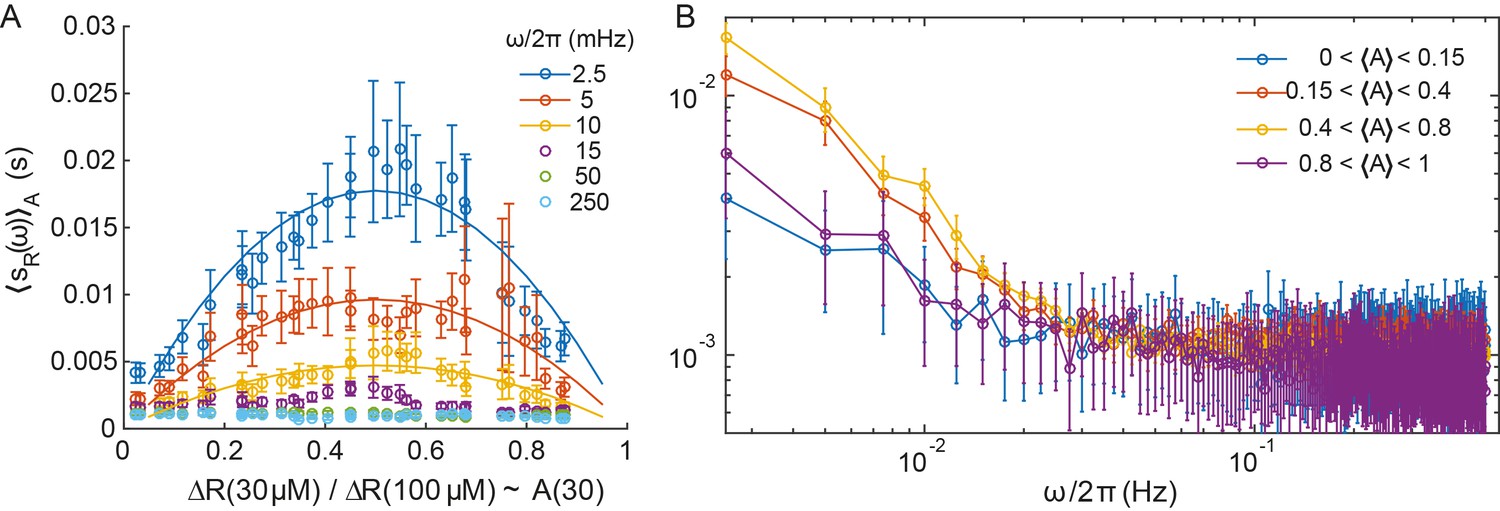
Power spectral density computed on subsets of the cell populations sorted according to their activity.
(A) The PSD as a function of the average activity of the subsets, for the indicated frequencies (dots) in the ΔcheRΔcheB strain expressing TarQEQE. The lines correspond to best fits by for each frequency considered. (B) The PSD as a function of frequency for subsets of cells sorted according to their activity as indicated in the legend. The error bars correspond to SEM, sample sizes are as described in Materials and methods, varying from 54 to 135 cells depending on the point, taken from at least five biological replicates.
Figure 4—figure supplement 3
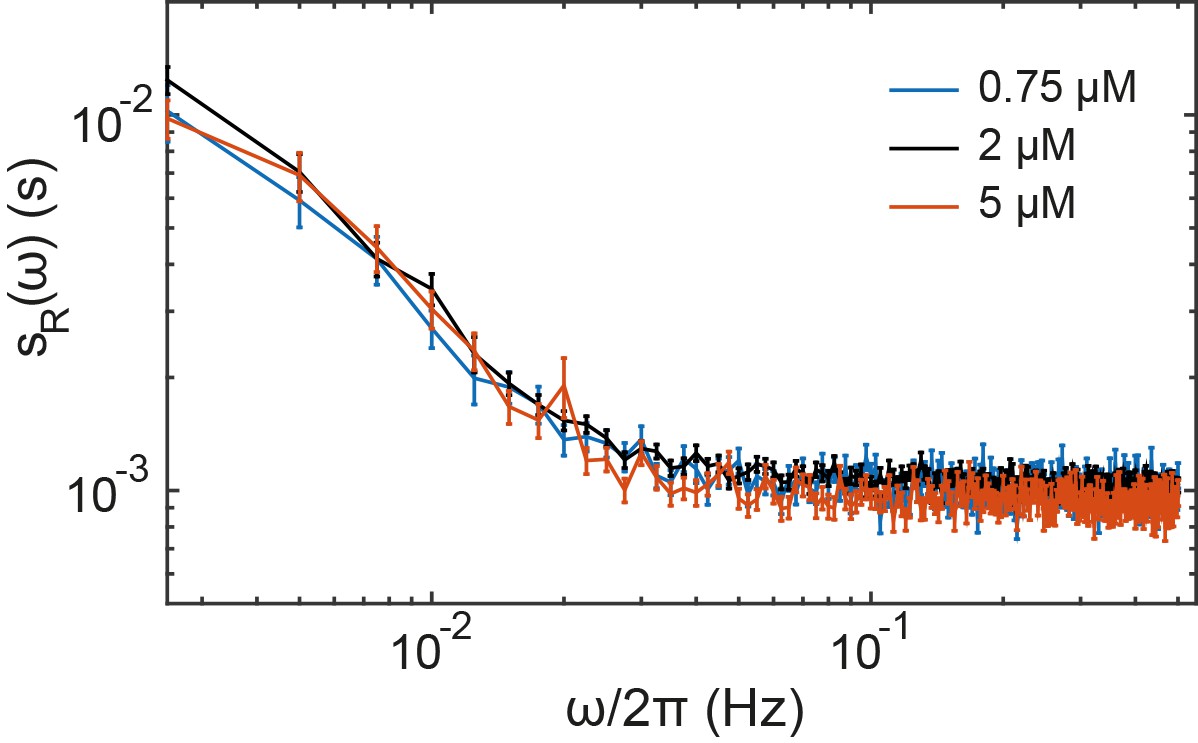
Effect of the receptor expression level on the noise in ΔcheRΔcheB cells.
The ΔcheRΔcheB strain expressing TarQEQE as the sole receptor from a plasmid under salicylate induction, was induced by 0.75 µM, 2 µM (standard experimental condition used in the main text) or 5 µM salicylate, resulting in approximately two-fold difference between the protein numbers (Endres et al., 2008). The power spectral density of fluctuation in cells prestimulated with 30 µM MeAsp, with average activity A = 0.5, was the same in all conditions. Error bars indicate SEM and sample sizes are 237 (5µM), 540 (2 µM) and 187 (0.75 µM) cells in at least three biological replicates.
Figure 4—figure supplement 4
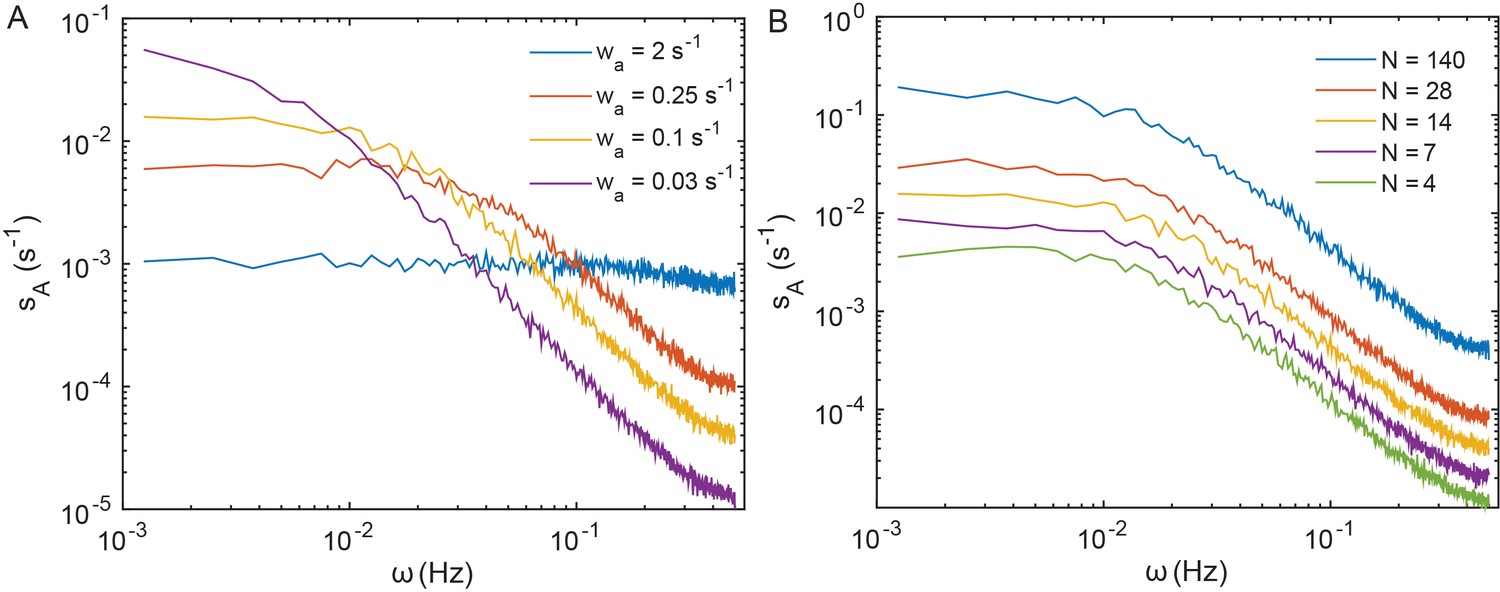
Power spectra of thermal fluctuations in a simulated model of the sensory cluster.
The model describes behavior of cooperative receptor complexes without adaptation (see Appendix 1, 'Simulation of a simplified model for the array of receptors'). Dependence of the PSD of the mean activity of the receptor cluster on the rate of cluster response to free energy perturbations at fixed number of allosteric units per team N = 14 (A) and on N at fixed = 0.25 s−1 (B). The total number of chemoreceptors was kept constant in all cases.
Figure 4—figure supplement 5

Example of FRET measurement used for the evaluation of .
A CheR+ CheB+ strain expressing TarQEQE as sole receptor and the CheY-YFP/CheZ-CFP FRET pair, equilibrated in buffer (red), was briefly stimulated with a saturating amount of MeAsp (25 µM; green) to evaluate the FRET ratio at zero activity, re-equilibrated in buffer, and then stimulated with a subsaturating amount of MeAsp (0.3 µM; blue). The FRET ratio was measured on an area of confluent cells. Normalized responses to 0.3 µM MeAsp from five independent replicates of this experiment were averaged to compute the step response function of Figure 4A.
Figure 4—figure supplement 6
Evaluation of the adaptation time.
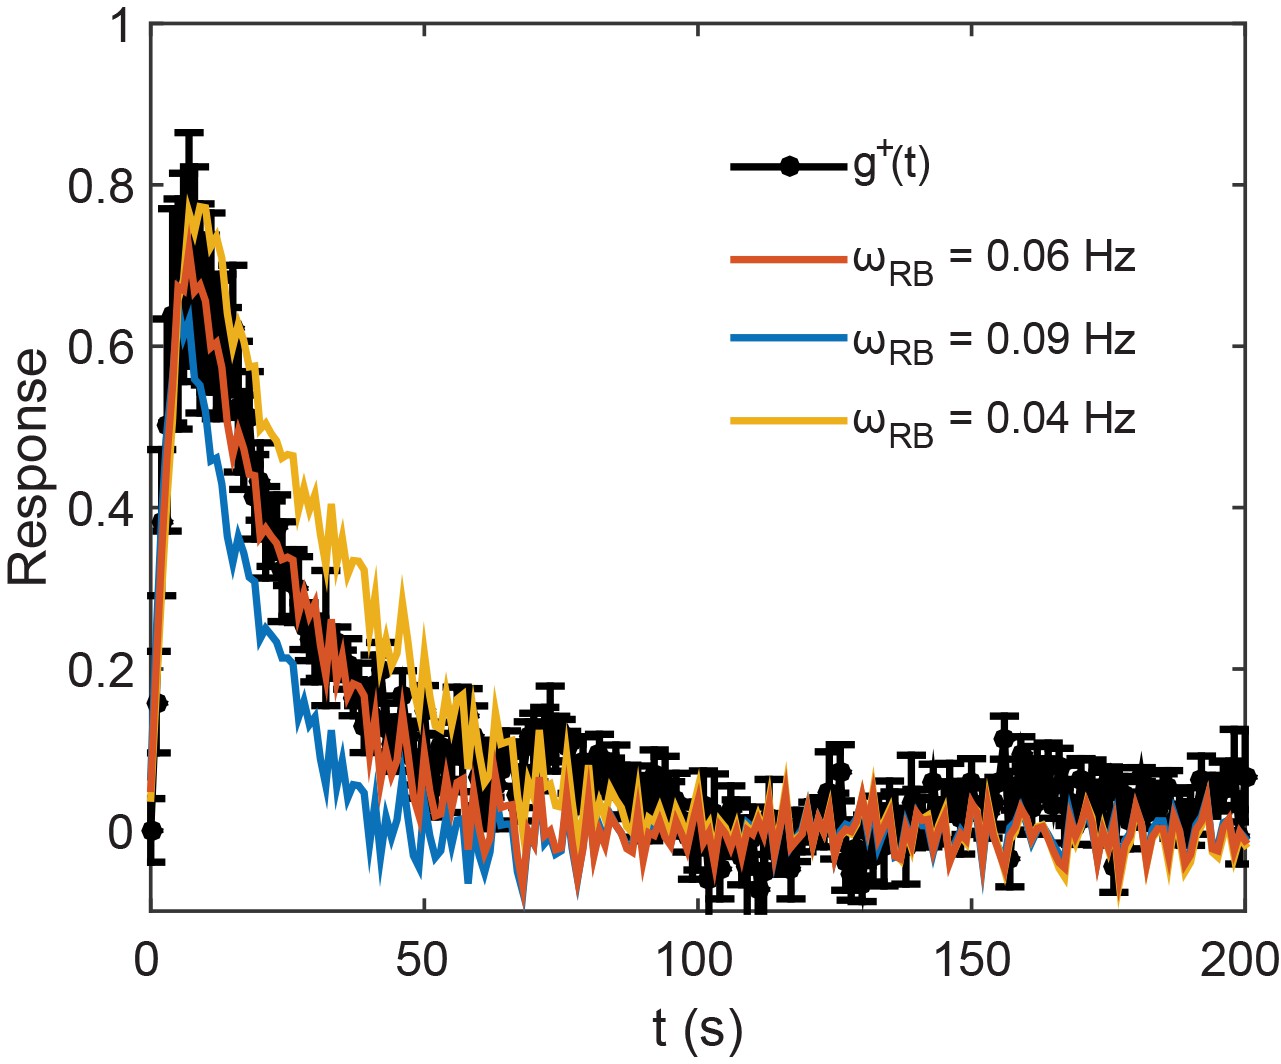
The normalized step response function in CheR+ CheB+, , from Figure 4A is plotted alongside its fits by Equation (A.30) of the Appendix, using the normalized step response function in ΔcheRΔcheB strain, , and the rate of adaptation at the activity level , for various values of . The best fit was with . The response function was measured over five areas of confluent cells from as many independent experiments.
Figure 4—figure supplement 7
Calculated effective temperatures.
Plots show the inverse of the quantities plotted in insets of Figure 4B,C, for ΔcheRΔcheB and for CheR+ CheB+ cells respectively. Dashed lines represent (CheR+ CheB+) and (ΔcheRΔcheB). Error bars and statistics are as in the main figure.
Figure 4—figure supplement 8
Inferred spectrum of the binding dynamics of CheR and CheB.
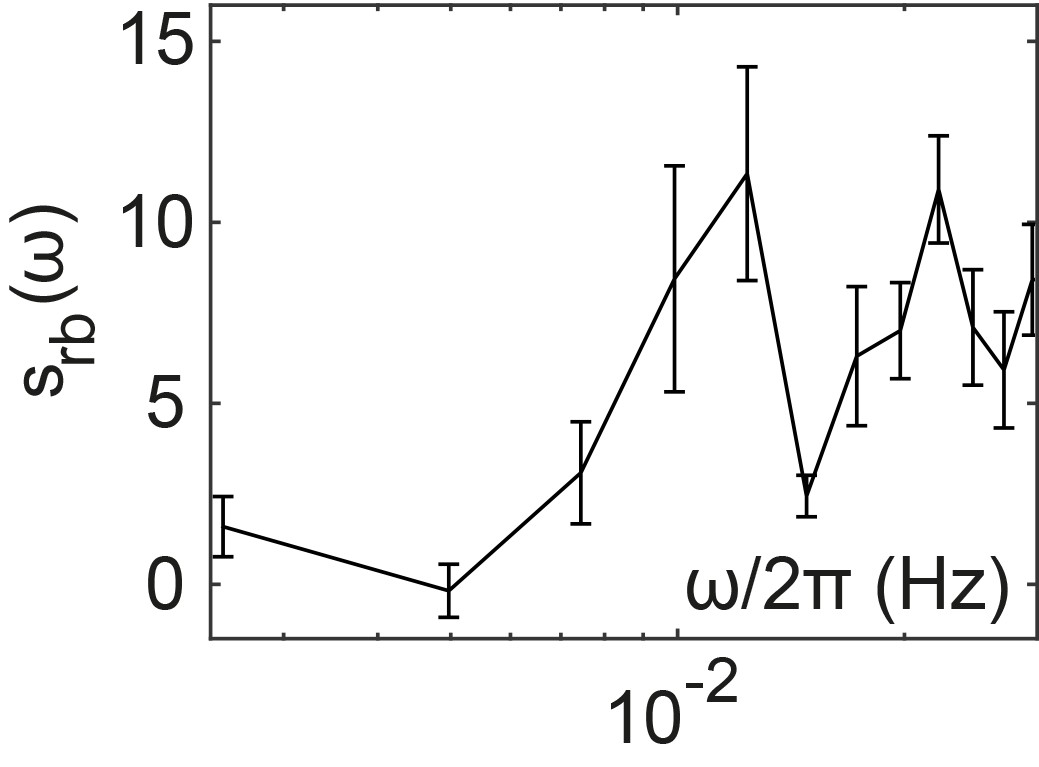
Spectrum was calculated in the frequency range where measurement noise is not dominant, using Equation (A.37). Error bars represent SEM, sample size as in the main figure.
Figure 4—figure supplement 9
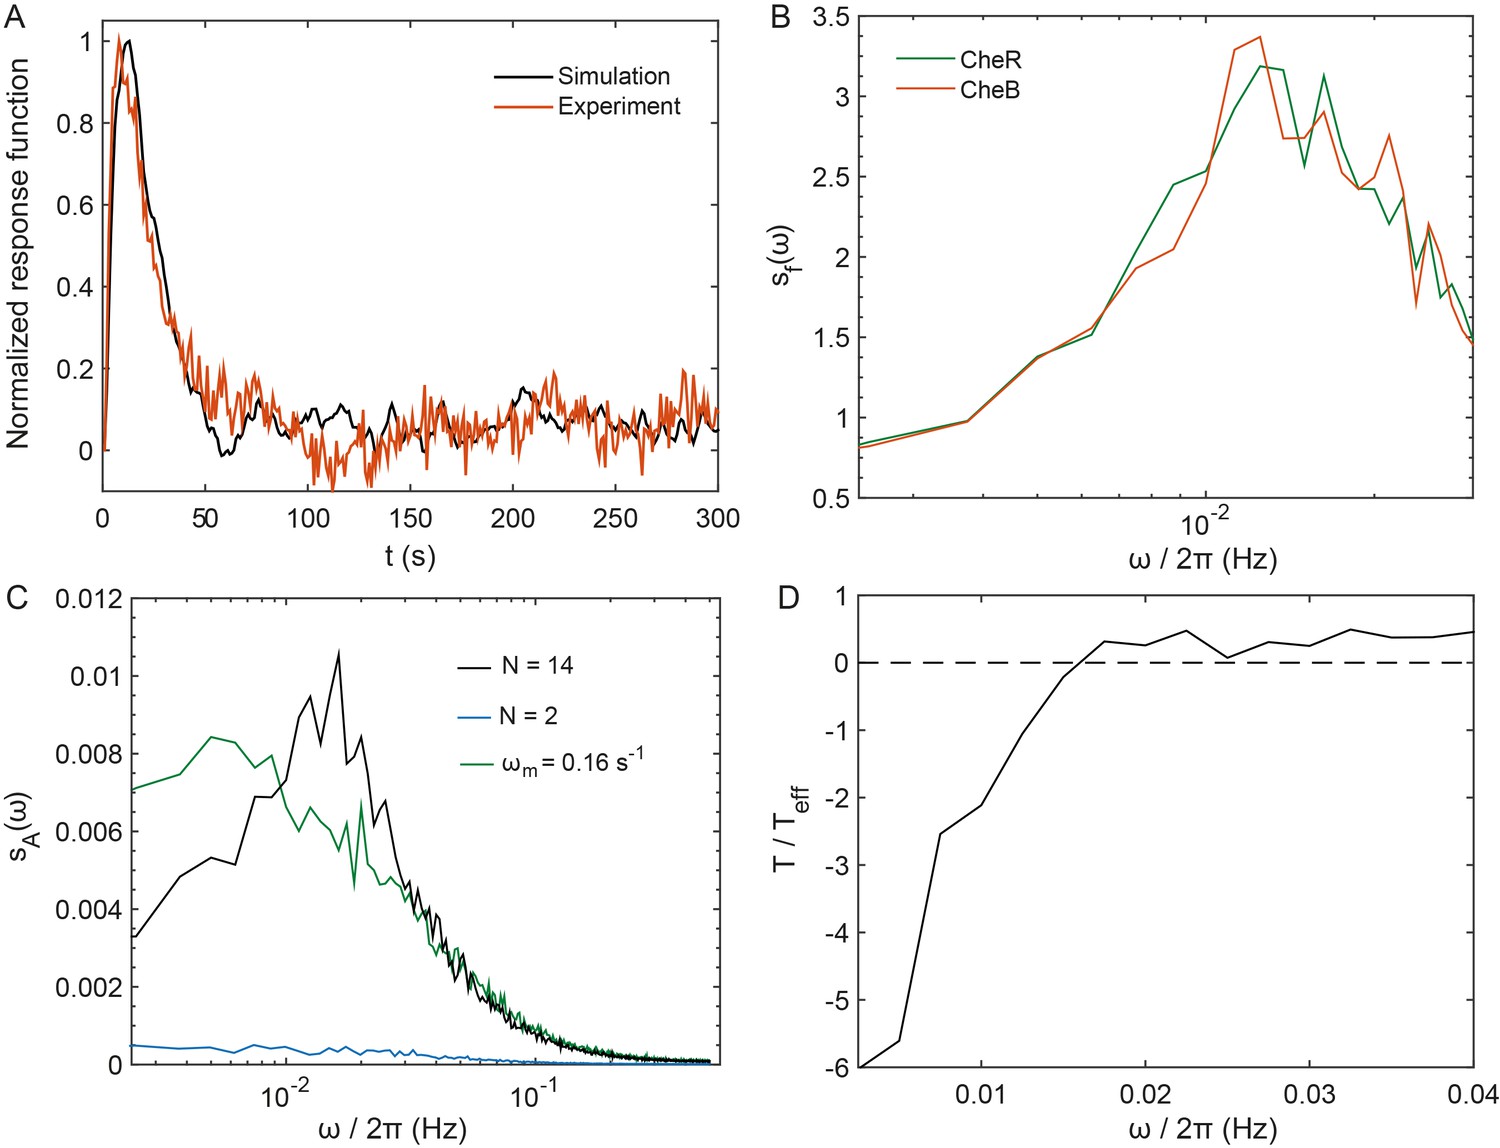
Simulation of the pathway activity fluctuations in adapting cells.
(A) Simulated response function for the model described in 'Simulation of a simplified model for the array of receptors' in Appendix 1. Comparison with experiments was used to calibrate the time scales of the model. A unique time scale s−1 was used to model the response of the cluster to free energy perturbations, averaging fast switching and long-term cluster dynamics, which is then not fully accounted for in this model (as in Figure 4—figure supplement 4). (B) Power spectrum of CheR and CheB binding to the receptors, showing features similar to its experimental equivalent, plotted in Figure 4—figure supplement 8. (C) The PSD of the level of phosphorylated CheY in the model simulations (black), which shows similarities with the contribution of methylation-enzymes dynamics to the PSD of the FRET ratio plotted in main Figure 4D. The PSD amplitude in the simulation was 100 times smaller than its experimental counterpart (since ), indicating that activity perturbations 10 times smaller than in experiment. The PSD was also determined when the cooperativity was reduced from its standard value of 14 to 2, mimicking the CheW-X2 strain (blue); and when the specific rate of (de)methylation was decreased from its standard value to 0.16 s−1, mimicking reduced efficiency of (de)methylation in absence of neighborhood assistance (green). (D) Inverse effective temperature inferred from (A) and (C) in the simulations, showing behavior similar to the experiments, notably the characteristic sign inversion as in Figure 4C. Differences emerged at very low frequencies, presumably because the model does not take long-term receptor array dynamics into account. In the simulated MWC model of cooperative teams, the fluctuation-dissipation relation can be written for the receptor team, which leads to effective temperature values similar to the experiments (see Appendix 1, 'Simulation of a simplified model for the array of receptors').
Figure 5
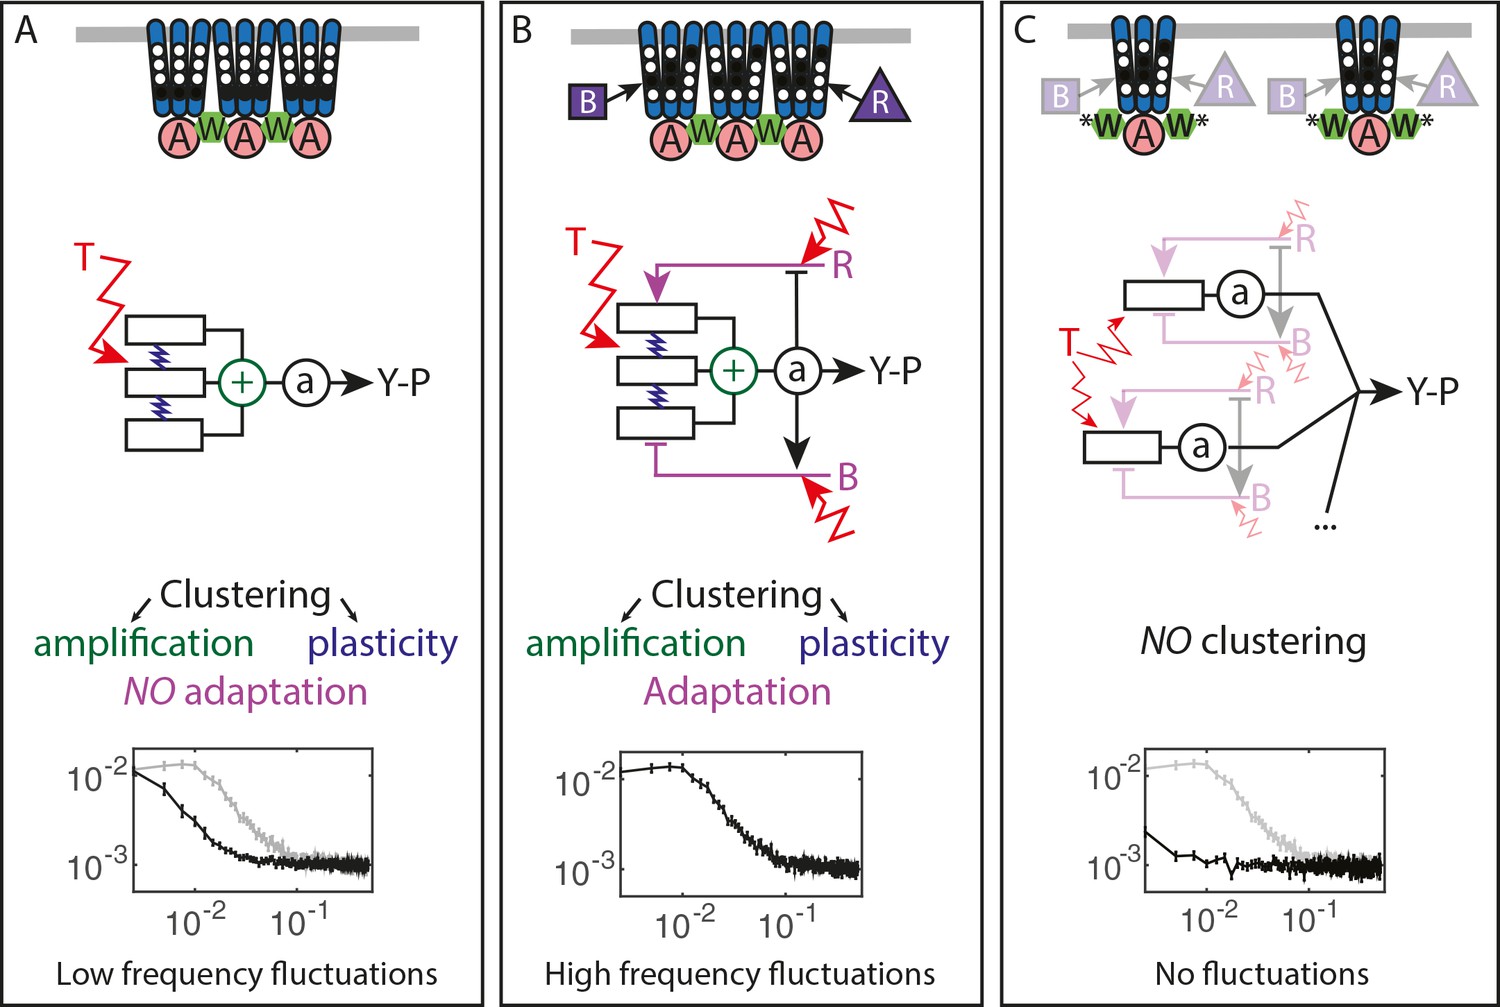
Multiple sources of signaling fluctuation in the chemotaxis pathway.
(A) In the absence of adaptation enzymes, thermal fluctuations stimulating – and amplified by – the dynamic receptor cluster lead to low frequency fluctuations (<0.01 Hz) around intermediate cluster activity. The blue springs symbolize the plasticity of the receptor array, the green its cooperativity. (B) In adapted wild-type cells, thermal fluctuations and fluctuations in the dynamics of CheR and CheB are amplified by the dynamic chemoreceptor cluster, which leads to fluctuations of the activity at frequencies around 0.03 Hz. (C) In the absence of clustering, responsive but non-amplifying receptor complexes do not produce observable activity fluctuations, whether or not adaptation enzymes are present. Graphs show the PSD of the FRET ratio measured in each respective case (black). In (A,C) the wild-type curve is shown for comparison (gray).
Tables
Table 1
Parameters of the FDT analysis
https://doi.org/10.7554/eLife.26796.025| Parameter | Value |
|---|---|
Appendix 1—table 1
Parameters used in the simulations.
https://doi.org/10.7554/eLife.26796.030| Parameter | Value | Reference |
|---|---|---|
| 14 | This study (based on experimental values) | |
| 300 | This study (based on experimental values) | |
| 0.016 | Adapted from (Clausznitzer et al., 2010) | |
| 1 s−1 | This study | |
| 0.15 s−1 | This study | |
| 0.5 s−1 | This study | |
| 1 s−1 | (Vladimirov et al., 2008) | |
| 0.25 s−1 | This study | |
| 240 | (Li and Hazelbauer, 2004) | |
| 140 | (Li and Hazelbauer, 2004) |
Additional files
-
Supplementary file 1
List of strains and plasmids used in the study.
- https://doi.org/10.7554/eLife.26796.027
-
Transparent reporting form
- https://doi.org/10.7554/eLife.26796.028
Download links
A two-part list of links to download the article, or parts of the article, in various formats.
Downloads (link to download the article as PDF)
Open citations (links to open the citations from this article in various online reference manager services)
Cite this article (links to download the citations from this article in formats compatible with various reference manager tools)
Multiple sources of slow activity fluctuations in a bacterial chemosensory network
eLife 6:e26796.
https://doi.org/10.7554/eLife.26796


