Size uniformity of animal cells is actively maintained by a p38 MAPK-dependent regulation of G1-length
- The Hospital for Sick Children, Canada
- University of Toronto, Canada
- Novartis Institutes for BioMedical Research, United States
- University of Michigan, United States
- University of Washington, United States
- Carnegie Mellon University, United States
- Harvard Medical School, United States
Figures
Figure 1 with 5 supplements
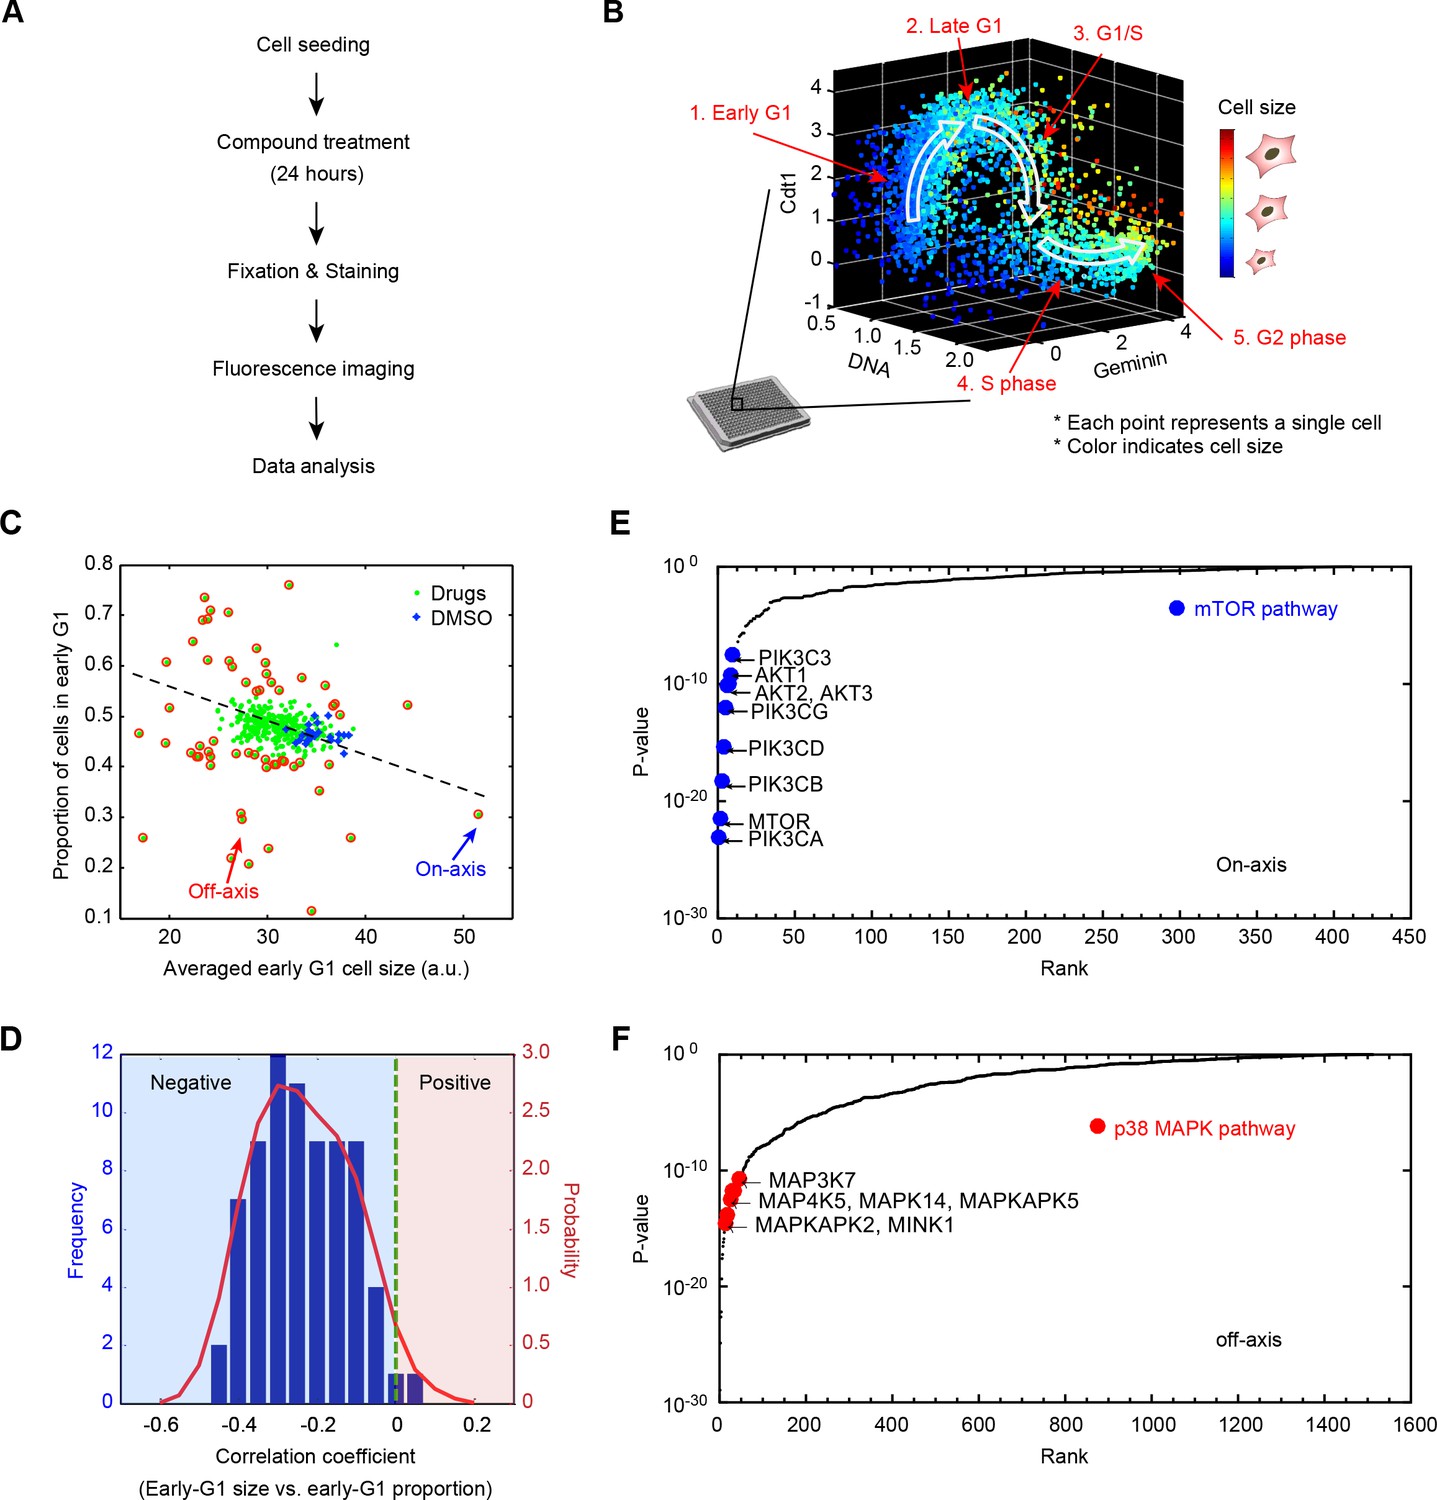
Results from a small molecule screen implicate the p38 MAPK pathway in the coordination of cell size and progression through G1.
(A) A flowchart of the chemical screen demonstrating the major steps. (B) Raw data of cell size and cell cycle stage measured from a single control well in the screen. The scatter plot represents single-cell measurements of cell size and three markers of cell cycle stage; Cdt1 (mKO2-hCdt1), Geminin (mAG-hGem) and DNA (DAPI). Every point in the plot represents measurements on one single cell. Cell size is represented by a color scheme depicted by the colorbar on the right. White arrows are added to guide the reader along the cell cycle trajectory. (C) Average size of early G1 cells is negatively correlated with the fraction of cells in early G1. The scatterplot displays the result from one example 384-well plate. Each point on the plot corresponds to one particular screened condition (screened compound or control), and represents the average size of early G1 cells in that condition versus the proportion of cells in G1. Red circles highlight the conditions that significantly affect the size of early G1 cells and/or the proportion of cells in G1. The arrows designate examples of on-axis and off-axis compounds (also see Figure 1—figure supplement 3). (D) Distribution of correlation coefficients between average size of early G1 cells and the fraction of cells in G1, calculated for all screened plates (as described in Materials and methods - Analysis of the compound screen), demonstrating that the two variables are significantly negatively correlated (p<10−16). (E, F) Ranked p-values from the target enrichment analysis of on-axis and off-axis compounds, respectively (Fisher’s exact test). Components of the mTOR pathway and p38 MAPK pathway, which are highlighted, are among the top-ranked hits of on-axis and off-axis phenotypes, respectively. The Matlab script used to perform the target enrichment analysis is presented in Figure 1—source code 1.
-
Figure 1—source data 1
The screen metadata used to identify on-axis and off-axis outliers.
- https://doi.org/10.7554/eLife.26947.009
-
Figure 1—source data 2
The analysis script to visualize on-axis and off-axis outliers using Figure 1—source data 1.
- https://doi.org/10.7554/eLife.26947.010
-
Figure 1—source code 1
The Matlab script used to perform the target enrichment analysis.
- https://doi.org/10.7554/eLife.26947.011
Figure 1—figure supplement 1
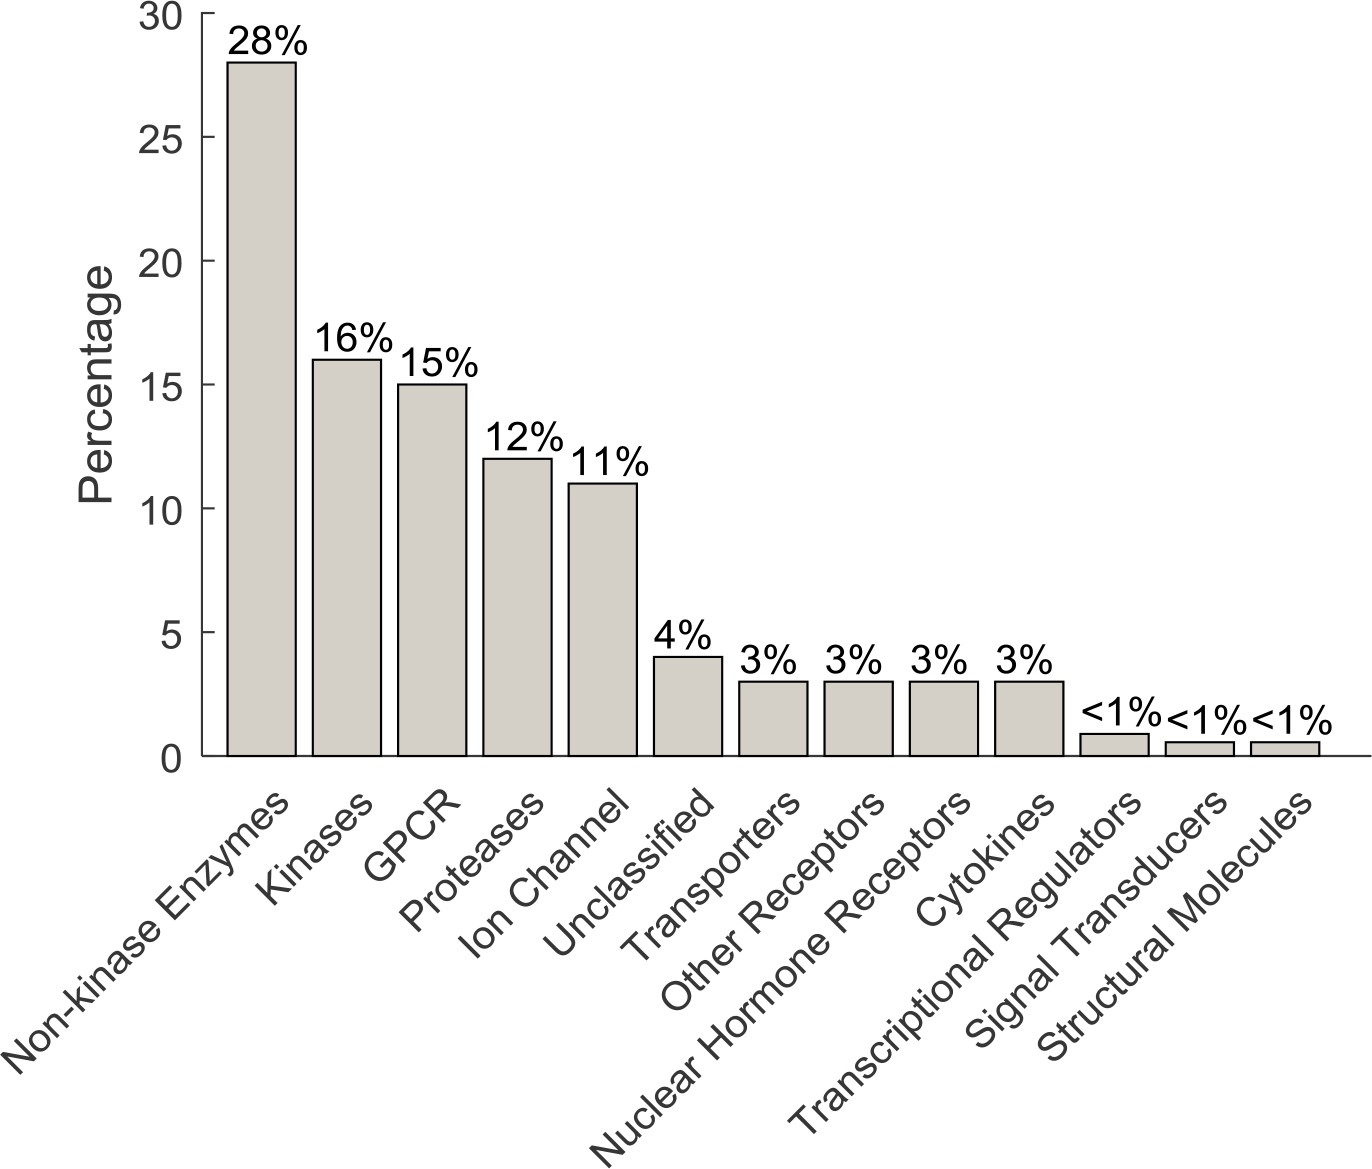
Percentage of the target class coverage of the MOA Box compounds.
https://doi.org/10.7554/eLife.26947.004
Figure 1—figure supplement 2
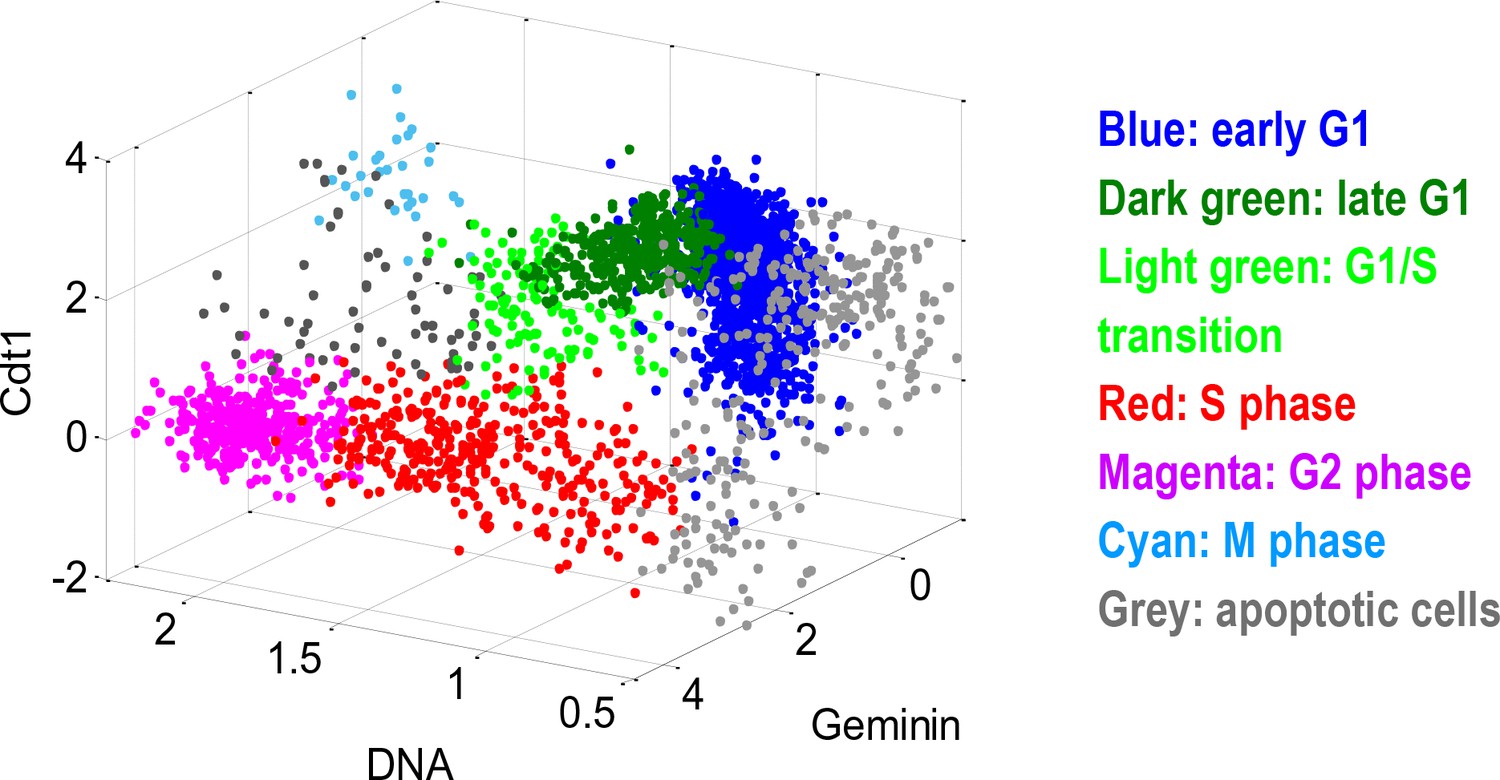
Cells from each well were partitioned, according to the three cell cycle indicators (DNA, Geminin, Cdt1), into discrete cell cycle stages.
The scatterplot illustrates a control well (DMSO treated). Each point in the scatterplot is an individual cell. The DNA axis is normalized (1 = 2N, 2 = 4N). The Geminin and Cdt1 axes are in log scale (a.u.).
Figure 1—figure supplement 3
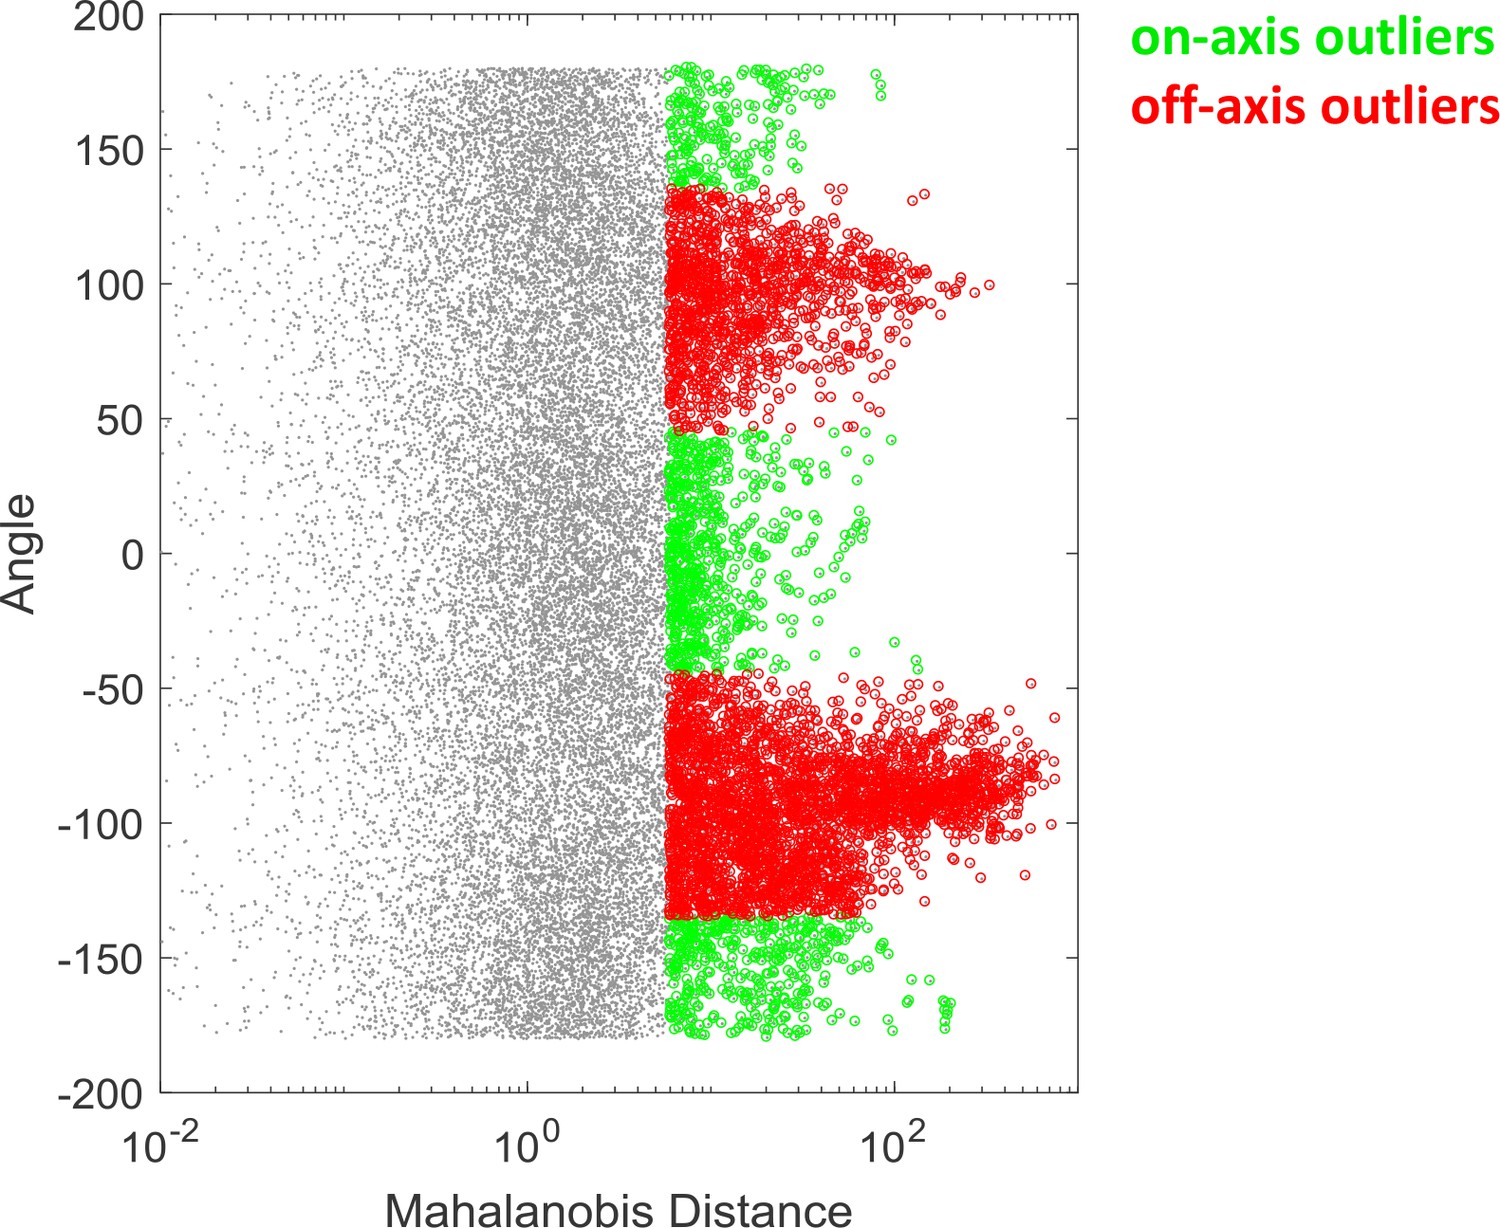
Identification of on-axis and off-axis outliers.
The outliers of the screen (as exemplified in Figure 1B) were identified by thresholding (5% significance) the Mahalanobis distance. The outliers were then classified into on-axis or off-axis based on the angle of the data points with reference to the major principle vector. Specifically, outliers with an angle smaller than 45 degree were classified as on-axis outliers, and otherwise off-axis outliers. See Materials and methods - Analysis of the compound screen for details. The metadata from the compound screen can be found in Figure 1—source data 1. The source code used to visualize the results is presented in Figure 1—source code 1.
Figure 1—figure supplement 4
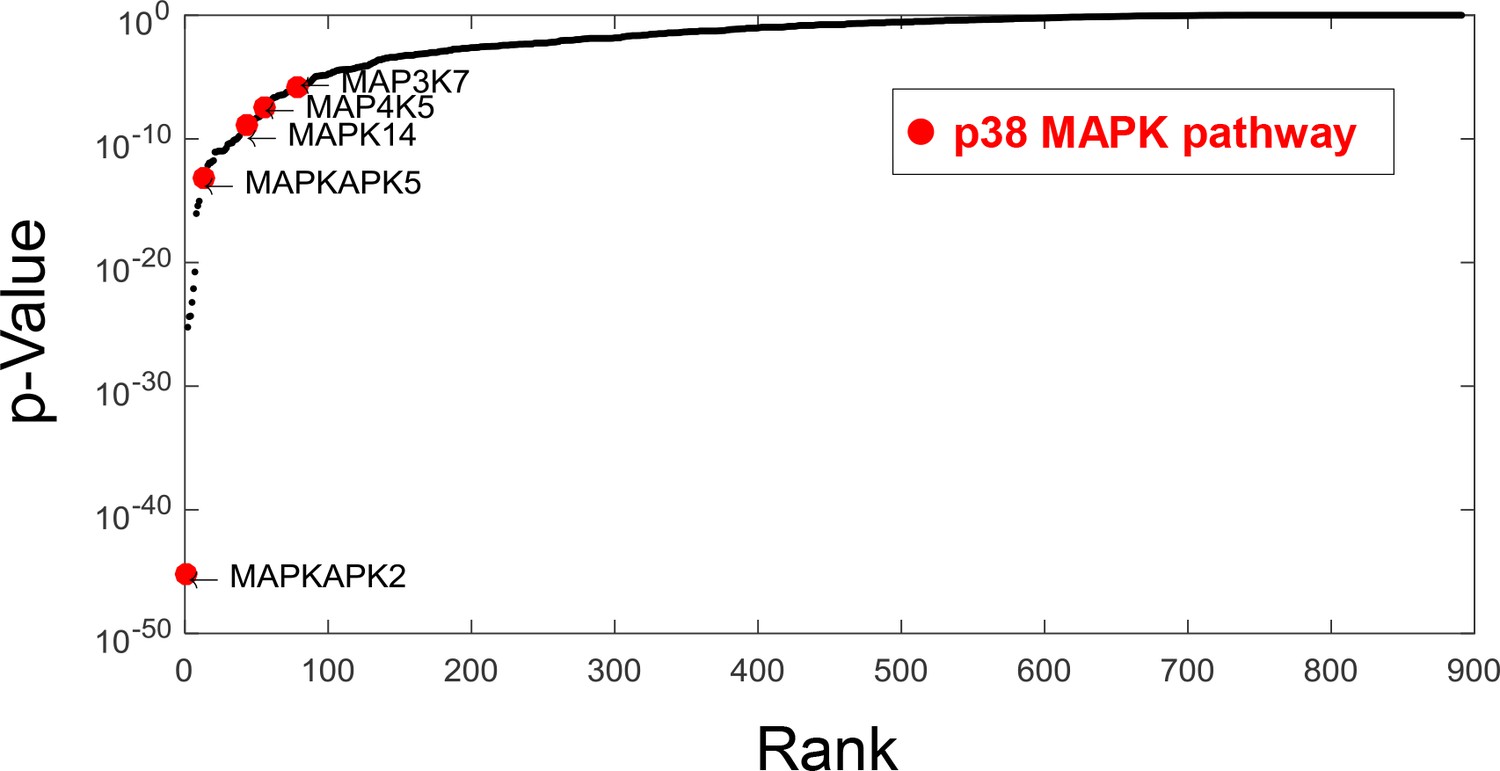
Ranked p-values from the enrichment analysis of compounds that increase cell size variability (by Fisher’s exact test).
Components from the p38 pathway (highlighted) were highly enriched. Specifically, MK2/MAPKAPK2, a direct downstream substrate of p38 is the top-ranking genes that associate with increased cell size variability.
Figure 1—figure supplement 5
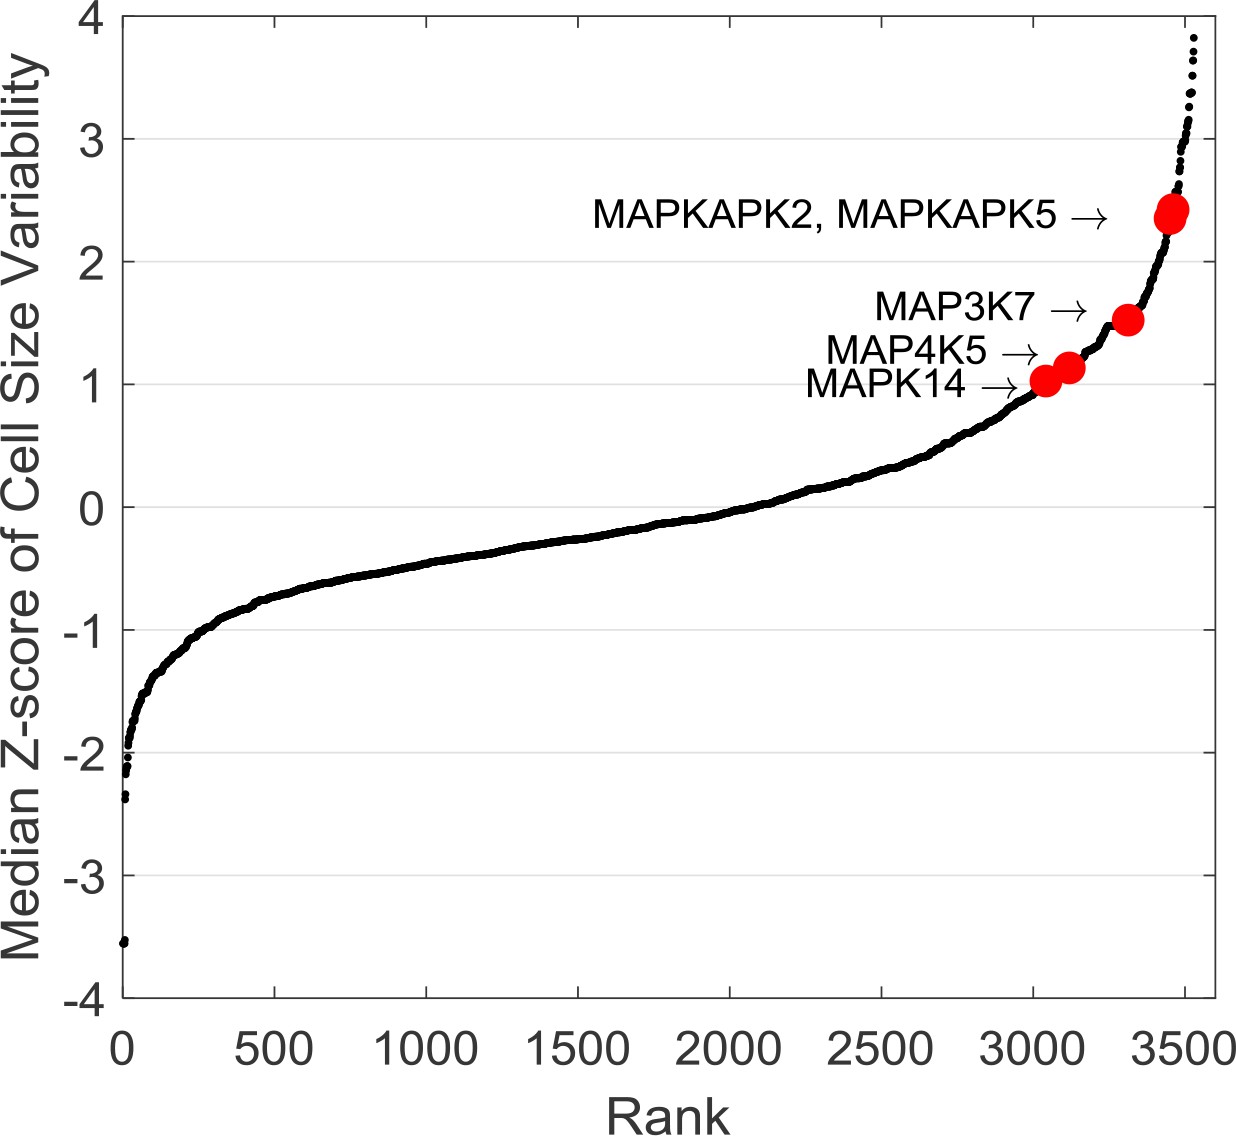
The average z-score of cell size variability corresponding to each of the different target proteins.
To estimate the cell size variability that results from inhibition of a specific protein, z-scores were averaged from all screen compounds targeting that protein. An average cell size variability was calculated for each of the target proteins and ranked from small to large. Components of the p38 MAPK pathway (highlighted in red) are ranked among the top proteins with increased z-scores in cell size variability.
Figure 2 with 4 supplements
Pharmacological inhibition of the p38 MAPK pathway disrupts the coordination of cell size and G1 length.
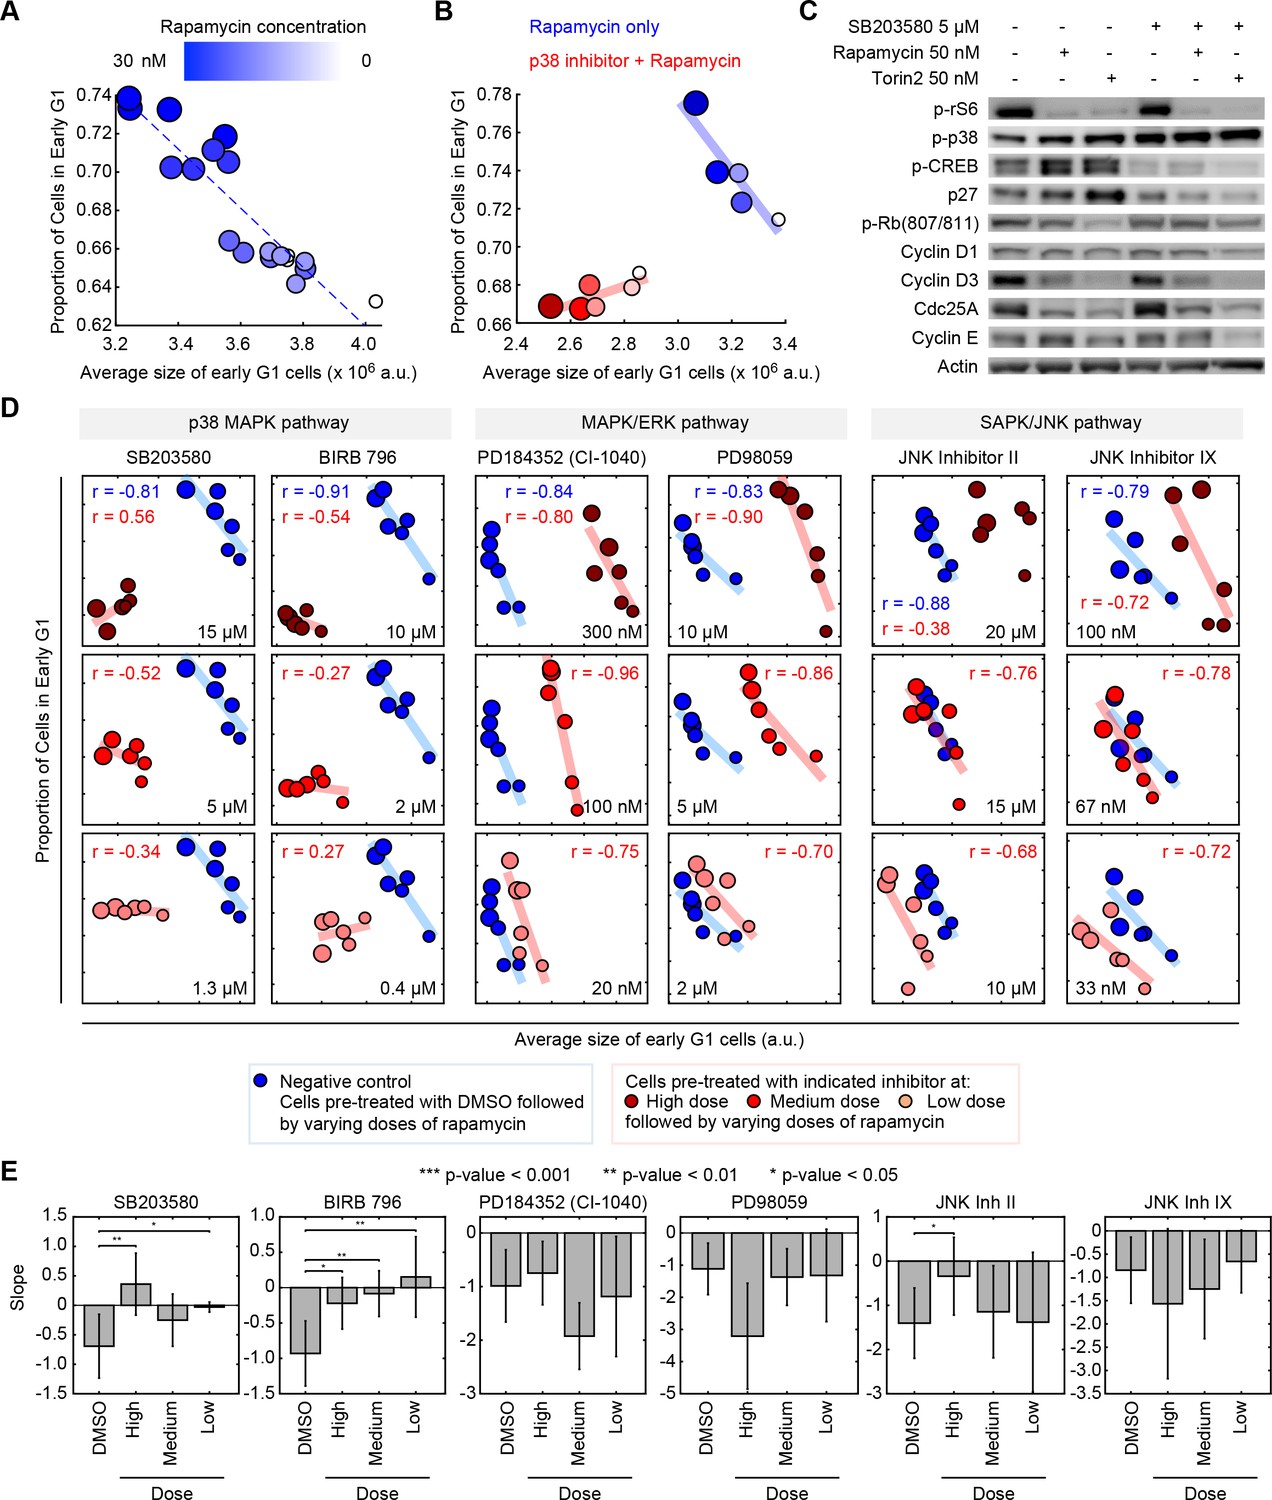
(A) Quantifying the coordination of cell size and G1 length. Samples of unsynchronized cells were treated with increasing concentrations of rapamycin (a rapamycin concentration series: 0, 0.03, 0.3, 3 and 30 nM) for a period of 24 hr, and then stained and imaged to quantify cell size and cell cycle stage on a single-cell basis. Each data point (circle) corresponds to a different concentration of rapamycin and shows the average size of early G1 cells and the proportion of cells in G1 resulting from that treatment. Populations treated with higher concentrations of rapamycin had smaller cells and higher fractions of cells in G1, resulting in a robust negative correlation. Rapamycin concentrations are redundantly represented by both the size of the circles and their color, as shown in the colorbar. The small white circles represent control populations that were treated with DMSO, rather than rapamycin. Calculation of the average size and the proportion of G1 cells, in each of the represented samples, was performed by classifying single cells into cell cycle stage as depicted in Figure 1B. Each data point was measured from an unsynchronized population with a minimum of 7000 cells. Additional details on the experiment and analysis is provided in the Materials and methods section. (B) The experiment described in panel A is repeated with (red) or without (blue) a chemical inhibitor of p38 (SB203580, 5 μM). The negative correlation between the size of early G1 cells and the proportion of cells in G1 is apparent in populations not treated with SB203580 (blue) but not in the populations that are treated with SB203580. The blue and red trend lines represent linear regressions. (C) Western-blots of whole cell lysates from populations that were treated with different combinations of SB203580, rapamycin and Torin-2. The experimental procedure used here are the same as those used to generate the data shown in panel A and B. The increased levels of phopho-p38 in the population that is treated with SB203580 (a p38 inhibitor) should not be interpreted as a lack of efficacy of SB203580. Rather, these higher levels of phopho-p38 are explained by a negative feedback in the p38 pathway (Arthur and Ley, 2013), and the fact that while p38 inhibitors prevent p-p38 from phosphorylating its downstream substrates, these inhibitors do not block phosphorylation of p38 itself by upstream regulators (Kumar et al., 1999). (D) Inhibition of the p38 MAPK pathway, but not the MAPK/ERK or SAPK/JNK pathways, disrupts the correlation between the average size of early G1 cells and the proportion of cells in G1. Results were obtained with the same assay used to create panel A and B. Larger circle size indicates higher rapamycin concentration. The rapamycin concentration series includes: 0, 0.03, 0.1, 0.3, 3 and 30 nM. The results shown here are representative of three independent experiments. (E) Fitted slopes corresponding to the trends shown in Figure 2D. Error bars represent 90% confidence intervals. For each compound treatment, its fitted slope is compared with the slope of the control (DMSO) from the same experiment. Significance was calculated with one-tailed Student’s t-test (H0: slopedrug <= slopecontrol). The meta data and source code used for this analysis and visualization of results is presented in Figure 2—source data 1.
-
Figure 2—source data 1
Measurements of cell size and cell cycle stages from the chemical inhibitor experiments as shown in Figure 2D, Figure 2—figure supplements 2 and 3.
- https://doi.org/10.7554/eLife.26947.017
Figure 2—figure supplement 1
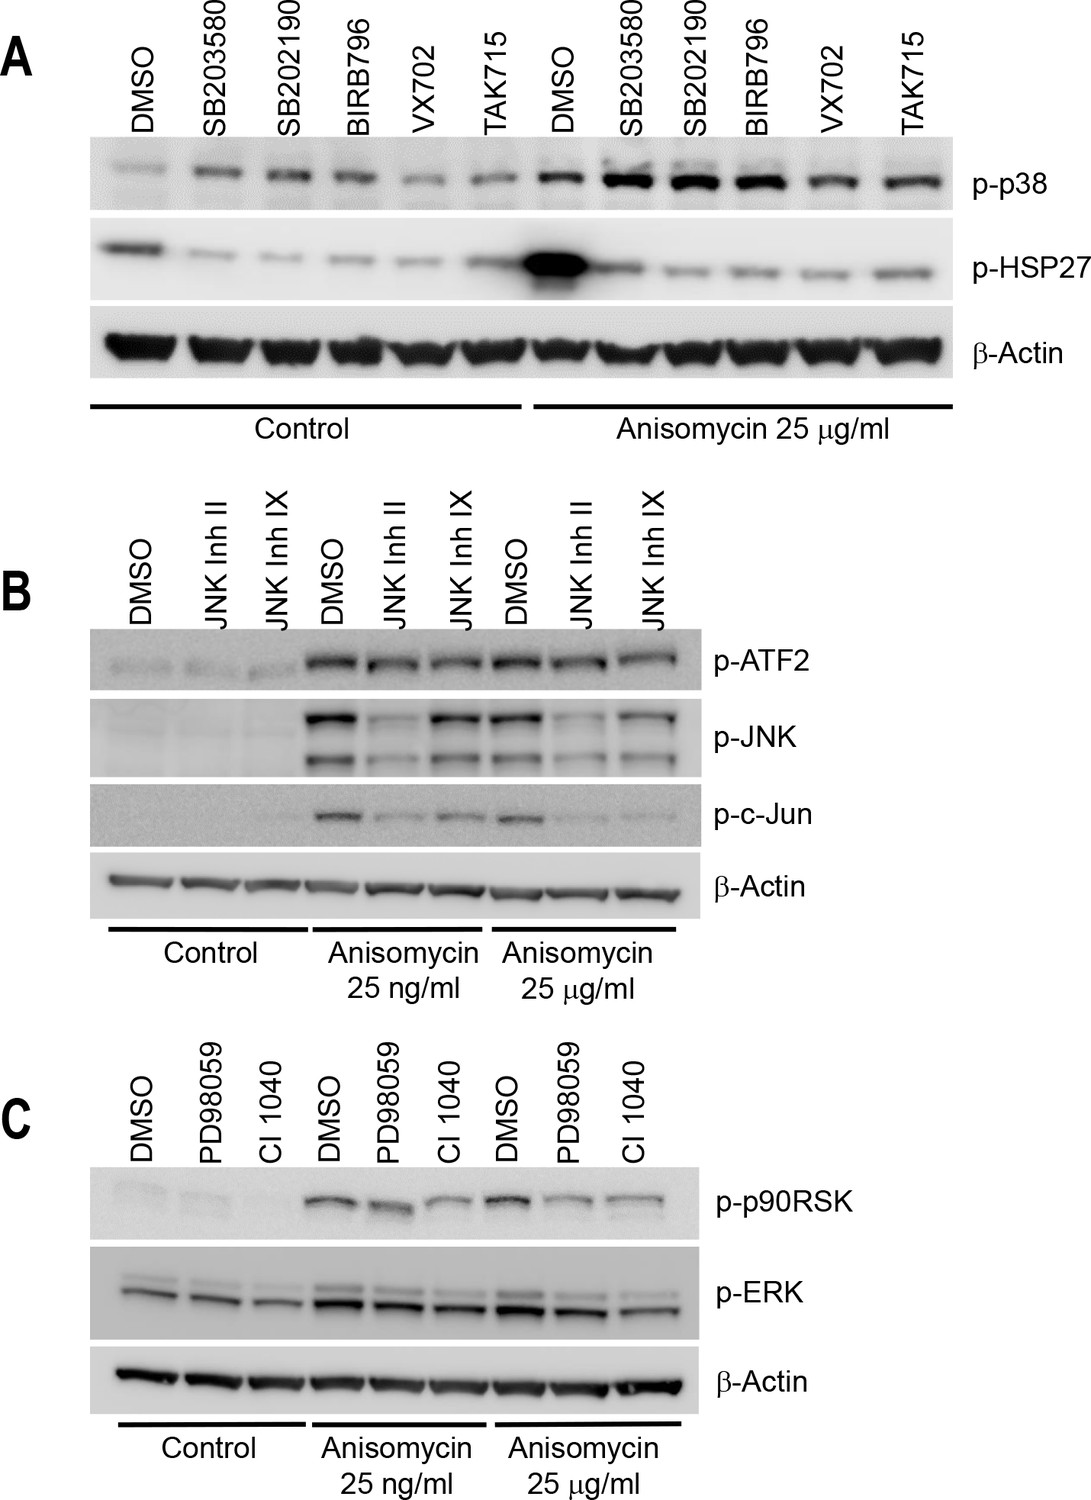
Western-blot of cell lysates from conditions shown in Figure 2C confirms the chemical inhibitors are efficient towards inhibiting corresponding MAPKs pathway.
Cells were treated with indicated inhibitors for 24 hr before collecting lysates. Anisomycin was added to select wells 1 hr prior to making lysates, to activate MAPK pathways. All inhibitors were used at the ‘high dose’ indicated in Figure 2C and Figure 2—figure supplement 2. (A) Cells treated with p38 inhibitors display a lower level of p-HSP27 (downstream of p38). The p38 inhibitors induce a higher level of p-p38. This is due to negative feedback in the p-p38 pathway, and the fact that p38 inhibitors prevent p-p38 from phosphorylating downstream substrates, but do not block phosphorylation of p38 itself by upstream regulators. (B, C) Cells treated with JNK or MEK I/II inhibitor inactivate the corresponding pathway under Anisomycin induction. The influence of the inhibitor is not obvious under control condition probably due to low basal activation of the pathways.
Figure 2—figure supplement 2
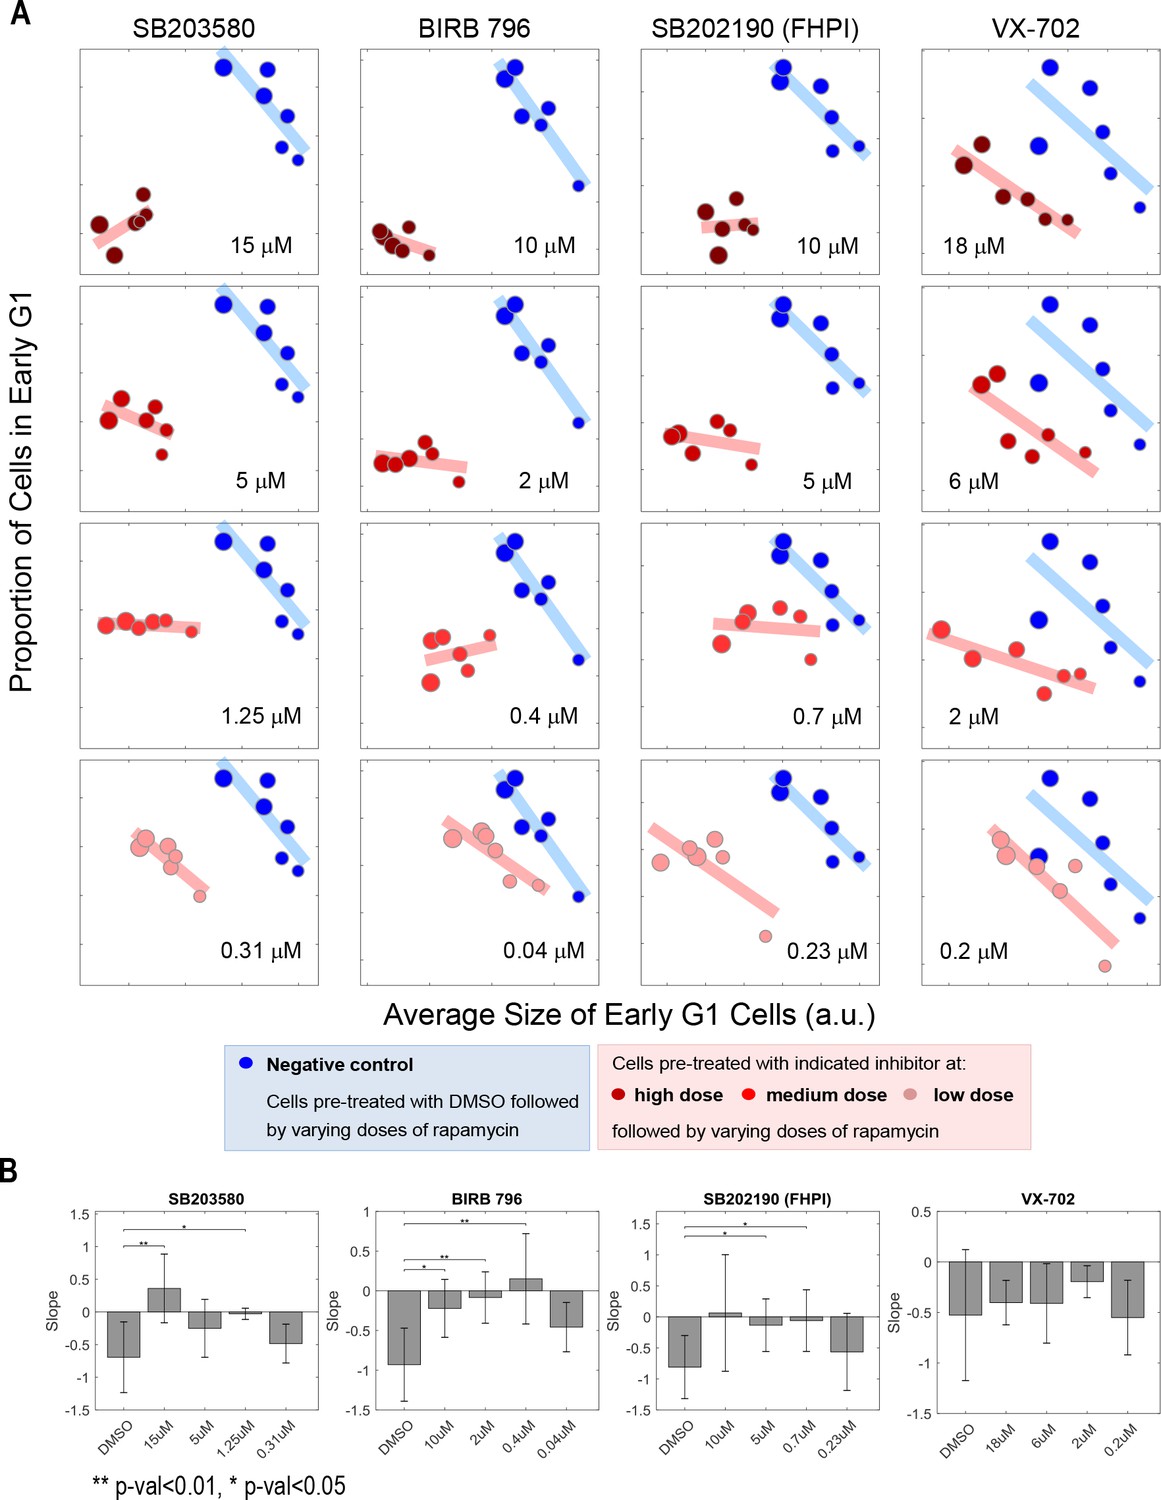
The negative correlation between cell size and proportion of cells in early G1 is perturbed or weakened under p38 inhibition.
Measurements collected in the same experiment as Figure 2C. (A) Scatterplot comparing cells of negative control (DMSO) with cells under p38 inhibition (treated with indicated inhibitor and concentration). Each data point was measured from a cell population with a minimum of 7000 cells. The rapamycin concentration range is as follows: 0, 0.03, 0.1, 0.3, 3 and 30 nM. The results are representative of three independent experiments. (B) The slope between size and proportion of cells in G1 is either disturbed or weakened. p-Values were calculated with one-tailed Student t-test (H0: slope of control >= slope of compound treatment). The meta data and source code used for the analysis and visualization of the results is presented in Figure 2—source data 1.
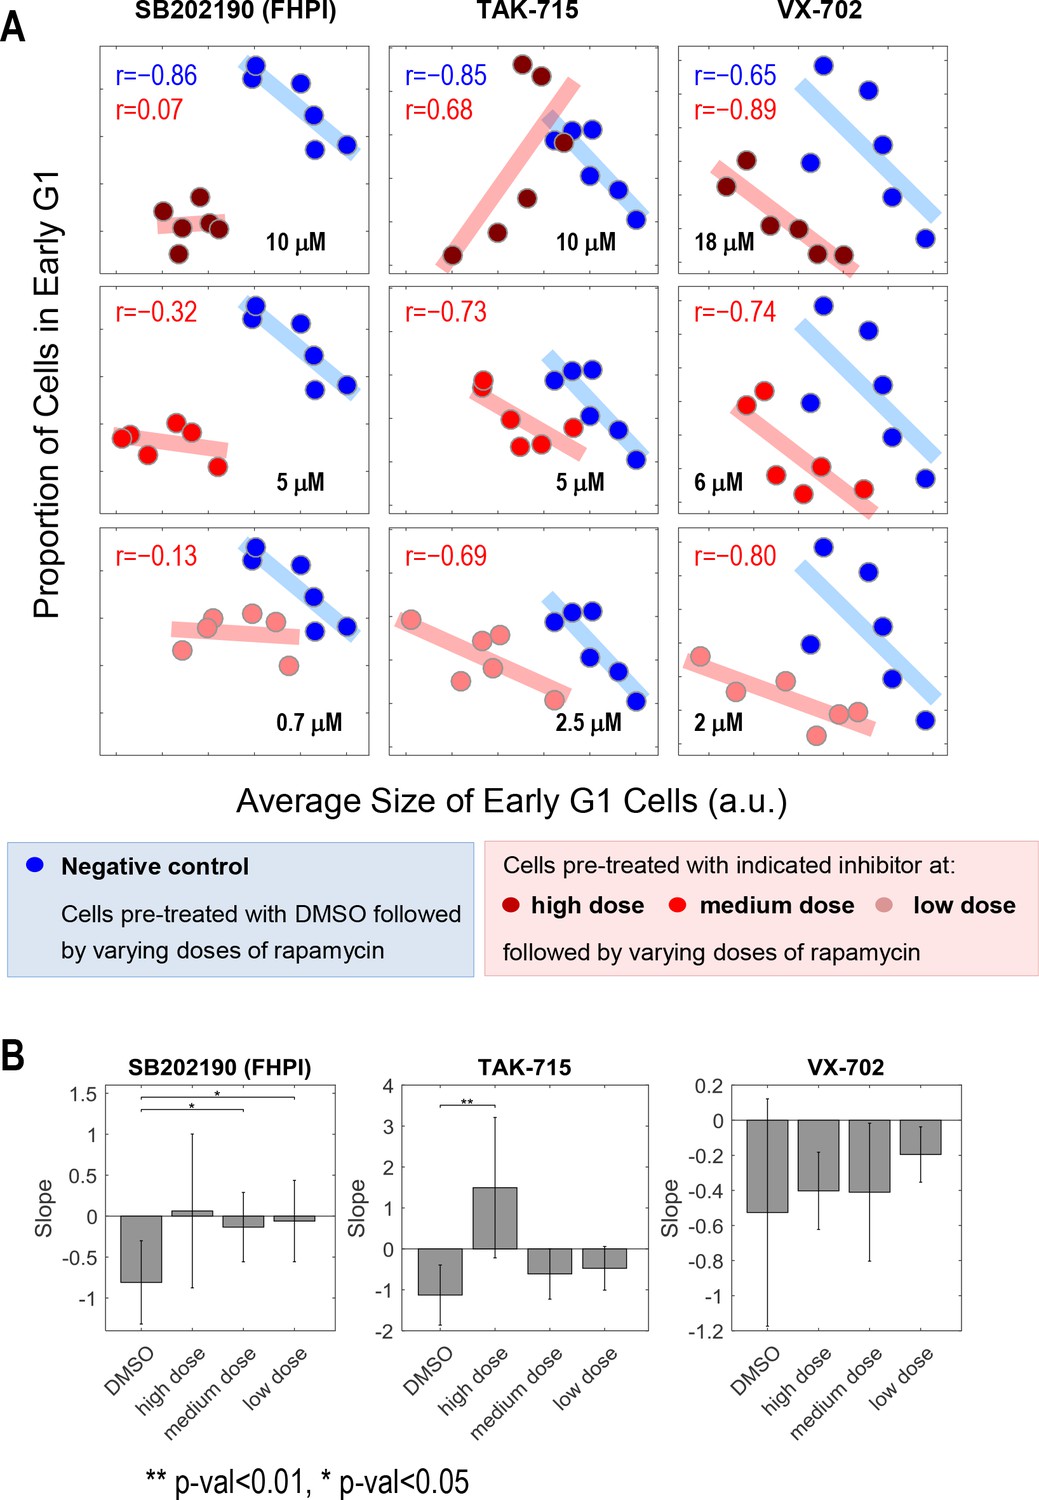
Figure 2—figure supplement 3
Inhibitors of p38 display dose-dependent influence in the coordination of cell size and G1 length.
The p38 inhibitors and three higher concentrations shown here are also included in Figure 2D and Figure 2—figure supplement 2. (A) Cells treated with only rapamycin concentration series (blue) display negative correlation between cell size and proportion of cells in G1. However, the negative correlation between cell size and proportion of cells in G1 disappears or weakens when cells are co-treated with p38 inhibitors and the rapamycin concentration series (red). The blue and red lines show the result of linear regression. The rapamycin concentration range is as follows: 0, 0.03, 0.1, 0.3, 3 and 30 nM. (B) The fitted slope of measurements shown in (A) For each compound treatment, its fitted slope is compared with the slope of the control (DMSO) from the same experiment. Significance was calculated with one-tailed Student t-test (H0: slopedrug <= slopecontrol). The meta data and source code used for the analysis and visualization of the results is presented in Figure 2—source data 1.
Figure 2—figure supplement 4
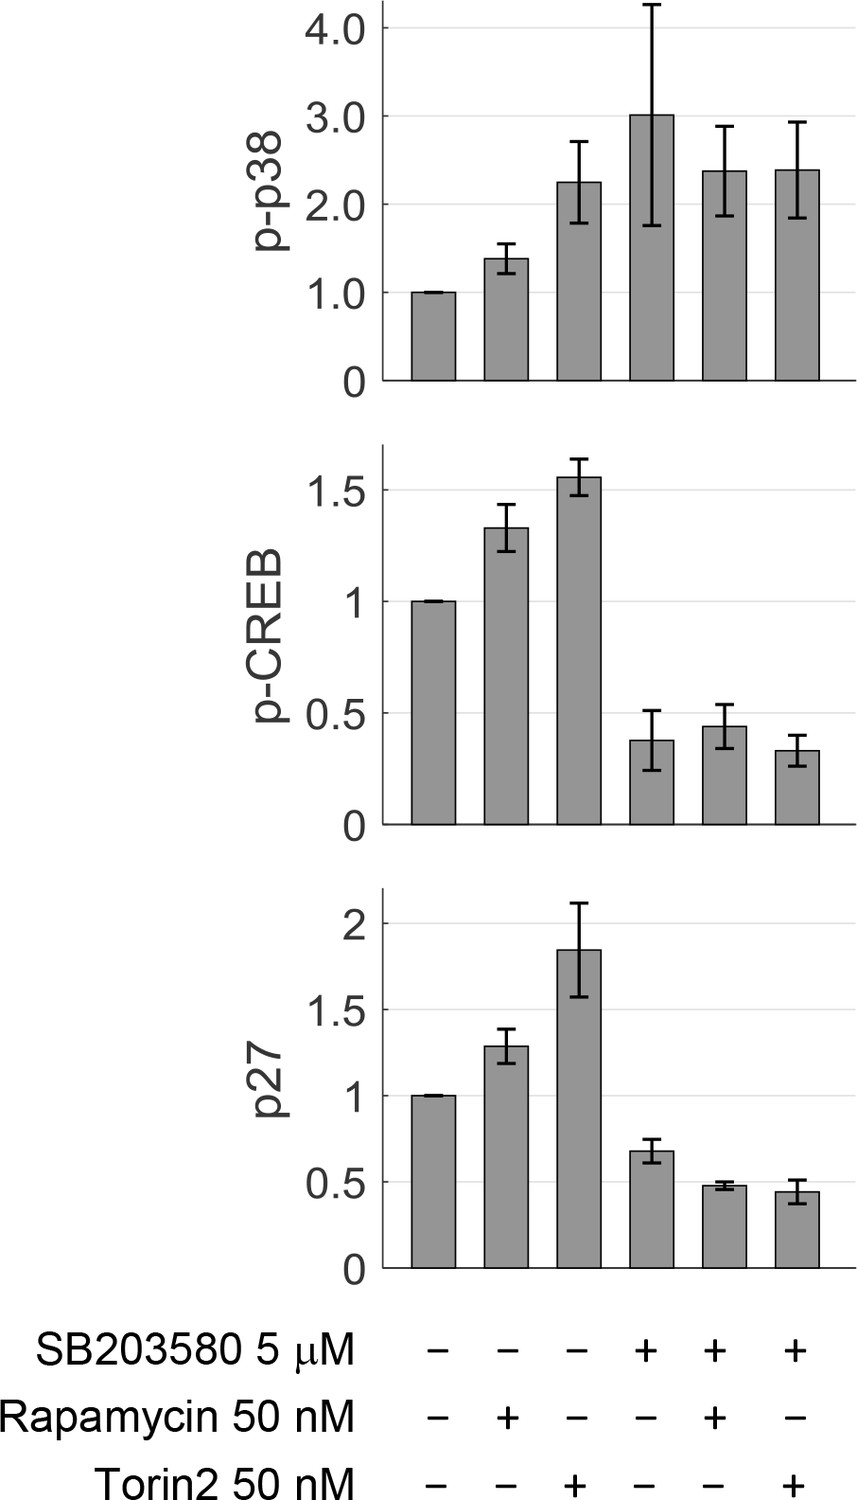
Quantification of p-p38, p-CREB and p27 in conditions shown Figure 2C.
The bar plot and error bar display mean and SEM across three replicate Western-blot experiments. Treatment of rapamycin or Torin-2 increases both p-p38 and p-CREB, confirming that activity in the p38 pathway is upregulated under mTORC1 inhibition. SB203580, a p38 inhibitor, significantly reduces the phosphorylation of CREB (downstream of p38), confirming that p38 activity is inhibited. p27 is a negative regulator of G1 progression. mTOR inhibition by rapamycin or Torin-2 upregulates p27 activity, which promotes a longer G1. Strikingly, cells co-treated with p38 inhibitor and mTOR inhibitor have lower p27 compared to treatment of p38 inhibitor alone. This may be the mechanism by which p38 inhibition disturbs the cells’ ability to compensate their small size with longer G1.
Figure 3 with 3 supplements
Inhibition of p38 weakens the coordination of cell size and G1 length at a single-cell level.
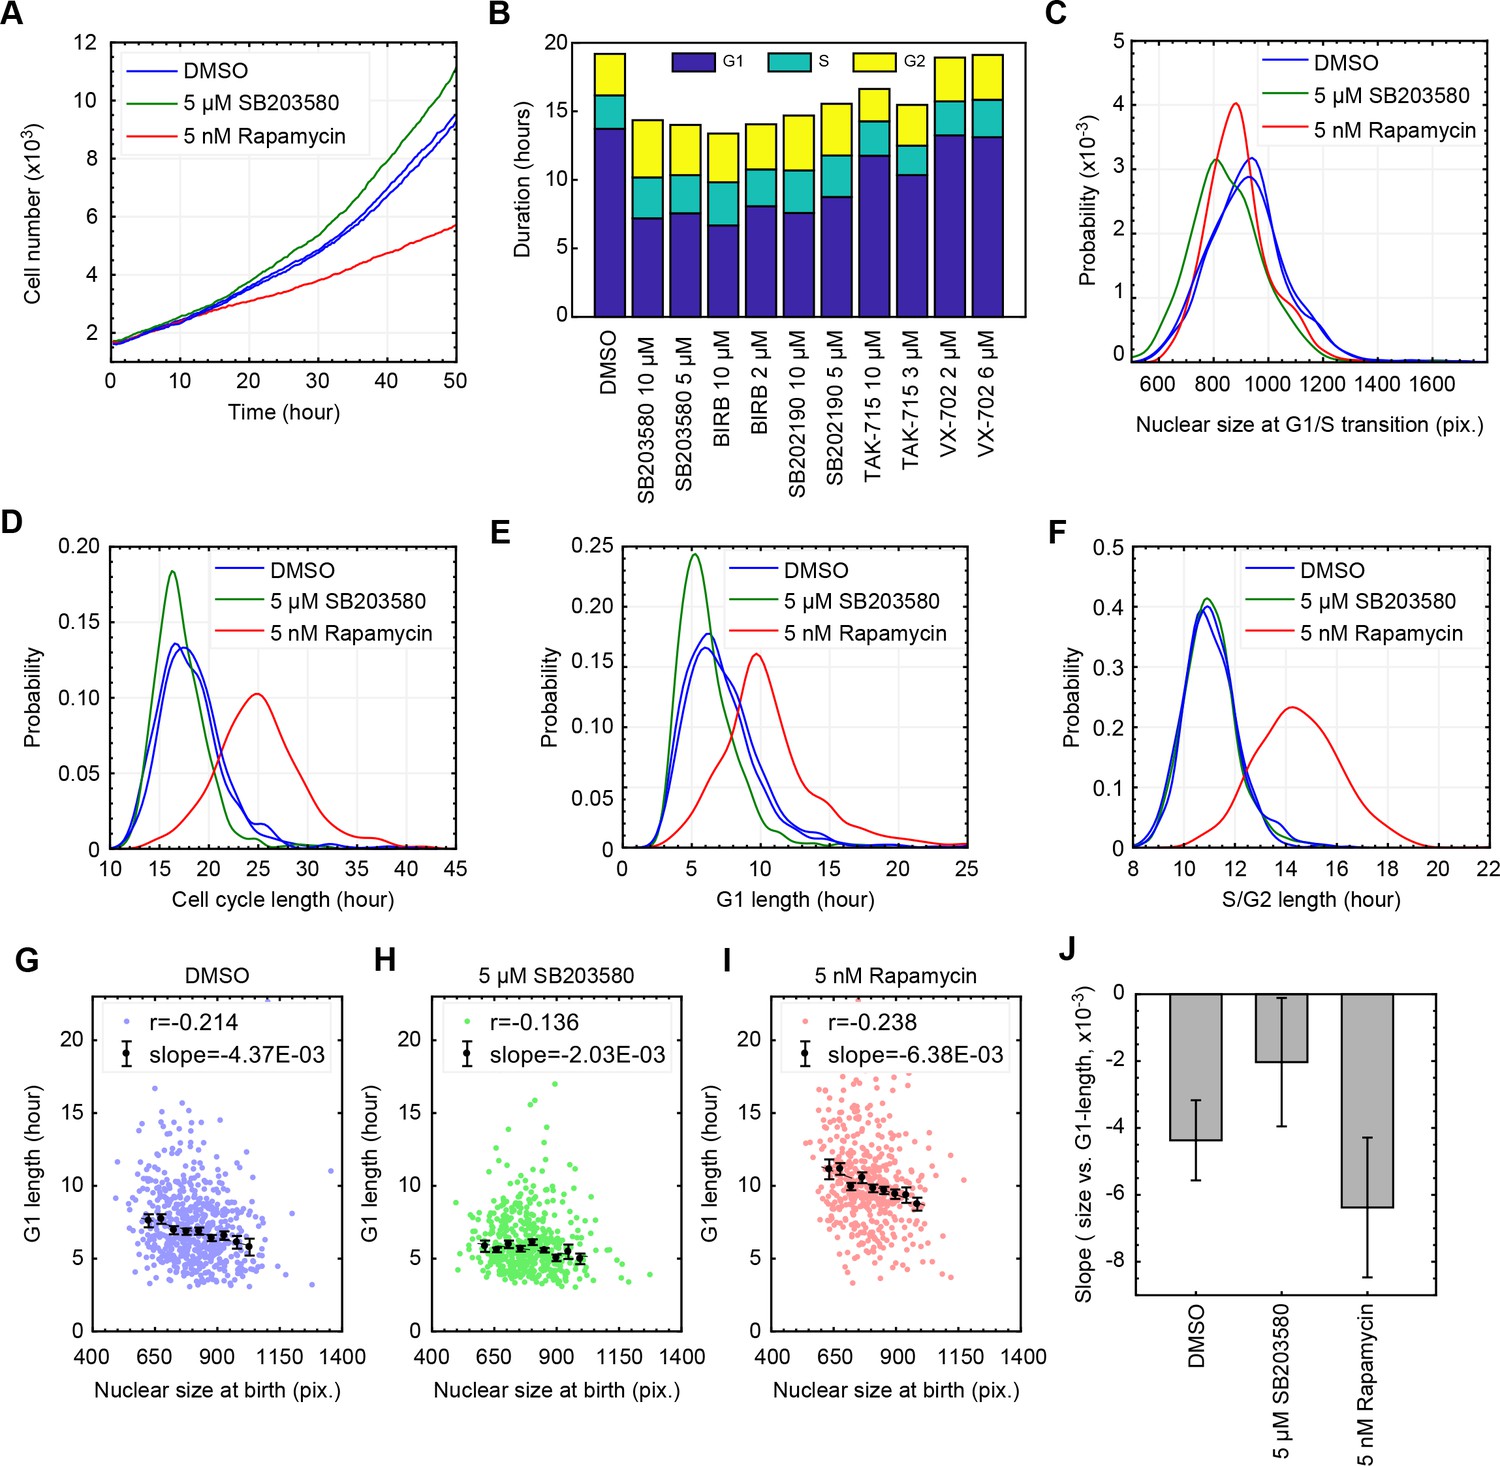
(A) Live cells subject to p38 inhibition (SB203580) or to mTORC1 inhibition (rapamycin) were followed with time-lapse microscopy to monitor proliferation over a period of 50 hr. mTOR inhibition significantly slowed rates of proliferation, while p38 inhibition increased rates of proliferation. (B) As an alternative method to assay cell cycle lengths, populations of cells were treated with p38 inhibitors and samples were fixed every 20 hr over a period of 3 days (see Materials and methods -Estimation of cell proliferation durations and growth rate from bulk measurements). Proportion of cells in the different cell cycle stages, in each of the collected samples, were calculated based on the cell cycle indicators depicted in Figure 1B. Consistently, p38 inhibitors accelerate proliferation by shortening the duration of G1 but not the durations of S or G2 (also see Figure 3—figure supplement 3). The meta data and source code used for this cell cycle analysis is presented in Figure 3—source data 1. (C–F) Live cells were imaged by time-lapse microscopy for a period of 50 hr to obtain growth trajectories of single cells over the course of their entire cell cycle. Computer generated image processing and cell tracking were performed, as described in Materials and methods - Automated lineage tracking and analysis, to obtain single cell growth curves. Nuclear size was used as a proxy of cell size, as has been validated in Ginzberg et al., 2017. Cells that were successfully tracked throughout their entire cell cycle were collected to calculate the cell cycle durations and cell size dynamics. (G–I) Scatterplots displaying relationship between nuclear size at birth and G1 duration for individual cells that are subject to chemical inhibition of p38 (H), chemical inhibition of mTOR (I), and a control population treated with DMSO (G). Every single point corresponds to the birth size and G1 length of a single live cell that was followed by time-lapse microscopy. Also shown are means and errorbars (SEM) of average G1 length calculated for different cell size bins. The dashed line shows the result of linear regression with the binned data. (J) Slopes obtained by the linear regression shown in (G–I) Error bars indicate 95% confidence bounds. The results shown here are representative of two independent experiments. The single-cell tracking data from the live-cell imaging experiments and the source code for analysis and visualization of the results is presented in Figure 3—source data 2.
-
Figure 3—source data 1
Estimation of cell cycle duration and growth rate from bulk measurements of fixed cell populations.
- https://doi.org/10.7554/eLife.26947.022
-
Figure 3—source data 2
Measurements of single-cell dynamics of cell size captured by live-cell imaging.
- https://doi.org/10.7554/eLife.26947.023
Figure 3—figure supplement 1
Cellular growth rate also negatively correlates with G1 or cell cycle duration.
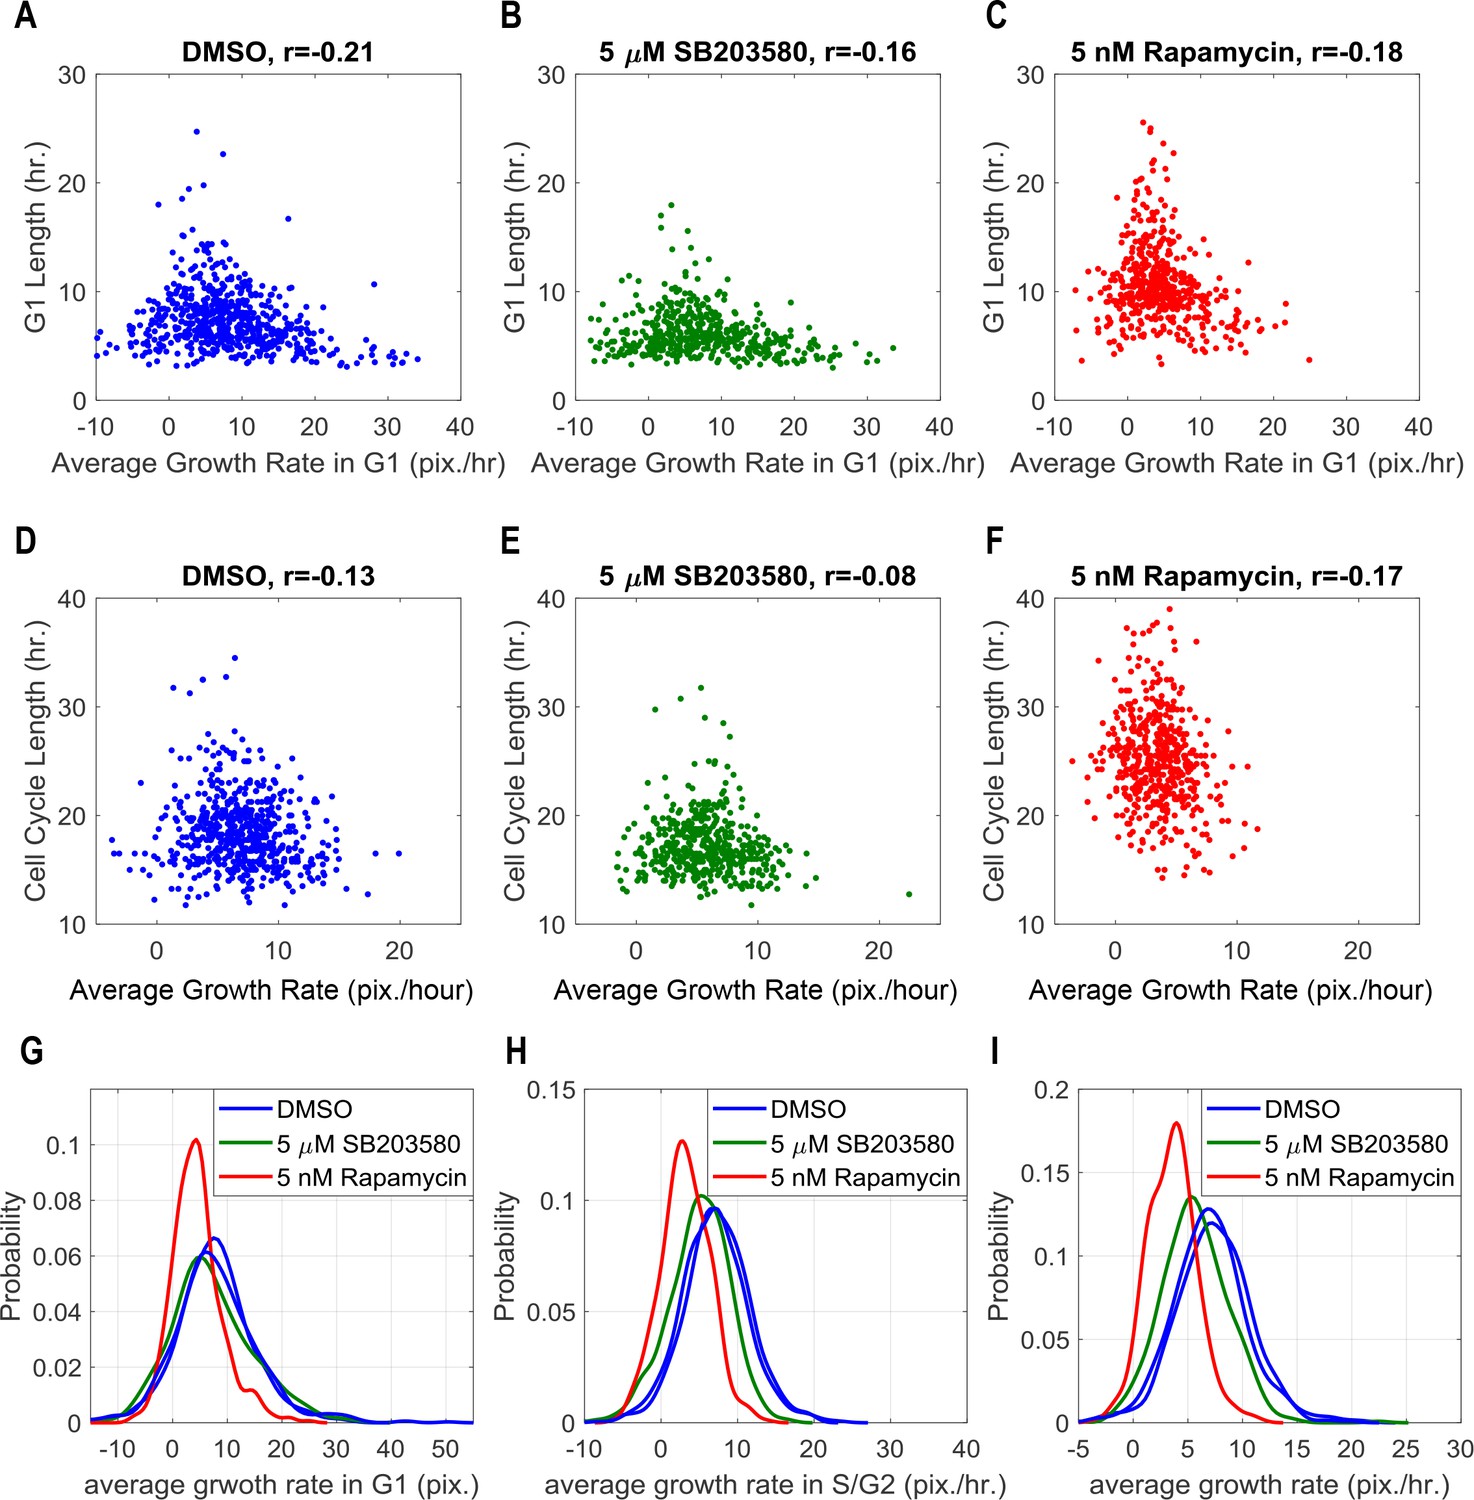
(A–C) Scatterplots displaying relationship between average growth rate in G1 stage with G1 duration for individual cells in DMSO control, p38 inhibition and mTOR inhibition. (D–F) Scatterplots displaying relationship between average growth rate over cell cycle with cell cycle duration for individual cells in the three conditions. r indicates Spearman’s correlation coefficient. (G–I) Distribution of average growth rate in G1 (before Geminin rise), S/G2 (after Geminin rise) and over the entire cell cycle for the three tested conditions. While mTORC1 inhibition by Rapamycin decreases growth rate, p38 inhibition by SB203580 does not significantly affect growth rate in G1. The meta data and source code used in this analysis is presented in Figure 3—source data 2.
Figure 3—figure supplement 2
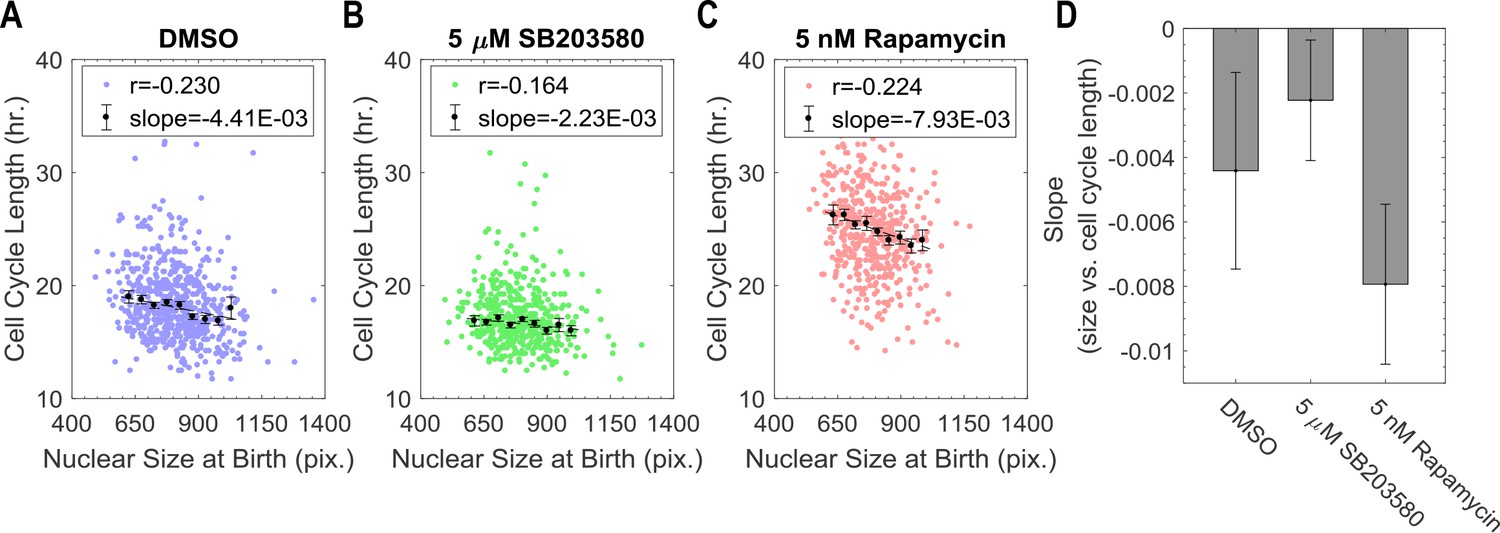
Cell size at birth is negatively correlates with cell cycle duration. p38 inhibition, but not mTORC1 inhibition weakens this correlation.
(A–C) Scatterplots displaying relationship between nuclear size at birth with cell cycle duration for individual cells in DMSO control, p38 inhibition and mTOR inhibition. The points with error bar shows mean and SEM by binning cells with similar size. The dashed line shows the result of linear regression with the binned data. Measurements were obtained from time-lapse experiments as indicated in Figure 3. (D) Bar plot comparing the slopes of the linear regression between size and G1 duration as shown in panel A–C. Error bar indicates 95% confidence bounds. The meta data and source code used to in this analysis is presented in Figure 3—source data 2.
Figure 3—figure supplement 3
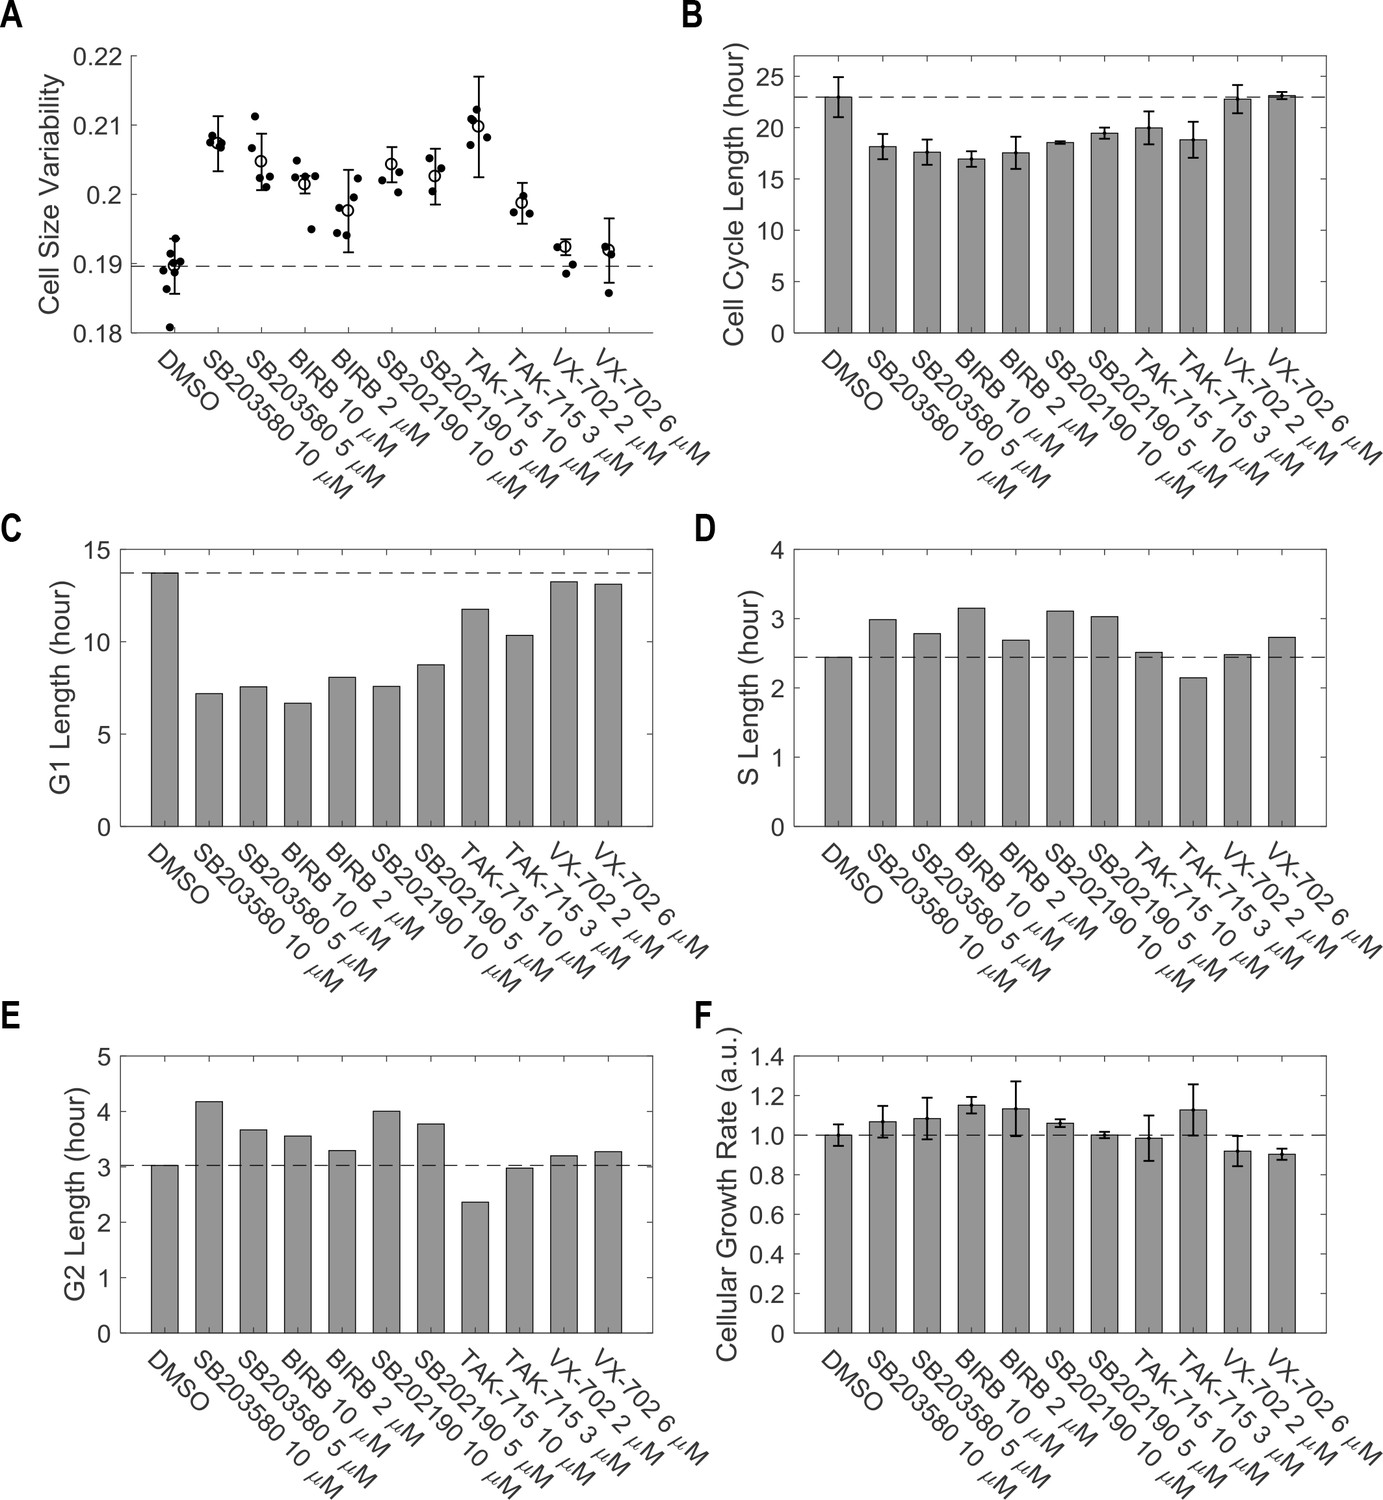
Inhibition of p38 MAPK increases cell size variability (A), promote proliferation (B) by shortening G1 length (C) without significant effect in S/G2 duration (D and E) or cellular growth rate (F).
Measurements were performed with the same experiments as indicated in Figure 3B. Shown here is representative of three independent replicate experiments. The meta data and source code used to for the analysis is presented in Figure 3—source data 1.
Figure 4 with 2 supplements
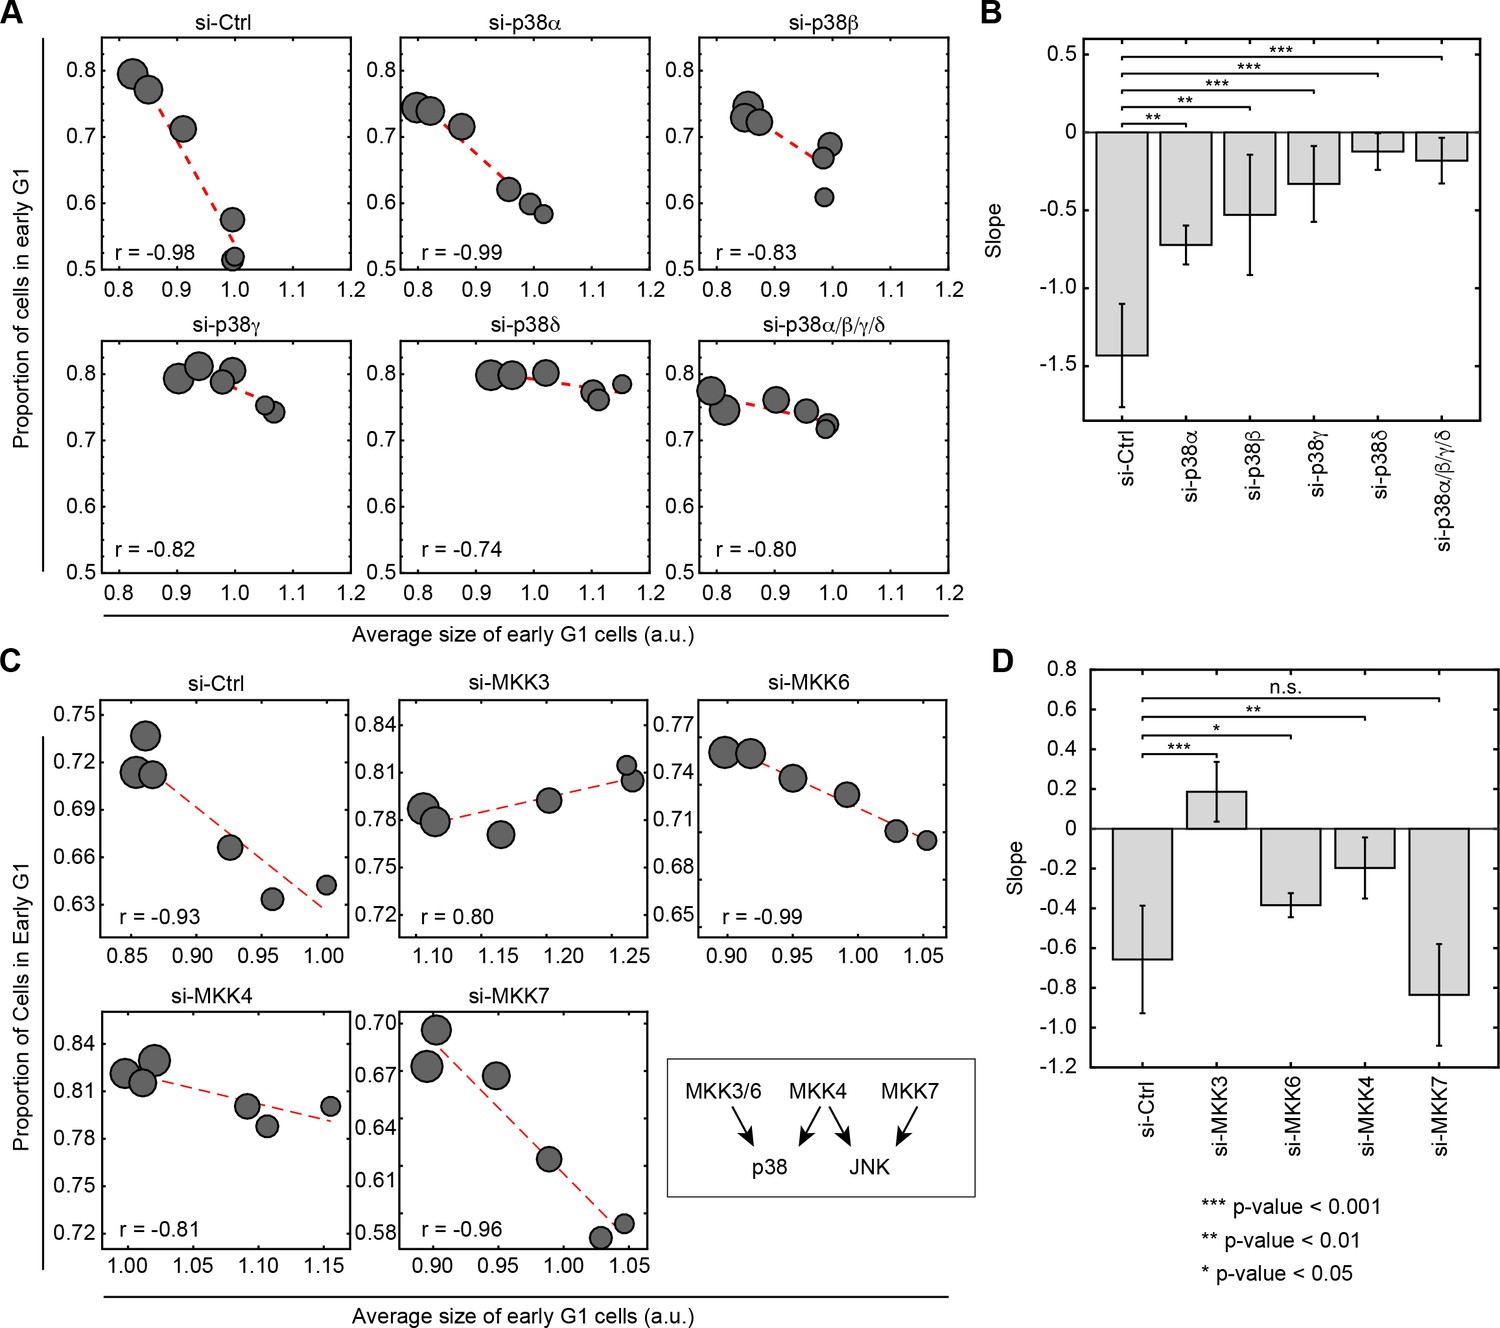
Knockdown of p38 pathway components disturbs the negative correlation between cell size and proportion of cells in G1.
Cells were transfected with siRNA as indicated and subsequently assayed with a rapamycin concentration series (0, 0.03, 0.1, 0.3, 3 and 30 nM) as described in Figure 2A to assay the correlation of size and G1 length. Larger circle size indicates higher concentrations of rapamycin. (A) Knocking down p38α/βpartially weakens the negative correlation between cell size and proportion of cells in G1, while knockdown of p38γ/δ drastically disturbs the correlation. (C) The negative correlation between cell size and proportion of cells in G1 is disturbed when cells are transfected with siRNA against MKK3/4/6 but not MKK7. Each data point in Figure 4A and C is measured on an unsynchronized population with a minimum of 3000 cells. The results shown in Figure 4A and C are representative of two and three independent experiments with duplicates or triplicates. (B, D) Fitted slopes of the trends shown in Figure 4A and C. Error bars indicate 90% confidence intervals. Analysis is performed with the same method as indicated in Figure 2E. The meta data and source code to analyze and visualize the genetic knock down results is presented in Figure 4—source data 1.
-
Figure 4—source data 1
Binding activity (Kd’s in nM) of the p38 inhibitors used in the study against each of the p38 isoforms.
Kd values in the table were extracted from Davis et al. (2011). As marked in that paper, blank fields indicate combinations that were tested, but for which binding was weak (Kd >10 μM), or not detected in a 10 μM primary screen.
- https://doi.org/10.7554/eLife.26947.027
-
Figure 4—source data 2
Measurements of cell size and cell cycle stage from the knockdown experiments as shown in Figure 4.
- https://doi.org/10.7554/eLife.26947.028
Figure 4—figure supplement 1
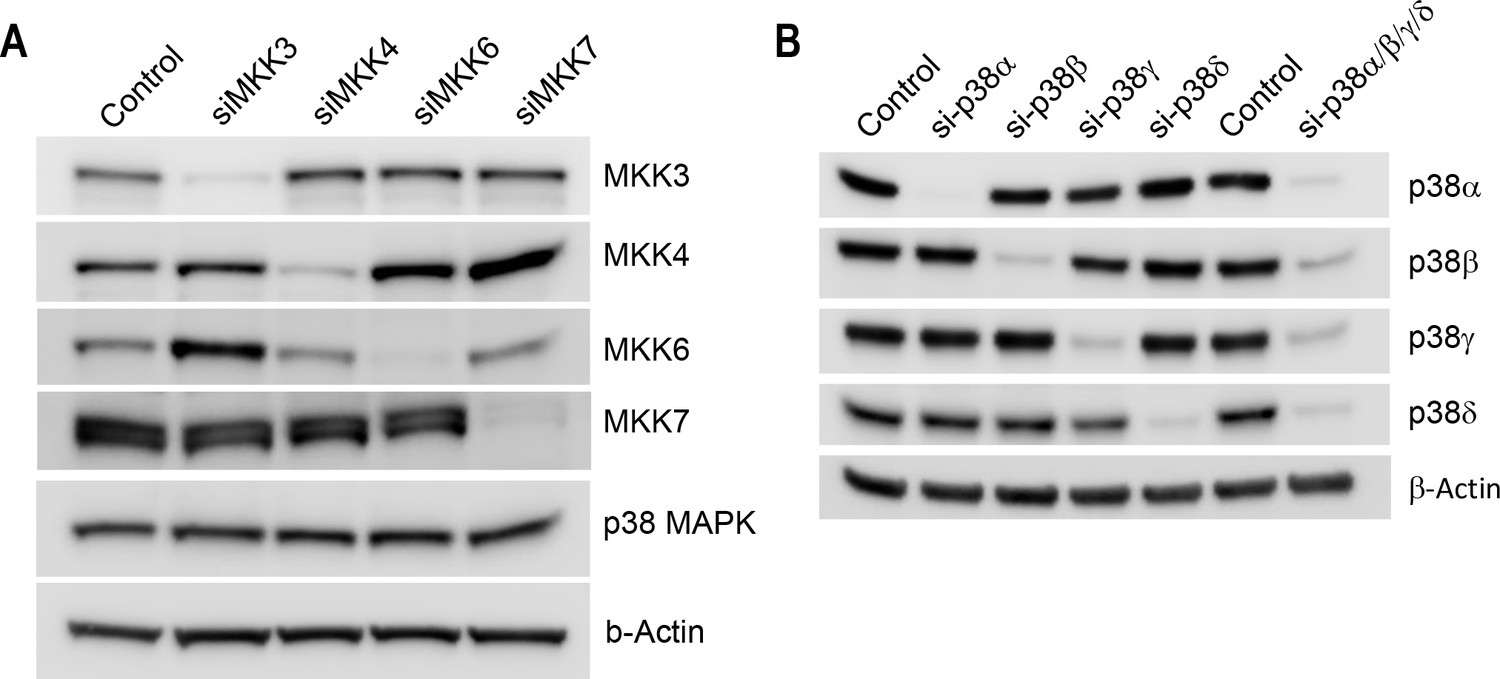
Western-blot of cell lysates from conditions shown in Figure 3 confirms efficiency of knockdown of MKKs (A) or p38 isoforms (B).
https://doi.org/10.7554/eLife.26947.025
Figure 4—figure supplement 2
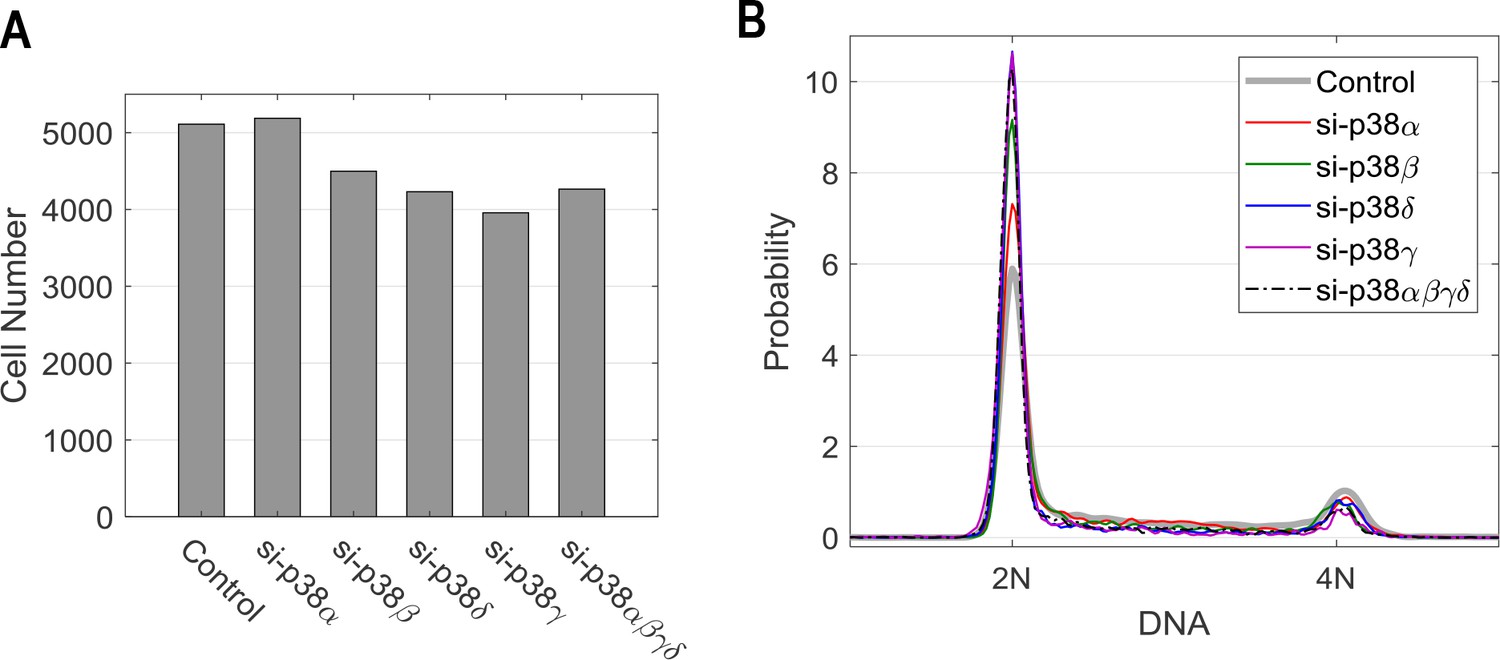
Cells are still cycling upon the knockdown treatments.
Cell count (A) and DNA histogram (B) 2 days post siRNA transfection corresponding to each of the knockdown conditions. Cell number was quantified by imaging the central region of the wells (~50% coverage). Combined with knowledge of seeding density, the cell counts shown here imply duplication of cell number per day during the experiments (details see Materials and methods -siRNA transfection).
Figure 5 with 5 supplements
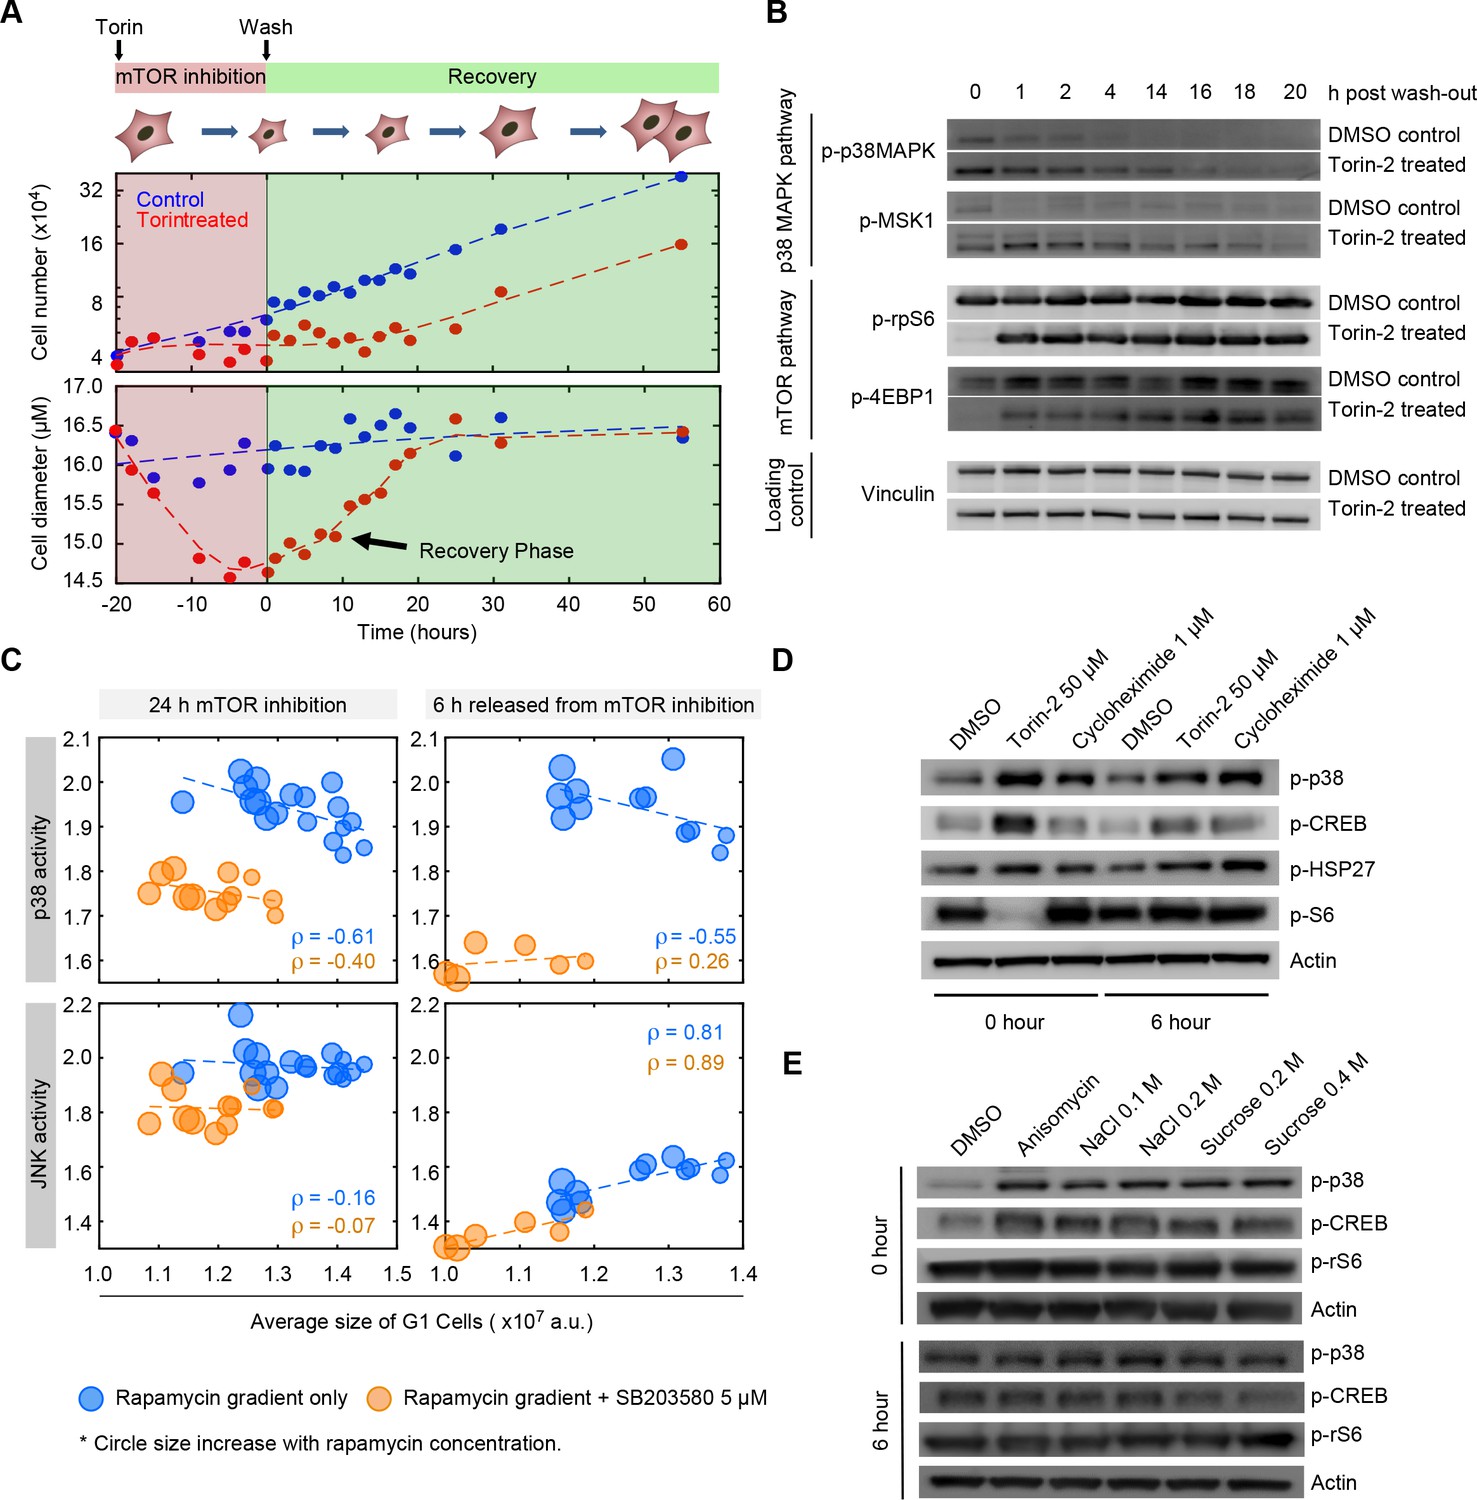
The p38 MAPK pathway is selectively upregulated in small cells.
(A) Cells were treated with either 50 nM of Torin-2 or DMSO (control) for 20 hr, followed by drug wash-out and media replacement. Cells undergoing mTOR inhibition, on average, decrease in size and slow their proliferation rate. Following release from mTOR inhibition, cells grow but maintain a low proliferation rate until their normal size is reached. Cells resume a wild type rate of proliferation only when their size reaches the size of the untreated population. (B) Western blots of whole cell lysates collected at time points ranging from 0 to 20 hr post release from mTOR inhibition. Levels of mTOR pathway activity recover within 1 hr after Torin-2 wash-out. By contrast, activity of p38 remains upregulated in the Torin-treated cells compared with controls, and gradually fades away only as cells recover their wild-type size. (C) Cells simultaneously expressing reporters of both p38 MAPK and JNK were treated with a series of rapamycin concentrations, as in Figure 2A. Each data point (circle) corresponds to the average G1 cell size and the average level of MAPK activity (JNK and p38) that corresponds to a given concentration of rapamycin. As positive controls, we include populations that were co-treated with the p38 inhibitor, SB203580 (orange circles). Higher concentrations of rapamycin (bigger circle size) result in smaller cells with higher activity of p38 (top left panel). Unlike p38, activity of JNK was not upregulated in proportion to cell size (left bottom panel). Also shown are the correlations of MAPK activity (JNK and p38) and cell size at 6 hr post release from mTOR inhibition (right panels) (also see Figure 5—figure supplement 2). Each data point represents average values of cell size and MAPK activity of the G1 cells subpopulation from an unsynchronized population with a minimum of 3000 cells. Results shown here are representative of three independent experiments. The meta data and source code used to analyze and visualize the correlation between cell size and KTR readout is presented in Figure 5—source data 1. (D) Western-blots of whole cell lysates from samples collected at 0 or 6 hr post release from a 22 hr treatment with either 50 nM Torin-2, 1 μM cycloheximide or DMSO (control). (E) Western-blots of whole cell lysates from samples collected at 0 or 6 hr post release from a 30-min treatment with either 25 ng/mL anisomycin, hyperosmotic shocks (NaCl and Sucrose) or DMSO (control).
-
Figure 5—source data 1
Measurements of cell size and p38 KTR as shown in Figure 5C and Figure 5—figure supplement 4.
- https://doi.org/10.7554/eLife.26947.035
Figure 5—figure supplement 1
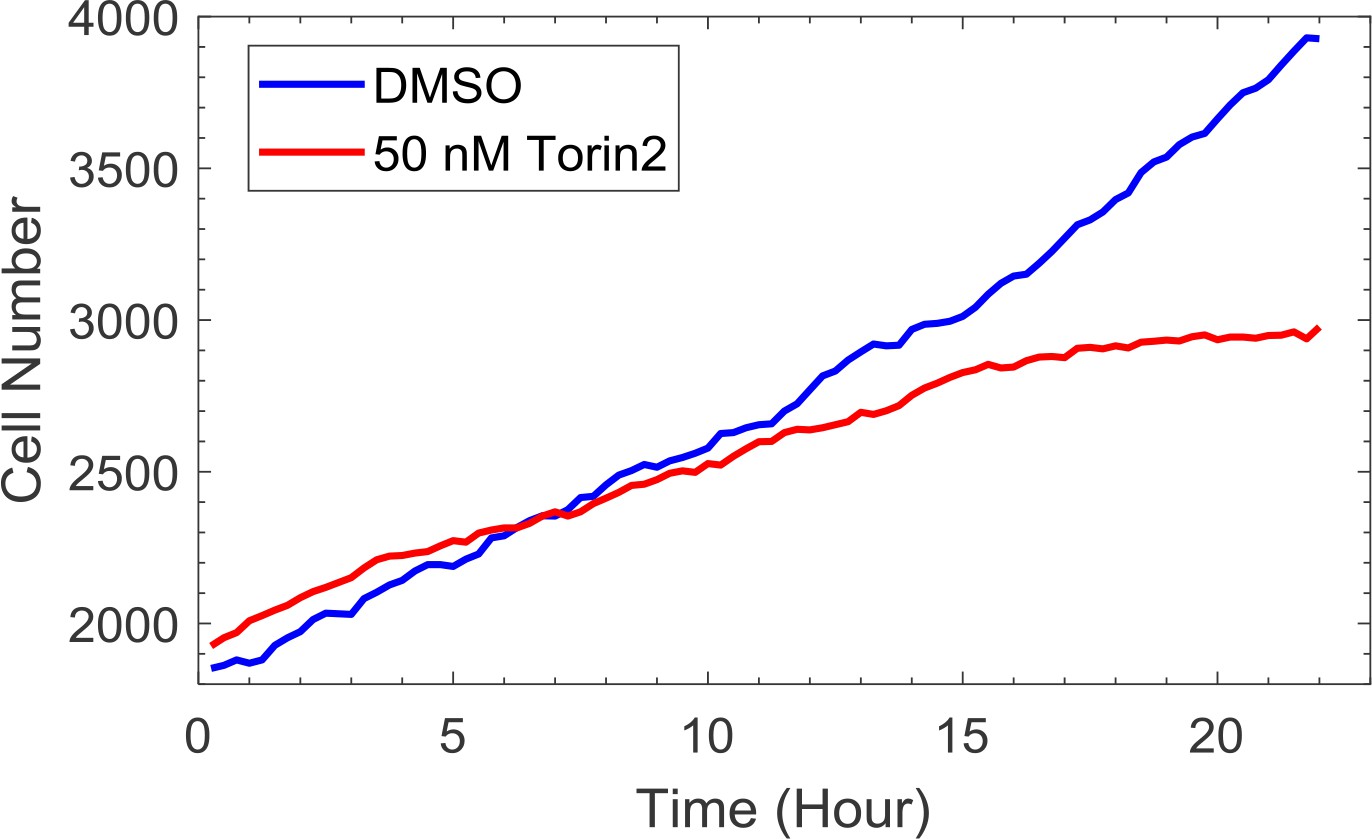
Cells are still cycling upon Torin-2 treatment.
Measurements were obtained by time-lapse microscopy with cells expressing fluorescent markers of H2B. Cells were imaged and counted every 15 min over 22 hr. Compound treatment were performed at time 0.
Figure 5—figure supplement 2
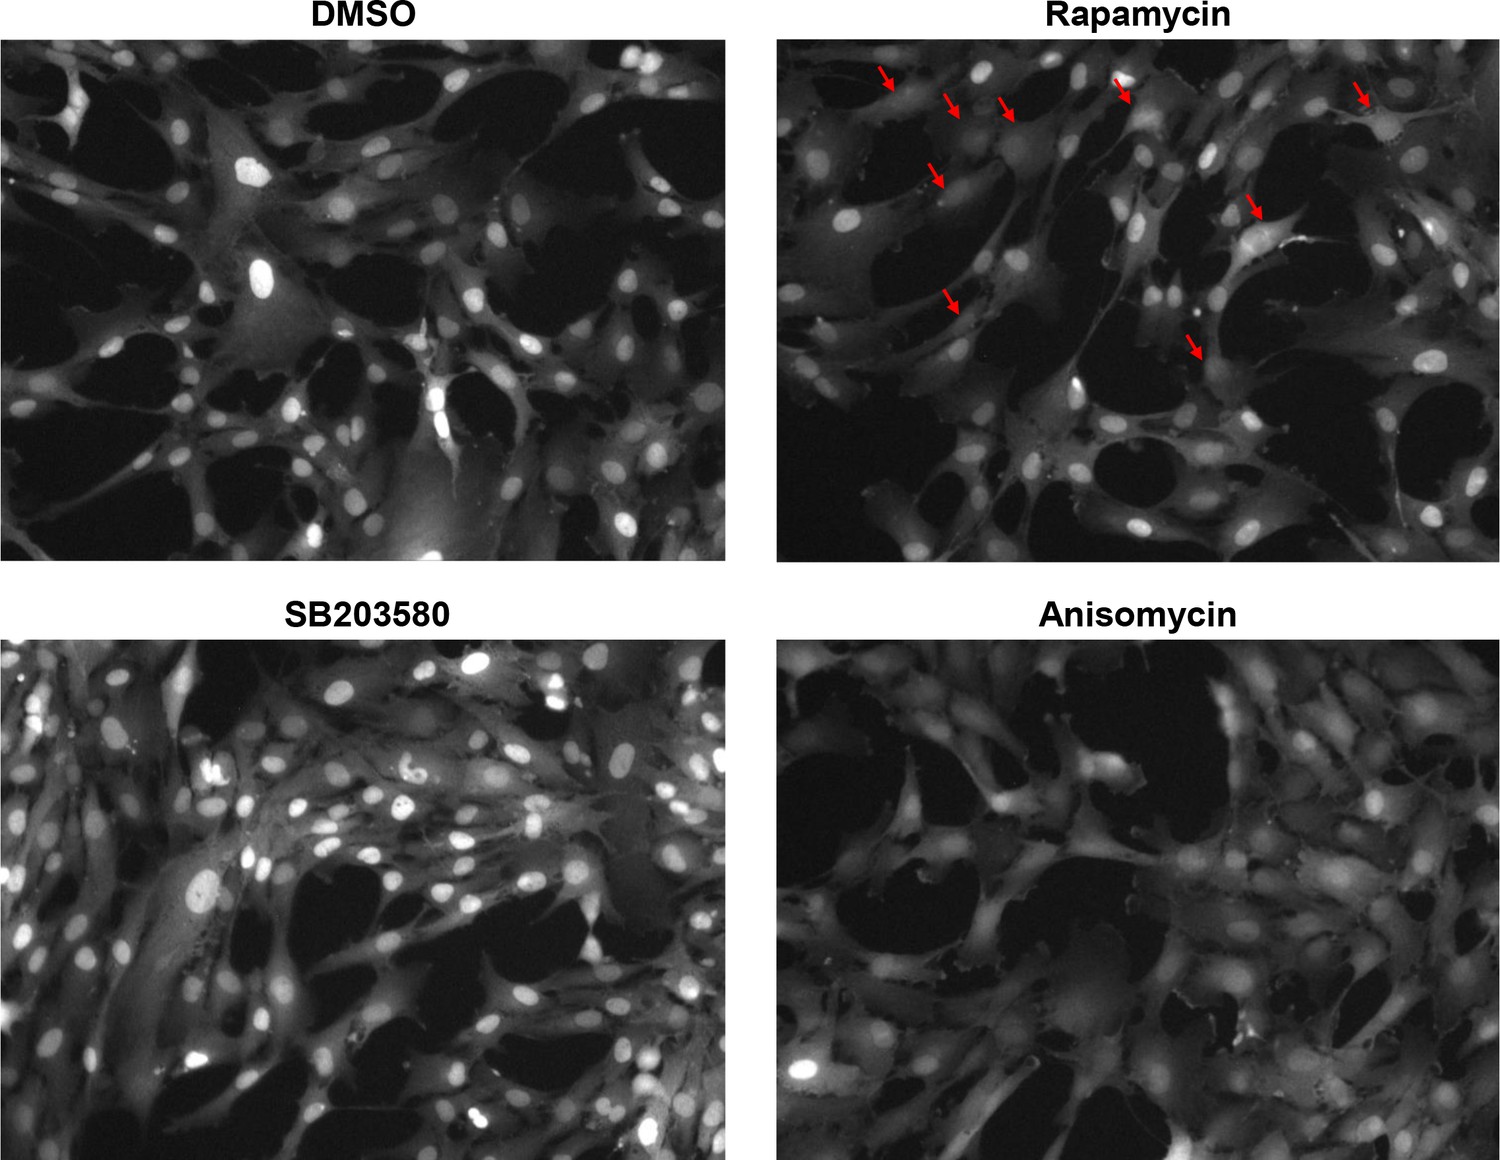
Representative images showing response of the p38 KTR to indicated treatments.
The p38 KTR functions by translocating to the cytoplasm once p38 is activated. Cells were imaged after a 1 day treatment with DMSO (control), 3 nM rapamycin or 5 μM SB203580 (p38 inhibitor), or a 30 min treatment with 25 ng/mL Anisomycin (a stimulator of the p38 pathway). Anisomycin treatment results in reduced fluorescence in the nucleus, and a less defined nuclear boundary as compared to control. By contrast, treatment with SB203580 results in elevated fluorescence in the nucleus, implying a lower p38 activity. Cells subject to rapamycin treatment are smaller in size as compared to control. While these cells display a spectrum of cytoplasmic-to-nuclear localization, rapamycin treatment increases the fraction of cells that display p38 activity, as indicated by the blurry nuclear boundary and increased cytoplasmic localization of the KTR (highlighted by arrows).
Figure 5—figure supplement 3
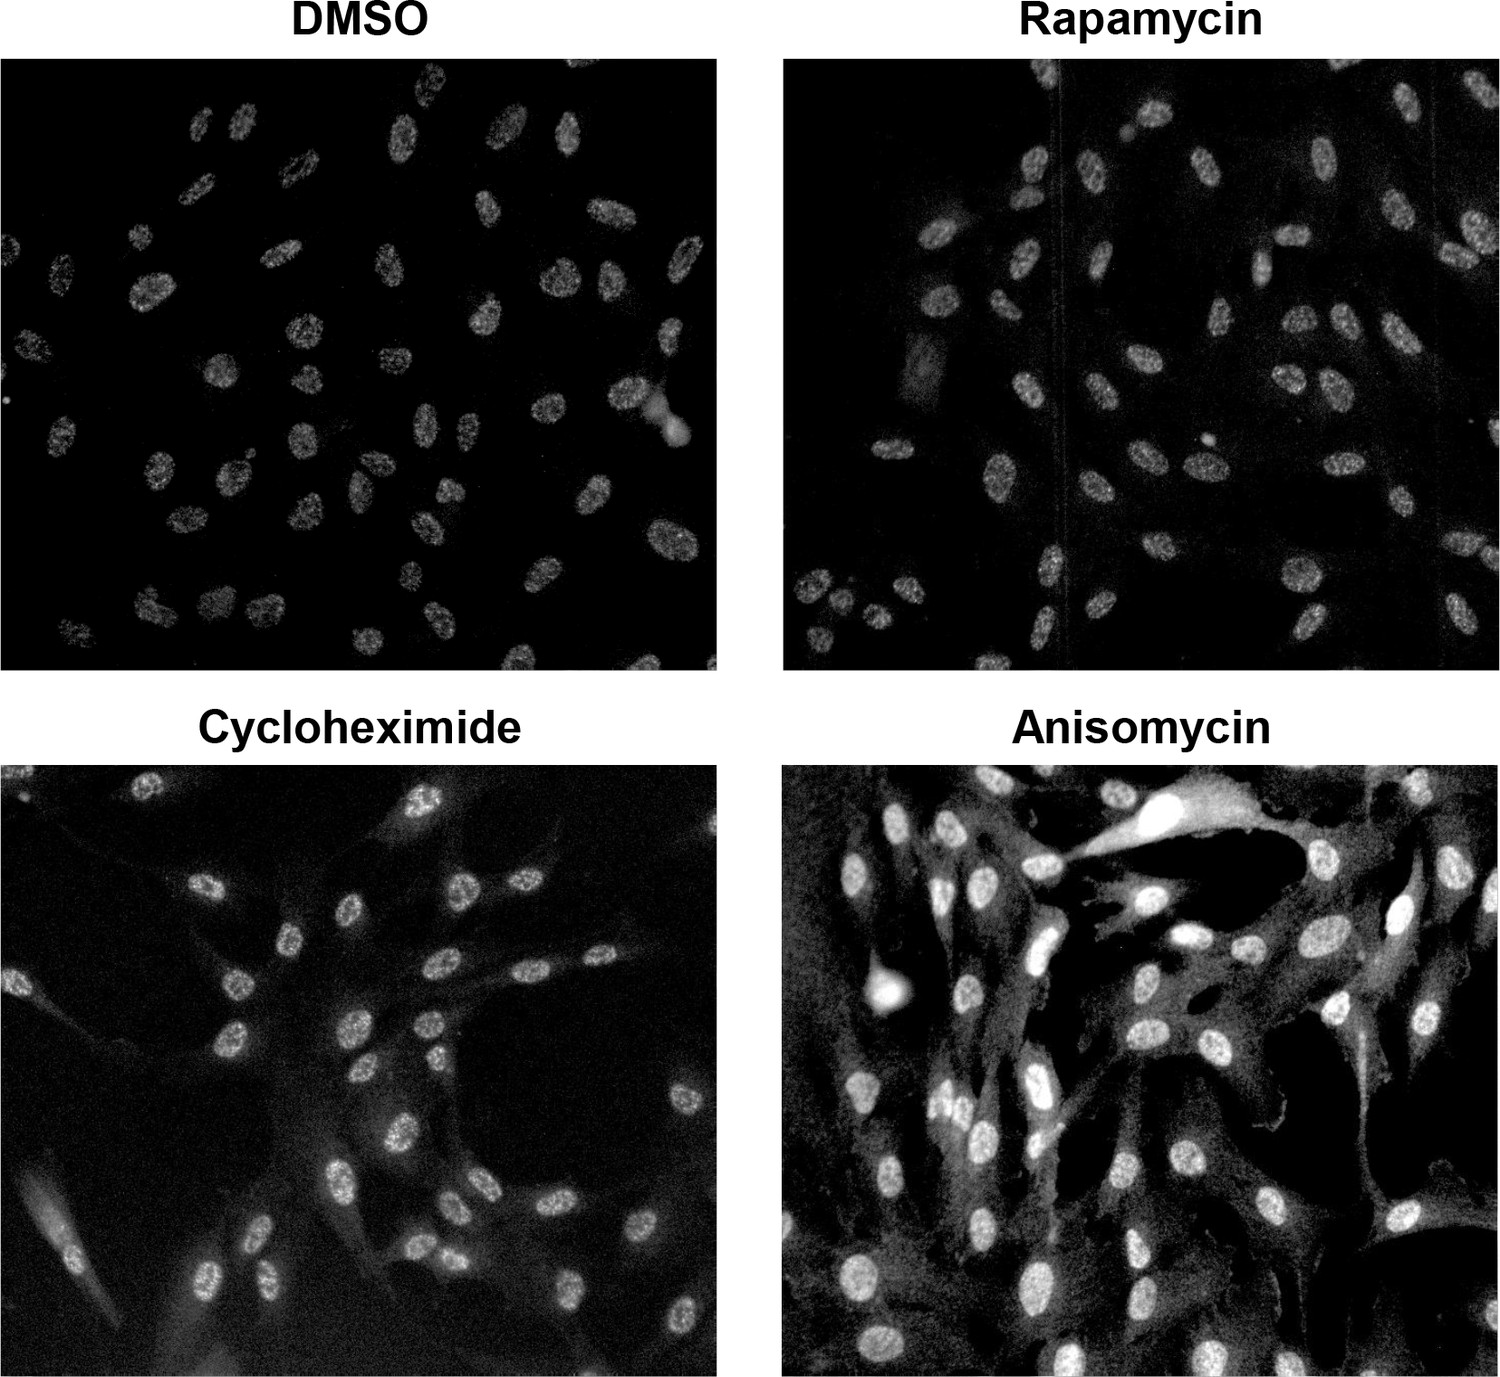
Immunofluorescence images of cells stained with a phospho-p38 antibody after indicated treatments.
Cells treated with either DMSO (control), 30 nM rapamycin or 1 μM cycloheximide for 1 day, or with 25 ng/mL Anisomycin (a stimulator of the p38 pathway) for 30 min were fixed and imaged. While Anisomycin treatment leads to hyperactivation of the p38 pathway, rapamycin or cycloheximide treatment result in a weak but visible elevation in p-p38 level in the nucleus (also see Figure 5D).
Figure 5—figure supplement 4
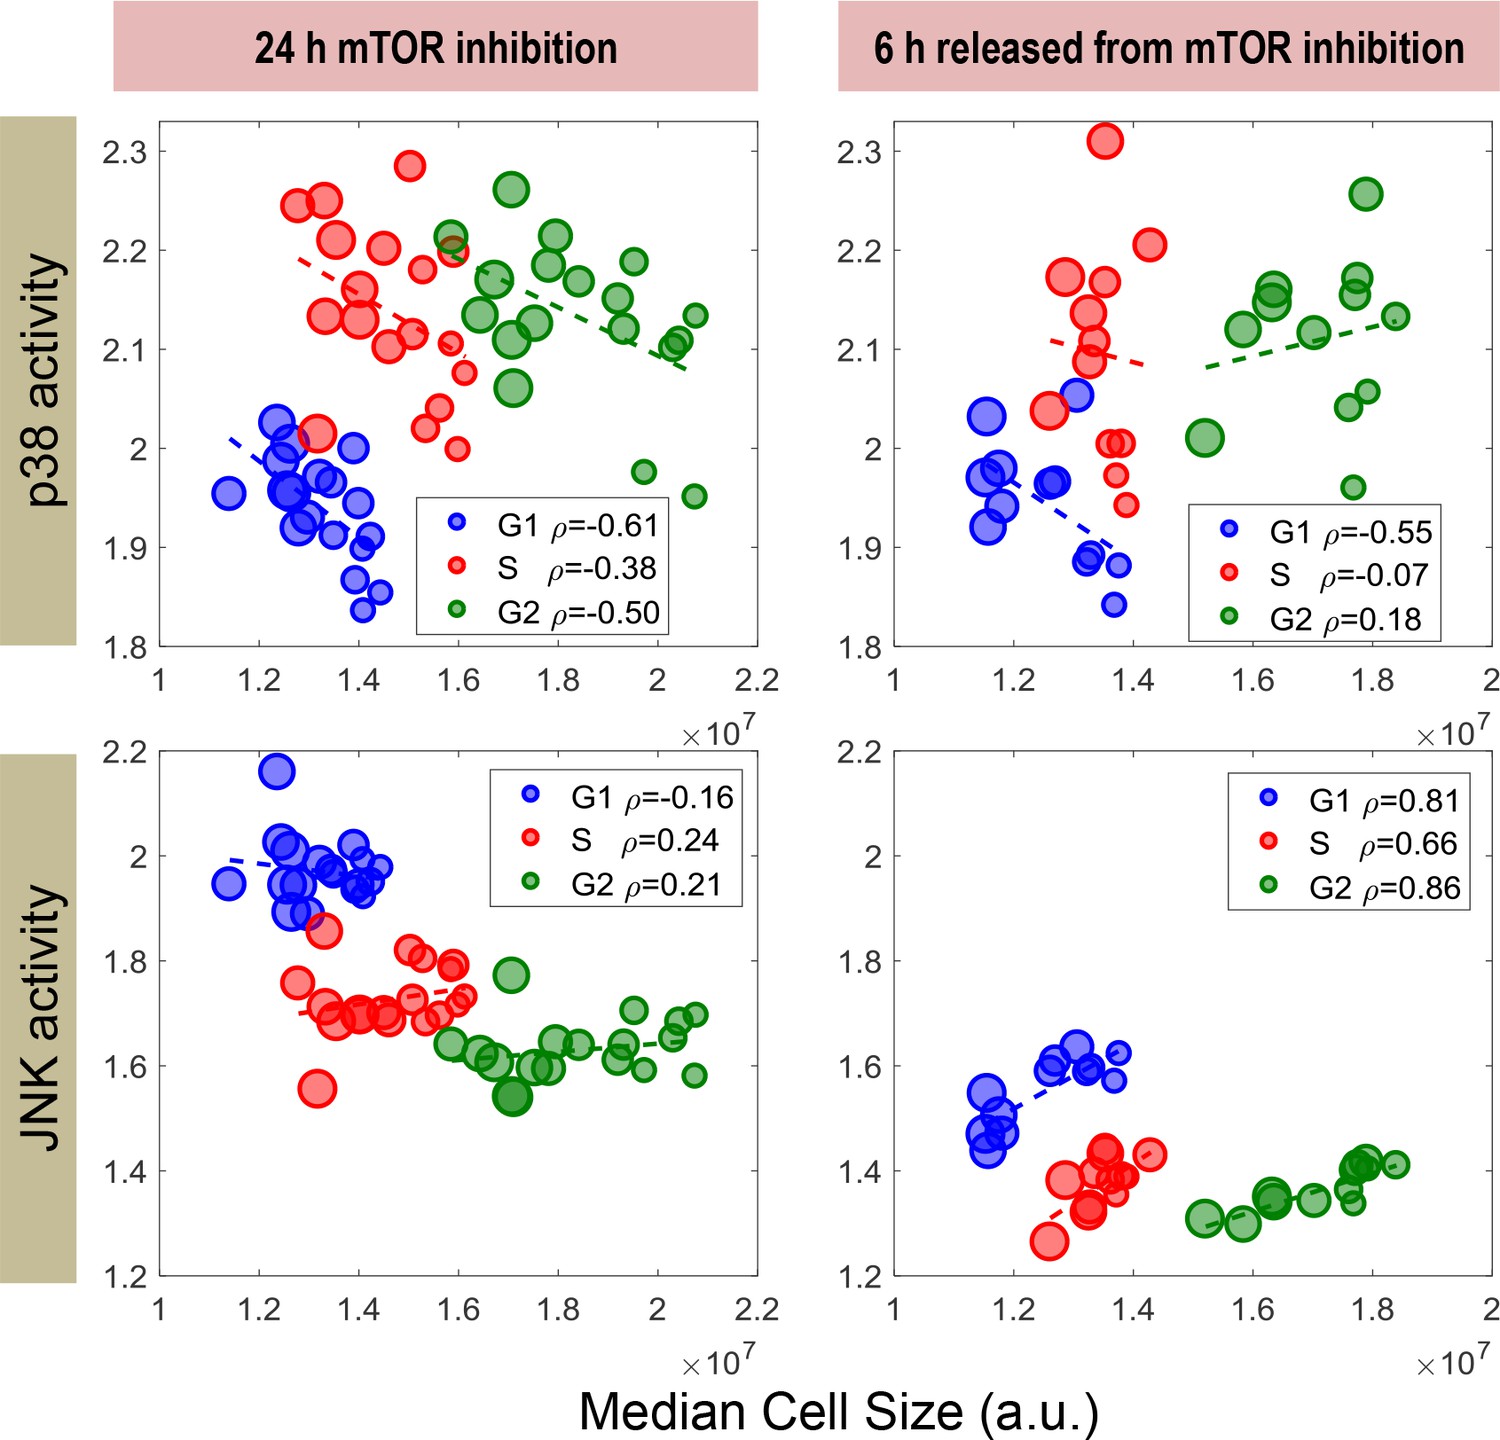
p38 activity negatively correlates with cell size in G1 but not S or G2 cells.
Measurements were obtained from the same experiment as indicated in Figure 5C. Cells express dual reporters of both p38 MAPK and JNK were treated with a concentration series of rapamycin, decreasing cell size to varying extents. For each condition/replicate, cells were partitioned into G1, S and G2 stage according to the cellular DNA readout (see Materials and methods – Cell cycle stages). The activity of p38 MAPK negatively correlates with cell size after mTOR inhibition for cells that are in G1. Cells that are in S and G2 also display a negative correlation, but with a lower correlation coefficient. Interestingly, after cells are released from mTOR inhibition, p38 activity negatively correlates with cell size only among cells that are in G1, but not S or G2. This result supports the hypothesis that cell-size-dependent regulation of p38 activity is exclusive to the G1 phase of cell cycle, which is consistent with its assumed role in regulating G1 duration. The meta data and source code used to analyze and visualize the correlation between cell size and KTR readout among different cell cycle stages is presented in Figure 5—source data 1.
Figure 5—figure supplement 5

Average cell size measured by Coulter counter after the cells were released from the indicated compound treatment.
The measurements were collected in parallel with the experiments as shown in Figure 5D. Cells were treated with either 50 nM Torin-2 or 1 μM Cycloheximide for a period of 22 hr, after which the cells were released from the treatment to let it recover in size. Time 0 indicates the time of wash-out. Results were pooled from duplicate experiments, and fitted individually (indicated with the solid line).
Figure 6 with 1 supplement
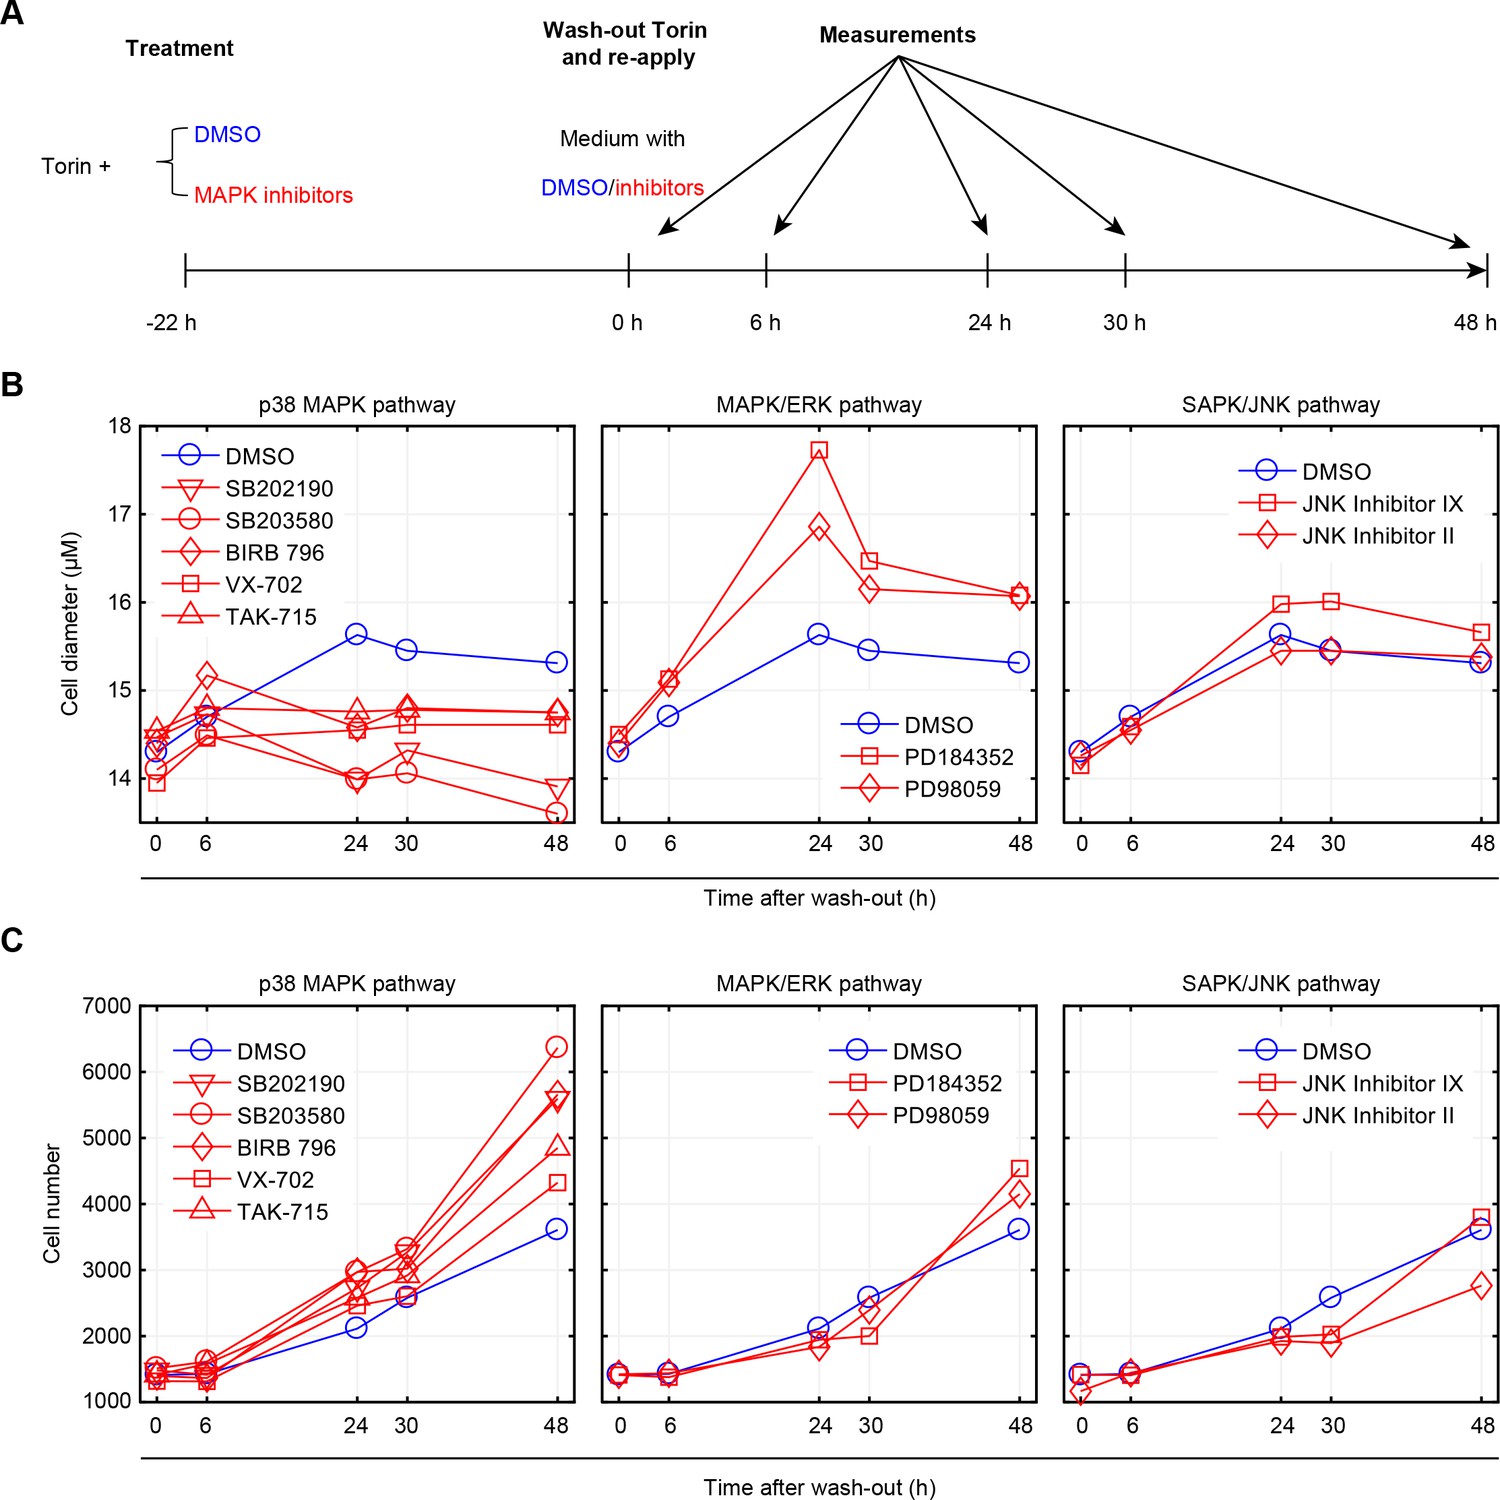
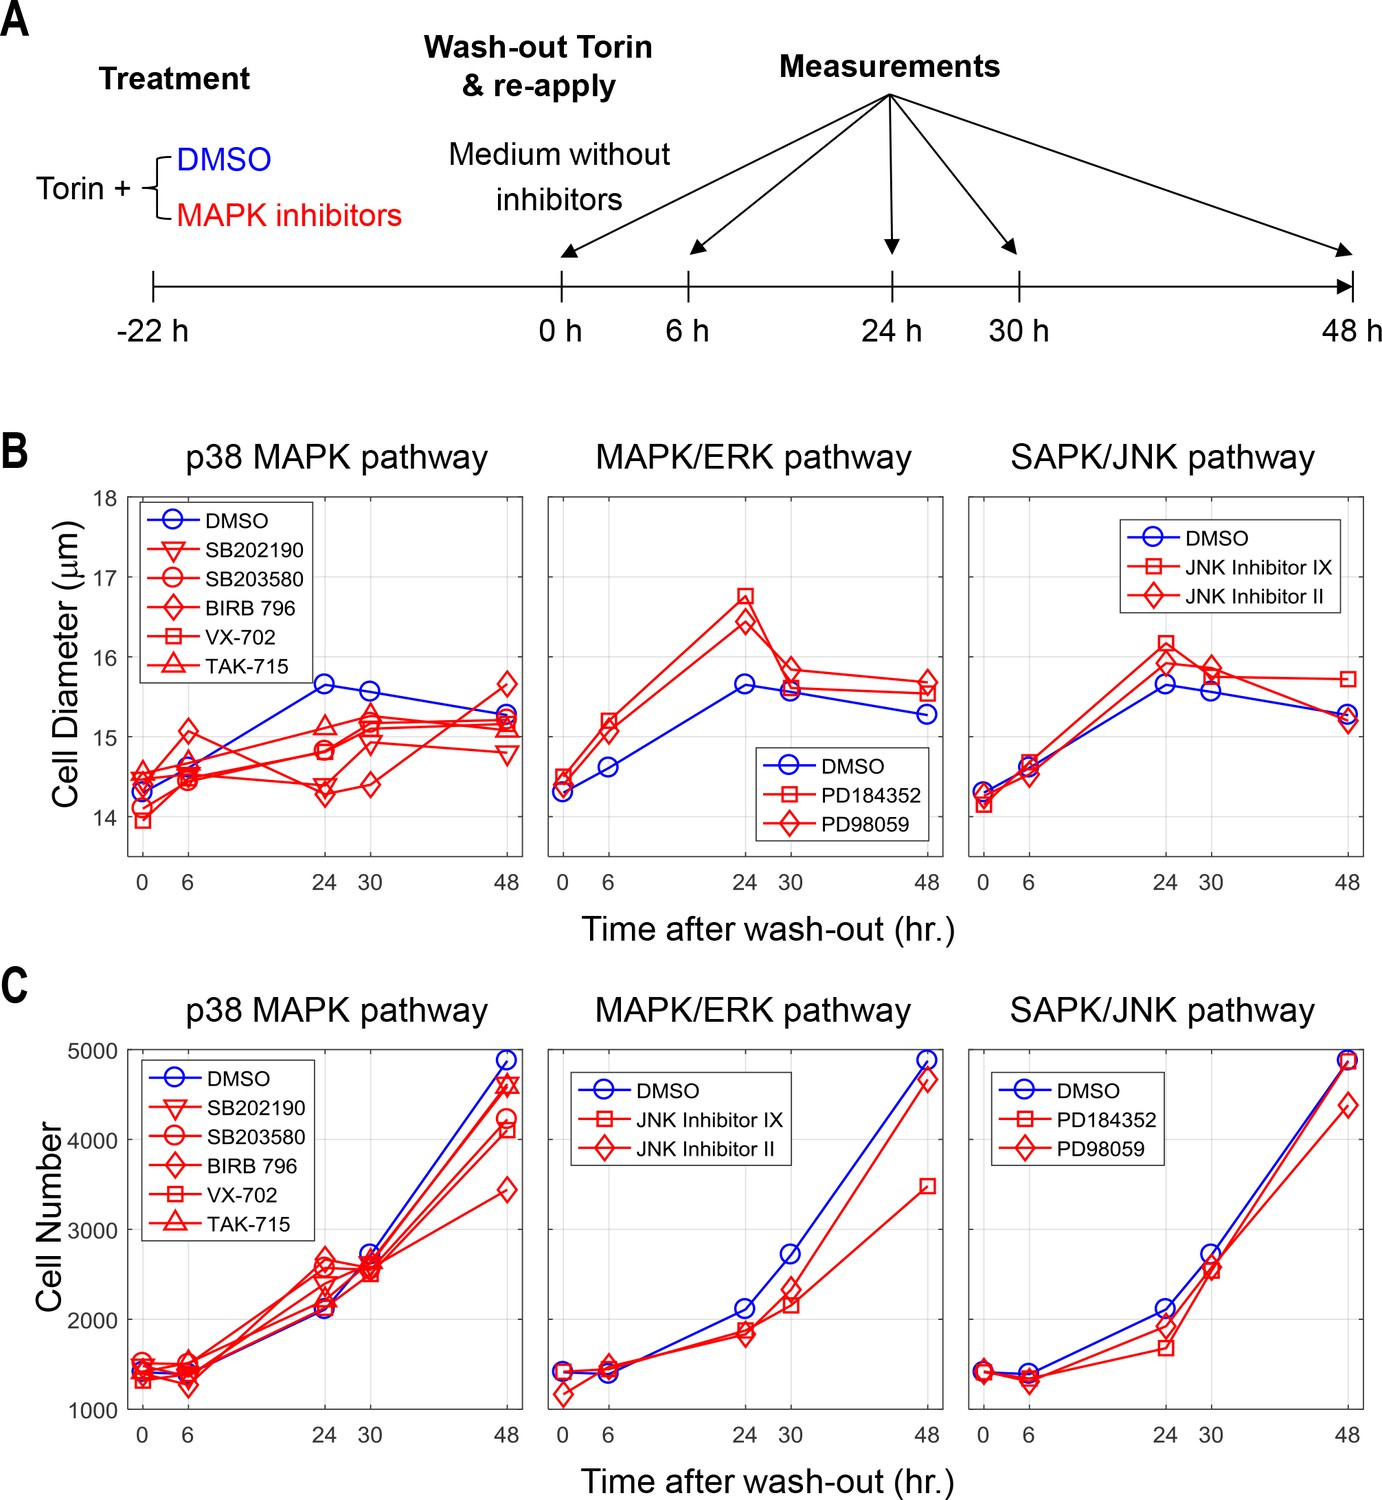
Inhibition of p38, but not ERK or JNK, represses recovery of size in cells released from mTOR inhibition.
(A) Workflow of the experiment. Cells were treated with 50 nM Torin-2 with or without the indicated MAPK inhibitors for 22 hr, and then released from Torin-2 while still being subject to the indicated MAPK inhibitors (red) or DMSO (blue). MAPK inhibitors were administrated at a concentration consistent with the highest corresponding concentration used in Figure 2 and Figure 2—figure supplement 2. At 0, 6, 24, 30 and 48 hr post release from Torin-2 treatment, samples were measured for both average cell size (B) and cell count (C). (B) Cells treated with DMSO (control) recovered in size within 24 hr and remained at a constant average size thereafter. Cells treated with p38 inhibitors, but not ERK or JNK inhibitors, failed to recover their size, even 48 hr post Torin-2 wash-out. This suggests that p38 inhibitors suppressed the recovery in cell size rather than slowing the kinetics associated with this process. (C) Cells treated with inhibitors of p38, but not inhibitors of ERK or JNK, show increased rates of proliferation as compared to control conditions, after being released from mTOR inhibition. Results shown in this figure are representative of two replicate experiments. The measurements and source code for visualization of the results is presented in Figure 6—source data 1.
-
Figure 6—source data 1
Cell size dynamics after released from mTOR inhibition.
- https://doi.org/10.7554/eLife.26947.038
Figure 6—figure supplement 1
Recovery in cell size is delayed even after the p38 inhibitor was wash-out.
(A) Workflow of the experiment. Similarly as indicated in Figure 6, Cells were co-treated with both Torin-2 (50 nM) with or without the indicated MAPK inhibitor for 22 hr. The cells were then released from both inhibitors and grown in regular medium. At 0, 6, 24, 30, and 48 hr post release from the inhibitors, the cells were measured for both cell size (B) and cell number (C) by Coulter counter. (B) Cells in ‘DMSO’ condition recovered in size within 24 hr and stays at this size. Cells with a history of p38 inhibition, but not Erk or JNK inhibition, displayed a delayed size-recovery dynamics. (C) Cell proliferation were followed after release from the inhibitors. The results shown in this figure are representative of two replicate experiments. The measurements and source code used to visualize the results shown in this figure is presented in Figure 6—source data 1.
Additional files
-
Transparent reporting form
- https://doi.org/10.7554/eLife.26947.039
Download links
A two-part list of links to download the article, or parts of the article, in various formats.
Downloads (link to download the article as PDF)
Open citations (links to open the citations from this article in various online reference manager services)
Cite this article (links to download the citations from this article in formats compatible with various reference manager tools)
Size uniformity of animal cells is actively maintained by a p38 MAPK-dependent regulation of G1-length
eLife 7:e26947.
https://doi.org/10.7554/eLife.26947


